Impact Factor ISSN: 1837-9664

 Global reach, higher impact
J Cancer 2026; 17(2):338-358. doi:10.7150/jca.119265 This issue Cite
Research Paper
Identification of super-enhancer-based biomarkers for predicting survival and immunotherapy efficacy in colorectal cancer
Yanan Yu1#, Xiuxiu Zhang2#, Xiaolin Ma1#, Jiao Ren1, Jinglei Zhang1, Luoyu Zhu1, Yanfang Chen3 ![]() , Zhong Lu1
, Zhong Lu1 ![]() , Jiaqiu Li1
, Jiaqiu Li1 ![]()
1. Department of Oncology, Affiliated Hospital of Shandong Second Medical University, School of Clinical Medicine, Shandong Second Medical University, Weifang 261053, Shandong, China.
2. Department of Medical Oncology, Rizhao central hospital, Rizhao 276801, Shandong, China.
3. Department of Radiotherapy, Affiliated Hospital of Shandong Second Medical University, Shandong Second Medical University, Weifang 261053, Shandong, China.
#Yanan Yu, Xiuxiu Zhang and Xiaolin Ma contributed equally to this work.
Received 2025-6-10; Accepted 2025-12-17; Published 2026-1-1
Abstract

Immune checkpoint inhibitors are effective treatments for many tumors. However, existing biomarkers can benefit only a small selection of colorectal cancer patients. Super-enhancers are associated with various tumor characteristics. We wondered whether super-enhancer-related genes could be novel biomarkers for immunotherapy. We screened super-enhancer-related genes that were highly correlated with immune infiltration through weighted gene co-expression network analysis on the basis of chromatin immunoprecipitation sequencing data. A prognostic risk signature was established using least absolute shrinkage and selection operator and cox regression models. By analyzing the correlations between the expression of model genes and the immunophenotypic and microsatellite instability scores, we determined that PLAU and GSDMC expression had high predictive value for immunotherapy efficacy. Moreover, we predicted the sensitivity of the PLAU and GSDMC proteins to drugs by virtual docking. Finally, we validated the effect of the super-enhancer activity on PLAU and GSDMC expression. Overall, our study identified super-enhancer-based biomarkers for predicting survival and immunotherapy efficacy in colorectal cancer.
Keywords: colorectal cancer, super-enhancer, tumor immunity, immune checkpoint inhibitors, biomarkers, bioinformatics
Introduction
According to the report from the American Cancer Society in 2023 [1], colorectal cancer (CRC) is the third most common cancer in the world in terms of incidence and mortality. Despite the popularization and development of radiotherapy, chemotherapy, and surgery for cancer treatment [2-4], CRC continues to have a high mortality around the world, and that rate is only increasing. A poor prognosis is the principal cause of the high mortality of CRC [5]. The development of immunotherapy has provided a new option for the treatment of CRC [6], and immunotherapy alone or in combination with traditional therapy has become a cornerstone of CRC treatment in clinical practice [7, 8]. The tumor microenvironment (TME) is composed of stromal cells, immune cells, vascular endothelium, and intravascular blood cells [9]. Among them, immune cells play dual roles in antitumor activity and tumor immune escape [10, 11]. Immunotherapy achieves the therapeutic effect of controlling or eliminating tumors by externally interfering with the body's immune system to restart the "tumor-immunity" cycle of recognizing and killing tumor cells [12]. Immunotherapy is superior to traditional treatments because of its high specificity and less side effects [13, 14].
Currently, inhibitors targeting immune checkpoint proteins such as PD-1, PD-L1, and CTLA-4 have been broadly applied in clinical practice [12, 15]. However, considering some specific side effects, such as peripheral neuropathy, headache [16] and hearing loss [17], caused by immune checkpoint inhibitors (ICIs), it needs to exactly select the patients suitable for ICIs. Some biomarkers have been identified and are considered predictive factors for CRC immunotherapy response, such as the immunophenotype score (IPS) [18], microsatellite instability (MSI) [19], and tumor mutation burden (TMB) [20, 21], but the currently known biomarkers can only recommend immunotherapy to be administered to a small percentage of patients, and the efficacy of immunotherapy on these biomarker-indicated patients is also not reliable. Identifying specific biomarkers is the way forward for tumor immunotherapy, allowing it to benefit more patients [22]. In recent years, new biomarkers for predicting the response of tumors treated with ICIs have been widely studied. For example, studies have shown that the Royal Marsden Hospital (RMH) score is an independent biomarker for predicting PFS in NSCLC patients receiving ICI treatment [23].
A super-enhancer (SE) is a large cluster of multiple adjacent common enhancers. Super-enhancers drive the regulation of cell fate-related gene expression. Specific histone modifications, particularly histone 3 lysine 27 acetylation (H3K27ac), are essential for super-enhancer activity [24]. As powerful transcription regulators, super-enhancers play crucial roles in the accumulation of many major transcription factors and other cofactors [25, 26]. Bromodomain and outer end (BET) proteins, such as BRD4, recognize and bind to histone acetylated lysine residues in the super-enhancer region to facilitate gene transcription [27]. Studies have shown that immune evasion in CRC is also regulated by super-enhancers [28]. Thus, we wondered whether these genes regulated by super-enhancers could serve as new biomarkers for predicting the efficacy of immunotherapy. Inhibitors or drugs that target these genes may yield improved outcomes in immunotherapy. Given the important roles of super-enhancers in cancer, this study aimed to identify new super-enhancer-related biomarkers that can predict the immunotherapy efficacy and outcomes of patients with colorectal cancer.
Materials and Methods
Screening super-enhancer-related genes on the basis of H3K27ac ChIP-seq data
The ChIP-seq data have been deposited in the Gene Expression Omnibus (GEO) under accession number GSE198223. The sequencing data were aligned to the human HG19 genome using BOWTIE V2.1.0 software. The data were transferred for peak calling by MACS V1.4.2 software. Statistically significant ChIP-enriched peaks were identified by comparison of the IP data with the input data. An enrichment region was regarded as a region containing constituent enhancer lines and was used to calculate the identity signal. The ROSE tool was used to generate a stitched enhancer by combining the enhancers within a range of 12.5 kb. All stitched enhancers were ranked by the signal of the IP group after subtracting the input group, and super-enhancers were identified based off of a specific threshold for the stitched enhancer signal. The super-enhancers were annotated by the correlated coding genes using the newest Arraystar UCSC database and other UCSC RefSeq databases.
Weighted gene co-expression network analysis (WGCNA)
First, we utilized the R package "ESTIMATE" to calculate the immune score, stromal score, estimated score, and tumor purity for the samples in the TCGA-COAD (colon cancer) cohort [29]. After conducting WGCNA to cluster the samples, we set the cutHeight to 4000 based on the degree of sample dispersion and used the 'cutreeStatic' function to remove 10 samples with a height above 4000 for data cleaning. In the end, we included a total of 455 patients with COAD in this study. We used a topological overlap matrix to determine the appropriate soft threshold parameter to use (β=5). Next, we used dynamic hybridization cleavage to identify co-expressed gene modules. Hierarchical clustering trees were created using dynamic hybrid cutting, where genes with similar functions or expression data form a branch, which in turn forms a gene module. Finally, we calculated the Pearson correlation between modular signature genes (MEs) and the immune infiltration score, as well as tumor purity. A significant correlation was considered when adjust P < 0.05. Using normalized TCGA-COAD expression profile data and the CIBERSORT algorithm, an LM22 gene matrix file containing 22 immune cell subtypes was used to calculate the proportions of 22 immune cell types. The composition of the immune cells was visualized using a box plot.
Dataset and sample extraction
We acquired RNA sequencing expression data, genomic mutation data and associated clinical data for COAD patients from the TCGA database. The count data were analyzed using the R package "DESeq2", and the differential genes were selected on the basis of a |log2fold change|≥1 and adjust P < 0.05. Normalized FPKM data were used to generate heatmaps of differentially expressed genes using the R package "pheatmap". The volcano plot was visualized using the packages "ggpubr" and "ggthemes".
Prognostic analysis
Using the TIDE database [30] for prognostic analysis of the GEO CRC datasets, we analyzed the correlation between gene expression and overall survival (OS) and disease-free survival (DFS) with a cutoff p-values of 0.05. The “Query gene” module in the TIDE database was used to analyze the 9 immune infiltration-related differentially expressed genes. We obtained their prognostic value in multiple CRC datasets in the “Expression” section. The optimal critical value was calculated via the "surviviner" software package, and the survival curves of the six target genes were validated through TPM data in the TCGA-COAD queue.
Construction of the prognostic risk model
On the basis of 404 samples with clinical information from the TCGA-COAD cohort, the LASSO-Cox model (R package "glmnet") identified 6 risk genes related to immune infiltration in the training group. The risk score based on this model was subsequently calculated. The R package "survminer" was used to determine the optimal cutoff point for the high- and low-risk groups. Next, we performed survival analysis and plotted Kaplan‒Meier (K‒M) curves with the "survival" and "survminer" packages. Finally, using the 'time-ROC' package, we plotted ROC curves to calculate the 1-, 3-, and 5-year survival rates of patients. The prognostic model was subsequently validated with a validation set.
Immunotherapy efficacy prediction
In 2017, Charoentong et al. [31] reported that the IPS could predict the response to immune checkpoint inhibitors. Therefore, we downloaded the IPS of TCGA-COAD patients from the TCIA database, tested the relationship between gene expression levels and the IPS with the Wilcoxon rank sum test, and visualized it using the "ggpubr" package. In addition, previous research has shown that patients with MSI-H tumors have a better response to ICIs [20, 32]. Consequently, using the TCGA module in the integrated bioinformatics analysis platform ACLBI, we analyzed the correlation between single gene expression and the MSI score in COAD to estimate the predictive effect of single gene expression on the efficacy of ICIs. The "Biomarker Evaluation" module in the TIDE database was used to compare the target gene with other biomarkers. The predictive performance of biomarkers for the treatment effect of different cohorts of ICIs was expressed by the AUC. The larger the AUC was, the better the predictive effect. We subsequently analyzed the correlation between target gene expression and cytotoxic T cell (CTL) function by the 'Query Gene' module. The relationships between the expression levels of PLAU and GSDMC in melanoma and the outcomes of patients receiving immunotherapy were validated through the 'immunotherapy' module in the Kaplan‒Meier plotter database.
Correlation between gene expression and the tumor microenvironment
Sangerbox 3.0 was used to analyze the relationship between gene expression and the tumor microenvironment. First, we analyzed the data via immunoinfiltration analysis in the "Pan-cancer analysis" module. The data were obtained from "TCGA+GTEx" and subjected to log (x+0.001) transformation. In the immune cell analysis (TIMER) module, we subsequently assessed the Spearman rank correlation between gene expression and immune cells in the tumor microenvironment. Finally, we assessed the relationships between gene expression and immune checkpoint genes through the ACLBI website.
Drug sensitivity analysis and molecular docking
We downloaded the IC50s (half-maximal inhibitory concentrations) of the drugs and gene expression levels of colorectal cancer cell lines from the GDSC2 and CTRPv2 databases. The correlation of PLAU and GSDMC expression with the drug IC50 was calculated using R software, and scatter plots were generated. The 3D structures of the proteins were obtained from the Protein Data Bank (PDB) database. The structures of the small molecule drugs were downloaded from the PubChem database. The binding sites of the proteins were identified by the GHECOM algorithm. AutoDock Tools was used for the molecular docking of proteins to small molecule drugs. Then, we visualized the docking results via PyMOL software. Finally, Ligplus software was used to determine the two-dimensional structure of protein amino acid residues that interact with small-molecule drugs.
Cell culture
The human colon cancer cell lines HCT116 and DLD1 were used for this study. The cells were obtained from the Cell Bank of the Chinese Academy of Sciences. HCT116 and DLD1 cells were cultured at 37 °C in a 5% CO2 incubator in McCoy's 5A medium or RPMI 1640 medium supplemented with 10% fetal bovine serum. The cells were tested for mycoplasma contamination every two months.
Quantitative real-time PCR (qRT‒PCR)
The cells in the 6-well plate were treated with the BRD4 inhibitors-JQ1 and I-BET-762 for 24 hours, after which the RNA was extracted from the cells via TRIzol. The qPCR detection method was the same as previously reported [33]. β-actin was used as the endogenous control for normalization. The sequences of the primers used are as follows:
PLAU-F: CAGATTCCTGCCAGGGAGAC, R: GCCAGGCCATTCTCTTCCTT; GSDMC-F: AGGTCATTTGGATGGCCCTG, R: CCAGGATGCTCCTTACCAGC; β-actin-F: CACCAACTGGGACGACAT, R: ACAGCCTGGATAGCAACG.
Chromatin immunoprecipitation-qPCR
ChIP assays were conducted as reported in previous studies [34] with the anti-H3K27ac (Abcam, ab177178, Cambridge, UK), anti-P300 (Abcam, ab275378, Cambridge, UK) and anti-BRD4 (Bethyl Laboratories, A301-985A100, Montgomery, TX, USA) antibodies. The primer sequences for the PLAU and GSDMC super-enhancer regions are shown below:
PLAU-E1-F: GCAAGGCACCCTCGTACTTT, PLAU-E1-R: GCAAGTTCACGCTTAGACAGC; PLAU-E2-F: AGACTCACCCTGTGCCTACA, PLAU-E2-R: CCCGGAGGCAACCCAATAAT; PLAU-E3-F: TGTTGAAGAGTCCGTCTGCC, PLAU-E3-R: TTGTCTGTGTCCCTGTGTGG; PLAU-Promoter-F: GGTGTCACGCTTCATAACGG, PLAU-Promoter-R: GGCTGTCATGCTGATTGCTG; GSDMC-E1-F: ACCTCCTGCGGTCAAGTAGA, GSDMC-E1-R: AGTCAGGGACCCATTGGTGA.
H3K27ac ChIP-seq tracking
We downloaded H3K27ac ChIP-seq data for cell lines from the ENCODE database [35]. The WashU Epigenome Browser was used to visualize the H3K27ac tracks.
Electrophoretic mobility shift assay (EMSA) and super-shift EMSA
First, we extracted the nuclear proteins from HCT116 cells via the Nuclear and Cytoplasmic Protein Extraction Kit (Beyotime, P0028) according to the protocol described in the user guide. After BCA quantification, the final concentration of protein was adjusted to 1 µg/µl. The proteins were subsequently mixed with the probes and incubated at room temperature for 30 minutes. Two microliters of sample mixture mixed with 4 µl of loading dye (6×) was loaded into each gel lane. The gel was run in 0.5×TBE buffer at 150 V for 60 min and transferred to a nylon membrane at 300 mA for 30 min. Then, the membrane was crosslinked for 20 min with an ultraviolet lamp and sealed for 20 min. The membrane was incubated with diluted antibodies for 30 min at room temperature. Finally, after the membrane was eluted and dried, graphs were obtained using a chemiluminescence apparatus. The probes were synthesized by Servicebio (Wuhan, China). The probe sequences are listed below:
E1: F: 5'-Biotin-GCAAGGCACCCTCGTACTTT-3', R: 5'-Biotin-AAAGTACGAGGGTGCCTTGC-3'; E1: Cold probe F: 5'-GCAAGGCACCCTCGTACTTT-3', R: 5'-AAAGTACGAGGGTGCCTTGC-3'; E1: Mutant probe F: 5'-GCAATACAGACTCCTAGCAG-3', R: 5'-CTGCTAGGAGTCTGTATTGC-3'; E2: F: 5'-Biotin-AGACTCACCCTGTGCCTACA-3', R: 5'-Biotin-TGTAGGCACAGGGTGAGTCT-3'; E2: Cold probe F: 5'-AGACTCACCCTGTGCCTACA-3', R: 5'-TGTAGGCACAGGGTGAGTCT-3'; E2: Mutant probe F: 5'-AGACGAACCTTCCGCCTATT-3', R: 5'-AATAGGCGGAAGGTTCGTCT-3'; E3: F: 5'-Biotin-TGTTGAAGAGTCCGTCTGCC-3', R: 5'-Biotin-GGCAGACGGACTCTTCAACA-3'; E3: Cold probe F: 5'-TGTTGAAGAGTCCGTCTGCC-3', R: 5'-GGCAGACGGACTCTTCAACA-3'; E3: Mutant probe F: 5'-TGTGGAATACTTCGTCTGCC-3', R: 5'-GGCAGACGAAGTATTCCACA-3'.
Tissue samples collection and analysis
This research was approved by The Institute of Research Medical Ethics Committee of the Affiliated Hospital of Shandong Second Medical University. Colorectal cancer tissues and paired normal tissues from eighteen patients were collected from the Affiliated Hospital of Shandong Second Medical University. All patients signed the informed consent forms. The RNA extraction and qPCR detection method is the same as above.
Statistical analysis
Statistical significance was assessed with a two-sided Student's t test via GraphPad Prism 7 software. The results are expressed as the means ± standard deviations. If the results did not have the same standard deviation, a t test with Welch's correction was used. In addition, statistical tests were performed using R software version 4.2.2, and p-values less than 0.05 were considered to indicate statistically significant differences.
Results
Screening super-enhancer-related genes correlated with immune infiltration through WGCNA
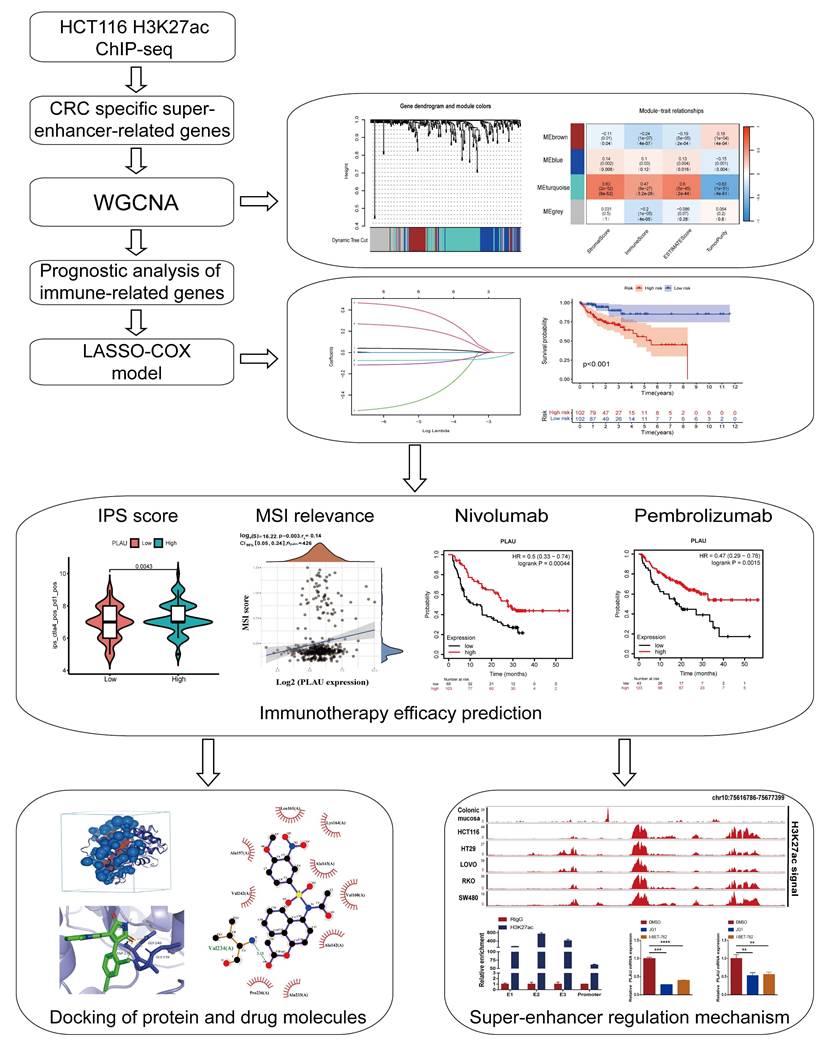
A schematic flow chart diagram of this study is shown in Fig. 1. In our latest study [36], we obtained 383 super-enhancer-related mRNAs via ChIP-seq with the anti-H3K27ac antibody in HCT116 cells (GSE198223). To further identify colorectal cancer-specific super-enhancers, we downloaded and analyzed the H3K27ac signal of these 383 genes in normal colonic mucosa by the ChIP-seq data from the ENCODE database. We compared their H3K27ac signal in the HCT116 cell and normal colonic mucosa. If their H3K27ac signal in the HCT116 cell was higher than that in normal colonic mucosa, we regard them as specific super-enhancers in the HCT116 cell line. Ultimately, we identified 239 CRC-specific super-enhancer-related genes. To assess the correlation between these genes and the tumor immune microenvironment, we conducted calculations for the immune score, stromal score, estimate score, and tumor purity using the TCGA-COAD datasets. A total of 455 COAD patients were selected from the TCGA database for weighted gene co-expression network analysis (WGCNA). The scale-free fit indices at different soft thresholds (powers) are shown in Fig. 2A. We determined β = 5 to be the optimal power value. Moreover, we performed a sample clustering analysis (Fig. 2B). After the samples were clustered, the adjacent matrix was transformed to create a TOM matrix, and the function tree generated by hierarchical clustering was examined for modules. The dynamic tree cutting method was used to merge modules with values greater than 0.75, resulting in a module clustering tree plot (Fig. 2C) and the construction of mRNA co-expression networks (Fig. 2D). We performed a correlation analysis of the modules and trait groupings generated by the clustering. We created a heatmap of the modules and trait data, as shown in Fig. 2E. The correlations and adjust p-values between each module and trait are presented in the heatmap. Among them, the turquoise module has the highest correlation.
Workflow of identification of CRC specific super-enhancer-related genes for immunotherapy efficacy prediction. CRC, colorectal cancer; WGCNA, weighted gene co-expression network analysis; LASSO, least absolute shrinkage and selection operator; IPS, immunophenotypic score; MSI, microsatellite instability.
Screening super-enhancer-related genes correlated with immune infiltration through weighted gene co-expression network analysis (WGCNA). A Scale indpendence and Mean connectivity for Multiple Soft Thresholds. B Sample Clustering Tree. C Clusters and merging of gene co-expression modules. D Heatmap of gene co-expression networks. E Correlation and p-values of immune infiltration and tumor purity with co-expression modules. F Determine the proportion of various immune cells through the Cibersort algorithm. G Heatmap of the association between gene expression and the turquoise module. H Scatter-plots of the correlation between the turquoise module and the immune infiltration scores.
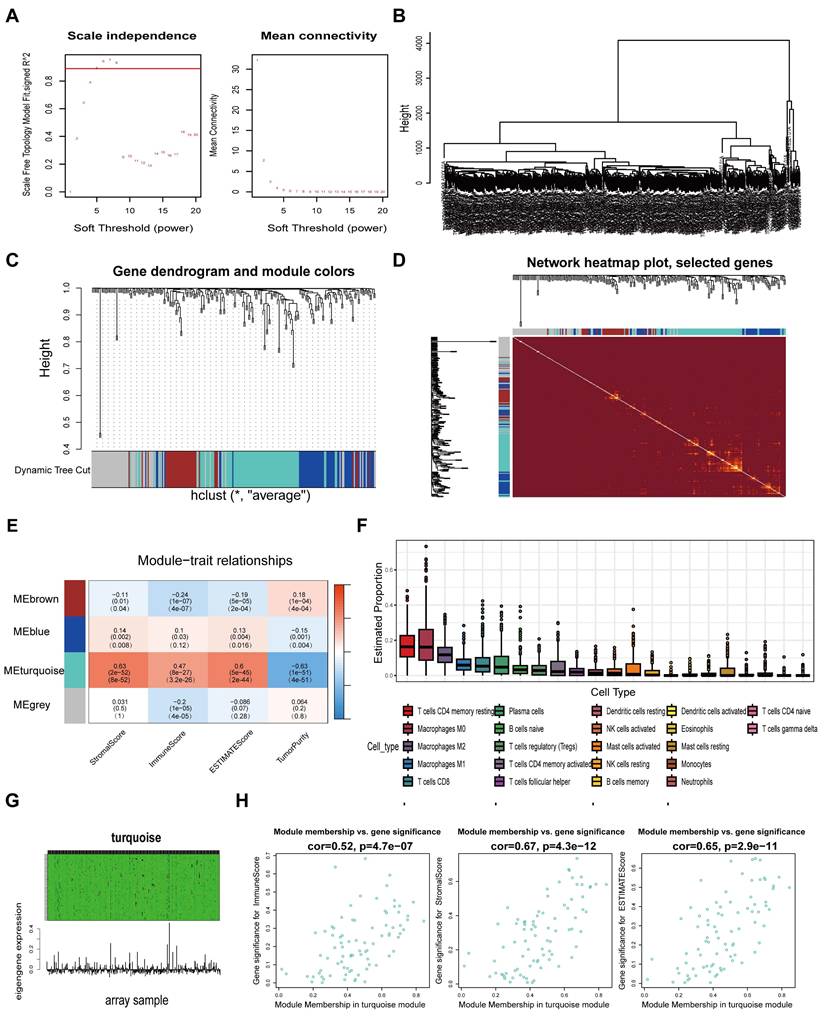
We subsequently calculated the proportion of immune cells in the immune microenvironment of patients with COAD via the CIBERSORT algorithm (Fig. 2F). We found that resting CD4 memory T cells accounted for the largest percentage of immune microenvironment immune cells in the COAD cohort. Previous studies have shown that the subgroups with more resting CD4 memory T cells have reduced immune escape and the patients will have a better clinical outcome [37]. Afterwards, we constructed a composite chart to display the expression characteristics of turquoise module genes and module eigengenes (MEs) (Fig. 2G). The scatter plot results indicated that the correlations between the turquoise module genes and immune infiltration scores (immune score, stromal score and estimate score) were 0.52, 0.67, and 0.65, respectively (Fig. 2H). These results suggest that the genes in the turquoise module are significantly positively correlated with the immune infiltration scores. Because immune cells are crucial in combating tumor immune responses, further research on the 83 genes in this module may help to identify biomarkers and new therapeutic targets for immunotherapy in colorectal cancer.
Differential gene and prognostic analysis
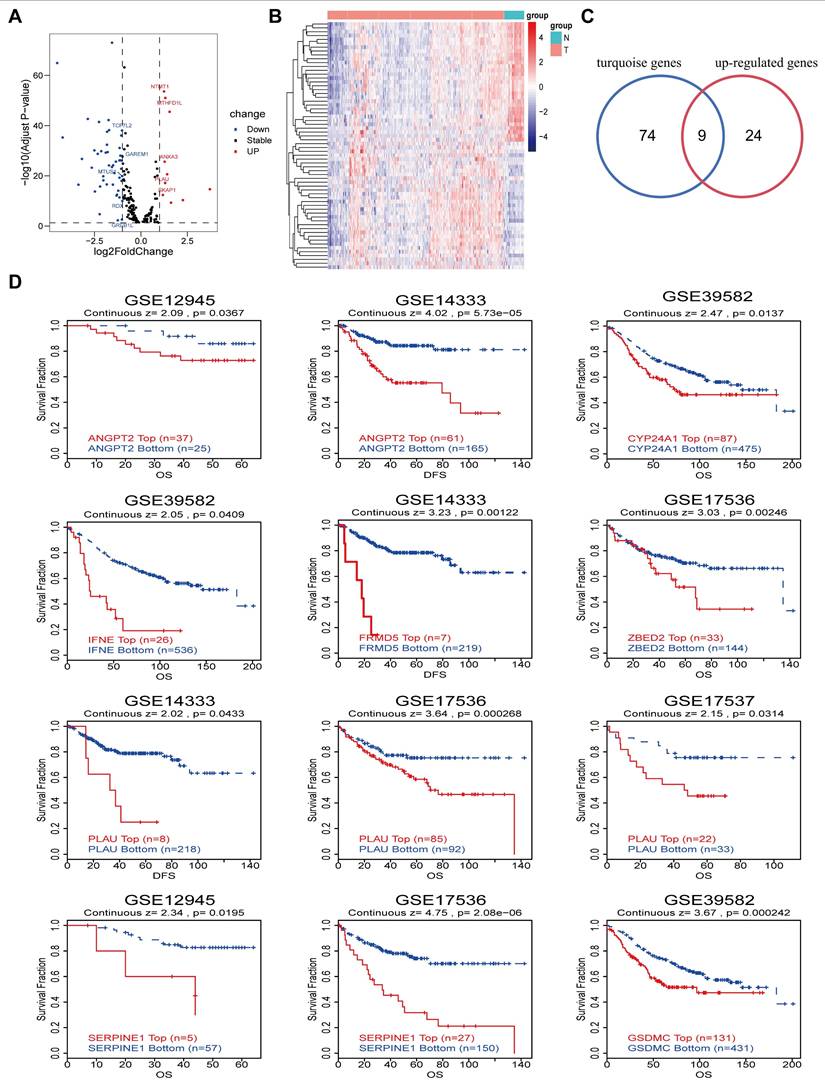
On the basis of the TCGA-COAD datasets, we analyzed the differential expression of genes associated with super-enhancers, resulting in the generation of a volcano plot and heatmap (Fig. 3A-3B). This analysis revealed a total of 33 upregulated genes and 32 downregulated genes. Overlaying the upregulated genes with the 83 immune infiltration-related genes in the above turquoise module via Venn diagrams yielded 9 immune infiltration-related differentially expressed genes (Fig. 3C). Moreover, prognostic analysis of the aforementioned 9 genes was conducted using the GEO datasets obtained from the TIDE database. The results of the K‒M curve analysis revealed that CRC patients with elevated expression levels of 8 specific genes (ANGPT2, CYP24A1, IFNE, PLAU, FRMD5, SERPINE1, ZBED2, and GSDMC) had unfavorable prognoses (Fig. 3D). In addition, we further validated the relationship between the expression of 6 target genes in the TCGA-COAD cohort and the outcomes of cancer patients by determining the optimal threshold (Fig. S1A and Table S1).
Differential genes and prognostic analysis. A-B Volcano map and heatmap of differential genes based on the TCGA-COAD datasets. C Venn diagram of the intersection of up-regulated genes and turquoise module genes. D Kaplan-Meier curves show the prognostic value of the intersection genes in CRC using TIDE database.
Construction of the prognostic risk model
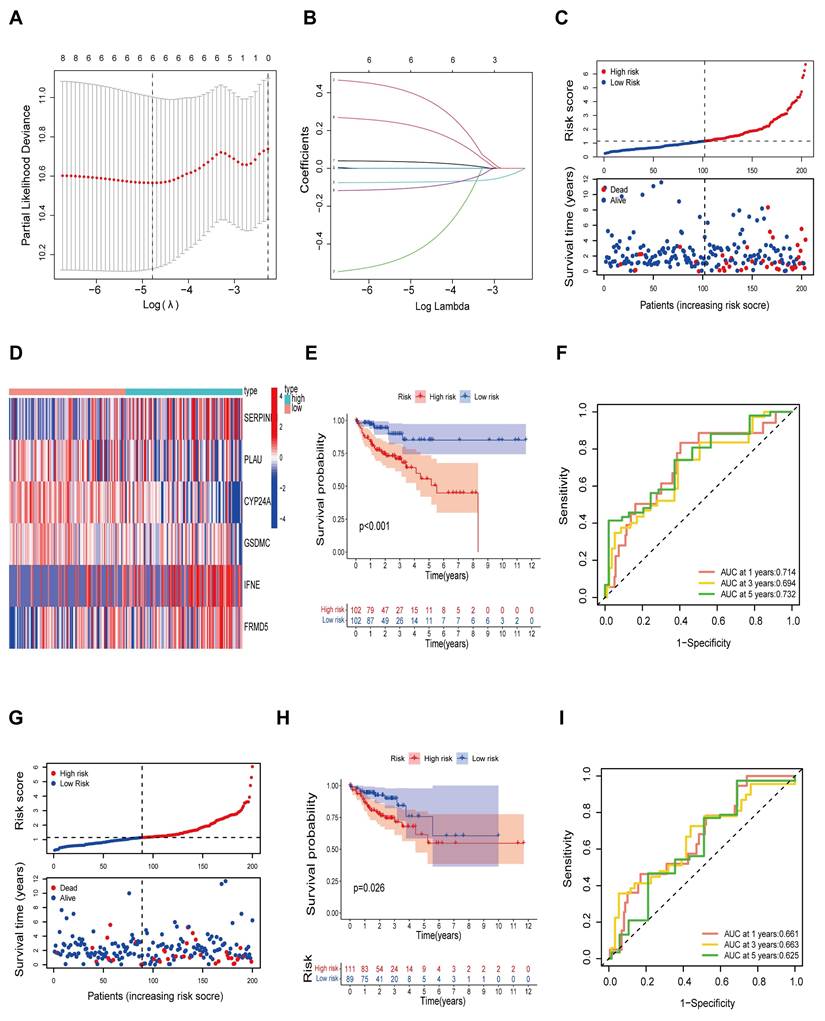
Next, we further explored and validated the prognostic value of the 8 prognosis-related genes through TCGA data. A total of 404 patients were recruited to participate in the study by removing some samples with a total survival time of 0 and incomplete clinicopathological information from the TCGA-COAD dataset. We subsequently randomly divided 404 patients into a training set (n = 203) and a validation set (n = 201) at a 1:1 ratio. We identified 6 risk genes through LASSO-Cox regression analysis (Table S2) and constructed immune infiltration risk features (Fig. 4A-B). We calculated the risk score on the basis of the expression levels of the 6 risk genes via the following formula: risk score=FRMD5*(0.2161)+SERPINE1*(0.3810)+IFNE*(0.0325)-CYP24A1*(0.0722)-GSDMC*(0.1007)-PLAU*(0.4265). Patients in the training set were divided into a high-risk group (n = 101) and a low-risk group (n = 101) according to the risk score. We observed that as the risk score increased, the mortality of the patients increased (Fig. 4C). In addition, we constructed a heatmap to display the expression levels of the 6 risk genes in the high- and low-risk groups (Fig. 4D). We subsequently conducted K‒M survival analysis (Fig. 4E) for patients in the high- and low-risk groups, which revealed that patients in the high-risk group had markedly shorter survival times than did those in the low-risk group (p < 0.01). Time‒ROC analysis revealed that the AUCs for survival at years 1, 3 and 5 were 0.714, 0.694 and 0.732, respectively, indicating the good sensitivity and specificity of the prognostic model developed for the 6 risk genes in predicting the survival of patients with COAD (Fig. 4F). We then validated the prognostic signature of the 6 risk genes in the test cohort. Similarly, survival analysis of the test cohort revealed significant differences in survival time between the test groups, with significantly shorter OS in the high-risk group (P < 0.05) (Fig. 4G-H). In addition, analysis of the time-ROC results for the test cohort revealed AUCs of 0.661, 0.663, and 0.625 at years 1, 3 and 5, respectively (Fig. 4I).
Construction of prognostic risk model. A Screening for turning to optimal parameters (lambda) in the LASSO model. B LASSO coefficient curve for prognostic genes. C Distribution of risk score and survival time of the high and low risk groups. D Heatmap of six candidate genes expression in the high and low risk groups. E Kaplan-Meier curves for overall survival of patients in the high and low risk groups. F Time-ROC curves of the overall survival at 1, 3 and 5 years. G Distribution of risk score and survival time of the high and low risk groups in the test cohort. H Kaplan-Meier curves for overall survival of patients in the high and low risk groups in the test cohort. I Time-ROC curves of the overall survival at 1, 3 and 5 years in the test cohort.
PLAU and GSDMC as biomarkers to predict immunotherapy efficacy
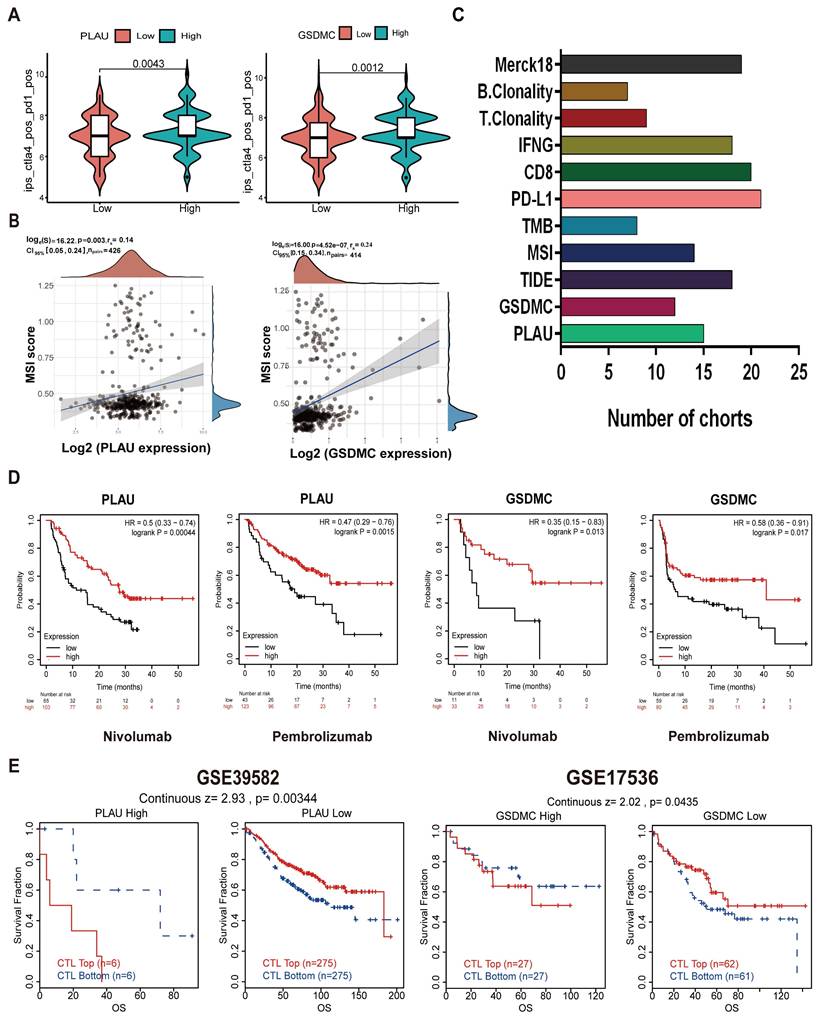
We then wanted to validate our above hypothesis by revealing the relationship between gene expression levels and immunotherapy efficacy. The patient's antitumor immune response can be determined by the immunophenotypic score (IPS). We downloaded the TCGA-COAD IPS score data from the TCIA database and analyzed the expression of each of the 6 risk genes in relation to the IPS score. Among them, the expression of PLAU and GSDMC was significantly correlated with the IPS score. As depicted in Fig. 5A and Fig S1B, immunotherapy was more effective in the high PLAU or high GSDMC expression group when combined with CTLA4 inhibitors and PD-1 inhibitors. MSI is closely related to the antitumor immune response and is an important biomarker for assessing the efficacy of immunotherapy. Our results revealed a positive correlation between the expression of PLAU/GSDMC in CRC and the MSI score (Fig. 5B). GSDMC (r = 0.24, p < 0.0001) has a higher correlation with MSI score than PLAU (r = 0.14, p < 0.01). Next, we compared the predictive capability of PLAU/GSDMC for immunotherapy efficacy in multiple human immunotherapy cohorts (Fig. S2-S3). AUC values > 0.5 means that the algorithm outperformed random. In Fig. 5C, we compiled histograms for the cohorts with an AUC > 0.5 and found that PLAU had better predictive value than existing immunotherapy efficacy biomarkers, such as MSI and TMB. GSDMC also had a greater predictive value than TMB. In particular, we found that melanoma patients with high expression of PLAU or GSDMC had better prognosis when treated with PD-1 inhibitors (nivolumab and pembrolizumab) (Fig. 5D). In short, the above data showed that PLAU and GSDMC could be used as new biomarkers to predict the immunotherapy efficacy. In addition, we found that the function of cytotoxic T-cell (CTL) may be inhibited by high expression of PLAU/GSDMC (Fig. 5E). Because CTL is the effector cell responsible for immune response, we assumed that high expression of PLAU/GSDMC may affect the antitumor immune response of CTLs. This result implied that PLAU/GSDMC may also be new targets for immunotherapy.
PLAU and GSDMC as biomarkers to predict immunotherapy efficacy. A Relationship between PLAU/GSDMC expression and IPS scores. B Correlation between PLAU/GSDMC expression and MSI scores. C The predictive capability of biomarkers for immunotherapy efficacy in multiple human immunotherapy cohorts. D Relationship between high and low PLAU, GSDMC expression and prognosis in melanoma patients when treated with PD-1 inhibitors. E Overall survival of colorectal cancer patients with different PLAU/GSDMC expression and Cytotoxic T cell (CTL) levels.
Correlation between PLAU/GSDMC and the tumor microenvironment (TME)
We utilized the estimation algorithm to evaluate the expression status of PLAU and GSDMC in the TME. We analyzed the Spearman correlations between the expression of these two genes and the matrix score, immune score, and estimate score in the tumor microenvironment using Sangerbox 3.0. The results revealed a positive correlation between PLAU/GSDMC expression and the immune infiltration score (Fig. S4A). In addition, we investigated the potential correlation between the expression of PLAU/GSDMC and tumor-associated immune cells. As shown in Fig. S4B, the expression of PLAU/GSDMC was positively correlated with the abundances of B cells, CD4+ T cells, CD8+ T cells, neutrophils, macrophages, and dendritic cells. We further analyzed the correlation between PLAU/GSDMC expression and PD-1, PD-L1, and CTLA4 expression in COAD using the ACLBI database. The scatter plots revealed a positive correlation between the expression of PLAU/GSDMC in COAD and that of immune checkpoint genes (Fig. S4C). Overall, the expression of PLAU and GSDMC was positively correlated with the TME, indicating their potential as new targets for immunotherapy in CRC.
Predicting the sensitivity of drugs for PLAU and GSDMC proteins
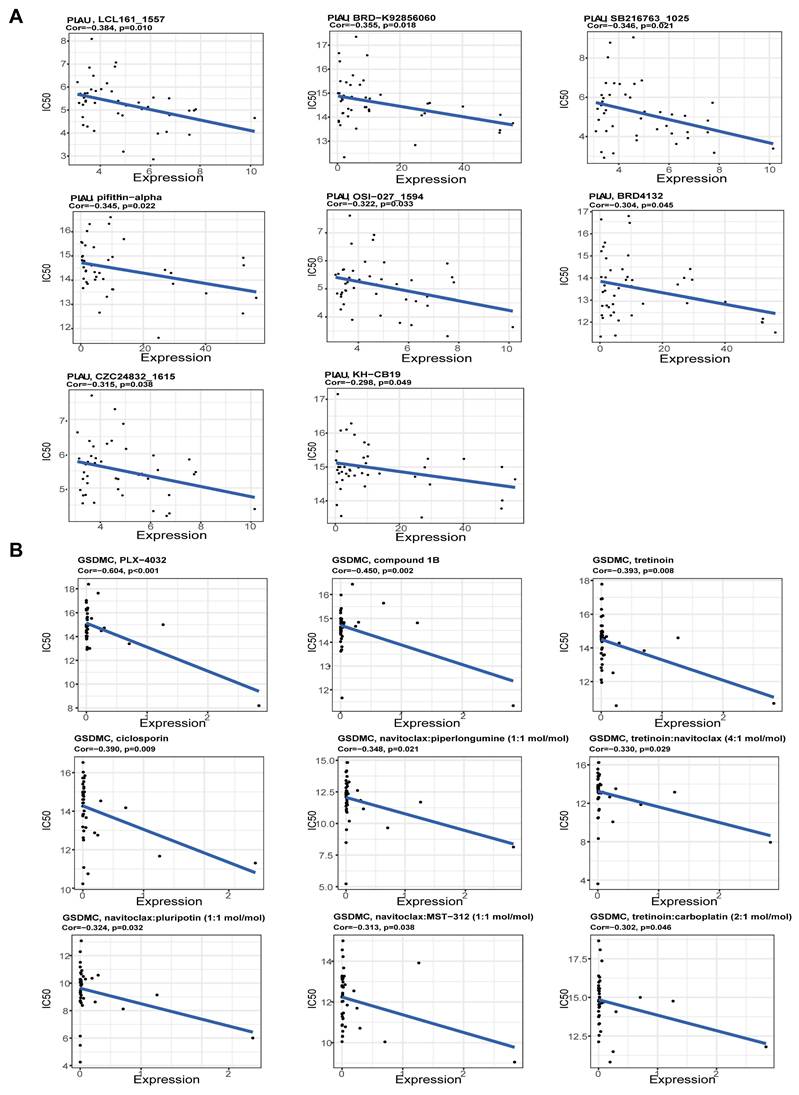
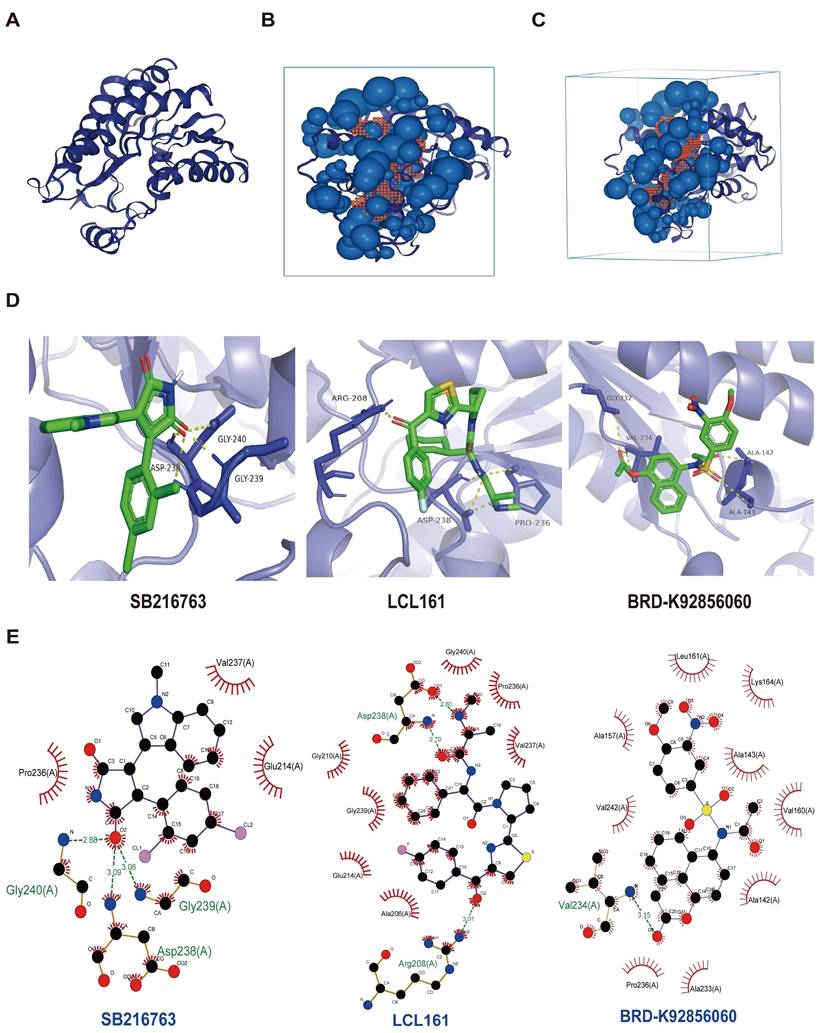
Next, we screened the sensitive drugs for the PLAU and GSDMC proteins. We downloaded the IC50 values of drugs and gene expression levels of CRC cell lines from the GDSC2 and CTRPv2 databases. We subsequently analyzed the sensitivity of the PLAU and GDSMC proteins to drugs (Table S3). Scatter plots of the 8 drugs selected for the PLAU protein are shown in Fig. 6A, while scatter plots of the drugs selected for the GSDMC protein are shown in Fig. 6B. The top three drug structures were downloaded from the PubChem database (Fig. S5). Next, we obtained the spatial structures of the PLAU and GSDMC proteins from the PDB database (Fig. 7A and Fig. S6A). Using the CHECOM algorithm, we predicted the binding sites and boxes of the PLAU and GSDMC proteins (Fig. 7B-C and Fig. S6B-C). In addition, we utilized AutoDock software for molecular docking and obtained the free binding energies of the two proteins with the drugs (Table S4). Then, via PyMOL software, we visualized the binding of the selected drugs to the PLAU and GSDMC proteins (Fig. 7D and Fig. S6D). Finally, we used Ligplus software to visualize the two-dimensional interactions between the PLAU and GSDMC proteins and the small-molecule drugs (Fig. 7E and Fig. S6E).
Scatter plots of the correlation between PLAU (A), GSDMC (B) expression and the IC50 of drugs.
Screening sensitive drugs for PLAU protein. A Three-dimensional structure of the PLAU protein. B-C Predicting the potential binding sites and box of PLAU protein. D Analysis of the binding conformation of sensitive drugs to PLAU protein. E Visualization of the two-dimensional structure of drugs bound to PLAU protein.
Super-enhancer activity regulates PLAU and GSDMC expression
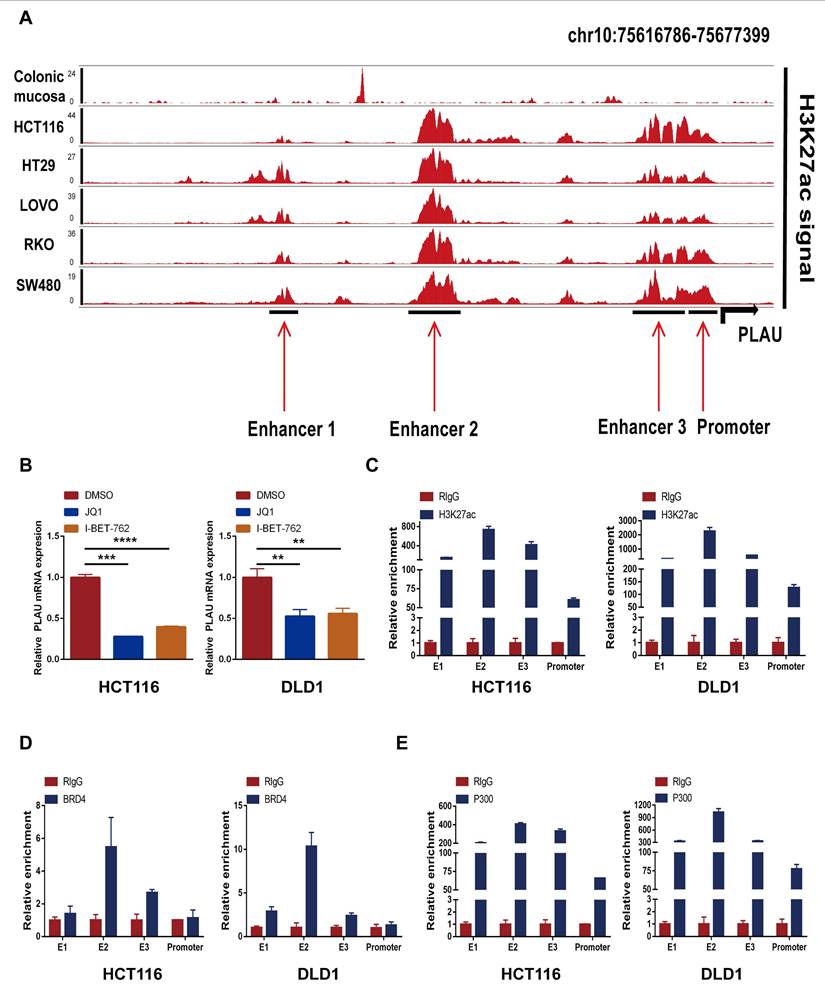
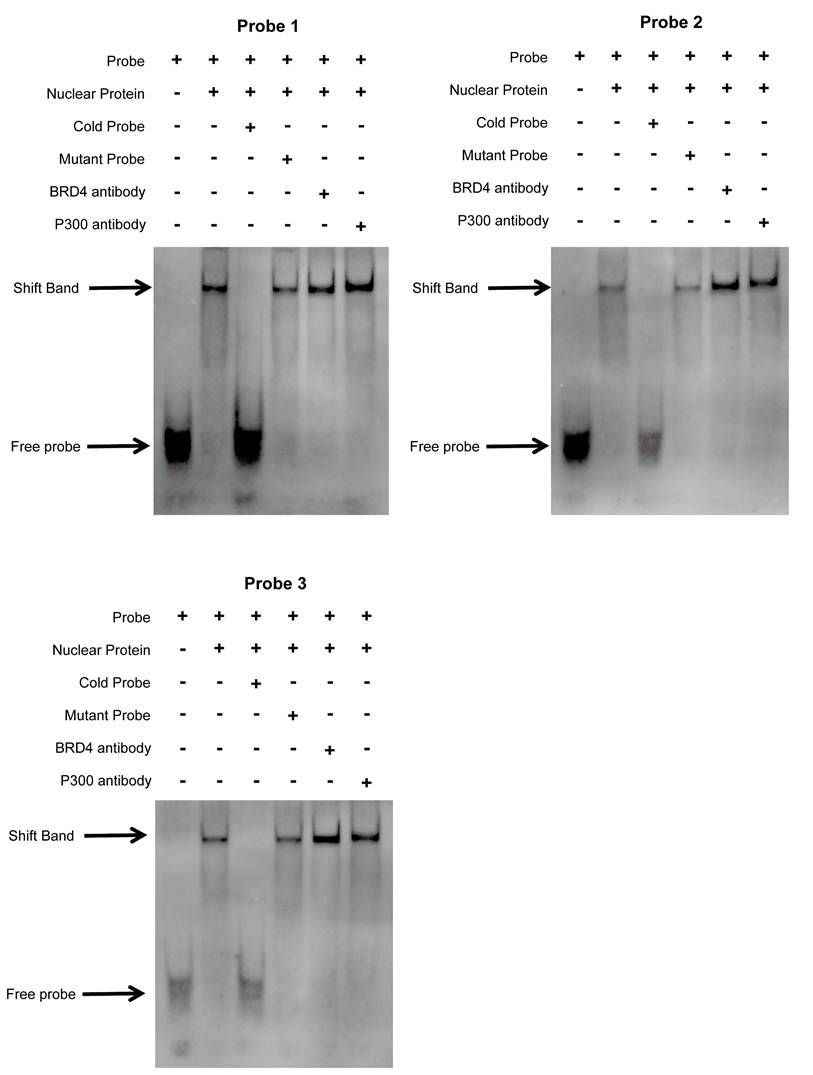
We first validated the relative mRNA expression levels of PLAU and GSDMC in CRC using our clinical samples (Fig. S7A). Then we wondered whether the high expression of PLAU and GSDMC in CRC was up to the super-enhancer activity. We analyzed H3K27ac signals in the gene loci of PLAU and GSDMC in various COAD cells compared with those in normal colonic mucosa using ChIP-seq data obtained from the ENCODE database. We observed a greater H3K27ac signal in the PLAU gene loci than in the GSDMC gene loci (Fig. 8A and Fig. S7B). After treatment with the BRD4 inhibitors JQ1 and I-BET-762, which can block the formation of super-enhancers [38], the expression levels of PLAU and GSDMC decreased significantly in COAD cells (Fig. 8B and Fig. S7C). Through ChIP‒qPCR, we observed significant enrichment of H3K27ac and BRD4 expression at the super-enhancer sites of PLAU and GSDMC (Fig. 8C‒D and Fig. S7D). Interestingly, we also detected increased enrichment of the acetyltransferase P300 expression at these PLAU and GSDMC gene loci (Fig. 8E and Fig. S7E). Additionally, we conducted super-shift EMSAs of BRD4 and P300 to further validate our results (Fig. 9). We found that BRD4, especially P300, could bind to these PLAU super-enhancer sites.
Effect of super-enhancer activity on PLAU expression. A ChIP-seq profiles of H3K27ac signal in the PLAU gene locus in different colorectal cancer cells. B The expression levels of PLAU in HCT116 and DLD1 cells treated with JQ1 and I-BET-762 were detected by qPCR. C The relative enrichment of H3K27ac in the PLAU gene locus by ChIP-qPCR. D The relative enrichment of BRD4 in the PLAU gene locus by ChIP-qPCR. E The relative enrichment of P300 in the PLAU gene locus by ChIP-qPCR. (Data are represented as mean ± SD, **p<0.01, ***p<0.001).
The interplay between BRD4/P300 and PLAU super-enhancers was validated using super-shift electrophoretic mobility shift assay (EMSA) in HCT116 cell.
Discussion
ICIs have shown good clinical efficacy in CRC patients. However, owing to the heterogeneity of tumors, ICI treatment is known to be effective in only a small number of CRC patients. The existing biomarker MSI-H is considered as a good predictor of the response to ICIs. However, only 20% of CRC patients belong to the MSI-H type [39]. Therefore, identifying new biomarkers to select patients who may respond well to ICIs is imperative.
Super-enhancers can drive increased levels of gene transcription [40] and play an important role in CRC [41]. The super-enhancer is crucial for multiple tumor biological characteristics, including the immune response [42]. Previous studies have demonstrated that the characteristics of the TME in tumors is closely related to the patient's response to immunotherapy [43, 44]. Thus, understanding immune cell infiltration in the TME provides a powerful method for identifying CRC patients who are responsive to ICI therapy. In this study, we innovatively screened CRC-specific super-enhancer-related genes associated with immune infiltration by WGCNA. Notably, 83 genes in the turquoise module were positively correlated with immune infiltration scores, indicating that high expression of these genes may have a significant effect on the immunotherapy response of patients with colorectal cancer. Similarly, one recent study identified an immune-related module by WGCNA in lung cancer [45]. Studying the expression of these 83 genes in colorectal cancer patients and their impact on prognosis is highly important for further screening of biomarkers for the diagnosis and prognosis of colorectal cancer. Therefore, a LASSO-Cox prognostic risk model was constructed on the basis of the TCGA-COAD cohort. By analyzing the relationship between risk model gene expression and the immune phenotype score (IPS), we found that PLAU and GSDMC have high predictive value for the efficacy of immunotherapy and may become new targets for CRC immunotherapy. The various components in the tumor microenvironment are closely related to immunotherapy efficacy [46]. Therefore, we further investigated the correlation between the expression of PLAU/GSDMC and the immune microenvironment, which might explain why PLAU/GSDMC expression can predict immunotherapy efficacy.
Plasmin activator urokinase (PLAU), a protease involved in the conversion of plasminogen to plasmin [47], encodes a serine protease. Studies have shown that PLAU plays a key role in tumorigenesis and progression. By binding to their receptors, these proteases are converted into their active forms, enabling tumor cells to degrade surrounding extracellular matrix components. This process facilitates the invasion and migration of tumor cells [48]. Additionally, PLAU is closely related to tumor diagnosis, treatment, and prognosis [49]. Similarly, we identified a poor prognosis for patients with high PLAU expression in CRC, suggesting that PLAU could serve as a biomarker for predicting the prognosis of patients with CRC. Previous studies have shown that the overexpression of PLAU is associated with the immunosuppressive tumor microenvironment in pancreatic ductal adenocarcinoma. The overexpression of PLAU was more closely associated with PD-L1 and PD-L2 but had a weaker correlation with antitumor immunity [50]. Our research revealed a significant positive correlation between PLAU expression and the tumor microenvironment in CRC. More importantly, PLAU expression was positively correlated with the IPS, which is an effective means of predicting the ICI response [31]. CRCs with mismatch repair defects (dMMR) or severely mutated tumors with MSI-H can be effectively treated with ICIs [51]. Interestingly, we also found a positive correlation between PLAU expression and MSI scores in CRC. Furthermore, we found that PLAU had a better ability to predict immunotherapy efficacy than some existing biomarkers, such as MSI and TMB, which have become reliable biomarkers for predicting the efficacy of ICIs in certain cancers [52]. Unexpectedly, we found that PLAU expression might affect the function of cytotoxic T cells but not their abundance. Similarly, PLAU is negatively related to CD8+ T-cell invasion of head and neck squamous cell carcinomas [53]. These data indicated that high expression of PLAU could aid tumor cells in evading the immune system by impairing the function of T cells. This finding may be helpful to explain immunotherapy resistance. These results suggest that PLAU may serve not only as an effective biomarker for predicting the efficacy of immunotherapy but also as a potential new target for immunotherapy in CRC.
GSDMC is a member of the GSDM family that has been extensively studied in recent years for its role in promoting cell pyroptosis[54]. GSDMC is highly expressed in CRC, and the proliferation of colorectal cells is reduced after GSDMC is silenced [55]. In addition, in many tumor types, patients with high GSDMC expression have a poor prognosis [56]. PD-1-mediated GSDMC expression converts apoptosis to necroptosis in cancer cells [57]. GSDMC was found to be valuable in predicting the outcome and immunotherapy response of patients with pancreatic adenocarcinoma [58]. In addition, GSDMC expression was associated with an immune-hot tumor microenvironment [59]. Similarly, our study revealed that GSDMC was positively correlated with immune scores, immune cell infiltration, and the expression of immune checkpoint genes. These findings indicate that GSDMC may affect the immunotherapy efficacy of colorectal cancer by altering immune cells, stromal cells, and other components in the immune microenvironment of CRC. Therefore, when immunotherapy is applied, CRC patients with high GSDMC expression are likely to have better outcomes. Indeed, we found that GSDMC expression was positively correlated with IPS and MSI scores, suggesting that GSDMC, like PLAU, could serve as a biomarker for predicting CRC immunotherapy efficacy. Notably, we found that high expression of GSDMC had an impact on the function of cytotoxic T cells. Therefore, we speculate that GSDMC expression might become a new biomarker for immunotherapy.
Additionally, we elucidated the reasons why PLAU and GSDMC can predict the efficacy of immunotherapy. First, there is growing evidence that immune cells in the tumor microenvironment play a key role in tumorigenesis and progression [10]. Research has shown that tumor-associated macrophages (TAMs) can express high levels of anti-inflammatory factors to promote an inhibitory immune microenvironment and affect antitumor immunity [60]. TAMs can also inhibit the recruitment and activation of T cells, thereby exacerbating immune suppression [61]. Cancer-associated fibroblasts (CAFs) can produce inhibitory cytokines, suppress the accumulation of T cells near tumors, and affect the efficacy of immunotherapy [62]. In addition, a high abundance of Treg cells in the TME is associated with immune suppression and a poor prognosis [63, 64]. Our research revealed a significant positive correlation between the expression of PLAU/GSDMC and infiltrating immune cells in CRC. This implies that the higher the expression levels of these two genes are, the greater the number of immune cells in the tumor microenvironment. In line with our findings, the overexpression of PLAU is positively correlated with the infiltration of various immune cells in pancreatic cancer [65]. PLAU is also strongly positively correlated with tumor-infiltrating lymphocytes in lung adenocarcinoma [66]. The expression of PLAU may promote an immune-hot tumor microenvironment. Therefore, the use of immune checkpoint inhibitors results in better therapeutic effects. Second, we were surprised to observe that the expression level of PLAU/GSDMC was positively correlated with immune checkpoint genes. In other words, when the expression of these two genes increases, the expression of immune checkpoint genes also increases, increasing the effectiveness of treatment with immune checkpoint inhibitors. Currently, many patients who are theoretically suitable for treatment with ICIs are resistant to PD-1 or PD-L1 inhibitors due to various factors. For example, deletion of the β-2-microglobulin heterodimer may affect the antigen presentation of MHC-I and induce resistance to ICIs [67]. Interestingly, studies have demonstrated the costimulatory effect of LCL161 under conditions in which TAC-T cells are stimulated with antigen alone, and increased T-cell survival and proliferation have been observed [68]. Considering the correlation between PLAU/GSDMC expression and immune cell infiltration, as well as PD-1/PD-L1/CTLA4 expression, we hypothesized that better immunotherapy efficacy could be achieved by targeting PLAU/GSDMC proteins in combination with ICIs. Therefore, we utilized drug sensitivity analysis and virtual molecular docking to screen for drugs that are able to target PLAU/GSDMC proteins. Overall, our study indicated that targeting PLAU/GSDMC may offer a potential new strategy for the immunotherapy of CRC.
Super-enhancer-driven genes have potential as biomarkers and therapeutic targets for cancers [69]. In our study, we observed high H3K27ac signal at the PLAU gene locus. In addition, our in vitro experiments indicated that the marker-H3K27ac, the reader-BRD4, and the creater-P300 of super-enhancers were all highly enriched at the enhancer sites of PLAU. In sum, our results revealed that super-enhancer activity was responsible for the expression of PLAU in CRC. Therefore, our study revealed a link between the super-enhancer and CRC. Interestingly, recent studies have reported the impact of immune infiltration super-enhancer regulatory genes on immunotherapy efficacy in gastrointestinal tumors [70]. Similarly, our latest study revealed that super-enhancer-induced LINC00862 could serve as a biomarker for predicting immunotherapy efficacy [71]. Overall, we confirmed the presence of super-enhancers and the influence of super-enhancer activity on PLAU expression.
At present, reliable biomarkers for the immunotherapy of colorectal cancer, such as dMMR/MSI-H, can only benefit approximately 15% of colorectal cancer patients. Therefore, the identification of similar biomarkers can aid in the accurate selection of patients who may benefit from immunotherapy, thereby avoiding ineffective treatment. In addition, by screening reliable biomarkers, the disease development trend and prognosis of colorectal cancer patients can be understood in advance, and treatment plans can be optimized. This study investigated the correlation between the expression of PLAU or GSDMC and the tumor microenvironment of colorectal cancer and revealed that high expression of PLAU and GSDMC maybe regulate the function of CTL cells. Therefore, our study provides potential new biomarkers for predicting the efficacy of immunotherapy and possibly new targets for immunotherapy in CRC. Besides, on the basis of these newly discovered biomarkers, this study can lead to the development of new targeted drugs and provide new options for patients with colorectal cancer. However, data on immunotherapy for colorectal cancer in existing databases are lacking, and the correlation between PLAU and GSDMC expression and the prognosis of patients with colorectal cancer treated with immunotherapy is currently unclear. Therefore, we analyzed the impact of PLAU and GSDMC expression on the prognosis of melanoma patients treated with ICIs. In the future, we will continue to collect relevant samples of patients with colorectal cancer treated with immunotherapy and further study the correlation between PLAU and GSDMC expression and the prognosis of colorectal cancer patients treated with ICIs. As found in Ke et al.'s latest research, the expression of PD-1 and CD69 on effector memory CD8+ T cells in the blood can predict the presence of tertiary lymphoid structures (TLSs) in the macroscopic environment of CRC and serve as biomarkers for stratifying CRC patients for immunotherapy [72]. In the coming years, through the application of large-scale biological data analysis and single-cell sequencing, a more comprehensive understanding of the tumor microenvironment of colorectal cancer can be achieved, facilitating the exploration of more biomarkers that reflect the tumor immune status and predict the immunotherapy response. In addition, by combining existing biomarkers such as MSI, TMB, and PD-L1, with newly discovered biomarkers, the accuracy of predicting immunotherapy efficacy and patient stratification for colorectal cancer can be improved.
Our research has several limitations. First, few colorectal cancer patients rely solely on immunotherapy in clinical practice, and the sample collection requires a longer period of time. Therefore, we were unable to analyze the relationship between PLAU and GSDMC expression and the prognosis of colorectal cancer patients treated with ICIs. In addition, owing to the limited collection of IC50 data for drugs in existing databases, it is not possible to comprehensively evaluate the sensitivity of drugs. And the complex relationship between diseases and drugs cannot be fully considered in the screening process, resulting in possible biases in the screening results. Furthermore, the construction period of animal models is relatively long, and the in vitro reactions of drugs differ greatly from the actual situation of human trials. Therefore, this study has not yet conducted further research on drug sensitivity for PLAU and GSDMC proteins. Finally, in the initial stage of this study, the correlations between PLAU and GSDMC expression and the tumor microenvironment of patients with colorectal cancer were analyzed using bioinformatics methods. Further experiments are needed to clarify the specific regulatory mechanisms involved.
Conclusion
Collectively, our study identifies super-enhancer-based biomarkers for predicting survival and immunotherapy efficacy in CRC. The six super-enhancer-related signatures could act as a potential prognostic biomarker for CRC. PLAU and GSDMC expression had high predictive value for immunotherapy efficacy.
Supplementary Material
Supplementary figures and tables.
Acknowledgements
Funding
This work was supported by the Kite Capital Scholars Project (No. ydxz2023022), the Shandong Provincial Key Medical and Health Discipline of Affiliated Hospital of Shandong Second Medical University in Oncology, the National Natural Science Foundation of China (81902404), the Natural Science Foundation of Shandong Province (ZR2019BH009) and the Shandong Province Medical and Health Technology Project (2017WS403, 202303111442).
Author contributions
Conceptualization, Jiaqiu Li; Data curation, Jiaqiu Li; Methodology, Yanan Yu, Xiuxiu Zhang and Xiaolin Ma; Formal analysis, Yanan Yu, Xiuxiu Zhang and Xiaolin Ma; Investigation, Jiao Ren and Jinglei Zhang; Resources, Luoyu Zhu; Software, Yanan Yu; Supervision, Jiaqiu Li, Zhong Lu and Yanfang Chen; Validation, Yanfang Chen; Visualization, Yanan Yu; Writing - original draft, Yanan Yu; Writing - review &editing, Jiaqiu Li; Project administration, Jiaqiu Li and Zhong Lu; Funding acquisition, Jiaqiu Li, Zhong Lu and Xiaolin Ma. All authors approved the final paper.
Data availability statement
The ChIP-seq data has been deposited to the Gene Expression Omnibus (GEO) under accession number GSE198223.
Ethics approval and consent for publication
This research was approved by The Institute of Research Medical Ethics Committee of the Affiliated Hospital of Shandong Second Medical University. All patients signed the informed consent forms.
Competing Interests
The authors have declared that no competing interest exists.
References
1. Siegel RL, Miller KD, Wagle NS, Jemal A. Cancer statistics, 2023. CA: a cancer journal for clinicians. 2023;73:17-48
2. Yang ZY, Deng W, Zhang X, An YB, Liu YS, Yao HW. et al. Opportunities and Challenges of Nanoparticles in Digestive Tumours as Anti-Angiogenic Therapies. Front Oncol. 2022 11
3. Wei L, Wang XW, Lv LY, Zheng Y, Zhang NS, Yang M. The emerging role of noncoding RNAs in colorectal cancer chemoresistance. Cell Oncol. 2019;42:757-68
4. Jin J, Tang Y, Hu C, Jiang LM, Jiang J, Li N. et al. Multicenter, Randomized, Phase III Trial of Short-Term Radiotherapy Plus Chemotherapy Versus Long-Term Chemoradiotherapy in Locally Advanced Rectal Cancer (STELLAR). J Clin Oncol. 2022;40:1681 -+
5. Morgan E, Arnold M, Gini A, Lorenzoni V, Cabasag CJ, Laversanne M. et al. Global burden of colorectal cancer in 2020 and 2040: incidence and mortality estimates from GLOBOCAN. Gut. 2023;72:338-44
6. Weng J, Li S, Zhu Z, Liu Q, Zhang R, Yang Y. et al. Exploring immunotherapy in colorectal cancer. J Hematol Oncol. 2022;15:95
7. Chibaudel B, Tournigand C, Bonnetain F, Richa H, Benetkiewicz M, Andre T. et al. Therapeutic strategy in unresectable metastatic colorectal cancer: an updated review. Ther Adv Med Oncol. 2015;7:153-69
8. Janjigian YY, Shitara K, Moehler M, Garrido M, Salman P, Shen L. et al. First-line nivolumab plus chemotherapy versus chemotherapy alone for advanced gastric, gastro-oesophageal junction, and oesophageal adenocarcinoma (CheckMate 649): a randomised, open-label, phase 3 trial. Lancet. 2021;398:27-40
9. Gallo G, Vescio G, De Paola G, Sammarco G. Therapeutic Targets and Tumor Microenvironment in Colorectal Cancer. J Clin Med. 2021 10
10. Sunakawa Y, Stintzing S, Cao S, Heinemann V, Cremolini C, Falcone A. et al. Variations in genes regulating tumor-associated macrophages (TAMs) to predict outcomes of bevacizumab-based treatment in patients with metastatic colorectal cancer: results from TRIBE and FIRE3 trials. Ann Oncol. 2015;26:2450-6
11. Zhu XD, Liang RP, Lan TY, Ding DB, Huang SX, Shao J. et al. Tumor-associated macrophage-specific CD155 contributes to M2-phenotype transition, immunosuppression, and tumor progression in colorectal cancer. J Immunother Cancer. 2022 10
12. Wei SC, Duffy CR, Allison JP. Fundamental Mechanisms of Immune Checkpoint Blockade Therapy. Cancer Discov. 2018;8:1069-86
13. Howard FM, Pearson AT, Nanda R. Clinical trials of immunotherapy in triple-negative breast cancer. Breast Cancer Res Tr. 2022;195:1-15
14. Zhao W, Jin LJ, Chen P, Li DC, Gao WX, Dong GL. Colorectal cancer immunotherapy-Recent progress and future directions. Cancer Lett. 2022 545
15. Taieb J, Svrcek M, Cohen R, Basile D, Tougeron D, Phelip JM. Deficient mismatch repair/microsatellite unstable colorectal cancer: Diagnosis, prognosis and treatment. Eur J Cancer. 2022;175:136-57
16. Rizzo A, Santoni M, Mollica V, Logullo F, Rosellini M, Marchetti A. et al. Peripheral neuropathy and headache in cancer patients treated with immunotherapy and immuno-oncology combinations: the MOUSEION-02 study. Expert Opin Drug Metab Toxicol. 2021;17:1455-66
17. Guven DC, Erul E, Kaygusuz Y, Akagunduz B, Kilickap S, De Luca R. et al. Immune checkpoint inhibitor-related hearing loss: a systematic review and analysis of individual patient data. Support Care Cancer. 2023;31:624
18. Wang T, Dai L, Shen S, Yang Y, Yang M, Yang X. et al. Comprehensive Molecular Analyses of a Macrophage-Related Gene Signature With Regard to Prognosis, Immune Features, and Biomarkers for Immunotherapy in Hepatocellular Carcinoma Based on WGCNA and the LASSO Algorithm. Frontiers in immunology. 2022;13:843408
19. Schrock AB, Ouyang C, Sandhu J, Sokol E, Jin D, Ross JS. et al. Tumor mutational burden is predictive of response to immune checkpoint inhibitors in MSI-high metastatic colorectal cancer. Annals of Oncology. 2019;30:1096-103
20. Samstein RM, Lee CH, Shoushtari AN, Hellmann MD, Shen RL, Janjigian YY. et al. Tumor mutational load predicts survival after immunotherapy across multiple cancer types. Nat Genet. 2019;51:202 -+
21. Yarchoan M, Albacker LA, Hopkins AC, Montesion M, Murugesan K, Vithayathil TT. et al. PD-L1 expression and tumor mutational burden are independent biomarkers in most cancers. JCI Insight. 2019 4
22. Cancer immunotherapy. the quest for better biomarkers. Nat Med. 2022;28:2437 -
23. Sahin TK, Rizzo A, Aksoy S, Guven DC. Prognostic Significance of the Royal Marsden Hospital (RMH) Score in Patients with Cancer: A Systematic Review and Meta-Analysis. Cancers (Basel). 2024 16
24. Sengupta S, George RE. Super-Enhancer-Driven Transcriptional Dependencies in Cancer. Trends Cancer. 2017;3:269-81
25. Hnisz D, Abraham BJ, Lee TI, Lau A, Saint-Andre V, Sigova AA. et al. Super-enhancers in the control of cell identity and disease. Cell. 2013;155:934-47
26. Pott S, Lieb JD. What are super-enhancers? Nat Genet. 2015;47:8-12
27. Amaral PP, Bannister AJ. Re-place your BETs: the dynamics of super enhancers. Molecular cell. 2014;56:187-9
28. Yu DY, Yang X, Lin JW, Cao ZC, Lu CH, Yang ZY. et al. Super-Enhancer Induced IL-20RA Promotes Proliferation/Metastasis and Immune Evasion in Colorectal Cancer. Front Oncol. 2021 11
29. Lv Y, Wu L, Jian H, Zhang C, Lou Y, Kang Y. et al. Identification and characterization of aging/senescence-induced genes in osteosarcoma and predicting clinical prognosis. Front Immunol. 2022;13:997765
30. Jiang P, Gu S, Pan D, Fu J, Sahu A, Hu X. et al. Signatures of T cell dysfunction and exclusion predict cancer immunotherapy response. Nature medicine. 2018;24:1550-8
31. Charoentong P, Finotello F, Angelova M, Mayer C, Efremova M, Rieder D. et al. Pan-cancer Immunogenomic Analyses Reveal Genotype-Immunophenotype Relationships and Predictors of Response to Checkpoint Blockade. Cell Rep. 2017;18:248-62
32. Cheruku S, Rao V, Pandey R, Rao Chamallamudi M, Velayutham R, Kumar N. Tumor-associated macrophages employ immunoediting mechanisms in colorectal tumor progression: Current research in Macrophage repolarization immunotherapy. Int Immunopharmacol. 2023;116:109569
33. Li J, Song P, Jiang T, Dai D, Wang H, Sun J. et al. Heat Shock Factor 1 Epigenetically Stimulates Glutaminase-1-Dependent mTOR Activation to Promote Colorectal Carcinogenesis. Mol Ther. 2018;26:1828-39
34. Song P, Feng L, Li J, Dai D, Zhu L, Wang C. et al. beta-catenin represses miR455-3p to stimulate m6A modification of HSF1 mRNA and promote its translation in colorectal cancer. Mol Cancer. 2020;19:129
35. Luo Y, Hitz BC, Gabdank I, Hilton JA, Kagda MS, Lam B. et al. New developments on the Encyclopedia of DNA Elements (ENCODE) data portal. Nucleic Acids Res. 2020;48:D882-D9
36. Shen Q, Wang R, Liu X, Song P, Zheng M, Ren X. et al. HSF1 Stimulates Glutamine Transport by Super-Enhancer-Driven lncRNA LINC00857 in Colorectal Cancer. Cancers (Basel). 2022 14
37. Wang H, Wu J, Ling R, Li F, Yang Q, He J. et al. Fibroblast-derived LPP as a biomarker for treatment response and therapeutic target in gastric cancer. Mol Ther Oncolytics. 2022;24:547-60
38. Loven J, Hoke HA, Lin CY, Lau A, Orlando DA, Vakoc CR. et al. Selective inhibition of tumor oncogenes by disruption of super-enhancers. Cell. 2013;153:320-34
39. Chalabi M, Fanchi LF, Dijkstra KK, Van den Berg JG, Aalbers AG, Sikorska K. et al. Neoadjuvant immunotherapy leads to pathological responses in MMR-proficient and MMR-deficient early-stage colon cancers. Nat Med. 2020;26:566-76
40. Hnisz D, Shrinivas K, Young RA, Chakraborty AK, Sharp PA. A Phase Separation Model for Transcriptional Control. Cell. 2017;169:13-23
41. Li QL, Lin X, Yu YL, Chen L, Hu QX, Chen M. et al. Genome-wide profiling in colorectal cancer identifies PHF19 and TBC1D16 as oncogenic super enhancers. Nat Commun. 2021;12:6407
42. Li XP, Qu J, Teng XQ, Zhuang HH, Dai YH, Yang Z. et al. The Emerging Role of Super-enhancers as Therapeutic Targets in The Digestive System Tumors. International journal of biological sciences. 2023;19:1036-48
43. Zhang Y, Zhang Z. The history and advances in cancer immunotherapy: understanding the characteristics of tumor-infiltrating immune cells and their therapeutic implications. Cell Mol Immunol. 2020;17:807-21
44. Bejarano L, Jordao MJC, Joyce JA. Therapeutic Targeting of the Tumor Microenvironment. Cancer Discov. 2021;11:933-59
45. Lu W, Zhou Y, Zhao R, Liu Q, Yang W, Zhu T. The integration of multi-omics analysis and machine learning for the identification of prognostic assessment and immunotherapy efficacy through aging-associated genes in lung cancer. Aging (Albany NY). 2024;16:1860-78
46. Huang H, Ge J, Fang Z, Wu S, Jiang H, Lang Y. et al. Precursor exhausted CD8(+)T cells in colorectal cancer tissues associated with patient's survival and immunotherapy responsiveness. Front Immunol. 2024;15:1362140
47. Li Z, Chen C, Wang J, Wei M, Liu G, Qin Y. et al. Overexpressed PLAU and its potential prognostic value in head and neck squamous cell carcinoma. PeerJ. 2021;9:e10746
48. Mauro CD, Pesapane A, Formisano L, Rosa R, D'Amato V, Ciciola P. et al. Urokinase-type plasminogen activator receptor (uPAR) expression enhances invasion and metastasis in RAS mutated tumors. Sci Rep. 2017;7:9388
49. Liu Q, Li W, Yang S, Liu Z. High expression of uPA related to p38MAPK in esophageal cancer indicates poor prognosis. Onco Targets Ther. 2018;11:8427-34
50. Hosen SMZ, Uddin MN, Xu Z, Buckley BJ, Perera C, Pang TCY. et al. Metastatic phenotype and immunosuppressive tumour microenvironment in pancreatic ductal adenocarcinoma: Key role of the urokinase plasminogen activator (PLAU). Front Immunol. 2022;13:1060957
51. Ganesh K, Stadler ZK, Cercek A, Mendelsohn RB, Shia J, Segal NH. et al. Immunotherapy in colorectal cancer: rationale, challenges and potential. Nat Rev Gastroenterol Hepatol. 2019;16:361-75
52. Chan TA, Yarchoan M, Jaffee E, Swanton C, Quezada SA, Stenzinger A. et al. Development of tumor mutation burden as an immunotherapy biomarker: utility for the oncology clinic. Ann Oncol. 2019;30:44-56
53. Zhou Q, Yuan O, Cui H, Hu T, Xiao GG, Wei J. et al. Bioinformatic analysis identifies HPV-related tumor microenvironment remodeling prognostic biomarkers in head and neck squamous cell carcinoma. Front Cell Infect Microbiol. 2022;12:1007950
54. Zou J, Zheng Y, Huang Y, Tang D, Kang R, Chen R. The Versatile Gasdermin Family: Their Function and Roles in Diseases. Front Immunol. 2021;12:751533
55. Miguchi M, Hinoi T, Shimomura M, Adachi T, Saito Y, Niitsu H. et al. Gasdermin C Is Upregulated by Inactivation of Transforming Growth Factor beta Receptor Type II in the Presence of Mutated Apc, Promoting Colorectal Cancer Proliferation. PLoS One. 2016;11:e0166422
56. Zhong Y, Peng F, Luo X, Wang X, Yang B, Tang X. et al. A pyroptosis-related gene signature for prognostic and immunological evaluation in breast cancer. Front Oncol. 2022;12:964508
57. Hou J, Zhao R, Xia W, Chang CW, You Y, Hsu JM. et al. PD-L1-mediated gasdermin C expression switches apoptosis to pyroptosis in cancer cells and facilitates tumour necrosis. Nat Cell Biol. 2020;22:1264-75
58. Xia XH, Yin WJ, Mao JF, Liu P, Qin CD, Hu JJ. et al. The expression profile of Gasdermin C-related genes predicts the prognosis and immunotherapy response of pancreatic adenocarcinoma. Am J Cancer Res. 2023;13:1240-58
59. Khan M, Ai M, Du K, Song J, Wang B, Lin J. et al. Pyroptosis relates to tumor microenvironment remodeling and prognosis: A pan-cancer perspective. Front Immunol. 2022;13:1062225
60. Shi Y, Li K, Yuan Y, Wang C, Yang Z, Zuo D. et al. Comprehensive analysis of m6A modification in immune infiltration, metabolism and drug resistance in hepatocellular carcinoma. Cancer Cell Int. 2024;24:138
61. Pathria P, Louis TL, Varner JA. Targeting Tumor-Associated Macrophages in Cancer. Trends Immunol. 2019;40:310-27
62. Kim DK, Jeong J, Lee DS, Hyeon DY, Park GW, Jeon S. et al. PD-L1-directed PlGF/VEGF blockade synergizes with chemotherapy by targeting CD141(+) cancer-associated fibroblasts in pancreatic cancer. Nat Commun. 2022;13:6292
63. Tanaka A, Sakaguchi S. Regulatory T cells in cancer immunotherapy. Cell Res. 2017;27:109-18
64. Adamczyk A, Pastille E, Kehrmann J, Vu VP, Geffers R, Wasmer MH. et al. GPR15 Facilitates Recruitment of Regulatory T Cells to Promote Colorectal Cancer. Cancer Res. 2021;81:2970-82
65. Ding Y, Li Z, Wang H, Wang Q, Jiang H, Yu Z. et al. CTSK and PLAU as Prognostic Biomarker and Related to Immune Infiltration in Pancreatic Cancer: Evidence from Bioinformatics Analysis and qPCR. Int J Genomics. 2023;2023:3914687
66. Fu D, Hu Z, Ma H, Xiong X, Chen X, Wang J. et al. PLAU and GREM1 are prognostic biomarkers for predicting immune response in lung adenocarcinoma. Medicine (Baltimore). 2024;103:e37041
67. D'Urso CM, Wang ZG, Cao Y, Tatake R, Zeff RA, Ferrone S. Lack of HLA class I antigen expression by cultured melanoma cells FO-1 due to a defect in B2m gene expression. J Clin Invest. 1991;87:284-92
68. Afsahi A, Silvestri CM, Moore AE, Graham CF, Bacchiochi K, St-Jean M. et al. LCL161 enhances expansion and survival of engineered anti-tumor T cells but is restricted by death signaling. Front Immunol. 2023;14:1179827
69. Wang M, Chen Q, Wang S, Xie H, Liu J, Huang R. et al. Super-enhancers complexes zoom in transcription in cancer. J Exp Clin Cancer Res. 2023;42:183
70. Yu D, Yang X, Lin J, Cao Z, Lu C, Yang Z. et al. Super-Enhancer Induced IL-20RA Promotes Proliferation/Metastasis and Immune Evasion in Colorectal Cancer. Front Oncol. 2021;11:724655
71. Liu S, Wang Z, Hu L, Ye C, Zhang X, Zhu Z. et al. Pan-cancer analysis of super-enhancer-induced LINC00862 and validation as a SIRT1-promoting factor in cervical cancer and gastric cancer. Transl Oncol. 2024;45:101982
72. Ke H, Li P, Li Z, Zeng X, Zhang C, Luo S. et al. Immune profiling of the macroenvironment in colorectal cancer unveils systemic dysfunction and plasticity of immune cells. Clin Transl Med. 2025;15:e70175
Author contact
![]() Corresponding authors: Jiaqiu Li, lijqedu.cn, Zhong Lu, luzhongedu.cn, Yanfang Chen, sudachenyanfangcom.
Corresponding authors: Jiaqiu Li, lijqedu.cn, Zhong Lu, luzhongedu.cn, Yanfang Chen, sudachenyanfangcom.