Impact Factor ISSN: 1837-9664

 Global reach, higher impact
J Cancer 2025; 16(14):4219-4232. doi:10.7150/jca.118622 This issue Cite
Research Paper
Integrative Analysis of GEO Datasets and Mendelian Randomization Reveals a Potential Role ofISOC1 in Renal Cell Carcinoma
Jingsong Wang1,2,#, Yunxun Liu1,2,#, Zhiwei Yan1,2,#, Qianxue Lu1,2, Jun Jian1,2, Xiuheng Liu1,2, Zhiyuan Chen1,2, Qingyuan Zheng1,2, ![]() , Shanshan Wan3,
, Shanshan Wan3, ![]() , Lei Wang1,2,
, Lei Wang1,2, ![]()
1. Department of Urology, Renmin Hospital of Wuhan University, Wuhan, Hubei, China.
2. Institute of Urologic Disease, Renmin Hospital of Wuhan University, Wuhan, Hubei, China.
3. Department of Ophthalmology, Renmin Hospital of Wuhan University, Wuhan, Hubei, China.
# these authors contributed equally to this work.
Received 2025-5-31; Accepted 2025-7-24; Published 2025-10-10
Abstract

Background: Renal cell carcinoma (RCC) is a leading malignancy of the urinary system, with clear cell RCC (ccRCC) being the most prevalent subtype. Despite advances in treatment, the prognosis of advanced RCC remains poor, and the molecular mechanisms underlying its pathogenesis are not fully understood.
Methods: This study utilized multiple renal cancer cohorts from the Gene Expression Omnibus (GEO) database to identify differentially expressed genes (DEGs). By integrating Mendelian randomization (MR) analyses of expression quantitative trait loci (eQTL) and protein quantitative trait loci (pQTL), we investigated causal associations between candidate genes and RCC. Immune infiltration, drug sensitivity, and survival analyses were performed to further explore functional significance. In vitro experiments validated the biological role ofISOC1 in RCC progression.
Results: We focused on ISOC1, a gene previously implicated in other malignancies but not well studied in RCC. Through integrative MR analysis, we identified ISOC1 as a novel RCC-associated gene, with potential tumor-suppressive functions in this specific context. ISOC1 expression was significantly linked to tumor immune infiltration, drug sensitivity, and patient prognosis. Functional assays demonstrated that ISOC1 knockdown promoted RCC cell proliferation, migration, and invasion.
Conclusions: ISOC1 plays a critical role in RCC progression and may act as a tumor suppressor. These findings highlight ISOC1 as a potential biomarker for prognosis and a promising target for therapeutic intervention in RCC. Moreover, this study underscores the utility of MR-based integrative analyses in uncovering novel molecular mechanisms and therapeutic targets for cancer.
Keywords: renal cell carcinoma, eQTL, pQTL, Mendelian randomization
Introduction
Renal cell carcinoma (RCC) is a major malignancy of the urinary system and represents the most common type of kidney malignant tumor. RCC is classified into several subtypes based on histological features, with clear cell renal cell carcinoma (ccRCC) being the most prevalent, accounting for approximately 70-80% of all RCC cases1,2. In addition to ccRCC, other notable subtypes include papillary renal cell carcinoma (Papillary RCC) and chromophobe renal cell carcinoma (Chromophobe RCC)3. The exact etiology of RCC remains incompletely understood, but several risk factors have been identified, including smoking, obesity, hypertension, and certain genetic conditions. RCC is typically asymptomatic in its early stages, and many patients are diagnosed only when the tumor has reached a considerable size or has metastasized4. For early-stage RCC with smaller tumors, partial nephrectomy can yield favorable outcomes5. However, in cases of larger tumors, radical nephrectomy is often required, placing significant psychological and financial burdens on patients. While surgical intervention for localized RCC can offer a relatively favorable prognosis, the prognosis for advanced or metastatic disease remains poor6. Despite recent advances in targeted therapies and immunotherapy, the risk of recurrence and metastasis remains high7,8. Due to its insidious onset and propensity for recurrence and metastasis, RCC treatment continues to pose significant challenges. Enhancing early detection methods and identifying new molecular targets remain key focuses of ongoing research.
Mendelian Randomization (MR) is a sophisticated methodological approach that employs genetic variants as instrumental variables to investigate causal relationships. It is extensively utilized in epidemiological research, particularly for elucidating the causal links between environmental factors, lifestyle behaviors, biomarkers, and diseases9. By capitalizing on the random inheritance of genetic variation, MR effectively mitigates confounding and reverse causation, common limitations of traditional observational studies, thereby offering more robust and reliable causal inferences10. eQTL (expression quantitative trait locus) refers to loci associated with variations in gene expression levels. By examining the relationship between genetic variants, such as single nucleotide polymorphisms (SNPs), and gene expression, eQTL studies aim to identify genetic variations that influence transcriptional activity, thereby impacting disease susceptibility or phenotypic traits11-13. Employing eQTL in Mendelian randomization analysis allows for a deeper understanding of how genetic variations can alter gene expression to modulate complex traits or disease predisposition14. In contrast, pQTL (protein quantitative trait locus) pertains to loci associated with variations in protein levels. Mendelian randomization leveraging pQTL primarily focuses on how genetic variations affect protein expression, post-translational modifications, or protein functionality15. By investigating the associations between genetic variations and protein expression levels, pQTL studies provide valuable insights into how genetic factors influence protein quantity or function, further elucidating the molecular mechanisms underlying diseases16,17. While eQTL and pQTL can be studied separately, they are often interconnected. Integrating both eQTL and pQTL in Mendelian randomization analysis offers a powerful approach to identify potential targets and mechanisms driving disease pathogenesis.
In our study, we initially identified differentially expressed genes (DEGs) through analysis of multiple renal cancer cohorts from the Gene Expression Omnibus (GEO) database. Subsequently, by integrating eQTL and pQTL Mendelian randomization analyses, we uncovered a robust genetic association between isochorismatase domain-containing protein 1(ISOC1) and renal cancer. Among the genes identified as significantly associated with renal cell carcinoma through eQTL MR analysis, ISOC1 was the only gene that also demonstrated a strong causal association at the protein level, as revealed by pQTL MR analysis. This dual-layer evidence suggested that ISOC1 may play a crucial role in RCC pathogenesis and warranted further investigation through functional experiments. This finding was further substantiated through immune infiltration analysis, drug sensitivity profiling, and survival prognosis analysis. Finally, in vitro experiments confirmed that the downregulation of ISOC1 significantly enhanced the proliferation, migration, and invasion of RCC cells.
Materials and Methods
Data collection and identification of DEGs
We downloaded transcriptomic data of five renal cancer cohorts from the GEO database and performed data correction separately. Four of these datasets were merged, followed by principal component analysis (PCA) for data normalization and batch effect correction. Differential expression analysis was performed on the merged data using the “limma” R package, applying a significance threshold of a corrected P-value < 0.05 and an absolute log fold change (logFC) > 0.585 to identify DEGs. Volcano plots and heatmaps of the DEGs were generated using the “pheatmap” R package."
eQTL and pQTL summary statistics
We retrieved peripheral blood eQTL data from 5,311 European individuals in the Genome-Wide Association Study (GWAS) database (https://gwas.mrcieu.ac.uk/)18 and employed the “TwoSampleMR” R package to identify SNPs with strong associations (p < 5 × 10⁻⁸) as instrumental variables. To minimize potential confounding, we set the linkage disequilibrium (LD) threshold at r2 < 0.001 and a clustering distance of 10,000 kb. Additionally, we applied a filter of F-statistic > 10 to remove SNPs with weak associations or insufficient phenotypic variance explanation. Our PQTL data originated from the study by Ferkingstad, E. et al.19, which examined plasma protein levels of 35,559 analytes in 4,907 Icelandic individuals. We obtained the raw PQTL data from the website (https://www.decode.com/summarydata/) and conducted association analysis and linkage disequilibrium correction using the same methodology employed for the previously described eQTL analysis.
Mendelian randomization (MR) analysis
The outcome data for this study is derived from the Finnish database (https://www.finngen.fi/en/access_results) with the dataset ID “finn-b- C3_KIDNEY_NOTRENALPELVIS_EXALLC”. It encompasses 971 kidney cancer cases and 174,006 controls from the European population, comprising a total of 16,380,308 SNPs.
We performed a two-sample MR analysis to assess the causal relationship between the exposure and the outcome based on the “TwoSampleMR” R package. The inverse-variance weighted (IVW) method was used to combine the estimates, and sensitivity analyses were performed using the MR- Egger and weighted median methods to evaluate the potential presence of pleiotropy. To assess the robustness of the results, we conducted several sensitivity analyses, including leave-one-out analysis to identify influential variants. Genes identified as positive in the Mendelian randomization analysis were selected based on the following criteria: (1) the p-value from the inverse variance weighted (IVW) method was less than 0.05; (2) the direction of the odds ratios (OR) was consistent across all five analysis methods; and (3) the p-value from the pleiotropy test was greater than 0.05, indicating no significant pleiotropy. To assess the consistency of genetic instrument effects, we also performed heterogeneity tests using Cochran's Q test. Genetic instruments with a p-value from the Q test greater than 0.05 were considered to have consistent effects across the study samples, and no significant heterogeneity was observed. Finally, to identify potential causal genes, we performed a cross-validation analysis between the genes identified through Mendelian randomization and DEGs.
Gene function enrichment analysis
Gene Ontology (GO) enrichment analysis was performed to categorize the biological functions of the intersection genes into three categories: biological processes (BP), molecular functions (MF), and cellular components (CC). We utilized the “clusterProfiler” R package to assess the enrichment of GO terms, with a significance threshold of p-value < 0.05. Additionally, Kyoto Encyclopedia of Genes and Genomes (KEGG) pathway enrichment analysis was conducted to identify relevant pathways, with candidate genes mapped to known KEGG pathways and statistical significance evaluated. Gene Set Enrichment Analysis (GSEA) was performed to investigate the biological pathways associated with the high and low expression of the gene “ISOC1”. Pathways with an FDR < 0.25 were considered significantly enriched. GSEA results were visualized, and additional enrichment analyses were conducted using the “clusterProfiler” R package.
Immune cell infiltration analysis
To investigate the immune cell infiltration associated with ISOC1 expression in the TCGA-KIRC cohort, we used the CIBERSORT algorithm, which estimates the relative abundance of 22 immune cell types from gene expression profiles. All RCC samples were stratified into two groups based on the median expression level ofISOC1. CIBERSORT was applied to analyze immune cell infiltration in each group, and the relative abundance of each immune cell type was compared between the two groups to assess the impact ofISOC1 expression on the tumor immune microenvironment.
Drug sensitivity analysis
Drug sensitivity was evaluated by estimating the half maximal inhibitory concentration (IC50) values for a variety of chemotherapeutic agents using the “oncePredict” R package. The IC50 represents the concentration of a drug required to inhibit cell viability by 50%. The IC50 values for each group were calculated and compared to assess the differential drug sensitivity associated with ISOC1 expression.
Cell culture and treatment
The human ccRCC cell lines 786-O, 769-P and normal kidney tubular epithelial cell HK-2 used in this study were obtained from the American-Type Culture Collection (ATCC) and authenticated by STR profiling to ensure the correctness of the cell line. The 786-O and 769-P cell lines were cultured in RPMI 1640 (Cytiva, Logan Utah, USA) supplemented with10% fetal bovine serum media (FBS) (GIBCO, Grand Island, NY, USA), while the HK-2 cell line was cultured in Ham's F-12K/10% fetal bovine serum media. The cells were maintained in a humidified incubator at 37°C with 5% CO2 and passaged at a ratio of 1:3 using 0.25% Trypsin-EDTA when confluence reached 80-90%.
Small interfering RNA (siRNA) targeting ISOC1 and a non-targeting siRNA control were purchased from Sangon Biotech (Shanghai, China). Transfection was performed using Lipo8000 transfection reagent (Beyotime, Shanghai, China) according to the manufacturer's instructions. After 48 hours of incubation, the efficiency of ISOC1 knockdown was confirmed by RT-qPCR. Cells were then subjected to downstream experiments.
RNA isolation and quantitative real-time PCR (RT-qPCR)
Total RNA was extracted from cultured cells using the TRIzol reagent (Invitrogen, Carlsad, CA, USA) according to the manufacturer's instructions. cDNA was synthesized from 1µg of total RNA using the cDNA synthesis kit (Takara, Shiga, Japan). RT-qPCR was performed using TB Green Premix Ex Taq (Takara, Shiga, Japan) on a QuantStudio 5 RT-qPCR system (Thermo Fisher Scientific, USA). Gene expression was normalized to GAPDH and relative expression levels were calculated using the 2-ΔΔCt method. Primer sequences are listed in Supplemental Table 1.
Immunohistochemistry (IHC) staining
The ccRCC tumor samples and their corresponding adjacent normal tissue samples used in our study were obtained from surgical patients at the Department of Urology, Renmin Hospital of Wuhan University. All experiments were conducted in strict accordance with relevant ethical guidelines. Tissue samples were fixed with 4% paraformaldehyde and cut into 4-5 µm thick sections. After dewaxing and rehydration, the sections were washed with PBS. Endogenous peroxidase activity was blocked with 3% hydrogen peroxide, followed by blocking nonspecific binding sites with 5% BSA. The sections were incubated overnight at 4°C with ISOC1 antibody (mouse monoclonal, 1:50, Santa Cruz Biotechnology, Dallas, Texas, USA). The next day, the sections were washed with PBS and incubated with HRP-conjugated secondary antibody at room temperature for 1 hour. After staining by DAB chromogen, the protein expression was observed and analyzed under a microscope. Protein levels were quantified using ImageJ software.
Transwell invasion assay
Cell invasion was assessed using Matrigel-coated Transwell inserts (8-μm pores, Corning, USA). 1 × 10⁵ cells in serum-free medium were seeded into the upper chamber, with medium containing 10% FBS in the lower chamber as a chemoattractant. After 24 hours at 37°C, non-invasive cells were removed, and invaded cells on the lower membrane surface were fixed with 4% paraformaldehyde, stained with 0.1% crystal violet, and counted in five random fields under a microscope.
Wound healing assay
Cells were seeded in 6-well plates and grown to nearly 100% confluence. A sterile pipette tip was used to create a scratch across the cell monolayer. The cells were washed with PBS to remove debris and then cultured in serum-free medium. Images of the wound area were captured at 0 hours and 24 hours using a light microscope.
EdU (5-Ethynyl-2'-deoxyuridine) assay
Cell proliferation was assessed using the Click-iT EdU-594 Cell Proliferation Kit (Servicebio, Wuhan, China). Cells were seeded in 24-well plates and cultured to approximately 70-80% confluence. The cells were then incubated with EdU solution at a final concentration of 10 µM for 2 hours. After incubation, the cells were fixed with 4% paraformaldehyde for 15 minutes and washed with PBS to remove the fixative. The nuclei were stained with Hoechst dye. Finally, images were captured using a fluorescence microscope, and the percentage of EdU-positive cells was analyzed to assess cell proliferation.
Statistical analysis
All statistical analyses were performed using the R software (4.4.1) and GraphPad Prism 8. Data are presented as mean ± standard deviation (SD) unless otherwise specified. Comparisons between two groups were conducted using the Student's t-test. All experiments were performed at least three times. Correlation analyses were conducted using Pearson or Spearman correlation coefficients, as appropriate. Statistical significance was set at P < 0.05.
Results
Data processing and acquisition of differentially expressed genes
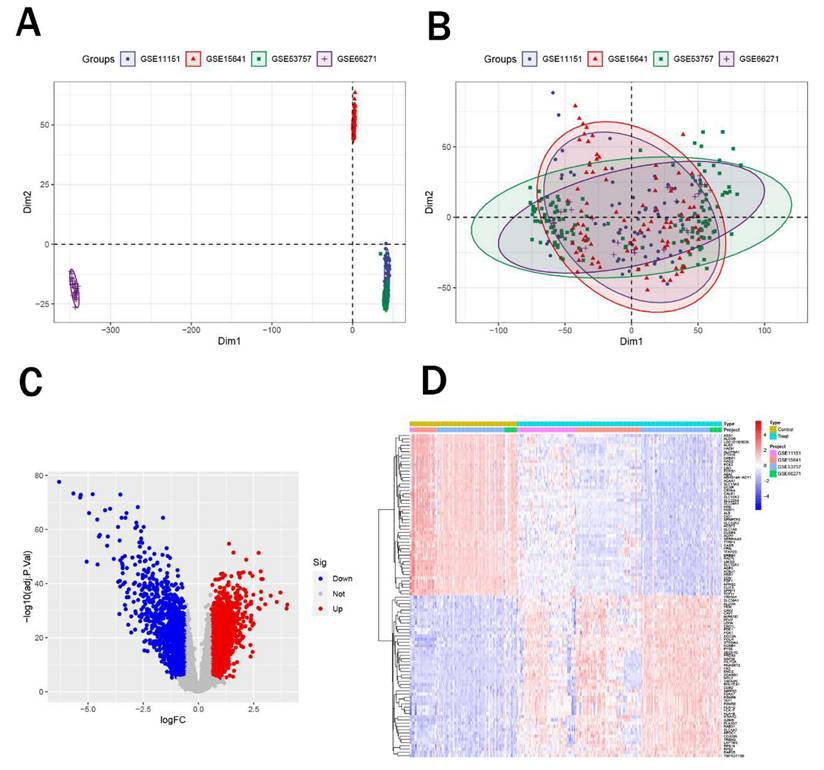
Initially, we obtained five renal cancer datasets from the GEO database, with their detailed characteristics summarized in Table 1. Among these, GSE61441 was designated for subsequent external validation. Subsequently, we integrated the remaining four datasets (GSE11151, GSE15641, GSE53757, and GSE66271) and performed principal component analysis (PCA) to eliminate batch effects. Notably, after correction, samples from four datasets all showed enhanced uniformity (Figure 1A-B). Afterwards, we performed differential expression analysis on the merged data to identify differentially expressed genes. We identified a total of 1,228 upregulated genes and 1,564 downregulated genes (Figure 1C) and figure 1D displayed the top 50 significantly upregulated and downregulated genes.
Summary of five GEO renal cancer datasets
| GEO ID | Samples | Platform ID | Organism | Last update date | Experiment type | Tissues |
|---|---|---|---|---|---|---|
| GSE11151 | 5 controls and 62 tumors | GPL570 | Homo sapiens | 8-Aug-24 | Array | Kidney tissues |
| GSE15641 | 23 controls and 69 tumors | GPL96 | Homo sapiens | 10-Aug-18 | Array | Kidney tissues |
| GSE53757 | 72 controls and 72 tumors | GPL570 | Homo sapiens | 25-Mar-19 | Array | Kidney tissues |
| GSE66271 | 13 controls and 13 tumors | GPL570 | Homo sapiens | 24-Jul-19 | Array | Kidney tissues |
| GSE61441 | 46 controls and 46 tumors | GPL13534 | Homo sapiens | 22-Mar-19 | Array | Kidney tissues |
Identification of differentially expressed genes. (A-B) PCA plots showing sample distribution before (A) and after (B) batch effect correction across four renal cancer datasets. (C) Volcano plot of DEGs, with 1,228 upregulated (red) and 1,564 downregulated (blue) genes. (D) Heatmap of the top 50 significantly upregulated and downregulated genes.
Mendelian randomization analysis and intersection genes
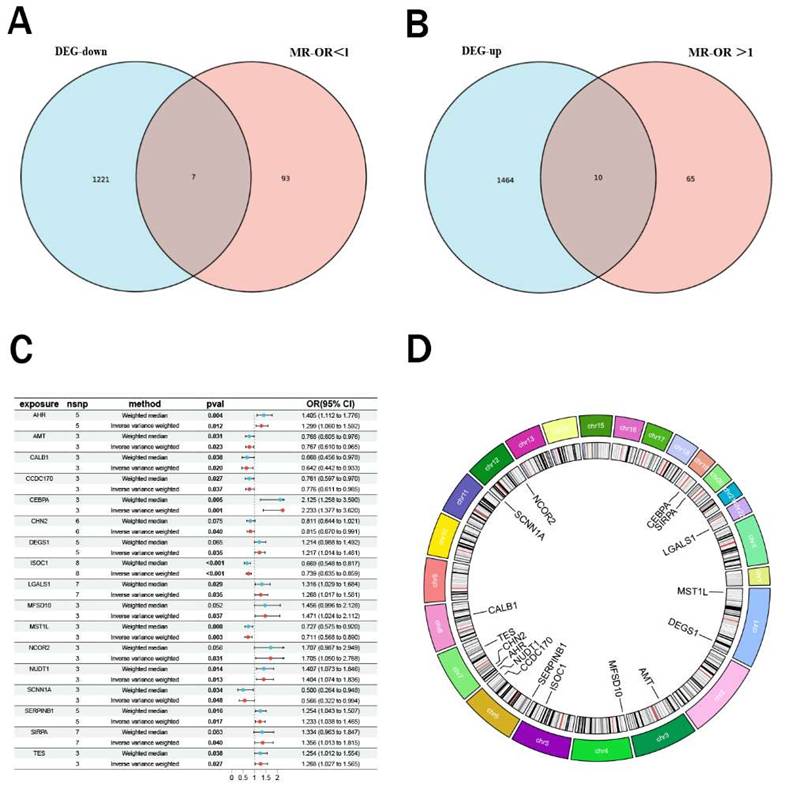
Using peripheral blood eQTL data of peripheral blood from the GWAS database and renal malignant tumor data from the Finnish cohort, we performed Mendelian randomization analysis. Based on the predefined screening criteria, we identified 175 genes associated with malignant neoplasm of kidney. By intersecting these with the differentially expressed genes, we identified 17 intersection genes, including 7 downregulated and 10 upregulated genes (Figure 2A-B). Subsequently, we performed Mendelian randomization analysis on these 17 genes to determine their individual effects on renal cancer. In the Mendelian randomization analysis using the IVW method, all 17 genes exhibited P- values less than 0.05, indicating a strong causal relationship with renal cancer. For the 10 upregulated genes, the odds ratios (OR) from all analysis methods were greater than 1, suggesting a significant positive causal association with renal cancer, while the downregulated genes showed the opposite trend (Figure 2C). We also conducted pleiotropy and heterogeneity tests, and the results showed P-values greater than 0.05 for all genes, indicating that pleiotropy and heterogeneity did not significantly impact the findings. Additionally, leave-one-out sensitivity analysis revealed that the effect sizes of individual SNP were close to the overall effect size, further confirming the robustness of our results. Detailed information on these 17 genes and the complete results of the Mendelian randomization analysis were provided in Table 2, with corresponding forest plots, scatter plots, and funnel plots in Supplementary Figure 1. Figure 2D illustrated the specific chromosomal locations of these 17 genes.
Mendelian randomization analysis and intersection analysis. (A-B) Venn diagram showing 17 intersection genes (10 upregulated, 7 downregulated) identified by intersecting 175 Mendelian randomization genes with DEGs. (C) Forest plot of odds ratios (ORs) indicating significant causal associations of all 17 genes with renal cancer (P < 0.05). (D) Chromosomal locations ofthe 17 intersection genes.
Specific eQTL MR analysis results of the 17 intersection genes
| id.exposure | id.outcom outcome | exposure method | nsnp | b | se | pval | lo_ci | up_ci | or | or_lci95 | or_uci95 | |
|---|---|---|---|---|---|---|---|---|---|---|---|---|
| eqtl-a-ENSG00000 12CK9u | Malignant neoplasm of kidney | AHR | MR Egger | 5 | 0.349773 | 0.16152 | 0.118956 | 0.033195 | 0.666352 | 1.418746 | 1.033752 | 1.947121 |
| eqtl-a-ENSG00000 12CK9u | Malignant neoplasm of kidney | AHR | Weighted | 5 | 0.340134 | 0.119582 | 0.00445 | 0.105752 | 0.574515 | 1.405135 | 1.111547 | 1.776269 |
| eqtl-a-ENSG00000 12CK9u | Malignant neoplasm of kidney | AHR | Inverse va | 5 | 0.261444 | 0.10383 | 0.011802 | 0.057937 | 0.46495 | 1.298804 | 1.059649 | 1.591935 |
| eqtl-a-ENSG00000 12CK9u | Malignant neoplasm of kidney | AHR | Simple m | 5 | 0.332979 | 0.196882 | 0.166047 | -0.05291 | 0.718869 | 1.395119 | 0.948465 | 2.05211 |
| eqtl-a-ENSG00000 12CK9u | Malignant neoplasm of kidney | AHR | Weighted | 5 | 0.359505 | 0.131335 | 0.05205 | 0.102088 | 0.616923 | 1.432621 | 1.107481 | 1.853216 |
| eqtl-a-ENSG00000 9D8ME4 | Malignant neoplasm of kidney | AMT | MR Egger | 3 | -0.37196 | 0.346433 | 0.477389 | -1.05097 | 0.307049 | 0.689382 | 0.349599 | 1.359408 |
| eqtl-a-ENSG00000 9D8ME4 | Malignant neoplasm of kidney | AMT | Weighted | 3 | -0.26336 | 0.1219 | 0.030738 | -0.50228 | -0.02443 | 0.768467 | 0.605148 | 0.975862 |
| eqtl-a-ENSG00000 9D8ME4 | Malignant neoplasm of kidney | AMT | Inverse va | 3 | -0.26496 | 0.11688 | 0.023396 | -0.49404 | -0.03587 | 0.76724 | 0.610156 | 0.964765 |
| eqtl-a-ENSG00000 9D8ME4 | Malignant neoplasm of kidney | AMT | Simple m | 3 | -0.1887 | 0.175061 | 0.393811 | -0.53182 | 0.15442 | 0.828036 | 0.587536 | 1.166981 |
| eqtl-a-ENSG00000 9D8ME4 | Malignant neoplasm of kidney | AMT | Weighted | 3 | -0.28318 | 0.121407 | 0.144895 | -0.52114 | -0.04522 | 0.753382 | 0.593843 | 0.955782 |
| eqtl-a-ENSG00000 zlrvEZ | Malignant neoplasm of kidney | CALB1 | MR Egger | 3 | -0.1062 | 1.106795 | 0.939101 | -2.27552 | 2.063118 | 0.899245 | 0.102744 | 7.870471 |
| eqtl-a-ENSG00000 zlrvEZ | Malignant neoplasm of kidney | CALB1 | Weighted | 3 | -0.40344 | 0.194294 | 0.037853 | -0.78426 | -0.02262 | 0.668018 | 0.456459 | 0.97763 |
| eqtl-a-ENSG00000 zlrvEZ | Malignant neoplasm of kidney | CALB1 | Inverse va | 3 | -0.44308 | 0.190578 | 0.020077 | -0.81661 | -0.06954 | 0.642058 | 0.441928 | 0.93282 |
| eqtl-a-ENSG00000 zlrvEZ | Malignant neoplasm of kidney | CALB1 | Simple m | 3 | -0.40764 | 0.274806 | 0.27622 | -0.94626 | 0.130977 | 0.665216 | 0.388189 | 1.139941 |
| eqtl-a-ENSG00000 zlrvEZ | Malignant neoplasm of kidney | CALB1 | Weighted | 3 | -0.39882 | 0.220097 | 0.211673 | -0.83021 | 0.032568 | 0.671111 | 0.435957 | 1.033104 |
| eqtl-a-ENSG00000 q8Ydpb | Malignant neoplasm of kidney | CCDC170 | MR Egger | 3 | -0.4584 | 0.19237 | 0.252952 | -0.83544 | -0.08135 | 0.632296 | 0.433682 | 0.921867 |
| eqtl-a-ENSG00000 q8Ydpb | Malignant neoplasm of kidney | CCDC170 | Weighted | 3 | -0.27339 | 0.123832 | 0.02726 | -0.5161 | -0.03068 | 0.760795 | 0.596843 | 0.969784 |
| eqtl-a-ENSG00000 q8Ydpb | Malignant neoplasm of kidney | CCDC170 | Inverse va | 3 | -0.25401 | 0.122007 | 0.037348 | -0.49314 | -0.01488 | 0.775683 | 0.610703 | 0.985232 |
| eqtl-a-ENSG00000 q8Ydpb | Malignant neoplasm of kidney | CCDC170 | Simple m | 3 | -0.25273 | 0.175144 | 0.285805 | -0.59602 | 0.09055 | 0.776675 | 0.551002 | 1.094776 |
| eqtl-a-ENSG00000 q8Ydpb | Malignant neoplasm of kidney | CCDC170 | Weighted | 3 | -0.28553 | 0.136483 | 0.171537 | -0.55303 | -0.01802 | 0.751619 | 0.575203 | 0.982143 |
| eqtl-a-ENSG00000ylnzDz | Malignant neoplasm of kidney | CEBPA | MR Egger | 3 | 0.403433 | 0.847201 | 0.717071 | -1.25708 | 2.063946 | 1.496955 | 0.284483 | 7.876991 |
| eqtl-a-ENSG00000ylnzDz | Malignant neoplasm of kidney | CEBPA | Weighted | 3 | 0.753704 | 0.267544 | 0.004846 | 0.229317 | 1.278092 | 2.124857 | 1.257741 | 3.589783 |
| eqtl-a-ENSG00000ylnzDz | Malignant neoplasm of kidney | CEBPA | Inverse va | 3 | 0.803187 | 0.246591 | 0.001125 | 0.319868 | 1.286506 | 2.232645 | 1.376946 | 3.620118 |
| eqtl-a-ENSG00000ylnzDz | Malignant neoplasm of kidney | CEBPA | Simple m | 3 | 0.711711 | 0.337666 | 0.1696 | 0.049886 | 1.373536 | 2.037475 | 1.051152 | 3.949291 |
| eqtl-a-ENSG00000ylnzDz | Malignant neoplasm of kidney | CEBPA | Weighted | 3 | 0.732443 | 0.317208 | 0.147235 | 0.110715 | 1.354172 | 2.080156 | 1.117076 | 3.873551 |
| eqtl-a-ENSG00000 sKm18l | Malignant neoplasm of kidney | CHN2 | MR Egger | 6 | -0.24864 | 0.153882 | 0.181449 | -0.55025 | 0.052971 | 0.779863 | 0.576808 | 1.0544 |
| eqtl-a-ENSG00000 sKm18l | Malignant neoplasm of kidney | CHN2 | Weighted | 6 | -0.20943 | 0.117526 | 0.07475 | -0.43978 | 0.02092 | 0.811046 | 0.644177 | 1.02114 |
| eqtl-a-ENSG00000 sKm18l | Malignant neoplasm of kidney | CHN2 | Inverse va | 6 | -0.20505 | 0.099854 | 0.040027 | -0.40076 | -0.00933 | 0.814609 | 0.66981 | 0.99071 |
| eqtl-a-ENSG00000 sKm18l | Malignant neoplasm of kidney | CHN2 | Simple m | 6 | -0.33625 | 0.206383 | 0.164191 | -0.74076 | 0.068263 | 0.714447 | 0.476753 | 1.070647 |
| eqtl-a-ENSG00000 sKm18l | Malignant neoplasm of kidney | CHN2 | Weighted | 6 | -0.19173 | 0.122196 | 0.177435 | -0.43123 | 0.047776 | 0.825531 | 0.649707 | 1.048936 |
| eqtl-a-ENSG00000 QqATFT | Malignant neoplasm of kidney | DEGS1 | MR Egger | 5 | 0.162062 | 0.167412 | 0.404429 | -0.16607 | 0.490189 | 1.175933 | 0.846991 | 1.632625 |
| eqtl-a-ENSG00000 QqATFT | Malignant neoplasm of kidney | DEGS1 | Weighted | 5 | 0.194207 | 0.105083 | 0.064582 | -0.01175 | 0.400169 | 1.214348 | 0.988314 | 1.492077 |
| eqtl-a-ENSG00000 QqATFT | Malignant neoplasm of kidney | DEGS1 | Inverse va | 5 | 0.196545 | 0.09309 | 0.034743 | 0.014088 | 0.379001 | 1.21719 | 1.014188 | 1.460824 |
| eqtl-a-ENSG00000 QqATFT | Malignant neoplasm of kidney | DEGS1 | Simple m | 5 | 0.263013 | 0.148997 | 0.152287 | -0.02902 | 0.555047 | 1.300843 | 0.971395 | 1.742023 |
| eqtl-a-ENSG00000 QqATFT | Malignant neoplasm of kidney | DEGS1 | Weighted | 5 | 0.186776 | 0.116016 | 0.182704 | -0.04062 | 0.414168 | 1.205357 | 0.960198 | 1.513111 |
| eqtl-a-ENSG00000 k9zPiw | Malignant neoplasm of kidney | ISOC1 | MR Egger | 8 | -0.42557 | 0.191175 | 0.067628 | -0.80028 | -0.05087 | 0.653395 | 0.449205 | 0.950402 |
| eqtl-a-ENSG00000 k9zPiw | Malignant neoplasm of kidney | ISOC1 | Weighted | 8 | -0.40207 | 0.102137 | 8.26E-05 | -0.60226 | -0.20188 | 0.668934 | 0.547574 | 0.817191 |
| eqtl-a-ENSG00000 k9zPiw | Malignant neoplasm of kidney | ISOC1 | Inverse va | 8 | -0.30302 | 0.077223 | 8.71E-05 | -0.45437 | -0.15166 | 0.738586 | 0.634845 | 0.859279 |
| eqtl-a-ENSG00000 k9zPiw | Malignant neoplasm of kidney | ISOC1 | Simple m | 8 | -0.40771 | 0.150757 | 0.030444 | -0.70319 | -0.11223 | 0.665172 | 0.495002 | 0.893842 |
| eqtl-a-ENSG00000 k9zPiw | Malignant neoplasm of kidney | ISOC1 | Weighted | 8 | -0.4044 | 0.098116 | 0.00445 | -0.59671 | -0.21209 | 0.667377 | 0.550622 | 0.808891 |
| eqtl-a-ENSG00000 7RymRD | Malignant neoplasm of kidney | LGALS1 | MR Egger | 7 | 0.316633 | 0.164075 | 0.111518 | -0.00495 | 0.638221 | 1.372499 | 0.995058 | 1.89311 |
| eqtl-a-ENSG00000 7RymRD | Malignant neoplasm of kidney | LGALS1 | Weighted | 7 | 0.274717 | 0.125764 | 0.028933 | 0.02822 | 0.521214 | 1.316158 | 1.028622 | 1.68407 |
| eqtl-a-ENSG00000 7RymRD | Malignant neoplasm of kidney | LGALS1 | Inverse va | 7 | 0.237328 | 0.112545 | 0.034967 | 0.01674 | 0.457916 | 1.267857 | 1.016881 | 1.580776 |
| eqtl-a-ENSG00000 7RymRD | Malignant neoplasm of kidney | LGALS1 | Simple m | 7 | 0.204201 | 0.235664 | 0.419517 | -0.2577 | 0.666103 | 1.226545 | 0.772827 | 1.946637 |
| eqtl-a-ENSG00000 7RymRD | Malignant neoplasm of kidney | LGALS1 | Weighted | 7 | 0.270783 | 0.134202 | 0.090183 | 0.007748 | 0.533819 | 1.310991 | 1.007778 | 1.705433 |
| eqtl-a-ENSG00000 MFtVet | Malignant neoplasm of kidney | MFSD10 | MR Egger | 3 | 0.036844 | 0.485049 | 0.951736 | -0.91385 | 0.987539 | 1.037531 | 0.400977 | 2.68462 |
| eqtl-a-ENSG00000 MFtVet | Malignant neoplasm of kidney | MFSD10 | Weighted | 3 | 0.375514 | 0.19362 | 0.052448 | -0.00398 | 0.755009 | 1.455739 | 0.996027 | 2.12763 |
| eqtl-a-ENSG00000 MFtVet | Malignant neoplasm of kidney | MFSD10 | Inverse va | 3 | 0.385929 | 0.184593 | 0.036555 | 0.024126 | 0.747731 | 1.47098 | 1.02442 | 2.112202 |
| eqtl-a-ENSG00000 MFtVet | Malignant neoplasm of kidney | MFSD10 | Simple m | 3 | 0.847153 | 0.38246 | 0.157143 | 0.097531 | 1.596776 | 2.332996 | 1.102446 | 4.937088 |
| eqtl-a-ENSG00000 MFtVet | Malignant neoplasm of kidney | MFSD10 | Weighted | 3 | 0.329775 | 0.198096 | 0.237879 | -0.05849 | 0.718042 | 1.390655 | 0.943186 | 2.050415 |
| eqtl-a-ENSG00000 VbwQ5C | Malignant neoplasm of kidney | MST1L | MR Egger | 3 | -0.21642 | 0.513604 | 0.746118 | -1.22308 | 0.790243 | 0.805397 | 0.294321 | 2.203932 |
| eqtl-a-ENSG00000 VbwQ5C | Malignant neoplasm of kidney | MST1L | Weighted | 3 | -0.31862 | 0.119929 | 0.00789 | -0.55368 | -0.08356 | 0.72715 | 0.574828 | 0.919835 |
| eqtl-a-ENSG00000 VbwQ5C | Malignant neoplasm of kidney | MST1L | Inverse va | 3 | -0.34108 | 0.114664 | 0.002934 | -0.56582 | -0.11633 | 0.711004 | 0.567895 | 0.890177 |
| eqtl-a-ENSG00000 VbwQ5C | Malignant neoplasm of kidney | MST1L | Simple m | 3 | -0.33519 | 0.15748 | 0.167093 | -0.64385 | -0.02653 | 0.715204 | 0.525268 | 0.973822 |
| eqtl-a-ENSG00000 VbwQ5C | Malignant neoplasm of kidney | MST1L | Weighted | 3 | -0.31493 | 0.114576 | 0.110795 | -0.5395 | -0.09036 | 0.729842 | 0.583043 | 0.913604 |
| eqtl-a-ENSG00000 lGGMY6 | Malignant neoplasm of kidney | NCOR2 | MR Egger | 3 | 0.951572 | 0.96941 | 0.505911 | -0.94847 | 2.851615 | 2.589778 | 0.387333 | 17.31573 |
| eqtl-a-ENSG00000 lGGMY6 | Malignant neoplasm of kidney | NCOR2 | Weighted | 3 | 0.534456 | 0.279122 | 0.055521 | -0.01262 | 1.081534 | 1.706519 | 0.987456 | 2.949201 |
| eqtl-a-ENSG00000 lGGMY6 | Malignant neoplasm of kidney | NCOR2 | Inverse va | 3 | 0.533493 | 0.247254 | 0.030953 | 0.048876 | 1.018111 | 1.704878 | 1.05009 | 2.767962 |
| eqtl-a-ENSG00000 lGGMY6 | Malignant neoplasm of kidney | NCOR2 | Simple m | 3 | 0.422374 | 0.330033 | 0.329009 | -0.22449 | 1.069238 | 1.525579 | 0.798924 | 2.913159 |
| eqtl-a-ENSG00000 lGGMY6 | Malignant neoplasm of kidney | NCOR2 | Weighted | 3 | 0.547228 | 0.299701 | 0.209403 | -0.04019 | 1.134643 | 1.728456 | 0.960611 | 3.110063 |
| eqtl-a-ENSG00000 qr9bM4 | Malignant neoplasm of kidney | NUDT1 | MR Egger | 3 | 0.443846 | 0.281634 | 0.35996 | -0.10816 | 0.995848 | 1.558691 | 0.897488 | 2.707019 |
| eqtl-a-ENSG00000 qr9bM4 | Malignant neoplasm of kidney | NUDT1 | Weighted | 3 | 0.341755 | 0.138436 | 0.013561 | 0.070421 | 0.61309 | 1.407416 | 1.072959 | 1.846127 |
| eqtl-a-ENSG00000 qr9bM4 | Malignant neoplasm of kidney | NUDT1 | Inverse va | 3 | 0.339472 | 0.136799 | 0.013081 | 0.071346 | 0.607598 | 1.404206 | 1.073953 | 1.836015 |
| eqtl-a-ENSG00000 qr9bM4 | Malignant neoplasm of kidney | NUDT1 | Simple m | 3 | 0.159256 | 0.238764 | 0.573423 | -0.30872 | 0.627234 | 1.172638 | 0.734385 | 1.872425 |
| eqtl-a-ENSG00000 qr9bM4 | Malignant neoplasm of kidney | NUDT1 | Weighted | 3 | 0.358488 | 0.145988 | 0.133436 | 0.072351 | 0.644625 | 1.431164 | 1.075033 | 1.905273 |
| eqtl-a-ENSG00000 9Ir75v | Malignant neoplasm of kidney | SCNN1A | MR Egger | 3 | -1.22319 | 1.05292 | 0.452466 | -3.28691 | 0.840537 | 0.294291 | 0.037369 | 2.317612 |
| eqtl-a-ENSG00000 9Ir75v | Malignant neoplasm of kidney | SCNN1A | Weighted | 3 | -0.6931 | 0.3262 | 0.033606 | -1.33245 | -0.05375 | 0.500023 | 0.263829 | 0.94767 |
| eqtl-a-ENSG00000 9Ir75v | Malignant neoplasm of kidney | SCNN1A | Inverse va | 3 | -0.5696 | 0.287489 | 0.047558 | -1.13308 | -0.00612 | 0.56575 | 0.322039 | 0.993895 |
| eqtl-a-ENSG00000 9Ir75v | Malignant neoplasm of kidney | SCNN1A | Simple m | 3 | -0.7713 | 0.465773 | 0.239569 | -1.68422 | 0.141614 | 0.462411 | 0.18559 | 1.152132 |
| eqtl-a-ENSG00000 9Ir75v | Malignant neoplasm of kidney | SCNN1A | Weighted | 3 | -0.72718 | 0.372376 | 0.19008 | -1.45704 | 0.00268 | 0.483271 | 0.232926 | 1.002683 |
| eqtl-a-ENSG00000 GQ85n7 | Malignant neoplasm of kidney | SERPINB1 | MR Egger | 5 | 0.209544 | 0.13757 | 0.225094 | -0.06009 | 0.479181 | 1.233115 | 0.941676 | 1.614752 |
| eqtl-a-ENSG00000 GQ85n7 | Malignant neoplasm of kidney | SERPINB1 | Weighted | 5 | 0.226284 | 0.093881 | 0.015938 | 0.042278 | 0.410291 | 1.253932 | 1.043184 | 1.507256 |
| eqtl-a-ENSG00000 GQ85n7 | Malignant neoplasm of kidney | SERPINB1 | Inverse va | 5 | 0.209342 | 0.087989 | 0.017351 | 0.036884 | 0.3818 | 1.232867 | 1.037573 | 1.464919 |
| eqtl-a-ENSG00000 GQ85n7 | Malignant neoplasm of kidney | SERPINB1 | Simple m | 5 | 0.202517 | 0.175045 | 0.311682 | -0.14057 | 0.545606 | 1.224481 | 0.868862 | 1.725654 |
| eqtl-a-ENSG00000 GQ85n7 | Malignant neoplasm of kidney | SERPINB1 | Weighted | 5 | 0.234177 | 0.097911 | 0.075027 | 0.042271 | 0.426083 | 1.263868 | 1.043177 | 1.531247 |
| eqtl-a-ENSG00000 SmFZJz | Malignant neoplasm of kidney | SIRPA | MR Egger | 7 | 0.009615 | 0.338833 | 0.97846 | -0.6545 | 0.673726 | 1.009661 | 0.519703 | 1.961533 |
| eqtl-a-ENSG00000 SmFZJz | Malignant neoplasm of kidney | SIRPA | Weighted | 7 | 0.288183 | 0.166005 | 0.082566 | -0.03719 | 0.613553 | 1.334001 | 0.963496 | 1.846982 |
| eqtl-a-ENSG00000 SmFZJz | Malignant neoplasm of kidney | SIRPA | Inverse va | 7 | 0.304636 | 0.148604 | 0.040365 | 0.013373 | 0.5959 | 1.356132 | 1.013463 | 1.814663 |
| eqtl-a-ENSG00000 SmFZJz | Malignant neoplasm of kidney | SIRPA | Simple m | 7 | 0.079502 | 0.278155 | 0.784627 | -0.46568 | 0.624687 | 1.082748 | 0.627707 | 1.867661 |
| eqtl-a-ENSG00000 SmFZJz | Malignant neoplasm of kidney | SIRPA | Weighted | 7 | 0.283689 | 0.179803 | 0.165691 | -0.06872 | 0.636102 | 1.32802 | 0.933584 | 1.889103 |
| eqtl-a-ENSG00000 pe7YcH | Malignant neoplasm of kidney | TES | MR Egger | 3 | 0.063144 | 0.290703 | 0.863835 | -0.50663 | 0.632922 | 1.06518 | 0.60252 | 1.883105 |
| eqtl-a-ENSG00000 pe7YcH | Malignant neoplasm of kidney | TES | Weighted | 3 | 0.226342 | 0.109346 | 0.038456 | 0.012024 | 0.440659 | 1.254004 | 1.012097 | 1.553731 |
| eqtl-a-ENSG00000 pe7YcH | Malignant neoplasm of kidney | TES | Inverse va | 3 | 0.237309 | 0.107496 | 0.027272 | 0.026617 | 0.448 | 1.267832 | 1.026974 | 1.565179 |
| eqtl-a-ENSG00000 pe7YcH | Malignant neoplasm of kidney | TES | Simple m | 3 | 0.153909 | 0.17549 | 0.472968 | -0.19005 | 0.497869 | 1.166384 | 0.826917 | 1.645211 |
| eqtl-a-ENSG00000 pe7YcH | Malignant neoplasm of kidney | TES | Weighted | 3 | 0.208419 | 0.115275 | 0.212336 | -0.01752 | 0.434358 | 1.231729 | 0.982632 | 1.543971 |
Function enrichment analysis
To explore the potential biological functions of these 17 genes, we conducted GO and KGEE analyses. The GO analysis revealed that these genes are predominantly associated with functions closely related to gene transcription regulation and signal transduction, regulation of inflammatory response and immune cell activation (Supplemental Figure 1A). KEGG enrichment analysis indicated that these genes potentially involved in a range of key biological metabolic pathways, including folate metabolism, lipid biosynthesis and catabolism, as well as the synthesis and conversion of glyoxylate and dicarboxylates (Supplemental Figure 1B).
pQTL Mendelian randomization
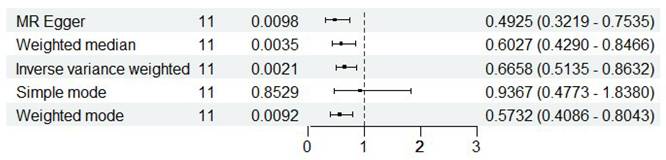
To systematically identify potential target genes for renal cancer, we conducted pQTL Mendelian randomization analysis on the 17 intersection genes previously identified, with the goal of elucidating the causal relationship between the protein levels of these genes and the onset of renal cancer. Due to the limited availability of pQTL data, we were unable to obtain pQTL information for some genes. Nevertheless, our findings demonstrate a robust causal association between the protein levels of ISOC1 and the development of renal cancer. As illustrated in Figure 3, the results from four distinct analytical approaches all yielded p-values below 0.05, with odds ratios (OR) consistently less than 1. This suggested a negative causal relationship between ISOC1 protein levels and renal cancer, aligning with our previous conclusions. Similarly, pleiotropy and heterogeneity tests and leave-one-out sensitivity analysis all ruled out the interference of other confounding factors on the conclusion. The corresponding forest plots, scatter plots, and funnel plots were provided in Supplementary Figure 2.
pQTL Mendelian randomization analysis. Analysis showed a negative causal relationship between ISOC1 protein levels and renal cancer, with P-values < 0.05 and odds ratios (OR) < 1 across four methods.
The expression profile of ISOC1 in clear cell renal cell carcinoma
We initially performed an analysis of the differential expression of 17 intersection genes between renal cancer and adjacent normal tissues using data from the TCGA-KIRC and GSE61441 cohorts (Figure 4A-B) and the results were all consistent with those obtained from eQTL Mendelian randomization analysis, Notably, ISOC1 was found to be highly expressed in adjacent normal tissues compared to tumor tissues. Subsequently, pan-cancer analysis further confirmed that ISOC1 acted as a protective factor for clear cell renal cell carcinoma (Figure 4C). The AUC value ofISOC1 for clear cell renal cell carcinoma was 0.823 in the TCGA-KIBC cohort, indicating that it could serve as a reliable predictor of prognosis (Figure 4D). Survival analysis revealed that individuals with high ISOC1 expression exhibited significantly improved prognosis compared to those with low ISOC1 expression (Figure 4E).
ISOC1 expression and its prognostic value in clear cell renal cell carcinoma (ccRCC) (A-B) Differential expression analysis of 17 co-expressed genes between RCC and adjacent normal tissues in the TCGA-KIRC and GSE61441 cohorts. (C) Pan-cancer analysis confirming ISOC1 as a protective factor for ccRCC. (D) ROC curve showing an AUC value of 0.823 for ISOC1 in predicting prognosis in the TCGA-KIBC cohort. (E) Survival analysis revealing significantly improved prognosis in high ISOC1 expression groups. (F) RT-qPCR showing higher ISOC1 expression in HK-2 cells compared to ccRCC cell lines. (G-H) Immunohistochemical staining demonstrating increased ISOC1 protein levels in adjacent normal tissues. *p < 0.05, **p < 0.01, ***p < 0.001.
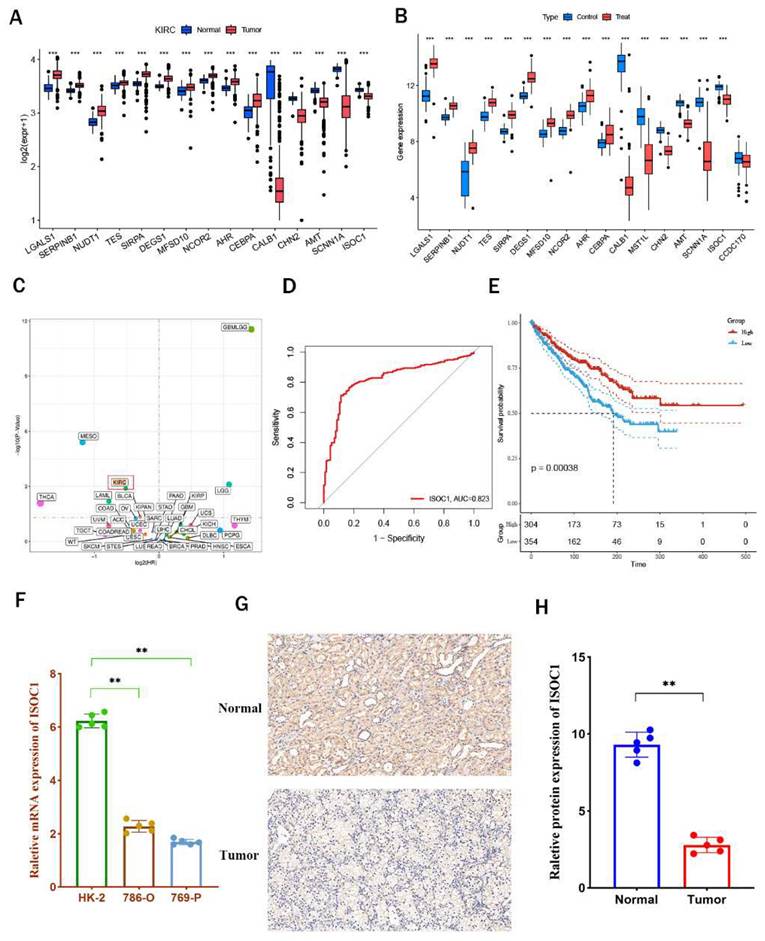
Subsequently, we performed in vitro experiments to further substantiate the expression ofISOC1 in clear cell renal cell carcinoma. RT-qPCR analysis revealed that ISOC1 expression was notably higher in HK-2 cells compared to the two clear cell renal cell carcinoma cell lines (Figure 4F). Additionally, immunohistochemical staining reinforced these observations, showing increased ISOC1 protein levels in adjacent normal tissues (Figure 4G-H), which was in alignment with our earlier analytical results. GSVA enrichment analysis indicated that the high-expression group of ISOC1 showed the most prominent enrichment in fatty acid metabolism, which is a key pathway in the formation and progression of ccRCC. In contrast, the low-expression group ofISOC1 exhibited the highest enrichment scores in the chemokine signaling pathway (Supplemental Figure 3).
Immune cell infiltration and drug sensitivity
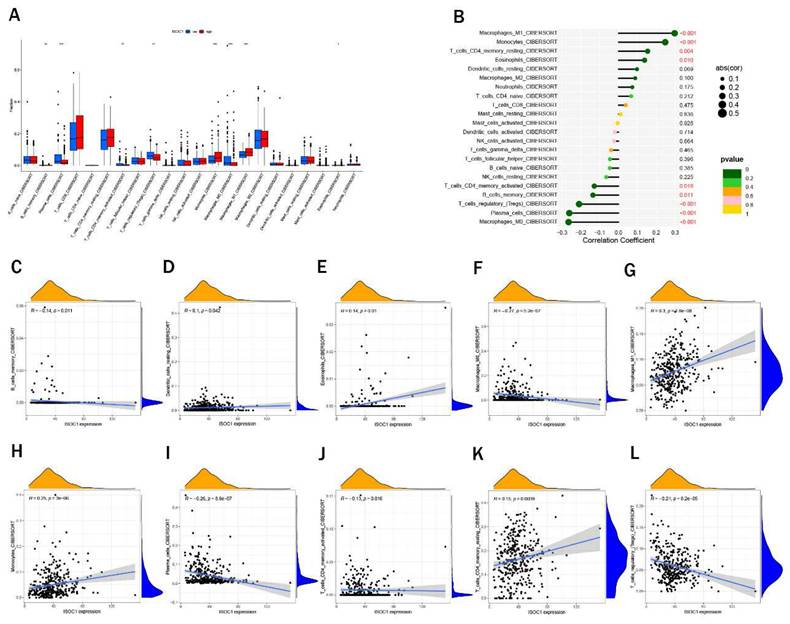
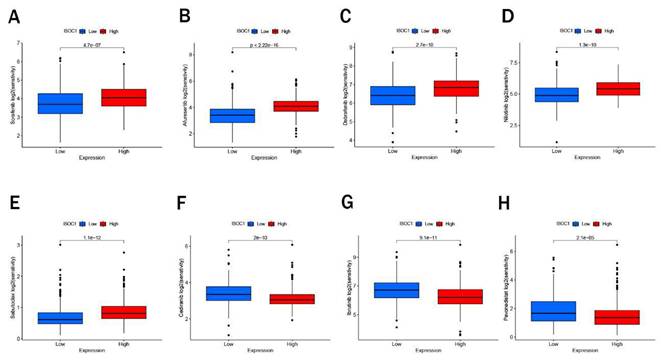
We employed the CIBERSORT algorithm to investigate the association between ISOCI and immune cell infiltration in renal cancer. We observed that lower expression ofISOC1 was strongly associated with a higher proportion of Macrophages M0, Plasma cells, T cells regulatory (Tregs) and B cells memory. In contrast, in the renal cancer cohort with high ISOC1 expression, Macrophages M1, Monocytes and Eosinophils appeared to be more activated (Figure 5A-B). Subsequent scatter plots further demonstrated the correlation between ISOC1 expression levels and the degree of immune cell infiltration. The infiltration levels of B memory cells, macrophage M0, plasma cells, T cells, CD4 memory activated and T cells regulatory (Tregs) showed a negative correlation with ISOC1 expression, whereas Dendritic cells resting, Eosinophils, Macrophages M1, Monocytes and T cells CD4 memory resting exhibited an opposite trend (Figure 5C-L). We also analyzed the association between ISOC1 expression levels and the sensitivity to common targeted therapies and immunotherapies in renal cancer cohorts. The analysis revealed that renal cancer patients with elevated ISOC1 expression demonstrated enhanced sensitivity to Sorafenib, Afuresertib, Dabrafenib, Nilotinib and Sabutoclax. Conversely, individuals with reduced ISOC1 expression appeared to have a more favorable response to Cediranib, Lbrutinib and Pevonedistat therapy (Figure 6).
Immune cell infiltration. (A) Immune cell infiltration profiles in RCC cohorts with low or high ISOC1 expression using CIBERSORT. (B) Correlation between ISOC1 expression and immune cell infiltration in RCC. (C-L) Correlation scatter plots. *p < 0.05, **p < 0.01, ***p < 0.001.
Drug sensitivity. (A-H) Sensitivity to targeted therapies and immunotherapies based on ISOC1 expression.
Knockdown of ISOC1 promoted the proliferation, migration, and invasion of renal cancer cells
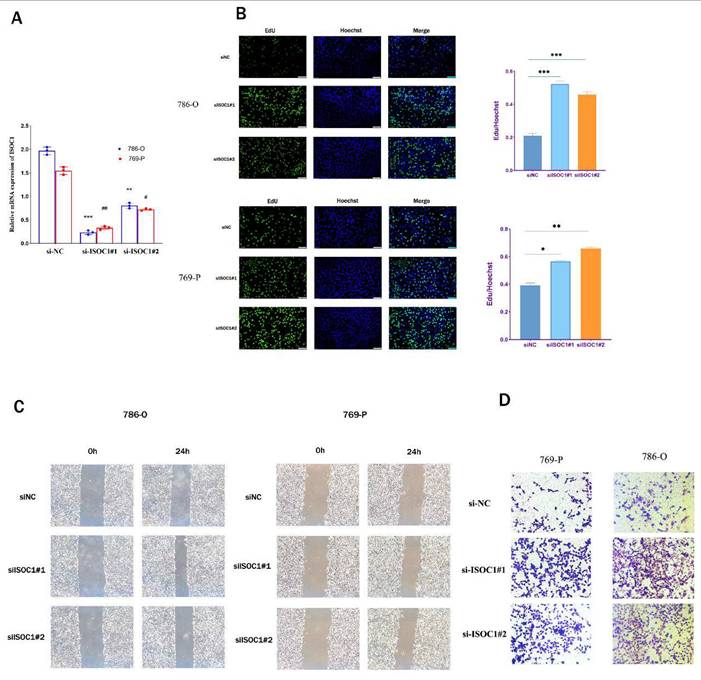
In order to further elucidate the role of ISOC1 in renal cancer, we undertook a series of in vitro experiments to explore its involvement in the progression and metastasis of RCC. Initially, we employed siRNA-mediated silencing of ISOC1 expression, followed by RT-qPCR to assess the knockdown efficiency. Clearly, the expression ofISOC1 was significantly reduced in both the 786- O and 769-P cell lines following siRNA treatment, compared to the control group (Figure 7A). The EdU assay was employed to assess the impact ofISOC1 on the proliferation of RCC cells. In both ISOC1 knockdown RCC cell lines, we observed a significant increase in both the number of cell colonies and the percentage of EdU-positive cells compared to the control group, indicating that ISOC1 downregulation enhances the proliferative capacity of renal cancer cells (Figure 7B). The Transwell assay confirmed that the inhibition of ISOC1 resulted in a reduced invasive ability of RCC cells (Figure 7C). The wound healing assay results demonstrated that ISOC1 promoted the migratory capacity of RCC cells (Figure 7D).
Knockdown of ISOC1 promoted proliferation, migration, and invasion in ccRCC cells. (A) RT-qPCR confirmed effective ISOC1 knockdown in 786-O and 769-P cells. (B) EdU assay showed increased cell proliferation in ISOC1 knockdown groups. (C) Transwell assay revealed enhanced invasion of RCC cells after ISOC1 knockdown. (D) Wound healing assay demonstrated increased migratory capacity in ISOC1-silenced cells. *p < 0.05, **p < 0.01, ***p < 0.001.
Discussion
Renal cell carcinoma (RCC), particularly clear cell renal cell carcinoma (ccRCC), represents a significant challenge in oncology due to its insidious onset, high recurrence risk, and poor prognosis in advanced stages. In this study, we focused on identifying genetic and molecular mechanisms underlying RCC pathogenesis, with an emphasis on the role ofISOC1.
By employing Mendelian Randomization (MR) analyses that integrated eQTL and pQTL data, we identified a robust causal association between ISOC1 and RCC. This multidimensional approach, leveraging genetic, transcriptomic, and proteomic evidence, underscored the critical involvement of ISOC1 in RCC. This integrative approach also elucidates the biological pathways through which ISOC1 may contribute to RCC pathogenesis. For instance, the association ofISOC1 with immune cell infiltration and drug sensitivity underscores its multifaceted role in modulating both tumor behavior and the tumor microenvironment. Such findings are invaluable for identifying molecular targets with therapeutic potential. However, it is important to note some limitations of this methodology. While eQTL and pQTL analyses provide robust insights into gene and protein expression, they may not fully capture post-translational modifications or other layers of regulation influencing protein functionality20. Furthermore, the resolution of MR analyses depends on the quality and comprehensiveness of the genetic and phenotypic datasets used. Despite these limitations, the integration of eQTL and pQTL analyses within an MR framework offers a transformative approach for studying cancer biology21. In the context of RCC, this strategy has not only identified ISOC1 as a key player but also demonstrated the utility of combining genetic, transcriptomic, and proteomic data to uncover novel disease mechanisms. This approach holds promise for broader applications in precision oncology, facilitating the identification of biomarkers and therapeutic targets across diverse malignancies.
ISOC1 is a protein characterized by an isochorismatase-like domain. It can catalyze the conversion of isochorismate into 2,3-dihydroxy-2,3-dihydrobenzoate and pyruvate, suggesting its involvement in enzymatic processes22,23. Although its precise biological functions remain incompletely understood, existing evidence implicates ISOC1 in a range of cellular activities, particularly those related to metabolic regulation. Structurally, ISOC1 is hypothesized to play a role in modulating the synthesis and degradation of specific metabolic intermediates, yet its enzymatic activity and substrate specificity have not been conclusively defined24,25.
In the context of oncology, ISOC1 has garnered attention for its potential role in tumorigenesis26. Initial findings indicate that dysregulated ISOC1 expression may contribute to cancer-associated metabolic reprogramming, influencing cell proliferation and survival through alterations in metabolic pathways. For instance, changes in ISOC1 levels have been linked to shifts in cellular energy metabolism, thereby facilitating tumor growth and progression27-29. These observations suggest that ISOC1 may serve as a crucial mediator of metabolic and signaling networks in malignant transformation. The identification ofISOC1 through both eQTL and pQTL MR analyses underscored its robust genetic association with RCC. This integrative approach not only strengthened the validity of ISOC1 as a candidate gene, but also reflected the value of leveraging multi-omics MR strategies to uncover key regulators in cancer biology.
We performed GSVA enrichment analysis and found that high expression of ISOC1 was strongly associated with fatty acid metabolism. The link between fatty acid metabolism and ccRCC has garnered increasing attention in recent years30. Alterations in fatty acid metabolism are considered one of the key factors in tumor initiation and progression in ccRCC31,32. Tumor cells often undergo metabolic reprogramming to enhance fatty acid uptake, synthesis, and oxidation, adapting to the rapid growth and hypoxic microenvironment33,34. Moreover, fatty acid metabolism modulates immune cell infiltration and immune evasion, influencing the tumor microenvironment35. These findings highlight fatty acid metabolism as a promising therapeutic target in ccRCC.
Despite these advances, the precise molecular mechanisms and functional roles of ISOC1 remain largely unexplored. Notably, research on ISOC1 in renal cell carcinoma is currently lacking, leaving its role in this malignancy an open question for future investigation. Comprehensive studies are essential to elucidate its contributions to renal cancer pathogenesis and assess its potential as a biomarker or therapeutic target.
In conclusion, this study established ISOC1 as a key regulator in the pathogenesis and progression of RCC, illuminating its critical role in tumor biology. By employing MR-based integrative analyses, we provided a sophisticated framework for unraveling intricate oncogenic mechanisms. These findings underscored the potential of ISOC1 as a compelling biomarker and therapeutic target, laying a robust foundation for future advancements in RCC diagnostics and treatment strategies.
Supplementary Material
Supplementary figures.
Acknowledgements
We thank our colleagues in the Department of Urology, Renmin Hospital of Wuhan University, for their support of this work, as well as all colleagues involved in model development and data collection.
Funding
This research was funded by National Natural Science Foundation of China, Grant No. 82000639.
Author contributions
Conceptualization, Qingyuan Zheng and Lei Wang; Data curation, Jingsong Wang, Yunxun Liu and Qianxue Lu; Formal analysis, Jingsong Wang, Yunxun Liu and Jun Jian; Funding acquisition, Lei Wang; Investigation, Qingyuan Zheng, Jingsong Wang, Yunxun Liu and Qianxue Lu; Methodology, Jingsong Wang, Yunxun Liu and Zhiwei Yan; Project administration, Zhiyuan Chen, Xiuheng Liu, Shanshan Wan and Lei Wang; Software, Yunxun Liu; In vitro experiments, Jingsong Wang and Zhiwei Yan; Supervision, Shanshan Wan and Lei Wang; Validation, Jingsong Wang and Zhiwei Yan; Visualization, Jingsong Wang, Zhiyuan Chen and Lei Wang; Writing - original draft, Jingsong Wang and Qingyuan Zheng; Writing - review & editing, Shanshan Wan and Lei Wang.
Data availability statement
The datasets generated and analysed during the current study is in the Gene Expression Omnibus database (GEO), https://www.ncbi.nlm.nih.gov/geo/. The eQTL data is available in the Genome- Wide Association Study (GWAS) database (https://gwas.mrcieu.ac.uk/) and the pQTL data can be obtained from the website (https://www.decode.com/summarydata/).
Competing Interests
The authors have declared that no competing interest exists.
References
1. Jenkins KA, Park M, Pederzoli-Ribeil M, Eskiocak U, Johnson P, Guzman W. et al. XTX101, a tumor-activated, Fc-enhanced anti-CTLA-4 monoclonal antibody, demonstrates tumor-growth inhibition and tumor-selective pharmacodynamics in mouse models of cancer. J Immunother Cancer. 2023 11
2. Tang G, Liu J, Gao X, Tang W, Chen J, Wu M. et al. circWSB1 promotes tumor progression in ccRCC via circWSB1/miR-182-5p/WSB1 axis. Int J Biol Macromol. 2024;256:128338
3. Fukagawa A, Hama N, Totoki Y, Nakamura H, Arai Y, Saito-Adachi M. et al. Genomic and epigenomic integrative subtypes of renal cell carcinoma in a Japanese cohort. Nat Commun. 2023;14:8383
4. Pan Q, Liu R, Zhang X, Cai L, Li Y, Dong P. et al. CXCL14 as a potential marker for immunotherapy response prediction in renal cell carcinoma. Ther Adv Med Oncol. 2023;15:17588359231217966
5. Xu P, Feng DX, Wang J, Wang YD, Xie G, Zhang B. et al. LncRNA AGAP2 antisense RNA 1 stabilized by insulin-like growth factor 2 mRNA binding protein 3 promotes macrophage M2 polarization in clear cell renal cell carcinoma through regulation of the microRNA-9-5p/THBS2/PI3K-Akt pathway. Cancer Cell Int. 2023;23:330
6. Singer EA, Rumble RB, Van Veldhuizen PJ. Management of Metastatic Clear Cell Renal Cell Carcinoma: ASCO Guideline Q&A. JCO Oncol Pract. 2023;19:127-31
7. Wang X, Yao L, Li Z, Zhang J, Ruan M, Mulati Y. et al. ZNF471 Interacts with BANP to Reduce Tumour Malignancy by Inactivating PI3K/AKT/mTOR Signalling but is Frequently Silenced by Aberrant Promoter Methylation in Renal Cell Carcinoma. Int J Biol Sci. 2024;20:643-63
8. Zheng J, Liu F, Su C. Unveiling the hidden AP-1: revealing the crucial role of AP-1 in ccRCC at single-cell resolution. Mol Cancer. 2023;22:209
9. Chen J, Ruan X, Sun Y, Lu S, Hu S, Yuan S. et al. Multi-omic insight into the molecular networks of mitochondrial dysfunction in the pathogenesis of inflammatory bowel disease. EBioMedicine. 2024;99:104934
10. Yang S, Guo J, Kong Z, Deng M, Da J, Lin X. et al. Causal effects of gut microbiota on sepsis and sepsis-related death: insights from genome-wide Mendelian randomization, single-cell RNA, bulk RNA sequencing, and network pharmacology. J Transl Med. 2024;22:10
11. Khankari NK, Keaton JM, Walker VM, Lee KM, Shuey MM, Clarke SL. et al. Using Mendelian randomisation to identify opportunities for type 2 diabetes prevention by repurposing medications used for lipid management. EBioMedicine. 2022;80:104038
12. Wu X, Jiang L, Qi H, Hu C, Jia X, Lin H. et al. Brain tissue- and cell type-specific eQTL Mendelian randomization reveals efficacy of FADS1 and FADS2 on cognitive function. Transl Psychiatry. 2024;14:77
13. Hu W, Xu Y. Transcriptomics in idiopathic pulmonary fibrosis unveiled: a new perspective from differentially expressed genes to therapeutic targets. Front Immunol. 2024;15:1375171
14. Duan QQ, Wang H, Su WM, Gu XJ, Shen XF, Jiang Z. et al. TBK1, a prioritized drug repurposing target for amyotrophic lateral sclerosis: evidence from druggable genome Mendelian randomization and pharmacological verification in vitro. BMC Med. 2024;22:96
15. Pietzner M, Wheeler E, Carrasco-Zanini J, Cortes A, Koprulu M, Worheide MA. et al. Mapping the proteo-genomic convergence of human diseases. Science. 2021;374:eabj1541
16. Lu Z, Yang Y, Zhao G, Zhang Y, Sun Y, Liao Y. et al. The Association of Redox Regulatory Drug Target Genes with Psychiatric Disorders: A Mendelian Randomization Study. Antioxidants (Basel). 2024 13
17. Desai TA, Hedman AK, Dimitriou M, Koprulu M, Figiel S, Yin W. et al. Identifying proteomic risk factors for overall, aggressive, and early onset prostate cancer using Mendelian Randomisation and tumour spatial transcriptomics. EBioMedicine. 2024;105:105168
18. Westra HJ, Peters MJ, Esko T, Yaghootkar H, Schurmann C, Kettunen J. et al. Systematic identification of trans eQTLs as putative drivers of known disease associations. Nat Genet. 2013;45:1238-43
19. Ferkingstad E, Sulem P, Atlason BA, Sveinbjornsson G, Magnusson MI, Styrmisdottir EL. et al. Large-scale integration of the plasma proteome with genetics and disease. Nat Genet. 2021;53:1712-21
20. Sun X, Chen B, Qi Y, Wei M, Chen W, Wu X. et al. Multi-omics Mendelian randomization integrating GWAS, eQTL and pQTL data revealed GSTM4 as a potential drug target for migraine. J Headache Pain. 2024;25:117
21. Lin PW, Lin ZR, Wang WW, Guo AS, Chen YX. Identification of immune-inflammation targets for intracranial aneurysms: A multiomics and epigenome-wide study integrating summary-data-based mendelian randomization, single-cell-type expression analysis, and DNA methylation regulation. Int J Surg. 2024
22. Lin X, Zhao Q, Fu B, Xiong Y, Zhang S, Xu S. et al. ISOC1 Modulates Inflammatory Responses in Macrophages through the AKT1/PEX11B/Peroxisome Pathway. Molecules. 2022 27
23. Leite CA, Carvalho RP, da Costa FM, Medeiros AK, Schutz FA, William WN Jr. Selpercatinib and capmatinib combination promotes sustained complete response in novel ISOC1-RET fusion lung cancer after resistance to RET inhibitor via MET amplification: Case Report. Front Oncol. 2023;13:1264231
24. Li C, Gao X, Zhao Y, Chen X. High Expression of circ_0001821 Promoted Colorectal Cancer Progression Through miR-600/ISOC1 Axis. Biochem Genet. 2023;61:410-27
25. Zhao JQ, Li XN, Fu LP, Zhang N, Cai JH. ISOC1 promotes the proliferation of gastric cancer cells by positively regulating CDK19. Eur Rev Med Pharmacol Sci. 2020;24:11602-9
26. Kushnareva Y, Mathews IT, Andreyev AY, Altay G, Lindestam Arlehamn CS, Pandurangan V. et al. Functional Analysis of Immune Signature Genes in Th1* Memory Cells Links ISOC1 and Pyrimidine Metabolism to IFN-gamma and IL-17 Production. J Immunol. 2021;206:1181-93
27. Xiang J, Gao XQ, Chen XL, Lu YY. ISOC1 is a novel potential tumor suppressor in hepatocellular carcinoma. Neoplasma. 2022;69:174-82
28. Cheng L, Zhao Y, Tang M, Luo Z, Wang X. Knockdown of ISOC1 suppresses cell proliferation in pancreatic cancer in vitro. Oncol Lett. 2019;17:4263-70
29. Shi J, Yang F, Zhou N, Jiang Y, Zhao Y, Zhu J. et al. Isochorismatase domain-containing protein 1 (ISOC1) participates in DNA damage repair and inflammation-related pathways to promote lung cancer development. Transl Lung Cancer Res. 2021;10:1444-56
30. Tan SK, Welford SM. Lipid in Renal Carcinoma: Queen Bee to Target? Trends Cancer. 2020;6:448-50
31. Qu YY, Zhao R, Zhang HL, Zhou Q, Xu FJ, Zhang X. et al. Inactivation of the AMPK-GATA3-ECHS1 Pathway Induces Fatty Acid Synthesis That Promotes Clear Cell Renal Cell Carcinoma Growth. Cancer Res. 2020;80:319-33
32. Shen D, Gao Y, Huang Q, Xuan Y, Yao Y, Gu L. et al. E2F1 promotes proliferation and metastasis of clear cell renal cell carcinoma via activation of SREBP1-dependent fatty acid biosynthesis. Cancer Lett. 2021;514:48-62
33. Tan SK, Hougen HY, Merchan JR, Gonzalgo ML, Welford SM. Fatty acid metabolism reprogramming in ccRCC: mechanisms and potential targets. Nat Rev Urol. 2023;20:48-60
34. Nguyen TTM, Nguyen TH, Kim HS, Dao TTP, Moon Y, Seo M. et al. GPX8 regulates clear cell renal cell carcinoma tumorigenesis through promoting lipogenesis by NNMT. J Exp Clin Cancer Res. 2023;42:42
35. Lin H, Fu L, Li P, Zhu J, Xu Q, Wang Y. et al. Fatty acids metabolism affects the therapeutic effect of anti-PD-1/PD-L1 in tumor immune microenvironment in clear cell renal cell carcinoma. J Transl Med. 2023;21:343
Author contact
![]() Corresponding authors: zqy710890394edu.cn; ophwssedu.cn; drwangleiedu.cn.
Corresponding authors: zqy710890394edu.cn; ophwssedu.cn; drwangleiedu.cn.