Impact Factor ISSN: 1837-9664

 Global reach, higher impact
J Cancer 2023; 14(3):322-335. doi:10.7150/jca.80977 This issue Cite
Research Paper
Bioinformatic analysis of the obesity paradox and possible associated factors in colorectal cancer using TCGA cohorts
Dong Min Lim1*, Hyunsu Lee2*, Kisang Eom3, Yun Hak Kim4,5 ![]() , Shin Kim6,7,8
, Shin Kim6,7,8 ![]()
1. Interdisciplinary Program of Genomic Data Science, Pusan National University, Yangsan 50612, Korea.
2. Department of Medical Informatics, School of Medicine, Keimyung University, 1095 Dalgubeol-daero, Dalseo-gu, Daegu 42601, Republic of Korea.
3. Department of Physiology, School of Medicine, Keimyung University, 1095 Dalgubeol-daero, Dalseo-gu, Daegu 42601, Republic of Korea.
4. Department of Biomedical Informatics, School of Medicine, Pusan National University, Yangsan 50612, Republic of Korea.
5. Department of Anatomy, School of Medicine, Pusan National University, Yangsan 50612, Korea.
6. Department of Immunology, School of Medicine, Keimyung University, Dalseo-gu, Daegu 42601, Republic of Korea.
7. Institute of Medical Science, Keimyung University, Dalseo-gu, Daegu 42601, Republic of Korea.
8. Institute for Cancer Research, Keimyung University Dongsan Medical Center, Dalseo-gu, Daegu 42601, Republic of Korea.
*These authors contributed equally to this work.
Received 2022-11-18; Accepted 2023-1-7; Published 2023-1-22
Abstract

Colorectal cancer (CRC) is a common malignancy worldwide and the second leading cause of cancer-related deaths. Obesity is an important determinant of CRC incidence; however, obese patients have also shown better long-term survival than non-obese patients, suggesting that the development and progression of CRC are associated with different mechanisms. This study compares the expression of genes, tumor-infiltrating immune cells, and intestinal microbiota between high- and low-body mass index (BMI) patients at the time of CRC diagnosis. The results revealed that high-BMI patients with CRC have better prognosis, higher levels of resting CD4+ T cells, lower levels of T follicular helper cells, and different levels of intratumoral microbiota than low-BMI patients. Our study highlights that tumor-infiltrating immune cells and intratumoral microbe diversity are major features of the obesity paradox in CRC.
Keywords: Obesity paradox, colorectal cancer, TCGA, tumor-infiltrating immune cells, intratumoral microbiota
Introduction
Colorectal cancer (CRC) is the third-most diagnosed cancer worldwide and the second leading cause of cancer-related deaths. According to Xi and Xu [1], the proportion of CRC incidence and related deaths are expected to increase substantially by 2040 because of the impacts of a westernized diet and modern sedentary lifestyles. Although obesity is considered to be an important risk factor of CRC [2, 3], contradictory reports have been obtained regarding its role in CRC progression, and it has also been associated with increased survival rates in CRC patients [4-6].
Being overweight or obese is known to increase the risk for various chronic diseases, such as cancer or cardiovascular disease [7, 8]. However, in various consumptive chronic diseases - several cancers and tuberculosis - lower body mass index (BMI) has been associated with worse prognosis [9-12]. This phenomenon in which the prognosis of overweight patients is superior to that of underweight and normal weight patients is known as the “obesity paradox” [13]. Although obesity was associated with greater overall mortality in cancer patients, obese patients with lung cancer, renal cell carcinoma, melanoma, and CRC had better prognoses than under- or normal weight patients with the same conditions [14-20]. Given that obesity is a confirmed risk factor for CRC and metabolic syndromes [21], the mechanism underlying the obesity paradox in cancer remains ambiguous [22].
Tumor-infiltrating immune cells (TIICs) play an important role in tumor development and determining clinical outcomes [23]. TIICs are promising biomarkers for the diagnosis and prognosis of non-metastatic CRC [24], and have achieved greater prognostic performance than histopathological methods [25]. We hypothesize that the evaluation of TIICs could elucidate the molecular mechanisms associated with the obesity paradox in CRC.
The gut microbiome plays a crucial role in the local and systemic immunomodulation of various diseases, including tuberculosis, cardiovascular disease, and cancer [26-28]. A previous report showed a strong relationship between the intake of certain bacteria and the inhibition of colon cancer progression [29], which is achieved via intestinal homeostasis and immune regulation [30, 31]. Although the relationship between obesity and gut microbiota composition has been widely investigated [32], the complex and dynamic relationships between gut microbiota, obesity, and CRC remain unclear.
This study describes the obesity paradox of CRC in cohorts of The Cancer Genome Atlas (TCGA) and investigates the associated characteristics of TIICs and intratumoral microbiome using whole genome and RNA sequencing analyses.
Materials and Methods
Data acquisition and pre-processing
Gene expression, methylation, and clinical data were downloaded from TCGA-COAD (colorectal adenocarcinoma) and TCGA-READ (rectal adenocarcinoma) databases. Data are available at the Genomic Data Commons data portal [33] (https://portal.gdc.cancer.gov). Overall survival (OS) data were downloaded from the UCSC Xena Browser [34] (http://xena.ucsc.edu). BMI was calculated as weight divided by height squared (kg/m2) and categorized based on WHO classifications (high-BMI group, BMI ≥ 30; low-BMI group, BMI ≤ 25). Asian patient data were excluded from TCGA cohorts because the Asia-Pacific BMI classification differs from that of WHO. We investigated the intratumoral microbiome using the Kraken analysis, as previously described [35]. The Kraken algorithm is a rapid and highly accurate program for assigning taxonomic labels to metagenomic sequences using k-mers alignment [36]. We downloaded microbiome data for CRC patients from an online data repository (ftp://ftp.microbio.me/pub/cancer_microbiome_analysis/TCGA/Kraken/). We specifically used intratumoral microbiome abundance (“Kraken-TCGA-Voom-SNM-Plate-Center-Filtering-Data.csv”) and clinical data (“Metadata-TCGA-Kraken-17625-Samples.csv”). Pre-processing of data was performed using R software (v4.1.1) [37]. Patient information is listed in Table 1.
Characteristics of colorectal cancer (CRC) patients (TCGA-COAD and TCGA-READ)
| TCGA-CRC | N | Mean (SD) |
|---|---|---|
| Variable | ||
| Age (years) | 178 | 64.5 (12.6) |
| N | Percentage (%) | |
| Sex | 178 | |
| Female | 93 | 52.2 |
| Male | 85 | 47.8 |
| Race | 178 | |
| White | 138 | 77.5 |
| American Indian | 1 | 0.6 |
| Black | 39 | 21.9 |
| Primary Disease Stage | 172 | |
| I-II | 94 | 54.7 |
| III-IV | 78 | 45.3 |
| Sample type | 178 | |
| Primary | 178 | 100 |
| BMI | 178 | |
| ≥ 30 | 88 | 49.4 |
| ≤ 25 | 90 | 50.6 |
| Death | 178 | |
| No | 144 | 80.9 |
| Yes | 34 | 19.1 |
CRC, colorectal cancer; BMI, body mass index; SD, standard deviation.
Differentially expressed gene (DEG) analysis
We used the edgeR package (v3.34.1) in R to identify DEGs [38]. First, DEGs were identified for primary tumor samples of the high- and low-BMI patient groups. We used the Benjamini-Hochberg adjusted P < 0.05 and |log2 fold change| > 0.05 to identify genes with upregulated and downregulated expressions. We filtered unexpressed and low counts using the edgeR function filterByExpr, with the minimum count required for at least some samples = 10, minimum total count required = 15, and minimum proportion of samples in the smallest group that expressed the gene = 0.7. The trimmed mean of the M-values were normalized and analyzed using the edgeR function glmQLFTest. A quasi-likelihood test, which fits the data to a quasi-likelihood negative binomial generalized log-linear model, was used to perform gene-specific analyses for a given coefficient or contrast. The EnhancedVolcano package (v1.10.0) in R was used to visualize the DEGs [39].
Protein-protein interaction (PPI) network construction and module selection
To identify the pathways and functions associated with the DEGs, PPI networks were constructed using the Search Tool for the Retrieval of Interacting Genes (STRING) database (http://www.string-db.org) [40] and Cytoscape software (v3.8.2) [41]. The Molecular Complex Detection (MCODE) plugin was used for module selection with the following parameters [42]: degree cutoff, 2 × cluster finding; node score cutoff, 0.2 × K-core = 2 ×; maximum depth, 100.
Functional analysis of DEGs
DEG pathways were further assessed by gene ontology (GO) and Kyoto Encyclopedia of Genes and Genomes (KEGG) enrichment analyses using the ClusterProfiler package (v4.0.5) in R [43], and GO and KEGG enrichment analyses were performed using the enrichment plot (v1.12.3) R package [44]. Significance was set at P < 0.05.
Analysis of TIICs based on machine learning
We estimated the proportions of infiltrating immune cell types in each sample using bulk RNA sequencing data, which was analyzed using the CIBERSORTx algorithm [45]. CIBERSORTx is a machine learning algorithm that extends the CIBERSORT framework to infer cell-type-specific gene expression profiles without physical cell isolation. We included 22 immune cell subtypes parsed from the gene signature matrix LM22 and 1,000 permutations of the CIBERSORTx web portal (http://cibersortx.stanford.edu/) with bulk-mode batch correction.
Linear discriminant analysis effect size (LEfSe)
To identify unique microbial signatures in the CRC samples between the high- and low-BMI patients, we analyzed the Kraken-TCGA datasets using a linear discriminant analysis in the Galaxy web application (http://huttenhower.sph.harvard.edu/galaxy) [46]. To identify taxa with significantly differential abundance, we used the factorial Kruskal-Wallis test for classes and pairwise Wilcoxon test for subclasses, with the significance set at P < 0.05. The threshold for the logarithmic LDA score for discriminative features was set at 2.
Differential methylation probes (DMPs)
Methylation data (downloaded from TCGA database) included 159 CRC patients (79 high and 80 low BMI samples). We used the ChAMP package (v2.24.0) to identify the DMPs between the high- and low-BMI groups [47]. A beta-mixture quantile normalization was performed to correct the probe design bias in Illumina 450k DNA methylation data. Batch effects were corrected using the ChAMP function ComBat to reduce technical variation. We selected the cutoff values P < 0.05 and |deltaBeta| > 0.05 to define hypermethylated and hypomethylated genes.
Statistical analysis
OS rate was compared between the high- and low-BMI groups using Kaplan-Meier survival curves and a log-rank P-value. Hazard ratios (HRs) and 95% confidence intervals (CIs) were estimated using a Cox proportional hazards model to investigate the association between patient survival and multiple predictors. A Schoenfeld individual test was performed to confirm that the assumptions of the Cox proportional hazards model were met (Supplementary Figure S1). The Wilcoxon signed-rank test was used to compare the mean difference in the immune cell fractions of CRC patients. Venn diagrams were generated using Venny software [48]. All statistical analyses and visualizations were performed using R software [37].
Results
BMI and patient survival
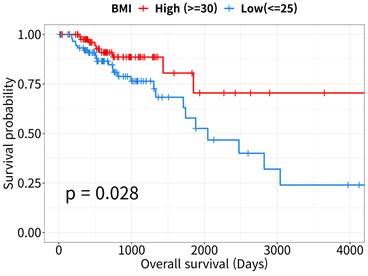
The Kaplan-Meier survival curves revealed that OS rates were lower in the low-BMI than in the high-BMI CRC patient group (log-rank P = 0.028, Figure 1). According to the Cox proportional hazards model, patient survival in the low-BMI group was significantly affected by age, sex, and TNM stage (HR = 2.49, 95% CI: 1.06-5.9, P = 0.037; Table 2).
Kaplan-Meier curves for overall survival analysis. Survival curves of high- and low- body mass index (BMI) patients with colorectal cancer (CRC, n = 178). Data were downloaded from the UCSC Xena Browser (http://xena.ucsc.edu).
Cox proportional hazard analysis of overall survival in colorectal cancer patients
| Variable | HR1 | 95% CI2 | P-value |
|---|---|---|---|
| BMI | |||
| High (≥ 30) | reference | ||
| Low (≤ 25) | 2.49 | 1.06-5.9 | 0.037* |
| Age | 1.03 | 1.00-1.1 | 0.071 |
| Sex | |||
| Female | reference | ||
| Male | 0.59 | 0.28-1.2 | 0.16 |
| Disease Stage | |||
| I-II | reference | ||
| III-IV | 3.44 | 1.58-7.5 | 0.002* |
Global P-value (log-rank) = 0.0006*; Concordance index = 0.72;
1HR: adjusted hazard ratio, estimated using the Cox proportional hazards model.
2CI: confidence interval.
*P-value statistically significant.
Molecular differences between high- and low-BMI groups in CRC patients
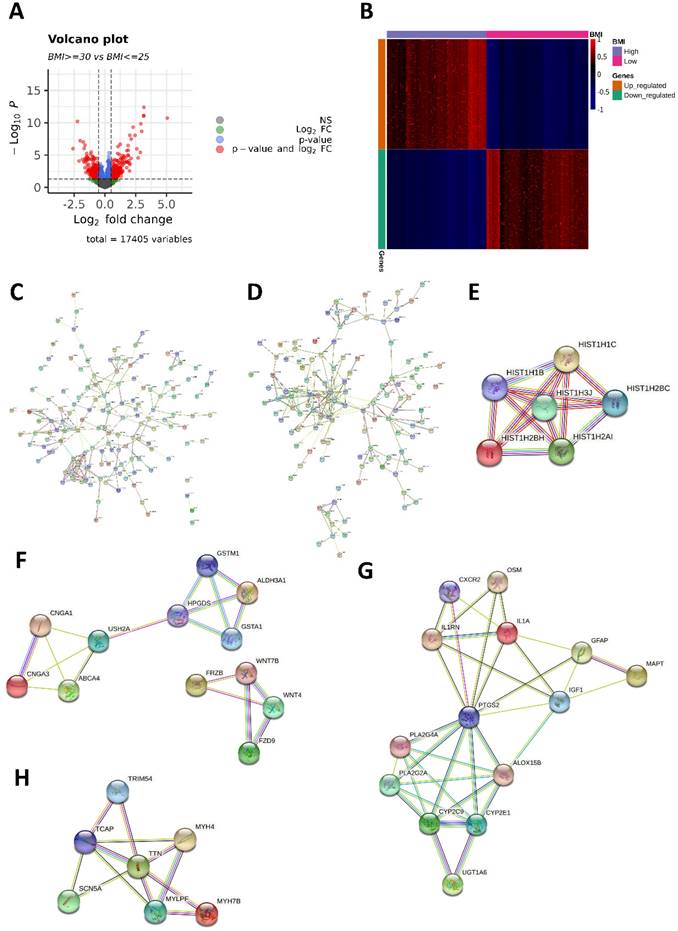
We identified 569 DEGs (298 upregulated and 271 downregulated in the high-BMI group) between the high- and low-BMI groups. Volcano plots and a heatmap of the 569 DEGs are shown in Figure 2A and 2B. From the PPI network (Figure 2C-D), we identified significant modules of genes with upregulated and downregulated expressions using MCODE. In the PPI network of the 298 genes with upregulated expressions, the module with the highest MCODE score contained six genes (HIST1H1B, HIST1H1C, HIST1H2AI, HIST1H2BC, HIST1H2BH, and HIST1H3J; Figure 2E). The second-most significant module comprised 12 genes (ABCA4, ALDH3A1, CNGA1, CNGA3, GSTA1, GSTM1, HPGDS, USH2A, FRZB, FZD9, WNT4, and WNT7B; Figure 2F). In the PPI network of the 271 genes with downregulated expressions, the most significant module comprised 14 genes (ALOX15B, CXCR2, CYP2C9, CYP2E1, GFAP, IGF1, IL1A, IL1RN, MAPT, OSM, PLA2G2A, PLA2G4A, PTGS2, and UGT1A6; Figure 2G) and the second-most significant module comprised seven genes (MYH4, MYH7B, MYLPF, SCN5A, TCAP, TRIM54, and TTN; Figure 2H).
Differentially expressed genes (DEGs) and protein-protein interaction (PPI) network. (A) Volcano plot of the 569 DEGs (298 upregulated and 271 downregulated in the high-BMI group) between high- and low-BMI patients with CRC. Genes corresponding to the Benjamini-Hochberg adjusted P < 0.05 and log2 fold change > 2 are denoted in red; genes corresponding only to the adjusted P < 0.05 are denoted in blue; genes corresponding only to the log2 fold change > 2 are denoted in green; and genes not corresponding to either the p-value or log2 fold change are denoted in black. (B) Heatmap of 569 DEGs between high- and low-BMI patients with CRC based on the normalized Z-score. (C) PPI network of 298 genes with upregulated expressions. (D) PPI network of 271 genes with downregulated expressions. The module with the (E) highest and (F) second-highest Molecular Complex Detection (MCODE) value for the genes with upregulated expressions. The module with the (G) highest and (H) second-highest MCODE value for the downregulated genes.
Functional enrichment analysis of DEGs
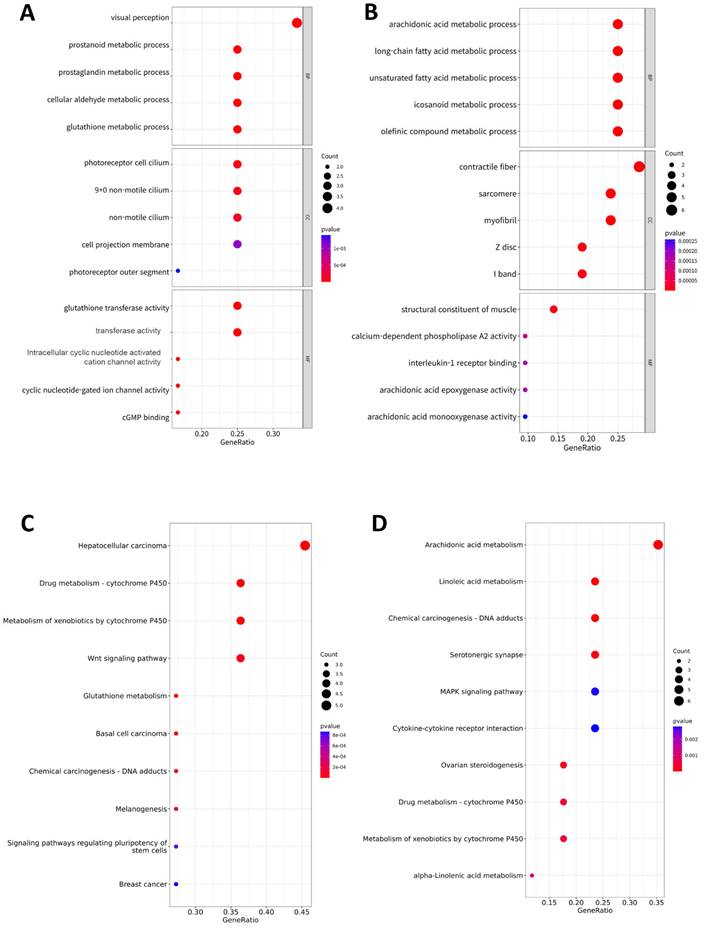
To identify the functional factors of the highly networked protein groups, we performed GO and KEGG enrichment analyses to determine the biological roles of the 39 genes (upregulated: 18, downregulated: 21) comprising the significant modules in the PPI network (Figure 3). The GO analysis considered three major categories: biological process (BP), cellular component (CC), and molecular function (MF). The top GO categories of the 18 genes with upregulated expressions were visual perception, prostanoid metabolic process, prostaglandin metabolic process, photoreceptor cell cilium, and glutathione transferase activity (Figure 3A). The top GO categories of the top 21 genes with downregulated expressions were arachidonic acid (AA) metabolic process, long-chain fatty acid metabolic process, unsaturated fatty acid metabolic process, contractile fiber, and structure constituent of muscle (Figure 3B). According to the KEGG pathway analysis, the 18 genes genes with upregulated expressions were primarily associated with hepatocellular carcinoma, cytochrome P450, Wnt signaling pathway, glutathione metabolism, basal cell carcinoma, DNA adducts, melanogenesis, signaling pathways regulating pluripotency of stem cells, and breast cancer (Figure 3C); the 21 genes with downregulated expressions were primarily associated with AA metabolism, linoleic acid metabolism, DNA adducts, serotonergic synapse, MAPK signaling pathway, cytokine receptor interaction, ovarian steroidogenesis, metabolism of cytochrome P450, and alpha-linolenic acid metabolism (Figure 3D).
Functional analysis. Gene ontology (GO) assay for the 39 genes comprising the significant modules in the PPI network: (A) 18 upregulated genes and (B) 21 downregulated genes. GO analysis considered the biological process (BP), cellular component (CC), and molecular function (MF) terms. Dot plots show the results corresponding to P < 0.05. Size of the circle indicates the number of genes corresponding to each term. The closer to red, the lower the p-value. Kyoto encyclopedia of genes and genomes (KEGG) assay of the 39 genes comprising the significant modules in the PPI network: (C) 18 upregulated genes and (D) 21 downregulated genes. The size of the circle indicates the number of genes corresponding to each term. Dot plots show the results corresponding to P < 0.05. The closer to red, the lower the p-value.
Investigation of DNA methylation-driven DEGs
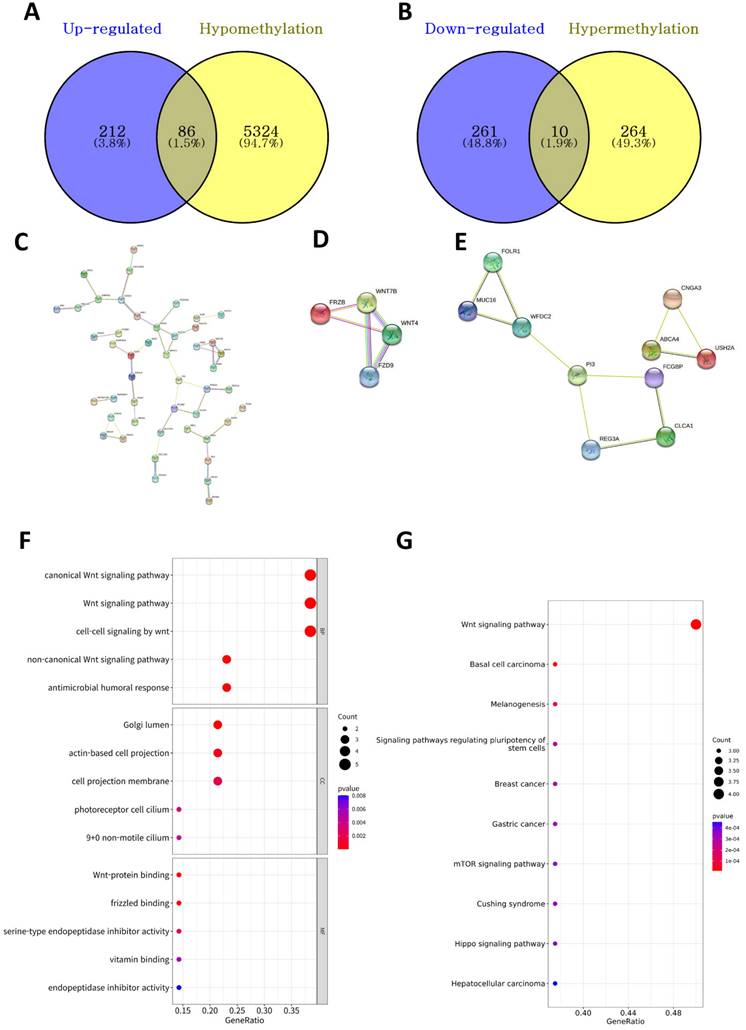
We identified 5,684 DMPs (274 hypermethylated and 5,410 hypomethylated genes in the high-BMI group) between the high- and low-BMI groups. We investigated the overlapping DEGs (Figure 2A) and DMPs between the high- and low-BMI groups (Figure 4A and 4B) and identified 86 upregulated and hypomethylated genes and 10 downregulated and hypermethylated genes. Figure 4C shows the PPI network of the 86 upregulated-hypomethylated genes. The module with the highest MCODE contained four genes (FRZB, FZD9, WNT4, and WNT7B; Figure 4D); the module with the second-highest MCODE comprised 10 genes (ABCA4, CLCA1, CNGA3, FCGBP, FOLR1, MUC16, PI3, REG3A, USH2A, and WFDC2; Figure 4E). The PPI network of the 10 downregulated-hypermethylated genes did not show statistically significant results. The top GO categories of the 14 upregulated-hypomethylated genes were the Wnt signaling pathway, Golgi lumen, actin-based cell projection, and Wnt-protein binding (Figure 4F). In the KEGG enrichment analysis, the 14 upregulated-hypomethylated genes were associated with Wnt signaling pathway, basal cell carcinoma, melanogenesis, signaling pathways regulating pluripotency of stem cells, breast cancer, gastric cancer, mTOR signaling pathway, Cushing syndrome, Hippo signaling pathway, and hepatocellular carcinoma (Figure 4G).
Analysis of DNA methylation-driven DEGs. (A) The Venn diagram shows the overlapping upregulated and hypomethylated DEGs. (B) The overlapping downregulated and hypermethylated DEGs. (C) PPI network of upregulated-hypomethylated genes. The module with the (D) highest and (E) second-highest MCODE value for upregulated-hypomethylated genes. (F) GO assay of 14 upregulated-hypomethylated genes comprising the module with the highest MCODE value. GO analysis considered the biological process (BP), cellular component (CC), and molecular function (MF) terms. Dot plots showing results corresponding to P < 0.05. Size of the circle indicates the number of genes corresponding to each term. The closer to red, the lower the p-value. (G) KEGG assay of 14 upregulated-hypomethylated genes comprising the module with the highest MCODE value. The size of the circle indicates the number of genes corresponding to each term. Dot plots showing results corresponding to P < 0.05. The closer to red, the lower the p-value.
Differences in TIICs between high- and low-BMI groups in CRC patients
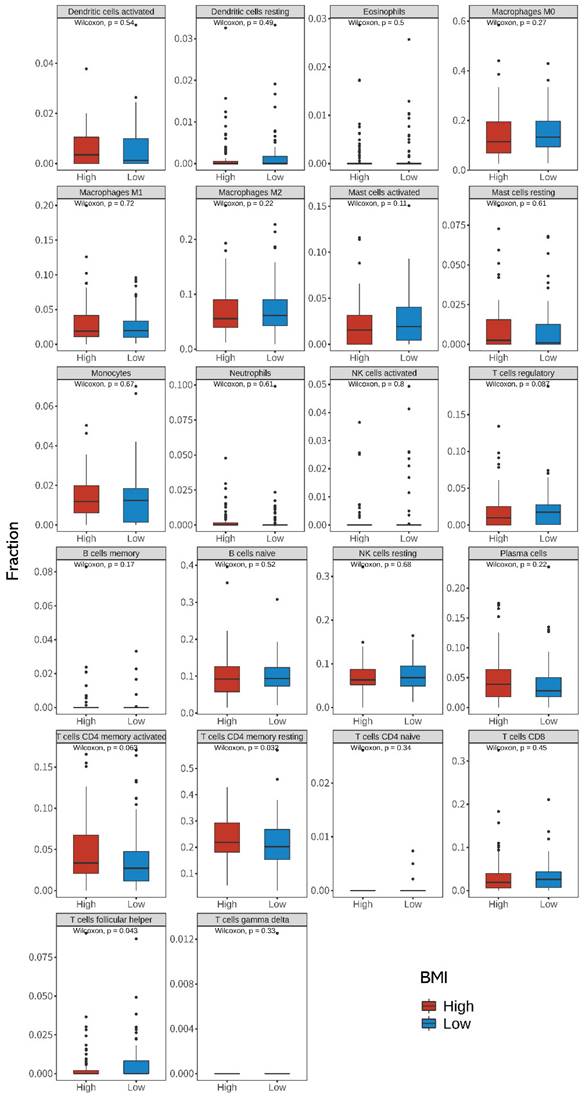
Using the CIBERSORTx algorithm, we estimated the relative abundance of 22 immune cells from the bulk tumor RNA sequencing data. Figure 5 shows the differences between the 22 TIICs according to the BMI groups. When compared with that in the low-BMI group, we found that resting CD4+ T cells were more abundant (P = 0.032, Wilcoxon's rank test) and T follicular helper (Tfh) cells were less abundant in the high-BMI group (P = 0.043, Wilcoxon's rank test). Spearman correlation analysis showed that CNGA3, GSTA1, HPGDS, FRZB, and WNT4 were significantly correlated with resting CD4+ T cells. IL1RN, OSM, and PLA2G2A were significantly correlated with T follicular helper (Tfh) cells (Supplementary Figures S2 and S3). Univariate and multivariate Cox regression analyses between BMI and TIIC of CRC patients are shown in Supplementary Table S1.
Differences in the 22 immune cell fractions between high- and low-BMI patients with CRC. Differences in the expression of tumor-infiltrating immune cells (TIICs) between the high- and low-BMI groups were evaluated using the Wilcoxon sign-rank test (two-sided). CRC, colorectal cancer; BMI, body mass index.
Investigation of unique microbial signatures between BMI groups
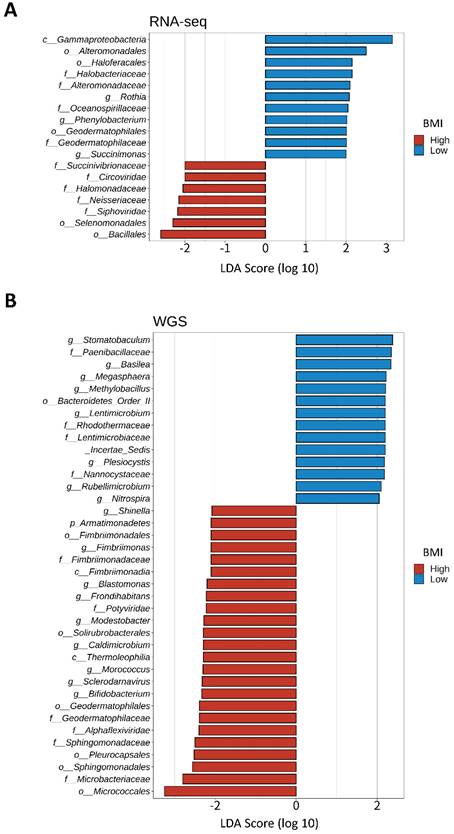
We divided 184 CRC samples into 23 DNA whole genome sequencing (seven high- and 16 low-BMI samples) and 161 RNA sequencing samples (79 high- and 82 low-BMI samples). LEfSe of the Kraken-TCGA dataset identified nine enriched microbe genera in the high-BMI group (Shinella, Fimbriimonas, Blastomonas, Frondihabitans, Modestobacter, Caldimicrobium, Morococcus, Sclerodarnavirus, and Bifidobacterium; Figure 6A) and 11 enriched microbe genera in the low-BMI group (Rothia, Phenylobacterium, Succinimonas, Stomatobaculum, Basilea, Megasphaera, Methylobacillus, Lentimicrobium, Plesiocystis, Rubellimicrobium, and Nitrospira; Figure 6B).
LEfSe of the Kraken-TCGA dataset. Linear discriminant analysis effect size (LEfSe) and distribution of the associated microbiota by subtype using RNA and whole genome sequencing (WGS).
Discussion
Given the high incidence and mortality rates for CRC globally, intensive efforts are being made to discover effective prognostic factors and elucidate the molecular mechanisms of CRC to improve patient prognosis [5, 6, 49-51]. Although controversial, the obesity paradox - first noted with the high survival rates of hemodialysis patients with high BMI [52] - has been reported in various chronic diseases [53-56], including CRC [57-62]. However, bioinformatic studies on the characteristics of TIICs and intratumoral microbiome associated with the obesity paradox in CRC are scarce. Therefore, we investigated the differences in gene expression, TIIC occurrence, and intratumoral microbiome composition according to BMI via bioinformatic analysis of CRC TCGA data.
We confirmed the obesity paradox in CRC for TCGA-COAD and TCGA-READ cohorts. As shown in Figure 1, high BMI was associated with a favorable prognosis, i.e., higher OS rates. The PPI network analysis of DEGs identified 18 and 21 genes with upregulated and downregulated expressions, respectively (Figure 2E-H). Many studies have reported the functions of histone variants in CRC [63], and various dysregulated genes related to CRC prognosis have also been reported: For example, high expression levels of CXCR2, IGF1, IL1A, OSM, and PLA2G4A, and hypermethylated MAPT were associated with poor prognosis [64-69]; low expression levels of GFAP and PLA2G2A were associated with poor prognosis [70, 71]. However, ALOX15B and PTGS2 expression levels were not associated with CRC prognosis [72, 73]. Although a more detailed analysis on the role of these aberrantly expressed genes is required, our findings suggest that these DEGs are collectively responsible for enhanced survival in the high-BMI group.
GO analysis of the DEGs revealed that glutathione transferase activity was high in the high-BMI group (Figure 3A). We also observed the existence of a correlation between GSTA1 and resting CD4 T cells (Supplementary Figure S2). However, CRC prognosis was not dependent on TIIC (Supplementary Table S1). Therefore, we believe that GST activity affects the obesity paradox of CRC patients in different ways. Indeed, a meta-analysis showed that GSTM1 and GSTT1 null genotypes contributed to an increased risk of CRC in the Caucasian population [74]. Low expression of GSTM1 and GSTM2 was associated with better prognosis of CRC [75]. In addition, GST-pi serves as an effective marker of survival in CRC [76]. These findings provide a strong foundation for the association of glutathione s-transferase (GST) activity with prognosis in CRC. Another study reported that high levels of GST activity were associated with better survival and prognosis in ovarian cancer [77]. GST is considered to lower the risk of cancer by regulating reactive oxygen species (ROS) [78]. In contrast, GO analysis showed that the expression of long-chain fatty acid pathways, including the AA pathway, were lower in the high-BMI CRC patient group. In vitro studies using human cell lines derived from lung cancer and CRC have shown that AA inhibitors induce apoptosis [79, 80]. Disease-free survival of cholangiocarcinoma patients with low expression of the AA pathway-associated COX-2 and 5-LOX showed better prognosis [81]. Inhibition of the AA pathway enzymes of COX-2, 5-LOX, and CYP450 could inhibit cell proliferation and neoangiogenesis [82]. Oral cancer patients with asymptomatic loss-of-function somatic mutations in the AA pathway showed good response to chemotherapy, which was likely because of an associated downregulation of the PI3K-Akt pathway downstream [83]. In contrast, dysregulation of the eicosanoid pathway by chronic inflammation has complex implications for tumorigenesis, i.e., both cancer-promoting and anti-cancer roles [84]. A previous study revealed that obesity was positively associated with AA-derived 5- and 11-hydroxyeicosatetraenoic acid levels [85]. Obesity induces increased AA metabolism and activates various signaling pathways, including the PI3K-Akt pathway, and inflammatory cytokines, which have conflicting effects on CRC progression. Therefore, the downregulation of long-chain fatty acid metabolic pathways because of obesity does not necessarily improve prognosis in CRC.
KEGG pathway analysis revealed that drug metabolism of cytochrome P450 and metabolism of xenobiotics by cytochrome P450 were up- and downregulated, respectively (Figure 3C and 3D). This is consistent with the PPI analysis wherein the expressions of ADLH3A1, GSTA1, GSTM1, and HPGDS were upregulated and those of CYP2C9, CYP2E1, and UGT1A6 were downregulated in the high-BMI CRC patient group with good prognosis. As a matter of fact, obesity has been reported to increase the activity of cytochrome P450 2E1 [86]. Although more detailed mechanistic studies are required, these results suggest that cytochrome P450-related genes are critical to the obesity paradox of CRC.
TIICs are important determinants of tumor development and clinical outcomes in cancer patients [23]. Increased levels of tumor-infiltrating Tfh cells were correlated with increased survival of melanoma cancer patients [87], and favorable prognosis in lung squamous cell carcinoma [88]. Tfh cells are more abundant in obese than lean mice [89]. However, in the present study, we identified higher levels of resting CD4+ T cells and lower levels of Tfh cells in the high-BMI group.
As shown in Supplementary Figures S2 and S3, CNGA3, GSTA1, HPGDS, FRZB, and WNT4 were significantly correlated with resting CD4+ T cells, and IL1RN, OSM, and PLA2G2A were significantly correlated with Tfh cells. Wnt/β-catenin signaling plays an important role in T-cell immunity [90] and cancer immunotherapy [91]. Moreover, Thf cells may be involved in the occurrence of immune-related adverse events in highly efficient immune checkpoint blockade treatment through exaggerating cytotoxic T lymphocyte response [92]. The generation of robust memory T cell populations is critical for T cell-based therapies to prevent and treat cancer [93]. In contrast, a previous study reported that OSM not only increases the metastatic potential of breast cancer in vitro but also promotes metastasis in vivo, and may negatively affect patient survival [94]. Lin Wang et al. [95] showed that OSM is associated with CD4 T cells and high-infiltration of Tfh was associated with poor prognosis. Our finding may provide guidance for further investigations regarding the mechanism of the obesity paradox in CRC. A previous report found that high-BMI patients (>30 kg/m2) have higher levels of macrophage M1 (1.13-fold higher than the 25-18.5 kg/m2 group) and lower levels of activated natural killer cells (0.25-fold lower than the 25-18.5 kg/m2 group) [96]. Even though in the aforementioned study, CIBERSORT with gene expression and clinical data corresponding to CRC patients from the TCGA database was used, their results were distinctly different from ours. However, we could not conduct an informed comparison as the description of their dataset was limited. These results suggest that a more in-depth study on the role of TIICs in the obesity paradox of CRC is required.
Gut microbiota plays a vital role in regulating tumorigenesis and the progression of CRC [97-99]. A recent meta-analysis of CRC showed that high levels of Fusobacterium nucleatum and Bacteroides fragilis were related with poor and improved survival, respectively [100]. Although we did not identify F. nucleatum or B. fragilis, Bifidobacterium was found in CRC samples of high-BMI patients. Bifidobacterium was previously found in the fecal samples of a healthy control group [101] and occurred at a low level in a CRC patient. Kosumi et al. [102] showed that the abundance of Bifidobacterium was associated with the level of signet ring cells, suggesting that Bifidobacterium might affect the tumor microenvironment and differentiation of cancer cells. Nevertheless, there was no significant difference in survival probability related to Bifidobacterium. Although little evidence exists for Bifidobacterium improving survival in CRC patients, the existing literature and our results suggest that Bifidobacterium is a potential diagnostic and prognostic marker for CRC. Recently, it has been reported that Bifidobacterium lactis and Lactobacillus plantarum suppress glioma growth in mice by inhibiting the PI3K-Akt pathway [103]. Our results revealed that the AA pathway was lower but the KEGG enrichment analysis of the 14 upregulated-hypomethylated genes was associated with mTOR signaling pathway in the high-BMI CRC patients. Therefore, further studies are needed to investigate the effect and mechanisms of Bifidobacterium on the AA/PI3K-Akt/mTOR signaling pathway, and for this, a research model using CRC organoid needs to be considered.
We acknowledge that there are some limitations to our study. First, considering the aim of our study - the assessment of the molecular and prognostic differences between CRC patients of varying BMI - it is difficult to determine obesity based on BMI. As we used TCGA datasets, we had to apply the WHO standard of 30 kg/m2 to define obesity. However, considering the molecular changes caused by obesity, it may be more appropriate to use waist circumference rather than BMI; however, TCGA database does not provide waist circumference. Second, although the histological type of CRC is an important factor for prognosis, it was not stratified in TCGA data. Third, the immune cell infiltration assays and microbiome analysis were based on bioinformatic techniques. Finally, we did not examine the relationship between the molecular effects of obesity and sequential change of the microbiome and the feedback between these factors. Given these limitations, it is difficult to conclude the plausibility of the obesity paradox in CRC. Future research should consider the causal relationship or underlying mechanism of the obesity paradox in CRC.
Conclusion
CRC is a common malignancy worldwide and is the second leading cause of cancer-related deaths. Obesity paradox is a phenomenon in which the prognosis of overweight patients is superior to that of underweight and normal weight patients in several chronic diseases such as CRC. This study shows that high-BMI patients with CRC have better prognosis, higher levels of resting CD4+ T cells, lower levels of Tfh cells, and different levels of intratumoral microbiota than low-BMI patients. Our study highlights the TIICs and intratumoral microbe diversity as major features of the obesity paradox in CRC.
Abbreviations
BMI: body mass index; CRC: colorectal cancer; DEGs: differentially expressed genes; GO: gene ontology; KEGG: Kyoto encyclopedia of genes and genomes; LEfSe: linear discriminant analysis effect size; MCODE: Molecular Complex Detection; PPI: protein-protein interaction; TCGA: The Cancer Genome Atlas; Tfh: T follicular helper cells; TIIC: tumor-infiltrating immune cell.
Supplementary Material
Supplementary figures and table.
Acknowledgements
The manuscript has been read and approved by all the authors. We would like to thank all members of our research team for their enthusiastic participation in this study. This study met the publication guidelines provided by TCGA (https://www.cancer.gov/about-nci/organization/ccg/research/structural-genomics/tcga/using-tcga/citing-tcga).
Funding
This study was supported by grants from the National Research Foundation of Korea (grant funded by the Korean Government Ministry of Science, ICT and Future Planning; grant no. 2021R1I1A3A04037479 and 2021M3E5D7102565).
Availability of data and materials
All available data are presented within the manuscript or are available from the corresponding authors on reasonable request.
Author contributions
Conceptualization, S.K. and S.K.; Data Curation, D.M.L, and H.L.; Formal Analysis, D.M.L., Y.H.K., and S.K.; Funding Acquisition, S.K; Investigation, D.M.L., Y.H.K., and S.K.; Methodology, D.M.L. and Y.H.K.; Project Administration, S.K.; Software, D.M.L. and Y.H.K.; Supervision, Y.H.K. and S.K.; Visualization, D.M.L. and Y.H.K.; Roles/Writing - original draft, D.M.L., H.L., and S.K.; Writing - review & editing, H.L, K.E., and S.K.
Competing Interests
The authors have declared that no competing interest exists.
References
1. Xi Y, Xu P. Global colorectal cancer burden in 2020 and projections to 2040. Translational Oncology. 2021;14:101174
2. Liu P-H, Wu K, Ng K, Zauber AG, Nguyen LH, Song M. et al. Association of Obesity with Risk of Early-Onset Colorectal Cancer Among Women. JAMA Oncology. 2019;5:37
3. Aleksandrova K, Pischon T, Buijsse B, May AM, Peeters PH, Bueno-de-Mesquita HB. et al. Adult weight change and risk of colorectal cancer in the European Prospective Investigation into Cancer and Nutrition. European Journal of Cancer. 2013;49:3526-36
4. Shahjehan F, Merchea A, Cochuyt JJ, Li Z, Colibaseanu DT, Kasi PM. Body Mass Index and Long-Term Outcomes in Patients with Colorectal Cancer. Front Oncol. 2018;8:620
5. Li Y, Li C, Wu G, Yang W, Wang X, Duan L. et al. The obesity paradox in patients with colorectal cancer: a systematic review and meta-analysis. Nutr Rev. 2022;80:1755-68
6. Yang Z, Wei X, Pan Y, Min Z, Xu J, Yu B. Colon cancer combined with obesity indicates improved survival- research on relevant mechanism. Aging (Albany NY). 2020;12:23778-94
7. De Pergola G, Silvestris F. Obesity as a major risk factor for cancer. J Obes. 2013;2013:291546
8. Powell-Wiley TM, Poirier P, Burke LE, Despres JP, Gordon-Larsen P, Lavie CJ. et al. Obesity and Cardiovascular Disease: A Scientific Statement from the American Heart Association. Circulation. 2021;143:e984-e1010
9. Banack HR, Kaufman JS. The obesity paradox: understanding the effect of obesity on mortality among individuals with cardiovascular disease. Prev Med. 2014;62:96-102
10. Romero-Corral A, Montori VM, Somers VK, Korinek J, Thomas RJ, Allison TG. et al. Association of bodyweight with total mortality and with cardiovascular events in coronary artery disease: a systematic review of cohort studies. Lancet. 2006;368:666-78
11. Schmidt DS, Salahudeen AK. Obesity-survival paradox-still a controversy? Semin Dial. 2007;20:486-92
12. Voulgari C, Tentolouris N, Dilaveris P, Tousoulis D, Katsilambros N, Stefanadis C. Increased heart failure risk in normal-weight people with metabolic syndrome compared with metabolically healthy obese individuals. J Am Coll Cardiol. 2011;58:1343-50
13. Fleischmann E, Teal N, Dudley J, May W, Bower JD, Salahudeen AK. Influence of excess weight on mortality and hospital stay in 1346 hemodialysis patients. Kidney Int. 1999;55:1560-7
14. Petrelli F, Cortellini A, Indini A, Tomasello G, Ghidini M, Nigro O. et al. Association of Obesity with Survival Outcomes in Patients with Cancer: A Systematic Review and Meta-analysis. JAMA Netw Open. 2021;4:e213520
15. Amptoulach S, Gross G, Kalaitzakis E. Differential impact of obesity and diabetes mellitus on survival after liver resection for colorectal cancer metastases. The Journal of surgical research. 2015;199:378-85
16. Brunner AM, Sadrzadeh H, Feng Y, Drapkin BJ, Ballen KK, Attar EC. et al. Association between baseline body mass index and overall survival among patients over age 60 with acute myeloid leukemia. Am J Hematol. 2013;88:642-6
17. Hakimi AA, Furberg H, Zabor EC, Jacobsen A, Schultz N, Ciriello G. et al. An epidemiologic and genomic investigation into the obesity paradox in renal cell carcinoma. Journal of the National Cancer Institute. 2013;105:1862-70
18. Kroenke CH, Neugebauer R, Meyerhardt J, Prado CM, Weltzien E, Kwan ML. et al. Analysis of Body Mass Index and Mortality in Patients with Colorectal Cancer Using Causal Diagrams. JAMA Oncol. 2016;2:1137-45
19. Schlesinger S, Siegert S, Koch M, Walter J, Heits N, Hinz S. et al. Postdiagnosis body mass index and risk of mortality in colorectal cancer survivors: a prospective study and meta-analysis. Cancer Causes Control. 2014;25:1407-18
20. Tsang NM, Pai PC, Chuang CC, Chuang WC, Tseng CK, Chang KP. et al. Overweight and obesity predict better overall survival rates in cancer patients with distant metastases. Cancer medicine. 2016;5:665-75
21. Harlid S, Myte R, Van Guelpen B. The Metabolic Syndrome, Inflammation, and Colorectal Cancer Risk: An Evaluation of Large Panels of Plasma Protein Markers Using Repeated, Prediagnostic Samples. Mediators Inflamm. 2017;2017:4803156
22. Lennon H, Sperrin M, Badrick E, Renehan AG. The Obesity Paradox in Cancer: a Review. Current Oncology Reports. 2016 18
23. Zhang Y, Zhang Z. The history and advances in cancer immunotherapy: understanding the characteristics of tumor-infiltrating immune cells and their therapeutic implications. Cell Mol Immunol. 2020;17:807-21
24. Zhou R, Zhang J, Zeng D, Sun H, Rong X, Shi M. et al. Immune cell infiltration as a biomarker for the diagnosis and prognosis of stage I-III colon cancer. Cancer Immunol Immunother. 2019;68:433-42
25. Galon J, Costes A, Sanchez-Cabo F, Kirilovsky A, Mlecnik B, Lagorce-Pages C. et al. Type, density, and location of immune cells within human colorectal tumors predict clinical outcome. Science (New York, NY). 2006;313:1960-4
26. Chang SW, Pan WS, Lozano Beltran D, Oleyda Baldelomar L, Solano MA, Tuero I. et al. Gut hormones, appetite suppression and cachexia in patients with pulmonary TB. PloS one. 2013;8:e54564
27. Ni Y, Lohinai Z, Heshiki Y, Dome B, Moldvay J, Dulka E. et al. Distinct composition and metabolic functions of human gut microbiota are associated with cachexia in lung cancer patients. ISME J. 2021;15:3207-20
28. Novakovic M, Rout A, Kingsley T, Kirchoff R, Singh A, Verma V. et al. Role of gut microbiota in cardiovascular diseases. World J Cardiol. 2020;12:110-22
29. Goldin BR, Gorbach SL. Effect of Lactobacillus acidophilus dietary supplements on 1,2-dimethylhydrazine dihydrochloride-induced intestinal cancer in rats. Journal of the National Cancer Institute. 1980;64:263-5
30. Lidbeck A, Övervik E, Rafter J, Nord C, Gustafsson J-Å. Effect of Lactobacillus acidophilus supplements on mutagen excretion in faeces and urine in humans. Microbial Ecology in Health and Disease. 1992;5:59-67
31. Pitt JM, Vetizou M, Waldschmitt N, Kroemer G, Chamaillard M, Boneca IG. et al. Fine-Tuning Cancer Immunotherapy: Optimizing the Gut Microbiome. Cancer research. 2016;76:4602-7
32. Aoun A, Darwish F, Hamod N. The Influence of the Gut Microbiome on Obesity in Adults and the Role of Probiotics, Prebiotics, and Synbiotics for Weight Loss. Prev Nutr Food Sci. 2020;25:113-23
33. Grossman RL, Heath AP, Ferretti V, Varmus HE, Lowy DR, Kibbe WA. et al. Toward a Shared Vision for Cancer Genomic Data. The New England journal of medicine. 2016;375:1109-12
34. Goldman MJ, Craft B, Hastie M, Repecka K, McDade F, Kamath A. et al. Visualizing and interpreting cancer genomics data via the Xena platform. Nat Biotechnol. 2020;38:675-8
35. Poore GD, Kopylova E, Zhu Q, Carpenter C, Fraraccio S, Wandro S. et al. Microbiome analyses of blood and tissues suggest cancer diagnostic approach. Nature. 2020;579:567-74
36. Wood DE, Salzberg SL. Kraken: ultrafast metagenomic sequence classification using exact alignments. Genome biology. 2014;15:1-12
37. Team RC. R: A language and environment for statistical computing. 2013.
38. Robinson MD, McCarthy DJ, Smyth GK. edgeR: a Bioconductor package for differential expression analysis of digital gene expression data. Bioinformatics. 2010;26:139-40
39. Blighe K, Rana S, Lewis M. EnhancedVolcano: Publication-ready volcano plots with enhanced colouring and labeling. R package version. 2019 1
40. Szklarczyk D, Franceschini A, Wyder S, Forslund K, Heller D, Huerta-Cepas J. et al. STRING v10: protein-protein interaction networks, integrated over the tree of life. Nucleic acids research. 2015;43:D447-D52
41. Shannon P, Markiel A, Ozier O, Baliga NS, Wang JT, Ramage D. et al. Cytoscape: a software environment for integrated models of biomolecular interaction networks. Genome research. 2003;13:2498-504
42. Bader GD, Hogue CW. An automated method for finding molecular complexes in large protein interaction networks. BMC bioinformatics. 2003;4:1-27
43. Wu T, Hu E, Xu S, Chen M, Guo P, Dai Z. et al. clusterProfiler 4.0: A universal enrichment tool for interpreting omics data. Innovation (N Y). 2021;2:100141
44. Yu G. Enrichplot: visualization of functional enrichment result. R package version. 2019 1
45. Newman AM, Steen CB, Liu CL, Gentles AJ, Chaudhuri AA, Scherer F. et al. Determining cell type abundance and expression from bulk tissues with digital cytometry. Nature biotechnology. 2019;37:773-82
46. Segata N, Izard J, Waldron L, Gevers D, Miropolsky L, Garrett WS. et al. Metagenomic biomarker discovery and explanation. Genome biology. 2011;12:1-18
47. Tian Y, Morris TJ, Webster AP, Yang Z, Beck S, Feber A. et al. ChAMP: updated methylation analysis pipeline for Illumina BeadChips. Bioinformatics. 2017;33:3982-4
48. Venny OJ. An interactive tool for comparing lists with Venn's diagrams (2007-2015). Avaliable at: https://bioinfogp.cnb.csic.es/tools/venny/index.html (accessed November 26, 2019). 2018
49. Walther A, Johnstone E, Swanton C, Midgley R, Tomlinson I, Kerr D. Genetic prognostic and predictive markers in colorectal cancer. Nature reviews Cancer. 2009;9:489-99
50. Idos GE, Kwok J, Bonthala N, Kysh L, Gruber SB, Qu C. The Prognostic Implications of Tumor Infiltrating Lymphocytes in Colorectal Cancer: A Systematic Review and Meta-Analysis. Scientific reports. 2020;10:3360
51. Das V, Kalita J, Pal M. Predictive and prognostic biomarkers in colorectal cancer: A systematic review of recent advances and challenges. Biomed Pharmacother. 2017;87:8-19
52. Fleischmann E, Teal N, Dudley J, May W, Bower JD, Salahudeen AK. Influence of excess weight on mortality and hospital stay in 1346 hemodialysis patients. Kidney international. 1999;55:1560-7
53. Banack HR, Kaufman JS. The obesity paradox: Understanding the effect of obesity on mortality among individuals with cardiovascular disease. Preventive Medicine. 2014;62:96-102
54. Schmidt DS, Salahudeen AK. CARDIOVASCULAR AND SURVIVAL PARADOXES IN DIALYSIS PATIENTS: Obesity-Survival Paradox-Still a Controversy. Seminars in Dialysis. 2007;20:486-92
55. Voulgari C, Tentolouris N, Dilaveris P, Tousoulis D, Katsilambros N, Stefanadis C. Increased Heart Failure Risk in Normal-Weight People with Metabolic Syndrome Compared with Metabolically Healthy Obese Individuals. Journal of the American College of Cardiology. 2011;58:1343-50
56. Romero-Corral A, Montori VM, Somers VK, Korinek J, Thomas RJ, Allison TG. et al. Association of bodyweight with total mortality and with cardiovascular events in coronary artery disease: a systematic review of cohort studies. The Lancet. 2006;368:666-78
57. Amptoulach S, Gross G, Kalaitzakis E. Differential impact of obesity and diabetes mellitus on survival after liver resection for colorectal cancer metastases. Journal of Surgical Research. 2015;199:378-85
58. Tsang NM, Pai PC, Chuang CC, Chuang WC, Tseng CK, Chang KP. et al. Overweight and obesity predict better overall survival rates in cancer patients with distant metastases. Cancer Medicine. 2016;5:665-75
59. Kroenke CH, Neugebauer R, Meyerhardt J, Prado CM, Weltzien E, Kwan ML. et al. Analysis of Body Mass Index and Mortality in Patients with Colorectal Cancer Using Causal Diagrams. JAMA Oncology. 2016;2:1137
60. Schlesinger S, Siegert S, Koch M, Walter J, Heits N, Hinz S. et al. Postdiagnosis body mass index and risk of mortality in colorectal cancer survivors: a prospective study and meta-analysis. Cancer Causes & Control. 2014;25:1407-18
61. Hakimi AA, Furberg H, Zabor EC, Jacobsen A, Schultz N, Ciriello G. et al. An Epidemiologic and Genomic Investigation into the Obesity Paradox in Renal Cell Carcinoma. JNCI: Journal of the National Cancer Institute. 2013;105:1862-70
62. Brunner AM, Sadrzadeh H, Feng Y, Drapkin BJ, Ballen KK, Attar EC. et al. Association between baseline body mass index and overall survival among patients over age 60 with acute myeloid leukemia. American Journal of Hematology. 2013;88:642-6
63. Monteiro FL, Baptista T, Amado F, Vitorino R, Jeronimo C, Helguero LA. Expression and functionality of histone H2A variants in cancer. Oncotarget. 2014;5:3428-43
64. Zhao J, Ou B, Feng H, Wang P, Yin S, Zhu C. et al. Overexpression of CXCR2 predicts poor prognosis in patients with colorectal cancer. Oncotarget. 2017;8:28442-54
65. Scartozzi M, Mandolesi A, Giampieri R, Pierantoni C, Loupakis F, Zaniboni A. et al. Insulin-like growth factor 1 expression correlates with clinical outcome in K-RAS wild type colorectal cancer patients treated with cetuximab and irinotecan. International journal of cancer. 2010;127:1941-7
66. Cheng KJ, Mejia Mohammed EH, Khong TL, Mohd Zain S, Thavagnanam S, Ibrahim ZA. IL-1alpha and colorectal cancer pathogenesis: Enthralling candidate for anti-cancer therapy. Crit Rev Oncol Hematol. 2021;163:103398
67. Zhang Z, Huang L, Li J, Wang P. Bioinformatics analysis reveals immune prognostic markers for overall survival of colorectal cancer patients: a novel machine learning survival predictive system. BMC bioinformatics. 2022;23:124
68. Zhan Y, Zheng L, Liu J, Hu D, Wang J, Liu K. et al. PLA2G4A promotes right-sided colorectal cancer progression by inducing CD39+gammadelta Treg polarization. JCI Insight. 2021 6
69. Wang C, Liu Y, Guo W, Zhu X, Ahuja N, Fu T. MAPT promoter CpG island hypermethylation is associated with poor prognosis in patients with stage II colorectal cancer. Cancer Manag Res. 2019;11:7337-43
70. Tartea EA, Florescu C, Donoiu I, Pirici D, Mihailovici AR, Albu VC. et al. Implications of inflammation and remodeling of the enteric glial cells in colorectal adenocarcinoma. Rom J Morphol Embryol. 2017;58:473-80
71. Fijneman RJ, Bade LK, Peham JR, van de Wiel MA, van Hinsbergh VW, Meijer GA. et al. Pla2g2a attenuates colon tumorigenesis in azoxymethane-treated C57BL/6 mice; expression studies reveal Pla2g2a target genes and pathways. Cell Oncol. 2009;31:345-56
72. Ruan GT, Gong YZ, Zhu LC, Gao F, Liao XW, Wang XK. et al. The Perspective of Diagnostic and Prognostic Values of Lipoxygenases mRNA Expression in Colon Adenocarcinoma. Onco Targets Ther. 2020;13:9389-405
73. Kunzmann AT, Murray LJ, Cardwell CR, McShane CM, McMenamin UC, Cantwell MM. PTGS2 (Cyclooxygenase-2) expression and survival among colorectal cancer patients: a systematic review. Cancer Epidemiol Biomarkers Prev. 2013;22:1490-7
74. Economopoulos K, Sergentanis T. GSTM1, GSTT1, GSTP1, GSTA1 and colorectal cancer risk: a comprehensive meta-analysis. Eur J Cancer. 2010;46:1617-31
75. Guo E, Wei H, Liao X, Wu L, Zeng X. Clinical significance and biological mechanisms of glutathione S-transferase mu gene family in colon adenocarcinoma. BMC Med Genet. 2020;21:130
76. Mulder TP, Verspaget HW, Sier CF, Roelofs HM, Ganesh S, Griffioen G. et al. Glutathione S-transferase π in colorectal tumors is predictive for overall survival. Cancer research. 1995;55:2696-702
77. Ferrandina G, Scambia G, Damia G, Tagliabue G, Fagotti A, Benedetti Panici P. et al. Glutathione S-transferase activity in epithelial ovarian cancer: Association with response to chemotherapy and disease outcome. Annals of Oncology. 1997;8:343-50
78. McIlwain CC, Townsend DM, Tew KD. Glutathione S-transferase polymorphisms: cancer incidence and therapy. Oncogene. 2006;25:1639-48
79. Monjazeb A, High K, Koumenis C, Chilton F. Inhibitors of arachidonic acid metabolism act synergistically to signal apoptosis in neoplastic cells. Prostaglandins Leukot Essent Fatty Acids. 2005;73:463-74
80. Monjazeb A, High K, Connoy A, Hart L, Koumenis C, Chilton F. Arachidonic acid-induced gene expression in colon cancer cells. Carcinogenesis. 2006;27:1950-60
81. Moebius C, Aust G, Wiedmann M, Wittekind C, Moessner J, Hauss J. et al. Prognostic value of eicosanoid pathways in extrahepatic cholangiocarcinoma. Anticancer research. 2008;28:873-8
82. Hyde C, Missailidis S. Inhibition of arachidonic acid metabolism and its implication on cell proliferation and tumour-angiogenesis. Int Immunopharmacol. 2009;9:701-15
83. Biswas N, Das S, Maitra A, Sarin R, Majumder P. Somatic mutations in arachidonic acid metabolism pathway genes enhance oral cancer post-treatment disease-free survival. Nat Commun. 2014;5:5835
84. Tuncer S, Banerjee S. Eicosanoid pathway in colorectal cancer: Recent updates. World J Gastroenterol. 2015;21:11748-66
85. Pickens CA, Sordillo LM, Zhang C, Fenton JI. Obesity is positively associated with arachidonic acid-derived 5- and 11-hydroxyeicosatetraenoic acid (HETE). Metabolism. 2017;70:177-91
86. Kotlyar M, Carson SW. Effects of obesity on the cytochrome P450 enzyme system. Int J Clin Pharmacol Ther. 1999;37:8-19
87. Nurieva RI, Liu ZS, Gangadharan A, Bieerkehazhi S, Zhao YZ, Alekseev A. et al. Function of T follicular helper cells in anti-tumor immunity. Journal of Immunology. 2019;202:138.18-18
88. Xu F, Zhang H, Chen J, Lin L, Chen Y. Immune signature of T follicular helper cells predicts clinical prognostic and therapeutic impact in lung squamous cell carcinoma. Int Immunopharmacol. 2020;81:105932
89. Esteves de Oliveira E, de Castro ESFM, Cacador Ayupe M, Gomes Evangelista Ambrosio M, Passos de Souza V, Costa Macedo G. et al. Obesity affects peripheral lymphoid organs immune response in murine asthma model. Immunology. 2019;157:268-79
90. Li X, Xiang Y, Li F, Yin C, Li B, Ke X. WNT/beta-Catenin Signaling Pathway Regulating T Cell-Inflammation in the Tumor Microenvironment. Front Immunol. 2019;10:2293
91. Wang B, Tian T, Kalland KH, Ke X, Qu Y. Targeting Wnt/beta-Catenin Signaling for Cancer Immunotherapy. Trends Pharmacol Sci. 2018;39:648-58
92. Baumjohann D, Brossart P. T follicular helper cells: linking cancer immunotherapy and immune-related adverse events. J Immunother Cancer. 2021 9
93. Gattinoni L, Ji Y, Restifo NP. Wnt/β-Catenin Signaling in T-Cell Immunity and Cancer ImmunotherapyWnt/β-Catenin in T-Cell Biology and Tumor Immunotherapy. Clinical Cancer Research. 2010;16:4695-701
94. Tawara K, Scott H, Emathinger J, Wolf C, LaJoie D, Hedeen D. et al. HIGH expression of OSM and IL-6 are associated with decreased breast cancer survival: synergistic induction of IL-6 secretion by OSM and IL-1β. Oncotarget. 2019;10:2068
95. Wang L, Wei Q, Zhang M, Chen L, Li Z, Zhou C. et al. Identification of the prognostic value of immune gene signature and infiltrating immune cells for esophageal cancer patients. International immunopharmacology. 2020;87:106795
96. Abu N, Othman N, Ab Razak NS, Bakarurraini N, Nasir SN, Soh JEC. et al. Extracellular Vesicles Derived from Colorectal Cancer Affects CD8 T Cells: An Analysis Based on Body Mass Index. Front Cell Dev Biol. 2020;8:564648
97. Gagnière J, Raisch J, Veziant J, Barnich N, Bonnet R, Buc E. et al. Gut microbiota imbalance and colorectal cancer. World J Gastroenterol. 2016;22:501-18
98. Maisonneuve C, Irrazabal T, Martin A, Girardin SE, Philpott DJ. The impact of the gut microbiome on colorectal cancer. Annual Review of Cancer Biology. 2018;2:229-49
99. Louis P, Hold G, Flint H. The gut microbiota, bacterial metabolites and colorectal cancer. Nat Rev Microbiol. 2014;12:661-72
100. Colov E, Degett T, Raskov H, Gögenur I. The impact of the gut microbiota on prognosis after surgery for colorectal cancer - a systematic review and meta-analysis. APMIS. 2020;128:162-76
101. Mira-Pascual L, Cabrera-Rubio R, Ocon S, Costales P, Parra A, Suarez A. et al. Microbial mucosal colonic shifts associated with the development of colorectal cancer reveal the presence of different bacterial and archaeal biomarkers. J Gastroenterol. 2015;50:167-79
102. Kosumi K, Hamada T, Koh H, Borowsky J, Bullman S, Twombly TS. et al. The Amount of Bifidobacterium Genus in Colorectal Carcinoma Tissue in Relation to Tumor Characteristics and Clinical Outcome. The American journal of pathology. 2018;188:2839-52
103. Wang L, Li S, Fan H, Han M, Xie J, Du J. et al. Bifidobacterium lactis combined with Lactobacillus plantarum inhibit glioma growth in mice through modulating PI3K/AKT pathway and gut microbiota. Front Microbiol. 2022;13:986837
Author contact
![]() Corresponding authors: Shin Kim, M.D., Ph.D. Department of Immunology, School of Medicine, Keimyung University, Dalseo-gu, Daegu 42601, Republic of Korea. TEL: +82-53-258-7359; Fax: +82-53-258-7355; E-mail: god98005or.kr; Yun Hak Kim, M.D., Ph.D. Department of Anatomy, School of Medicine, Pusan National University, Yangsan 50612, Korea. TEL: +82-51-510-8091; Fax: +82-51-510-8049; E-mail: yunhak10510ac.kr.
Corresponding authors: Shin Kim, M.D., Ph.D. Department of Immunology, School of Medicine, Keimyung University, Dalseo-gu, Daegu 42601, Republic of Korea. TEL: +82-53-258-7359; Fax: +82-53-258-7355; E-mail: god98005or.kr; Yun Hak Kim, M.D., Ph.D. Department of Anatomy, School of Medicine, Pusan National University, Yangsan 50612, Korea. TEL: +82-51-510-8091; Fax: +82-51-510-8049; E-mail: yunhak10510ac.kr.