Impact Factor ISSN: 1837-9664

 Global reach, higher impact
J Cancer 2020; 11(22):6507-6515. doi:10.7150/jca.44580 This issue Cite
Research Paper
Genetic variants in the Folic acid Metabolic Pathway Genes predict outcomes of metastatic Colorectal Cancer patients receiving first-line Chemotherapy
Lu Jiang1*, Shuwei Li2*, Ming Yuan3*, Ling Ma1, Yu Lin1, Weiyou Zhu1, Haina Du4, Meilin Wang2, Tao Chen5 ![]() , Lingjun Zhu1
, Lingjun Zhu1 ![]()
1. Department of Oncology, The First Affiliated Hospital of Nanjing Medical University, Nanjing, China.
2. Jiangsu Key Lab of Cancer Biomarkers, Prevention and Treatment, Jiangsu Collaborative Innovation Center For Cancer Personalized Medicine, Nanjing Medical University, Nanjing 211166, China.
3. Department of Oncology, Jiangyin People's Hospital, Wuxi, China.
4. Nanjing Hospital of Chinese Medicine Affiliated to Nanjing University of Chinese Medicine, Nanjing, China.
5. Department of Gastrointestinal Surgery, The First Affiliated Hospital of Nanjing Medical University, Nanjing, China.
*These authors contributed equally to this work.
Received 2020-2-5; Accepted 2020-5-29; Published 2020-9-21
Abstract
Background: The association between genetic variants in the folic acid metabolic pathway genes and survival, as well as the responses to chemotherapy of metastatic colorectal cancer (mCRC) patients has not been reported.
Methods: The association between genetic variants in the folic acid metabolic pathway genes and progression-free survival (PFS) and overall survival (OS) of mCRC patients were analyzed using Cox regression model. The false discovery rate (FDR) correction method was conducted. The logistic regression model was used to explore the effects of the interested genetic variants on disease control rate (DCR). The Cancer Genome Atlas (TCGA) database was applied to compare gene expression differences.
Results: We found that rs3786362 G allele of thymidylate synthase (TYMS) gene was significantly associated with PFS (P = 1.10 × 10⁻²), OS (P = 2.50 × 10⁻²) and DCR (P = 5.00 × 10⁻³). The expression of TYMS was overexpressed in CRC tissues compared with adjacent normal tissues. Furthermore, TYMS expression level decreased with respect to younger age and advanced tumor stage.
Conclusion: Genetic variants in the folic acid metabolic pathway genes might serve as potential prognostic biomarkers for mCRC patients.
Keywords: genetic variants, folic acid, colorectal cancer, chemotherapy
Introduction
In 2020, there will be 147,950 newly diagnosed colorectal cancer (CRC) patients and 53,200 deaths from the disease in the United States. The morbidity and mortality of CRC among individuals aged younger than 50 years increased during recent years 1. CRC is the third cause of cancer-related death worldwide the fifth cause of cancer-related death in China 2. Patients often have distant metastases at the time of diagnosis 3, leading to an increasing enormous burden.
Folic acid was firstly reported as a fundamental micronutrient in the twentieth century 4. A deficiency in cellular folic acid contributes to aberrant DNA methylation and apoptosis of cancer cells 5. There is evidence that abnormal biosynthesis and metabolism of folic acid are correlated with progression of CRC 6. 5-fluorouracil (5-FU), acting as an anti-folate chemical medicine, has been a cornerstone for the clinical treatment of CRC during the past five decades 7. The standard first-line chemotherapy regimens for metastatic colorectal cancer (mCRC) include FOLFOX (5-FU, folinic acid, oxaliplatin), FOLFIRI (5-FU, folinic acid, irinotecan) and XELOX [capecitabine (a 5-FU prodrug), oxaliplatin] in combination with or without targeted biologics. XELIRI (capecitabine, irinotecan) regimen exhibits similar efficiency in clinical treatment. 5-FU mainly targets at enzymes that were encoded by a series of susceptible genes in the folic acid metabolic pathway such as thymidylate synthase (TYMS), methylenetetrahydrofolate reductase (MTHFR) and reduced folate carrier 1 (RFC1) 7, 8.
Mortality rates of CRC decrease by surgery and chemotherapy treatment 9. However, survival time and treatment responses of mCRC patients undergoing first-line chemotherapy remain inconsistent. Several prognostic factors for CRC were identified by a number of epidemiological studies, such as obesity, tumor site and therapy 10. Moreover, genetic variants in important metabolic pathway genes, such as estrogen metabolic pathway genes and methionine metabolic pathway genes were reported to have effects on CRC prognosis 11, 12. Therefore, the identification of single-nucleotide polymorphisms (SNPs) in complicated gene-phenotype-cancer pathways may provide insights into prognosis prediction for CRC patients. According to Jang, M. J. et.al 13, genetic variants in two key genes in the folic acid metabolic pathway, TYMS and RFC1, were proved to relate to CRC prognosis in a Korean population. However, few studies explored the association between genetic variants in this pathway and the responses to first-line chemotherapy in mCRC patients. In our study, the systematic evaluation was performed to examine the potential roles of folic acid metabolic pathway SNPs in outcomes (including survival and the responses to chemotherapy) of mCRC patients treated with first-line chemotherapy.
Materials and Methods
Study subjects
A total of 325 mCRC patients were retained in our research from the First Affiliated Hospital of Nanjing Medical University and Nanjing First Hospital from September 2010. To be eligible for our analysis, patients had to meet the following criteria: (1) histologically diagnosed with mCRC; (2) receiving first-line chemotherapy regimens including irinotecan-based (FOLFIRI and XELIRI) or oxaliplatin-based (FOLFOX and XELOX) chemotherapy in combination with or without targeted biologics; (3) receiving at least two cycles of chemotherapy before evaluation; (4) undergoing regular examination before and after chemotherapy; (5) having measurable solid lesions scanned by computed tomography (CT) before treatment; (6) unrelated Han Chinese. Patients that suffered from other primary tumors, cardiopulmonary insufficiency or severe infection were excluded. In addition, we excluded mCRC patients with liver metastasis whose alanine aminotransferase (ALT) was higher than 90U/L. Each peripheral blood sample of patients was collected in admission and preserved ethylenediaminetetraacetic acid (EDTA) tubes for DNA extraction. The protocol was approved by the Institutional Review Board of Nanjing Medical University. All patients gave their written informed consent before enrollment and the clinical characteristics of patients were described previously 14.
The evaluation of clinical outcomes
The outcomes were evaluated by CT before treatment and after a minimum of two cycles of chemotherapy in mCRC patients. The calculated clinical outcomes were the progression-free survival (PFS), overall survival (OS) and responses to chemotherapy. The primary endpoint was PFS assessed on the basis of the Response Evaluation Criteria in Solid Tumors (Version 1.1) 15. CR (complete response), PR (partial response), PD (progress disease) and SD (stable disease) were used to assess the survival and responses to chemotherapy. PFS was defined as time from date of primary chemotherapy treatment to date of diagnosis of PD or to date of last follow-up. OS was defined as time from date of primary chemotherapy treatment to date of death or last recorded date of follow-up. Disease control rate (DCR) was defined as the percentage of patients who achieved CR, PR, or SD. The follow-up duration of all the patients were performed periodically through telephone calls.
The selection of folic acid metabolic pathway-associated genes and SNPs
The selection of genes in the folic acid metabolic pathway was conducted from the Kyoto Encyclopedia of Genes and Genomes (KEGG) (https://www.kegg.jp/kegg/pathway.html), AmiGO 2 (http://amigo.geneontology.org/amigo/landing) and PubMed (https://www.ncbi.nlm.nih.gov/). Genes that are essential in the folic acid metabolic pathway and have been supported to connect with CRC susceptibility, as well as survival by epidemiologic or experimental data were finally selected for further investigation.
Firstly, SNPs within the candidate genes and 2 kb upstream regions were extracted by the Han Chinese in Beijing (CHB) data from the 1000 Genomes Project (March 2012) with the following criteria for quality control: (a) a call rate ≥ 99%; (b) minor allele frequency (MAF) ≥ 10%; and (c) Hardy-Weinberg Equilibrium (HWE) exact P value ≥ 0.05. Secondly, potential functions of SNPs were analyzed based on RegulomeDB (http://regulome.stanf ord.edu/index), HaploReg (http://archive.broadinstitute.org/mammals/haploreg/haploreg. php), GTEx portal (http://www.gtexportal.org/home/) and SNPinfo Web Server (http://snpinfo.niehs.nih.gov/). SNPs above RegulomeDB score 5 were excluded. Thirdly, representative tagging SNPs in low linkage disequilibrium (LD) (r2 < 0.8) were selected using HaploView 4.2 software. Fourthly, we investigated the association between the candidate SNPs and PFS of mCRC patients with adjustment for sex and age in the additive model. The false discovery rate (FDR) correction was conducted and we selected SNPs of which adjusted PFDR (PFS) value was < 0.15. Finally, the effects of the candidate SNPs on DCR were analyzed in the additive model and SNPs statistically related to DCR (adjusted P < 0.05) were selected.
SNP genotyping
The Qiagen Blood Kit (Qiagen) was used to extract genomic DNAs from collected blood samples. Genotyping was performed using Illumina Human Omni ZhongHua Bead Chips. We filtered the samples and SNPs using a uniform quality control protocol.
Functional Annotation of the selected genes
The Cancer Genome Atlas (TCGA) database (http://cancergenome.nih.gov/) was used to analyze differential gene expression of RNA-sequencing data in CRC tissues and adjacent normal tissues (log2 transformed). In addition, we conducted gene expression analysis in subgroups of age, sex, tumor site, family history, body mass index (BMI) and tumor stage. Survival analysis was performed to search for the relationship between the expression of the selected genes and OS of patients.
Statistical analysis
In order to eliminate several potential confounders in targeting individuals, unconditional univariate and multivariate Cox regression models were applied to estimate the relationships between patient characteristics and OS, including sex, age, tumor site, tumor grade, number of metastatic organism, drinking status, smoking status, family history, Dukes stage and chemotherapy regimens. Multivariate Cox regression model was conducted to calculate adjusted hazard ratios (HRs) and 95% CIs for the relationship between SNPs and survival of mCRC patients. Multivariate logistic regression model was used to estimate the adjusted odds ratios (ORs) and their 95% CIs for exploring the association between SNPs and DCR. We firstly used multivariate Cox and logistic regression models to explore the correlation between the candidate SNPs and PFS, as well as DCR of mCRC patients with adjustment for sex and age in the additive model. Considering that tumor site and chemotherapy regimens could have potential effects on outcomes of patients, we further conducted multivariate analysis to investigate the association between the interested SNPs and outcomes of mCRC patients with adjustment for sex, age, tumor site and chemotherapy. We applied the FDR correction method for adjusted P values to conducting multiple comparisons. Moreover, Kaplan-Meier curves were performed to demonstrate the correlation between the interested SNPs and cumulative survival probability of PFS and OS. Unpaired student t-test was applied to compare the different gene expression levels between tumor tissues and normal tissues based on TCGA database. Stratified analysis according to TCGA database was evaluated using ANOVA in subgroups of tumor stage.
All statistical computation was achieved by PLINK (version 1.09) and R software (version 3.2.3). It was considered statistically significant for P values < 0.05.
Results
Characteristics of the study population
The detailed information regarding the clinical characteristics of 325 patients and their associations with OS is shown in Supplementary Table S1. Among these patients, 205 were males (63.1%) and 120 were females (36.9%). All patients were diagnosed with advanced Dukes stage (C or D) cancer after surgery operations, with 194 colon cancer and 131 rectal cancer patients. At the end of follow-up, 188 patients received oxaliplatin-based chemotherapy with 81 (43.1%) deaths, and 131 patients received irinotecan-based chemotherapy with 69 (50.4%) deaths. In summary, no clinical characteristics of patients were considered as confounders in our study.
The selection of genes and SNPs in the folic acid metabolic pathway
The detailed progress of selecting genes and SNPs in the folic acid metabolic pathway is exhibited in Figure 1. Fifteen key genes were selected for further study after the thoroughly extraction from KEGG, AmiGO 2 and published studies. The detailed information of 15 key genes is shown in Supplementary Figure S1 and Supplementary Table S2.
Flow chart for selecting SNPs in the folic acid metabolic pathway genes. CHB: the Han Chinese in Beijing; MAF: minor allele frequency; HWE: Hardy-Weinberg Equilibrium; LD: linkage disequilibrium; PFS: progression-free survival; DCR: disease control rate.
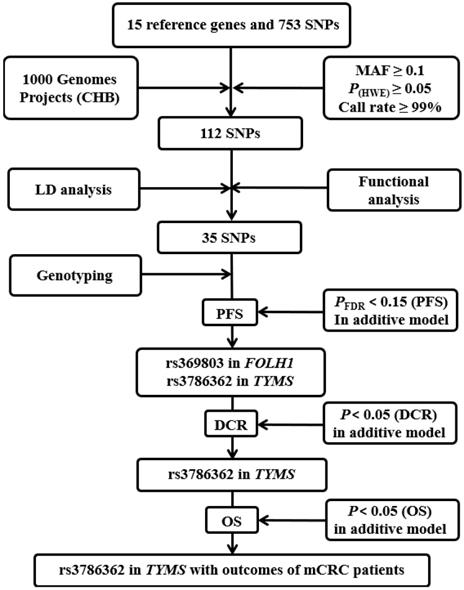
We firstly identified a total of 753 SNPs that were located in 15 candidate gene regions, including 2 kb upstream. Only 112 SNPs remained after quality control. After conducting functional analysis and LD analysis, 35 putative functional SNPs were retained and the detailed information of 35 SNPs for function annotation after silico analysis is listed in Supplementary Table S3.
The association between 35 SNPs and PFS of mCRC patients
We analyzed the association between 35 SNPs and PFS of mCRC patients in the additive model after genotyping (Supplementary Table S4). As shown in Table 1, we found that four SNPs (rs369803 in FOLH1, rs10432965 in FTCD, rs4795436 in SLC46A1 and rs3786362 in TYMS) were correlated with PFS. After FDR correction, only two SNPs (rs3786362 in TYMS and rs369803 in FOLH1) were significantly associated with PFS of mCRC patients (rs3786362: HR = 1.43, 95% CI = 1.12-1.82, PFDR = 0.10; rs369803: HR = 0.68, 95% CI = 0.51-0.89, PFDR = 0.10). Then, we evaluated the correlation of two candidate SNPs with DCR as demonstrated in Table 1. Interestingly, only TYMS rs3786362 was both related to reduced PFS and DCR (OR = 1.97, 95% CI = 1.19-3.27, P = 8.00 × 10⁻³) after adjustment for sex and age in the additive model. Consequently, TYMS rs3786362 was selected for subsequent analysis. With adjustment for sex, age, tumor site and chemotherapy, rs3786362 in TYMS was observed to correlate with reduced PFS (HR = 1.37, 95% CI = 1.08-1.75, P = 1.10 × 10⁻²) and DCR (OR = 2.07, 95% CI = 1.24-3.44, P = 5.00 × 10⁻³) of mCRC patients in the additive model, which is consistent with the results mentioned above (Table 2 and Table 3).
Association of four significant SNPs with mCRC outcomes
| SNP | Gene | Chromosome | Position | Allele | P(HWE) | PFS | DCR | |||
|---|---|---|---|---|---|---|---|---|---|---|
| Adjusted HR (95%CI) | P | PFDR | Adjusted OR (95%CI) | P | ||||||
| rs369803 | FOLH1 | 11 | 49174367 | C>T | 0.669 | 0.68 (0.51-0.89) | 0.006 | 0.100 | 0.98 (0.55-1.68) | 0.944 |
| rs4795436 | SLC46A1 | 17 | 26729428 | C>T | 0.873 | 1.28 (1.02-1.61) | 0.032 | 0.280 | - | - |
| rs3786362 | TYMS | 18 | 662247 | G>A | 0.434 | 1.43 (1.12-1.82) | 0.004 | 0.100 | 1.97 (1.19-3.27) | 0.008 |
| rs10432965 | FTCD | 21 | 47557222 | A>G | 0.190 | 0.81 (0.66-0.98) | 0.027 | 0.280 | - | - |
HR: hazard ratio; CI: confidence interval;
P: for additive model adjusted for sex and age in Cox and logistic regression models;
PFDR: for additive model adjusted for sex and age in Cox regression model after the false discovery rate (FDR) correction.
Association of TYMS rs3786362 and mCRC survival
| PFS | OS | |||||||||||
|---|---|---|---|---|---|---|---|---|---|---|---|---|
| Genotyping | Cases | No. of progression (%) | HRa (95%CI) | Pa | HRb (95%CI) | Pb | Cases | No. of death (%) | HRa (95%CI) | Pa | HRb (95%CI) | Pb |
| AA | 221 | 151 (68.3) | 1.00 | 1.00 | 221 | 97 (43.9) | 1.00 | 1.00 | ||||
| AG | 97 | 76 (78.4) | 1.65 (1.24-2.19) | 0.001 | 1.62 (1.21-2.15) | 0.001 | 97 | 50 (51.5) | 1.54 (1.09-2.18) | 0.014 | 1.58 (1.11-2.24) | 0.010 |
| GG | 7 | 4 (57.1) | 0.96 (0.35-2.63) | 0.943 | 0.88 (0.32-2.42) | 0.807 | 7 | 3 (42.9) | 1.13 (0.36-3.58) | 0.839 | 1.15 (0.37-3.65) | 0.812 |
| Additive model | 1.43 (1.12-1.82) | 0.004 | 1.37 (1.08-1.75) | 0.011 | 1.43 (1.03-1.85) | 0.019 | 1.40 (1.04-1.88) | 0.025 | ||||
| Dominant model | 1.61 (1.20-2.10) | 0.001 | 1.55 (1.17-2.05) | 0.002 | 1.52 (1.08-2.14) | 0.015 | 1.55 (1.10-2.18) | 0.012 | ||||
| Recessive model | 0.83 (0.31-2.26) | 0.720 | 0.76 (0.28-2.09) | 0.601 | 1.00 (0.32-3.15) | 0.997 | 1.02 (0.32-3.21) | 0.977 | ||||
PFS: progression-free survival; OS: overall survival;
HR: hazard ratio; CI: confidence interval;
a: adjusted for sex and age in Cox regression model;
b: adjusted for sex, age, tumor site and chemotherapy in Cox regression model.
Association of TYMS rs3786362 and responses to chemotherapy in mCRC patients
| Genotyping | DCR | |||||
|---|---|---|---|---|---|---|
| Cases | No. of PD (%) | ORa (95%CI) | Pa | ORb (95%CI) | Pb | |
| AA | 221 | 34 (15.4) | 1 | 1 | ||
| AG | 97 | 31 (32.0) | 2.47 (1.40-4.36) | 0.002 | 2.52 (1.42-4.48) | 0.001 |
| GG | 7 | 1 (14.3) | 1.04 (0.12-9.26) | 0.970 | 1.25 (0.14-11.42) | 0.844 |
| Additive model | 1.97 (1.19-3.27) | 0.008 | 2.07 (1.24-3.44) | 0.005 | ||
| Dominant model | 2.37 (1.35-4.15) | 0.003 | 2.44 (1.38-4.30) | 0.002 | ||
| Recessive model | 0.75 (0.09-6.56) | 0.794 | 0.90 (0.10-8.15) | 0.928 | ||
PD: progress disease;
OR: odds ratio; CI: confidence interval;
a: adjusted for sex and age in logistic regression models;
b: adjusted for sex, age, tumor site and chemotherapy in logistic regression models.
The correlation between rs3786362 in TYMS and mCRC survival
Owing to the positive findings of TYMS rs3786362 on PFS in our previous study, the correlation analysis of the selected SNP with OS was further conducted. Interestingly, TYMS rs3786362 was also associated with reduced OS in the additive model (HR = 1.43, 95% CI = 1.03-1.85, P = 1.90 × 10⁻²) (Table 2). In addition, it was found that AG genotype of rs3786362 in TYMS was both correlated with reduced PFS (HR = 1.65, 95% CI = 1.24-2.19, P = 1.00 × 10⁻³) and OS (HR = 1.54, 95% CI = 1.09-2.18, P = 1.00 × 10⁻²) compared with AA genotype. In subsequent SNP-associated analysis with additive, dominant and recessive models, carriers of rs3786362 G allele were prone to have shorter PFS and OS time in the dominant model (PFS: HR = 1.55, 95% CI = 1.17-2.05, P = 2.00 × 10⁻³; OS: HR = 1.55, 95% CI = 1.10-2.18, P = 1.20 × 10⁻²) with adjustment for sex, age, tumor site and chemotherapy in multivariate analysis. However, no significant differences were observed in the recessive model.
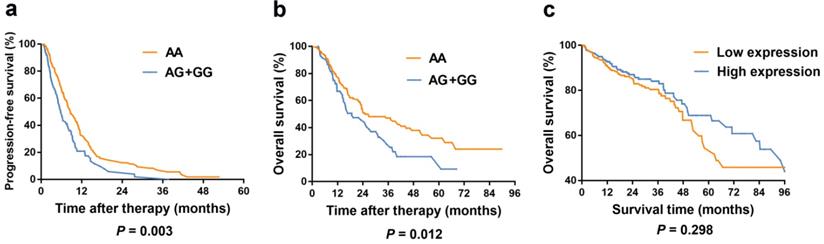
Kaplan-Meier curves of PFS and OS for TYMS rs3786362 in mCRC patients were depicted choosing the dominant model. Patients with AG/GG genotypes exhibited reduced PFS and OS compared with AA genotype (Figure 2).
Kaplan-Meier curves in colorectal cancer patients according to our study and TCGA database. (a) Kaplan-Meier curves of progression-free survival for rs3786362 in mCRC patients using Cox regression model. (b) Kaplan-Meier curves of overall survival for rs3786362 in mCRC patients using Cox regression model. (c) Kaplan-Meier curves of survival rate for TYMS expression levels in colorectal cancer patients according to TCGA database. HR: hazard ratio; CI: confidence interval.
The correlation between rs3786362 in TYMS and DCR of mCRC patients
In order to explore the correlation of rs3786362 in TYMS and responses to first-line chemotherapy in mCRC patients, we conducted three models including additive model, dominant model and recessive model for correlation analysis. Our study discovered that rs3786362 G allele was associated with reduced DCR both in the additive model (OR = 2.07, 95% CI = 1.24-3.44, P = 5.00 × 10⁻³) and dominant model (OR = 2.44, 95% CI = 1.38-4.30, P = 2.00 × 10⁻³) after adjusting for sex, age, tumor site and chemotherapy, suggesting a considerable effect of the G allele on DCR (Table 3).
Stratification analysis of rs3786362 in TYMS and mCRC survival
Stratification analysis was also performed to evaluate the potential effects of TYMS rs3786362 in mCRC patients in the dominant model. Overall, the carriers of the risk G allele reduced PFS with respect to female, younger age, colon cancer, well and moderate tumor differentiation, with metastatic organism ≤ 2, drinking status, and non-smoking status, no CRC family history and recipients of oxaliplatin-based chemotherapy in multivariate analysis (Table 4). The OS time was shorter for patients with AG/GG genotype in subgroups of male, younger age, rectal cancer, well and moderate tumor differentiation, with metastatic organism ≤ 2, non-drinking status, non-smoking status and recipients of irinotecan-based chemotherapy (Table 4). We then hypothesized that TYMS rs3786362 might have important effects on PFS and OS in mCRC patients and could be a predictive biomarker for survival of mCRC patients in subgroups of younger age, well and moderate tumor differentiation, with metastatic organism ≤ 2 and non-smoking status.
Stratification analysis for the association between rs3786362 and mCRC survival in dominant model
| Variable | TYMS rs3786362 | PFS | OS | |||
|---|---|---|---|---|---|---|
| No. of (AG+GG) (%) | No. of AA (%) | HR (95% CI) | P | HR (95% CI) | P | |
| Sex | ||||||
| Male | 70 (34.1) | 135 (65.9) | 1.34 (0.96-1.88) | 0.088 | 1.67 (1.11-2.52) | 0.013 |
| Female | 34 (28.3) | 86 (71.7) | 2.09 (1.26-3.44) | 0.004 | 1.33 (0.70-2.53) | 0.378 |
| Age | ||||||
| ≤60 | 60 (34.3) | 115 (65.7) | 1.69 (1.17-2.45) | 0.005 | 1.70 (1.07-2.70) | 0.024 |
| >60 | 44 (29.3) | 106 (70.7) | 1.45 (0.94-2.32) | 0.089 | 1.39 (0.83-2.33) | 0.213 |
| Tumor site | ||||||
| Colon | 64 (33.0) | 130 (67.0) | 1.82 (1.25-2.66) | 0.002 | 1.26 (0.80-1.98) | 0.314 |
| Rectum | 40 (30.5) | 91 (69.5) | 1.27 (0.83-1.95) | 0.272 | 2.13 (1.26-3.60) | 0.005 |
| Tumor grade | ||||||
| Well + Moderate | 78 (30.6) | 177 (69.4) | 1.77 (1.28-2.44) | 0.001 | 1.71 (1.15-2.55) | 0.008 |
| Poor | 26 (37.1) | 44 (62.9) | 1.20 (0.62-2.32) | 0.584 | 0.96 (0.45-2.06) | 0.916 |
| Number of metastatic organism | ||||||
| ≤2 | 86 (31.5) | 187 (68.5) | 1.80 (1.32-2.45) | <0.001 | 1.69 (1.15-2.48) | 0.007 |
| >2 | 18 (34.6) | 34 (65.4) | 0.97 (0.45-2.11) | 0.947 | 1.03 (0.47-2.27) | 0.945 |
| Drinking status | ||||||
| Yes | 70 (31.0) | 156 (69.0) | 1.63 (1.15-2.30) | 0.006 | 1.22 (0.80-1.86) | 0.355 |
| No | 34 (34.3) | 65 (65.7) | 1.46 (0.88-2.42) | 0.141 | 2.86 (1.51-5.42) | 0.001 |
| Smoking status | ||||||
| Yes | 67 (31.5) | 146 (68.5) | 1.32 (0.92-1.91) | 0.131 | 1.27 (0.81-1.98) | 0.301 |
| No | 37 (33.0) | 75 (67.0) | 2.22 (1.32-3.60) | 0.001 | 2.47 (1.38-4.43) | 0.002 |
| Family history | ||||||
| Yes | 21 (37.5) | 35 (62.5) | 1.39 (0.65-2.96) | 0.396 | 1.82 (0.85-3.90) | 0.126 |
| No | 83 (30.9) | 186 (69.1) | 1.60 (1.17-2.22) | 0.003 | 1.43 (0.96-2.12) | 0.077 |
| Chemotherapy | ||||||
| Oxaliplatin | 61 (32.4) | 127 (67.6) | 1.97 (1.33-2.92) | 0.001 | 1.43 (0.90-2.26) | 0.130 |
| Irinotecan | 43 (31.4) | 94 (68.6) | 1.22 (0.81-1.83) | 0.351 | 1.79 (1.07-3.01) | 0.027 |
PFS: progression-free survival; OS: overall survival;
HR: hazard ratio; CI: confidence interval;
P: adjusted for sex, age, tumor site and chemotherapy in Cox regression model.
TYMS expression differences and survival analysis based on TCGA database
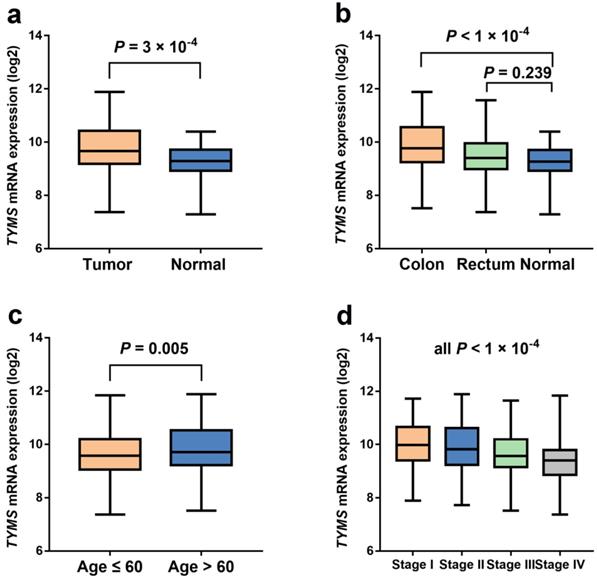
Our study indicated that the relationship between TYMS expression and OS of CRC patients was not statistically significant (P = 0.298) according to TCGA database (Figure 2). However, TYMS expression differences were significantly observed in our study. TYMS expression was increased in colorectal tumor tissues compared with adjacent tissues (P = 3.00 × 10⁻⁴) (Figure 3). Moreover, we assessed TYMS expression between colorectal tumor tissues and adjacent tissues based on tumor site. As a result, TYMS expression differences were only observed in colon cancer tissues and adjacent tissues (P < 1.00 × 10⁻⁴). Differential expression of TYMS was further analyzed in colorectal tumor tissues based on age, sex, CRC family history, BMI and tumor stage (Figure 3 and Supplementary Figure S2). Patients with younger age (P = 5.00 × 10⁻³) and advanced tumor stage (P < 1.00 × 10⁻⁴) were prone to have decreased expression of TYMS in our investigation.
The expression levels of TYMS in unpaired colorectal cancer and normal tissue samples from TCGA database. (a) The expression levels of TYMS in unpaired colorectal cancer and normal tissue samples from TCGA database. (b) The expression levels of TYMS in unpaired colorectal cancer and normal tissue samples stratified by tumor site from TCGA database. (c-d) The expression levels of TYMS in colorectal cancer tissue samples stratified by age and tumor stage from TCGA database.
Discussion
In the present study, we assessed the relationship between SNPs in the folic acid metabolic pathway genes and survival, as well as responses of mCRC patients to first-line chemotherapy. We found that TYMS rs3786362 G allele was significantly correlated with reduced PFS, OS and DCR.
The folic acid metabolic pathway plays a vital role in the development of CRC. The abnormal growth of colon mucosa cells contributes to CRC development, which is affected by DNA repair genes, oncogenes and tumor suppressor genes16. The folic acid family members are involved in the acceptation or reception of one-carbon units, thereby promoting pyrimidine and purine synthesis and various methylation reactions 17. One carbon derives from serine and then transfers to tetrahydrofolate (THF), a critical metabolite in the folic acid metabolic pathway. Then glycine and 5, 10-methylenetetrahydrofolate (5, 10-MTHF) are generated by serine hydroxymethyltransferase (SHMT). The conversion of dUMP to dTMP is catalyzed by TYMS, providing precursors for DNA synthesis. This progress is carried out with the availability of 5, 10-methylene-THF. The generated metabolite of this reaction is dihydrofolate (DHF), which is converted into THF with the help of dihydrofolate reductase (DHFR) 18.
Folic acid metabolism, known as one-carbon metabolism, also regulates DNA methylation reactions through the reduction of 5, 10-MTHF to 5-MTHF, which was mediated by the activity of MTHFR 19. Methionine synthase (MTR) plays an essential role in converting 5-MTHF and homocysteine to THF and methionine. S-adenosyl methionine (SAM) generated by the methionine metabolism serves as a methyl donor to DNA, RNA and phospholipids. SAM can also inhibit the activity of MTHFR, which regulates its cell expression. The folate coenzymes are activated to DNA synthesis with increasing expression of SAM. However, folate deficiency can depress the production of SAM and cancel the inhibition of MTHFR, resulting in a decline in nucleotide synthesis 20.
TYMS helps to convert dUMP and DHF to dTMP and 5, 10-methylene-THF in the folic acid metabolic pathway. Regulation of the TYMS reaction is essential for DNA synthesis due to its vital role in the pathway. TYMS impairment might be critical for point mutation formation, uracil misincorporation into DNA and cancerogenesis 21. TYMS is a treatment target of 5-FU. FdUMP, the metabolite of 5-FU, combines TYMS to form a ternary complex, thereby inhibiting the normal function of TYMS with the help of 5, 10-MTHF. Therefore, the genetic variants in folic acid metabolic pathway could influence the survival of CRC patients as a deficiency in cell folates leads to point mutations, aberrant DNA methylation, increased frequency of micronuclei and chromosome breakage 22. In 2014, FH. et.al 23 published a paper in which the relationship between low folate status and various cancers such as prostate, breast, and colorectal cancer was reported. Our study suggested that TYMS rs3786362 G allele was related to reduced PFS, OS and DCR of mCRC patients. We hypothesized that rs3786362 G allele in TYMS might be a potential predictive biomarker for survival and responses to first-line chemotherapy of mCRC patients by affecting the normal function of TYMS gene and folic acid metabolism. The mechanisms underlying the potential predictive ability of TYMS rs3786362 G allele may be its biological functions in disturbing the conversion of dUMP and DHF to dTMP and 5, 10-methylene-THF, thereby resulting in abnormal DNA synthesis.
The mutations in TYMS (g.657795_657826del, c.53_84del and p.Gln18Argfs*42) were reported to connect with survival of CRC 24. A meta-analysis conducted by Jennings BA et.al 25 suggested that TYMS rs45445694 was associated with the reduced protein expression and improved clinical benefit from 5-FU. However, inconsistent results were found in other investigations 26. Therefore, we analyzed the correlation between genetic variants in 15 key genes in folic acid metabolic pathway and survival, as well as responses to chemotherapy of mCRC patients. Three models (the additive, dominant, and recessive models) were applied to further investigate the interested SNPs. It was found that TYMS rs3786362 was associated with PFS, OS and DCR only in the additive and dominant models. It may be due to the the low mutation frequency of TYMS rs3786362 in Chinese population. According to TCGA database, TYMS expression was statistically higher in CRC tissues compared to adjacent tissues, indicating the positive effects of TYMS in cancer development. We observed the positive relationship between TYMS expression and CRC survival, but it was not statistically significant. As our study employing the TCGA database only included the American and European populations, more patients and follow-ups are needed to validate the correlation between TYMS expression and CRC survival in Chinese population.
We conducted the stratification analysis in subgroups of sex, age, tumor site, tumor grade, number of metastatic organism, drinking status, smoking status, family history, Dukes stage and chemotherapy regimens. It was found that TYMS rs3786362 AG/GG genotypes indicated shorter PFS time for recipients of oxaliplatin-based chemotherapies, and shorter OS time for recipients of irinotecan-based chemotherapies. A previous meta-analysis including 7 clinical studies revealed that the response rate of patients treated with oxaliplatin-based chemotherapies was higher than those in irinotecan group. In addition, the OS time was longer in oxaliplatin group compared with that in irinotecan group 27. This contradictory result may be due to different sensitivity and tolerance of chemotherapy for individuals. Larger cohort studies are needed to confirm the relationship between TYMS rs3786362 and sensitivity of different chemotherapy regimens for mCRC patients.
There were some inherent limitations in our study. Firstly, clinical characteristics of patients may have introduced bias to our results due to the relatively small sample size. Therefore, large populations are warranted to confirm our findings. Secondly, we tried to conduct the eQTL analysis based on GTEx and TCGA database, but no relevant results were observed as the mutation frequency of rs3786362 was less than 0.01 in Western population. Therefore, the eQTL analysis should be further carried out in our study in Chinese population. Thirdly, no direct biology experiments were performed in vitro or in vivo for additional validations in our study.
In summary, our study provided evidence that the genetic variants in the folic acid metabolic pathway genes were associated with outcomes of mCRC patients undergoing first-line chemotherapy. Our study suggested that the TYMS rs3786362 G allele might be a potential predictive biomarker for reduced PFS, OS and DCR of mCRC patients receiving first-line chemotherapy, which might be the scientific foundation to predict survival and first-line chemotherapy efficiency of mCRC patients in the future.
Supplementary Material
Supplementary figures and tables.
Acknowledgements
Funding
This study was partially supported by Jiangsu Provincial Medical Talent (ZDRCA2016089).
Ethical approval and consent to participate
The protocol was approved by the Institutional Review Board of Nanjing Medical University. All patients gave their written informed consent before enrollment and the clinical characteristics of patients were described previously.
Data availability
All data generated or analyzed during this study are included in this article
Authors' contributions
Lingjun Zhu, Tao Chen and Meilin Wang designed experiments; Lu Jiang and Shuwei Li carried out experiments; Lu Jiang and Shuwei Li analyzed experimental results. Ming Yuan and Ling Ma analyzed sequencing data. Yu Lin, Weiyou Zhu and Haina Du developed analysis tools. Lingjun Zhu wrote the manuscript.
Competing Interests
The authors have declared that no competing interest exists.
References
1. Siegel RL, Miller KD. Colorectal cancer statistics. CA Cancer J Clin. 2020;0:1-20
2. Fitzmaurice C, Abate D, Abbasi N. et al. Global, Regional, and National Cancer Incidence, Mortality, Years of Life Lost, Years Lived With Disability, and Disability-Adjusted Life-Years for 29 Cancer Groups, 1990 to 2017: A Systematic Analysis for the Global Burden of Disease Study. JAMA oncology. 2019;5(12):1749-1768
3. de Haas RJ, Wicherts DA, Andreani P. et al. Impact of expanding criteria for resectability of colorectal metastases on short- and long-term outcomes after hepatic resection. Ann Surg. 2011;253(6):1069-1079
4. Crider KS, Bailey LB, Berry RJ. Folic acid food fortification-its history, effect, concerns, and future directions. Nutrients. 2011;3(3):370-384
5. Newman AC, Maddocks ODK. One-carbon metabolism in cancer. British journal of cancer. 2017;116(12):1499-1504
6. Kok DE, Steegenga WT, Smid EJ. Bacterial folate biosynthesis and colorectal cancer risk: more than just a gut feeling. Crit Rev Food Sci Nutr. 2020;60(2):244-256
7. Jennings BA, Willis G. How folate metabolism affects colorectal cancer development and treatment; a story of heterogeneity and pleiotropy. Cancer letters. 2015;356(2 Pt A):224-230
8. Mohelnikova-Duchonova B, Melichar B, Soucek P. FOLFOX/FOLFIRI pharmacogenetics: the call for a personalized approach in colorectal cancer therapy. World J Gastroenterol. 2014;20(30):10316-10330
9. McQuade RM, Stojanovska V, Bornstein JC, Nurgali K. Colorectal Cancer Chemotherapy: The Evolution of Treatment and New Approaches. Curr Med Chem. 2017;24(15):1537-1557
10. Voutsadakis IA. Obesity and diabetes as prognostic factors in patients with colorectal cancer. Diabetes & metabolic syndrome. 2017;11(Suppl 1):S109-S114
11. Li S, Xie L, Du M. et al. Association study of genetic variants in estrogen metabolic pathway genes and colorectal cancer risk and survival. Archives of toxicology. 2018;92(6):1991-1999
12. Chen K, Liu H. Genetic variants in RUNX3, AMD1 and MSRA in the methionine metabolic pathway and survival in nonsmall cell lung cancer patients. Int J Cancer. 2019;145(3):621-631
13. Jang MJ, Kim JW, Jeon YJ. et al. Polymorphisms of folate metabolism-related genes and survival of patients with colorectal cancer in the Korean population. Gene. 2014;533(2):558-564
14. Zhang K, Meng Y, Cao X. et al. Genetic variants in p53 signaling pathway genes predict chemotherapy efficacy in colorectal cancer. Cancer Med. 2019;8(7):3428-3436
15. Eisenhauer EA, Therasse P, Bogaerts J. et al. New response evaluation criteria in solid tumours: revised RECIST guideline (version 1.1). European journal of cancer (Oxford, England: 1990). 2009;45(2):228-247
16. Liang Y, Zhang C, Dai DQ. Identification of differentially expressed genes regulated by methylation in colon cancer based on bioinformatics analysis. World J Gastroenterol. 2019;25(26):3392-3407
17. Ebara S. Nutritional role of folate. Congenital anomalies. 2017;57(5):138-141
18. Molloy AM. Genetic aspects of folate metabolism. Sub-cellular biochemistry. 2012;56:105-130
19. Ferrari A, Torrezan GT, Carraro DM, Aguiar Junior S. Association of Folate and Vitamins Involved in the 1-Carbon Cycle with Polymorphisms in the Methylenetetrahydrofolate Reductase Gene (MTHFR) and Global DNA Methylation in Patients with Colorectal Cancer. Nutrients. 2019;11(6):3428-3436
20. Fenech M. The role of folic acid and Vitamin B12 in genomic stability of human cells. Mutation research. 2001;475(1-2):57-67
21. Duthie SJ. Folate and cancer: how DNA damage, repair and methylation impact on colon carcinogenesis. Journal of inherited metabolic disease. 2011;34(1):101-109
22. Robinson AD, Eich ML, Varambally S. Dysregulation of de novo nucleotide biosynthetic pathway enzymes in cancer and targeting opportunities. Cancer letters. 2020;470:134-140
23. Nazki FH, Sameer AS, Ganaie BA. Folate: metabolism, genes, polymorphisms and the associated diseases. Gene. 2014;533(1):11-20
24. Balboa-Beltran E, Duran G, Lamas MJ, Carracedo A, Barros F. Long Survival and Severe Toxicity Under 5-Fluorouracil-Based Therapy in a Patient With Colorectal Cancer Who Harbors a Germline Codon-Stop Mutation in TYMS. Mayo Clin Proc. 2015;90(9):1298-1303
25. Jennings BA, Kwok CS, Willis G, Matthews V, Wawruch P, Loke YK. Functional polymorphisms of folate metabolism and response to chemotherapy for colorectal cancer, a systematic review and meta-analysis. Pharmacogenetics and genomics. 2012;22(4):290-304
26. Gusella M, Frigo AC, Bolzonella C. et al. Predictors of survival and toxicity in patients on adjuvant therapy with 5-fluorouracil for colorectal cancer. British journal of cancer. 2009;100(10):1549-1557
27. Liang XB, Hou SH, Li YP, Wang LC, Zhang X, Yang J. Irinotecan or oxaliplatin combined with 5-fluorouracil and leucovorin as first-line therapy for advanced colorectal cancer: a meta-analysis. Chinese medical journal. 2010;123(22):3314-3318
Author contact
![]() Corresponding authors: Lingjun Zhu, Department of Oncology, The First Affiliated Hospital of Nanjing Medical University, 300 Guangzhou Rd, Nanjing 210029, Nanjing, China, Tel.: +13951807457; E-mail: zhulingjunedu.cn; Tao Chen, Department of Gastrointestinal Surgery, The First Affiliated Hospital of Nanjing Medical University, 300 Guangzhou Rd, Nanjing 210029, Nanjing, China; Tel.: + 13813955979; E-mail: ct55979com.
Corresponding authors: Lingjun Zhu, Department of Oncology, The First Affiliated Hospital of Nanjing Medical University, 300 Guangzhou Rd, Nanjing 210029, Nanjing, China, Tel.: +13951807457; E-mail: zhulingjunedu.cn; Tao Chen, Department of Gastrointestinal Surgery, The First Affiliated Hospital of Nanjing Medical University, 300 Guangzhou Rd, Nanjing 210029, Nanjing, China; Tel.: + 13813955979; E-mail: ct55979com.