Impact Factor ISSN: 1837-9664

 Global reach, higher impact
J Cancer 2017; 8(2):162-173. doi:10.7150/jca.16037 This issue Cite
Research Paper
Construction of a multiplex mutation hot spot PCR panel: the first step towards colorectal cancer genotyping on the GS Junior platform
Bálint Péterfia1,2 ![]() , Alexandra Kalmár1, Árpád V. Patai1, István Csabai3, András Bodor3, Tamás Micsik4, Barnabás Wichmann2, Krisztina Egedi4, Péter Hollósi4,5, Ilona Kovalszky4, Zsolt Tulassay1,2, Béla Molnár1, 2
, Alexandra Kalmár1, Árpád V. Patai1, István Csabai3, András Bodor3, Tamás Micsik4, Barnabás Wichmann2, Krisztina Egedi4, Péter Hollósi4,5, Ilona Kovalszky4, Zsolt Tulassay1,2, Béla Molnár1, 2
1. 2nd Department of Internal Medicine, Semmelweis University, Budapest, Hungary;
2. Molecular Medicine Research Group, Hungarian Academy of Sciences, Budapest, Hungary;
3. Department of Physics of Complex Systems, Eötvös Loránd University, Budapest, Hungary;
4. 1st Department of Pathology and Experimental Cancer Research, Semmelweis University, Budapest, Hungary;
5. Tumor Progression Research Group, Hungarian Academy of Sciences, Budapest, Hungary.
Received 2016-5-2; Accepted 2016-9-4; Published 2017-1-12
Abstract
Background: To support cancer therapy, development of low cost library preparation techniques for targeted next generation sequencing (NGS) is needed. In this study we designed and tested a PCR-based library preparation panel with limited target area for sequencing the top 12 somatic mutation hot spots in colorectal cancer on the GS Junior instrument.
Materials and Methods: A multiplex PCR panel was designed to amplify regions of mutation hot spots in 12 selected genes (APC, BRAF, CTNNB1, EGFR, FBXW7, KRAS, NRAS, MSH6, PIK3CA, SMAD2, SMAD4, TP53). Amplicons were sequenced on a GS Junior instrument using ligated and barcoded adaptors. Eight samples were sequenced in a single run. Colonic DNA samples (8 normal mucosa; 33 adenomas; 17 adenocarcinomas) as well as HT-29 and Caco-2 cell lines with known mutation profiles were analyzed. Variants found by the panel on APC, BRAF, KRAS and NRAS genes were validated by conventional sequencing.
Results: In total, 34 kinds of mutations were detected including two novel mutations (FBXW7 c.1740:C>G and SMAD4 c.413C>G) that have not been recorded in mutation databases, and one potential germline mutation (APC). The most frequently mutated genes were APC, TP53 and KRAS with 30%, 15% and 21% frequencies in adenomas and 29%, 53% and 29% frequencies in carcinomas, respectively. In cell lines, all the expected mutations were detected except for one located in a homopolymer region. According to re-sequencing results sensitivity and specificity was 100% and 92% respectively.
Conclusions: Our NGS-based screening panel denotes a promising step towards low cost colorectal cancer genotyping on the GS Junior instrument. Despite the relatively low coverage, we discovered two novel mutations and obtained mutation frequencies comparable to literature data. Additionally, as an advantage, this panel requires less template DNA than sequence capture colon cancer panels currently available for the GS Junior instrument.
Keywords: Targeted next generation sequencing - colorectal cancer - cancer genotyping - targeted cancer therapy - GS Junior - mutation hot-spots - mutation screening.
Introduction
Sequential accumulation of somatic mutations in certain tumor suppressor genes and oncogenes during cancer development was described by Vogelstein and Fearon [1, 2]. This model has been confirmed by later studies [3, 4], and is considered fundamental to modern cancer genomics. With the development of high throughput and economical next generation sequencing (NGS) methods, innumerable different somatic mutations have been discovered for hundreds of genes in several kind of tumors, so the genetic model of cancer have been refined [5, 6]. In colon cancer, a limited number of oncogene and tumor suppressor gene mutations are reported to be crucial in the development of the disease [7]. Moreover, analysis a number of these mutations has become essential in directing targeted cancer therapy. To support further clinical implementation for targeted therapy, development of low cost targeted NGS library preparation techniques is needed focusing on limited number, disease-specific genes [8].
Three of the most popular small-scale NGS instruments suitable for targeted sequencing are the MiSeq Desktop Sequencer (Illumina, San Diego, CA, USA), the Ion PGM™ System (Thermo Fisher Scientific, Waltham, MA, USA) and the GS Junior Instrument (Roche Applied Science, Penzberg, Germany). For each system, several targeted library preparation methods exist, and some predesigned panels are commercially available as well, but many of them are not applicable for the GS Junior since its capacity is the lowest. In addition, in case of GS Junior and Ion PGM, false positive insertion or deletion mutations can also be detected - especially for longer homopolymers - since the number of identical nucleotides following each other is calculated from the signal intensity detected after dispensing each nucleotide [9, 10].
Recently, a multiplex PCR-based library preparation panel, the Ion AmpliSeq Cancer Panel has become available for the Ion Torrent platform [11]. Another predesigned library preparation panel is the Human Colorectal Cancer Panel (Qiagen, Hilden, Germany). However, the lower capacity of the GS Junior instrument renders these panels less effective on this platform. While a sequence capture panel is available for screening cancer-related somatic mutations for the GS Junior [12], multiplex PCR-based panels are only available for germline mutations, such as APC or BRCA1 and BRCA2 [13].
In this study, we aimed to design and test a multiplex PCR-based library preparation panel for the GS Junior NGS instrument in order to enable rapid, simultaneous and economic sequencing of colon cancer mutation hot spots.
Materials and Methods
Selection of panel genes and mutation hot spot regions
The selection of target genes was based on mutation data in the Catalogue of Somatic Mutations in Cancer (COSMIC) database [14]. Genes were selected based on their mutation frequencies in colorectal cancer (CRC) or if they were routinely investigated in targeted oncotherapy. Since the capacity of the GS Junior instrument is limited, our objective was to reduce the length of target regions and maximize the effectiveness of the panel by focusing primarily on the mutation hot spots of these genes (Table 1).
Full cDNA sequences and target regions of selected genes.
| Gene Symbol | cDNA sequence | full cDNA | target region |
|---|---|---|---|
| APC | ENST00000457016 | 1-8532 | 3805-4737 |
| BRAF | ENST00000288602 | 1-2301 | 1766-1809 |
| CTNNB1 | ENST00000349496 | 1-2346 | 14-155 |
| EGFR ex18 | ENST00000275493 | 1-3633 | 2116-2174 |
| EGFR ex21 | ENST00000275493 | 1-3633 | 2540-2620 |
| FBXW7 | ENST00000281708 | 1-2124 | 1290-1418 |
| FBXW7 | ENST00000281708 | 1-2124 | 1425-1561 |
| FBXW7 | ENST00000281708 | 1-2124 | 1701-1812 |
| KRAS | ENST00000311936 | 1-567 | 9-111 |
| MSH6 | ENST00000234420 | 1-4083 | 3240-3300 |
| MSH6 | ENST00000234420 | 1-4083 | 2832-2938 |
| NRAS | ENST00000369535 | 1-570 | 21-73 |
| NRAS | ENST00000369535 | 1-570 | 140-239 |
| PIK3CA | NM_006218.1 | 1-3207 | 1566-1656 |
| PIK3CA | NM_006218.1 | 1-3207 | 3051-3164 |
| SMAD2 | ENST00000262160 | 1-1404 | 895-965 |
| SMAD4 | ENST00000342988 | 1-1659 | 968-1108 |
| SMAD4 | ENST00000342988 | 1-1659 | 1471-1622 |
| SMAD4 | ENST00000342988 | 1-1659 | 281-408 |
| TP53 | ENST00000269305 | 1-1183 | 418-560 |
| TP53 | ENST00000269305 | 1-1183 | 673-782 |
| TP53 | ENST00000269305 | 1-1183 | 783-919 |
Gene Symbol, cDNA Ensembl ID or RefSeq ID of selected genes together with the target regions are listed.
Design and preparation of the multiplex mutation hot spot PCR panel primers
Ion Ampliseq Designer (Thermo Fisher Scientific) was used to generate multiplex PCR primer sequences to amplify selected gene regions (Table 2). Ampliseq primers comprising the panel were obtained from Thermo Fisher Scientific.
List of primer sequences designed to amplify target regions.
| amplicon name | Forward primer sequence (5'-3') | Reverse primer sequence (5'-3') | Chromo-some number | Amplicon Start | Amplicon Stop | amplicon length | pool number | primer conc. in the pool (μM) |
|---|---|---|---|---|---|---|---|---|
| APC_1 | TACAGACTTATTGTGTAGAAGATACTCCA | chr5 | 112175067 | 112175239 | 172 | Pool1 | 1 | |
| APC_2 | GCTAATACCCTGCAAATAGCAGAA | AAGAAAATTCAACAGCTTTGTGCCT | chr5 | 112175186 | 112175357 | 171 | Pool2 | 2 |
| APC_3 | GCAGGGTTCTAGTTTATCTTCAGAATCA | GTGAACTGACAGAAGTACATCTGCTA | chr5 | 112175302 | 112175468 | 166 | Pool1 | 4 |
| APC_4 | TCAGGAGACCCCACTCATGTT | GCATGGTTTGTCCAGGGCTATC | chr5 | 112175422 | 112175585 | 163 | Pool2 | 4 |
| APC_5 | CATTATAAGCCCCAGTGATCTTCCA | GCATTTACTGCAGCTTGCTTAGG | chr5 | 112175539 | 112175712 | 173 | Pool1 | 1 |
| APC_6 | ACTGCTGAAAAGAGAGAGAGTGGA | AGCACTCAGGCTGGATGAAC | chr5 | 112175666 | 112175815 | 149 | Pool2 | 2 |
| APC_7 | CGGAAAGTACTCCAGATGGATTTTCTT | CATTTGATTCTTTAGGCTGCTCTGATTC | chr5 | 112175769 | 112175930 | 161 | Pool1 | 0,5 |
| APC_8 | AGGAAAATGACAATGGGAATGAAACA | GACTTTGTTGGCATGGCAGAAAT | chr5 | 112175877 | 112176051 | 174 | Pool2 | 1 |
| BRAF | CATCCACAAAATGGATCCAGACAAC | GCTTGCTCTGATAGGAAAATGAGAT | chr7 | 140453075 | 140453249 | 174 | Pool1 | 0,5 |
| CTNNB1_1 | ATTTCAATGGGTCATATCACAGATTCTT | GTAAGACTGTTGCTGCCAGTG | chr3 | 41265928 | 41266093 | 165 | Pool1 | 2 |
| CTNNB1_2 | AGACAGAAAAGCGGCTGTTAGT | AGGTATCCACATCCTCTTCCTCAG | chr3 | 41266051 | 41266181 | 130 | Pool2 | 1 |
| EGFR_ex18 | GTGACCCTTGTCTCTGTGTTCTT | CTGTGCCAGGGACCTTACC | chr7 | 55241580 | 55241754 | 174 | Pool1 | 4 |
| EGFR_ex21 | CTGGCAGCCAGGAACGTA | GGAAAATGCTGGCTGACCTAAAG | chr7 | 55259454 | 55259602 | 148 | Pool2 | 3 |
| FBXW7_1_1 | GAGCACACTGTCACTATTTCAGTAACT | ACACCTTATATGGGCATACTTCCAC | chr4 | 153249262 | 153249414 | 152 | Pool2 | 2 |
| FBXW7_1_2 | CATGAAGATGCATACAACGCACA | GGTGGAGTATGGTCATCACAAATGAG | chr4 | 153249367 | 153249514 | 147 | Pool1 | 1 |
| FBXW7_2_1 | TGCAACGTGTGTAGACAGGTTT | GCCACTCTTAGGGTTTGGGATAT | chr4 | 153247189 | 153247361 | 172 | Pool2 | 2 |
| FBXW7_2_2 | CATGTAAACACTGGCCTGTCTCA | CCTTGACTAAATCTACCATGTTTTCTCA | chr4 | 153247316 | 153247477 | 161 | Pool1 | 1 |
| FBXW7_3 | CACTGTCCTGTTTTGATATCCCAGA | GGATCTCTTGATACATCAATCCGTGTTT | chr4 | 153245353 | 153245522 | 169 | Pool1 | 1,25 |
| KRAS_kod12_13 | AAAGAATGGTCCTGCACCAGTAA | AAGGCCTGCTGAAAATGACTGA | chr12 | 25398161 | 25398332 | 171 | Pool1 | 1 |
| MSH6_1 | GTCCTATGTGTCGCCCAGTA | CTTCCTCACAGCCTATTAGAATGTCATT | chr2 | 48030601 | 48030744 | 143 | Pool2 | 6 |
| MSH6_2 | CTTTGACTCTGATTATGACCAAGCTCT | CAAATTGCGAGTGGTGAAATTCTCA | chr2 | 48027918 | 48028092 | 174 | Pool1 | 2 |
| NRAS_1 | CCACTGGGCCTCACCTCTAT | CTGATTACTGGTTTCCAACAGGTTCT | chr1 | 115258657 | 115258819 | 162 | Pool1 | 0,75 |
| NRAS_2_1 | GGTAACCTCATTTCCCCATAAAGATTCA | AGTACAGTGCCATGAGAGACCA | chr1 | 115256349 | 115256523 | 174 | Pool1 | 4 |
| NRAS_2_2 | CCTTCGCCTGTCCTCATGTAT | CCCCAGGATTCTTACAGAAAACAAGT | chr1 | 115256481 | 115256605 | 124 | Pool2 | 0,5 |
| PIK3CA_1 | CAGAGTAACAGACTAGCTAGAGACAATGA | CTCCATTTTAGCACTTACCTGTGACT | chr3 | 178935995 | 178936140 | 145 | Pool1 | 0,5 |
| PIK3CA_2 | TGGAATGCCAGAACTACAATCTTTTGA | CTGTTTAATTGTGTGGAAGATCCAATCC | chr3 | 178951969 | 178952137 | 168 | Pool2 | 1 |
| SMAD2 | CTATATGCCTTCTTGTCATTTCTACCGT | GGAGAAACCTTCCATGCATCACA | chr18 | 45374846 | 45374984 | 138 | Pool1 | 3 |
| SMAD4_1_1 | GAAAAACTGTGTTGTGGAGTGCAA | CTCCTACCTGAACATCCATTTCAAAGTA | chr18 | 48591712 | 48591846 | 134 | Pool2 | 2 |
| SMAD4_1_2 | CCTGAGTATTGGTGTTCCATTGCT | TCTCAATGGCTTCTGTCCTGTG | chr18 | 48591795 | 48591969 | 174 | Pool1 | 0,75 |
| SMAD4_2_1 | ATTTAGAATGTAGGGAGGATGGGAAGA | CAGCCTTTCACAAAACTCATCCTG | chr18 | 48604556 | 48604704 | 148 | Pool2 | 0,5 |
| SMAD4_2_2 | GACCTTCGTCGCTTATGCATACT | GGTCTGCAATCGGCATGGTA | chr18 | 48604658 | 48604820 | 162 | Pool1 | 2 |
| SMAD4_3_1 | GTGGCTGGTCGGAAAGGATT | AACTCGTTCGTAGTGATATGGATTCAC | chr18 | 48575056 | 48575214 | 158 | Pool2 | 2 |
| SMAD4_3_2 | CGTTTGACTTAAAATGTGATAGTGTCTGT | CGCGGGCTATCTTCCAAATTTATAAT | chr18 | 48575159 | 48575333 | 174 | Pool1 | 0,5 |
| TP53_1_1 | GACCTAAGAGCAATCAGTGAGGAA | CATCTACAAGCAGTCACAGCAC | chr17 | 7578287 | 7578447 | 160 | Pool1 | 1 |
| TP53_1_2 | CGCCTCACAACCTCCGTCAT | ATGTTTTGCCAACTGGCCAAG | chr17 | 7578406 | 7578533 | 127 | Pool2 | 2 |
| TP53_2_1 | GGGATGTGATGAGAGGTGGAT | CCATCCTCACCATCATCACACTG | chr17 | 7577372 | 7577532 | 160 | Pool1 | 2 |
| TP53_2_2 | GGCTCCTGACCTGGAGTCTT | CATCTTGGGCCTGTGTTATCTCC | chr17 | 7577489 | 7577634 | 145 | Pool2 | 0,75 |
| TP53_3_1 | CGCTTCTTGTCCTGCTTGCTTA | TCCTATCCTGAGTAGTGGTAATCTACTG | chr17 | 7576996 | 7577170 | 174 | Pool1 | 1 |
| TP53_3_2 | GCACCTCAAAGCTGTTCCGT | CAAGGGTGGTTGGGAGTAGATG | chr17 | 7577121 | 7577255 | 134 | Pool2 | 4 |
As indicated, primers were designed to amplify in two separate multiplex PCR reactions. The genome position of recognition sites are provided together with their concentrations in the corresponding PCR primer pool.
Tissue sample collection
Biopsy samples were taken in the course of routine colonoscopy examinations. Histological diagnoses were established by experienced pathologists. Microsatellite status analysis of adenoma and CRC samples was performed by immunohistochemistry as described previously [15]. A sample was scored microsatellite stable (MSS) if all four main mismatch repair genes (MLH1, MSH2, MSH6 and PMS2) proved to be positive at protein level. All of our samples selected for this study were MSS. Colon tumor samples (left-sided, moderately differentiated, Dukes A-C stages, n=17), adenoma samples (n=33) and histologically normal adjacent tissue (NAT, n=8) originated from the area at least 10 cm far away from the tumor were analyzed. Adenoma samples were histologically classified as tubular adenomas with low-grade (AD-LGD, n=16) or high-grade (AD-HGD, n=6) dysplasia and serrated adenomas (AD-serr, n=11). Biopsy samples were stored in RNAlater Reagent (Qiagen) at -80°C until utilization. In addition, two cell lines, HT-29 (ATCC® HTB-38™) and Caco-2 (ATCC® HTB-37™) were also investigated as control samples, with known mutation profiles. The study was approved by the Semmelweis University Regional and Institutional Committee of Science and Research Ethics (ETT TUKEB 23970/2011). Written informed consent was provided by all patients.
Genomic DNA isolation
For genomic DNA isolation, the High Pure PCR Template Preparation Kit (Roche) was used according to the manufacturer's instructions. Concentrations of isolated DNA were measured using a Qubit fluorometer (Thermo Fisher Scientific) with Qubit dsDNA HS Assay.
Multiplex PCR
Multiplex PCR reactions were performed in two tubes for each sample by using 12.5 μl of GeneRead Gene Panel Mastermix (Qiagen), 2.5 μl of pre-made primer pool1 or primer pool2 (Table 2), 7 μl of water and 3 μl of DNA samples (containing 10-20 ng of isolated DNA). The final volume was 25µl. Multiplex PCR amplification was carried out with the following thermocycling conditions in an Eppendorf Mastercycler ep gradient S instrument (Eppendorf, Hamburg, Germany): 95°C for 10 minutes, followed by the amplification 95°C for 15 sec and 60°C for 2 minutes in 30 cycles, then 72°C for 10 minutes and 4°C forever store.
GS Junior library preparation and sequencing
The concentration of multiplex PCR products was measured on a Qubit fluorometer using High Sensitivity dsDNA reagent and molarity was calculated. The amplicons for a given sample produced in each of the two multiplex reactions were pooled at an equimolar ratio. Before adaptor ligation, 30-50 μl of pooled PCR products were purified with AMPure beads (Agencourt, Beckman Coulter Genomics, Pasadena, CA, USA) according to the manufacturer's standard protocol and NEBNext® dA-Tailing Module was used to add 3' adenine overhang (New England Biolabs (NEB), Ipswich, MA, USA). After dA-Tailing, PCR products were purified by AMPure beads, then 5' phosphorylated with T4 Polynucleotide Kinase (NEB) in T4 DNA Ligase Reaction buffer (NEB B0202) at 37°C for 30 minutes. After this incubation, 1 μl of Rapid Library Molecular Identifier (RL_MID) adaptor and 0.5 μl of high concentration T4 DNA Ligase (NEB) were added to the mixture, suspended and incubated overnight at 17°C. After ligation, PCR libraries were purified twice with AMPure beads and analyzed using the High Sensitivity DNA Chip on the Agilent Bioanalyzer (Agilent, Santa Clara, CA, USA) to assess sample library quality.
Library quantification was determined by fluorometric measurements using Qubit dsDNA HS reagent and libraries were mixed at equimolar ratios. Identification of each library was based on library specific MID adaptors. Amplicon library pools were then prepared at a 2 DNA molecule per bead ratio using the Lib-L emPCR Kit (Roche), following the manufacturer's instructions, though modified to use a lower concentration of Amplification primer (40 μl primer instead of 80 μl stated in the standard protocol). This modification was necessary because of the usage of short amplicons to prevent excess template amplification during emPCR. Bead enrichment and sequencing were performed using GS Junior Titanium Sequencing Kit (Roche) and the method described in the Sequencing Method Manual, GS FLX Titanium Series. Eight samples were sequenced in parallel in one GS Junior run.
Evaluation of GS Junior sequencing results
The Amplicon Variant Analyzer software (AVA, Roche) was used to identify variants with the following parameters: minimum variant read counts: 5; minimum variants: 5%, forward and reverse.
Verification of variants identified by the NGS panel
To validate the results of our NGS panel with an alternative method, unknown, presumably novel variants, as well as APC, KRAS, NRAS and BRAF variants of CRC samples were re-sequenced with conventional sequencing instruments. In order to avoid technical artefacts, independent primer sets were used for this validation different from those used for the multiplex panel (Table 4).
Re-sequencing primers.
| primer name | primer sequence (5'-3') | Chr. Numb. | Primer 5' Start | Primer 3' Stop |
|---|---|---|---|---|
| APC_3676-4192_F | TGTAAAACGACGGCCAGTCGTCCACACCTTCATCTAATGCC | 5 | 112839246 | 112839269 |
| APC_3676-4192_R | CAGGAAACAGCTATGACCGGAGCTGGCAATCGAACGAC | 5 | 112839806 | 112839786 |
| APC_3968-4425_F | TGTAAAACGACGGCCAGTCTGAAGATCCTGTGAGCGAAG | 5 | 112839540 | 112839556 |
| APC_3968-4425_R | CAGGAAACAGCTATGACCAGAACCTGGACCCTCTGAAC | 5 | 112840040 | 112840024 |
| APC_4296-4804_F | TGTAAAACGACGGCCAGTAGCCCTGGACAAACCATGCC | 5 | 112839869 | 112839889 |
| APC_4296-4804_R | CAGGAAACAGCTATGACCGGTTTCCTTGCCACAGGTGGAG | 5 | 112840421 | 112840398 |
| CTNNB1_14-241_F | TGTAAAACGACGGCCAGTTTGGCTGTCTTTCAGATTTG | 3 | 41224400 | 41224419 |
| CTNNB1_14-241_R | CAGGAAACAGCTATGACCTGACTTTCAGTAAGGCAATG | 3 | 41224771 | 41224790 |
| SMAD4_250-424_F | TGTAAAACGACGGCCAGTCTGAGTTGGTAGGATTGTGAG | 18 | 51048594 | 51048615 |
| SMAD4_250-424_R | CAGGAAACAGCTATGACCTATAATGCTTTCCATCTTATTTCTC | 18 | 51049096 | 51049121 |
| FBXW7_1645-1855_F | TGTAAAACGACGGCCAGTACCTGTTTCCCATCCTCTTCC | 4 | 152324496 | 152324476 |
| FBXW7_1645-1855_R | CAGGAAACAGCTATGACCTGTGATGCTAAGGCTCCATATTTC | 4 | 152324128 | 152324105 |
| KRAS_F | GGCCTGCTGAAAATGACTGA | 12 | 25245396 | 25245376 |
| KRAS_R_Biotin | biotin-AGCTGTATCGTCAAGGCACTCT | 12 | 25245316 | 25245338 |
| KRAS_seq | AAACTTGTGGTAGTTGGA | 12 | 25245372 | 25245354 |
| NRAS_F | GATTCTTACAGAAAACAAGTGGTTATAGAT | 1 | 114713978 | 114713948 |
| NRAS_R_Biotin | biotin-GCAAATACACAGAGGAAGCCTTCG | 1 | 114713841 | 114713865 |
| NRAS_seq | CTGTTTGTTGGACATACTG | 1 | 114713940 | 114713921 |
| BRAF_F | TGAAGACCTCACAGTAAAAATAGG | 7 | 140753380 | 140753356 |
| BRAF_R_Biotin | biotin-TCCAGACAACTGTTCAAACTGAT | 7 | 140753289 | 140753312 |
| BRAF_seq | TGATTTTGGTCTAGCTACA | 7 | 140753356 | 140753337 |
List of primers used to validate GS Junior sequencing results. The sequence of universal 5' M13 tags are underlined. The position of primers refers to the GRCh38/hg83 genome. Chr. Numb.: chromosome number; F: forward; R: reverse; Biotin: 5' biotin tag; seq: sequencing primer.
APC variants were re-sequenced using M13 tagged PCR primers (Table 4) followed by a standard Sanger sequencing protocol. For re-sequencing KRAS codon 12, codon 13 and BRAF mutations, we used PCR and sequencing primer sets published by Susan D. Richman and colleagues followed by pyrosequencing [16]. In case of NRAS mutations a previously published primer set and pyrosequencing was used as well [17]. Before both Sanger and pyrosequencing reactions, PCR amplification was executed using 20-50 ng sample DNA per reaction, AmpliTaq Gold® 360 Master Mix (Thermo Fisher Scientific) and the appropriate PCR primers in 0.2 μM final concentrations. Thermal cycling conditions for all amplicons were as follows: 95°C for 12 minutes followed by 40 cycles of 95°C for 10 seconds, 58°C for 20 seconds, and 72°C for 20 seconds. The quantity and quality of PCR products were verified on a 2% agarose gel. Sanger sequencing was performed with BigDye® Terminator v3.1 Cycle Sequencing Kit (Thermo Fisher Scientific). Sequencing was carried out on an Applied Biosystems® 3500 Genetic Analyzer (Thermo Fisher Scientific). Sanger sequencing results were analyzed using the BioEdit sequence alignment software (Ibis Biosciences, Carlsbad, CA, USA). For pyrosequencing, a standard protocol was applied [18], and the PyroMark Q24 Software (Qiagen) was used to evaluate pyrosequencing results.
Results
Technical performance of the PCR panel
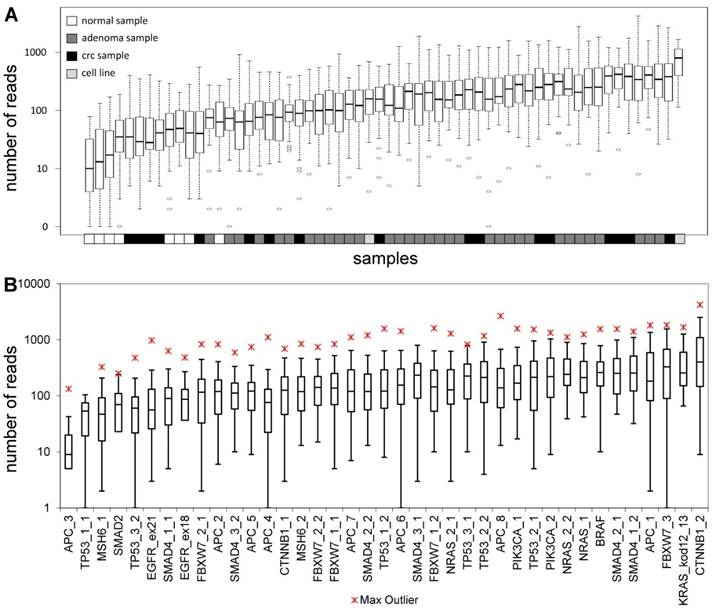
The total length of target regions of the constructed panel was 3,004 bp, where the mutation hot-spots of the 12 selected genes were amplified by 39 PCR primer pairs distributed into 2 multiplex PCR reactions. The number of reads for a sequencing run passing the quality filters was typically around 80,000. In each sequencing run, amplicons from 8 samples were sequenced in parallel. Samples had 9,768 AQ20 reads on average, and total read number was above 4,000 in 83% of samples, except for normal samples that were sequenced in lower depth (Figure 1A). Genome regions recognized by the amplicons were covered by an average of 224 reads, with a relatively high standard deviation of 209. Five amplicons failed consistently to be sequenced with a minimum coverage of 40 in 25% of the samples (APC_3; TP53_1_1; MSH6_1; SMAD2 and TP53_3_2) (Figure 1B). Redesigning these primer pairs would be reasonable in the future in order to achieve better sequencing depths of these gene regions.
Sequencing depth. Average number of reads grouped by the samples (A) and amplicons (B), respectively. Sample types are color-coded and the name of the amplicons are shown on the lower horizontal axis. Please note the logarithmic vertical scale.
Homopolymer errors
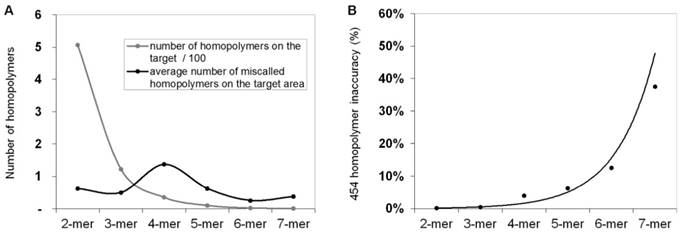
In order to calculate and quantify the inaccuracy of GS Junior sequencing at homopolymer regions, the frequency of false positive insertion or deletion calls was counted at these regions in mutation free normal samples. The frequency of these miscalls in the target area were estimated. The most miscalls, 1.4 / 3,004 bp were observed for 4-mer homopolymers (Figure 2A), which is due to the relative high frequency (35 / 3,004bp) of four base-long homopolymers and the high inaccuracy of 454 sequencing at this length of homopolymers. The probability of miscalling or inaccuracy was calculated for homopolymers of each lengths separately (2-mer, 3-mer, 4-mer, etc.) by dividing the frequency of false positive calls with the frequency of the given homopolymer. In case of 4-mers the inaccuracy was found to be 3.9 % by AVA default settings. It means that around 4% of 4-mer homopolymer repeats are miscalled (Figure 2B).
Frequency of homopolymer miscalls. Frequency of false positive insertion or deletion variant calls at homopolymer regions with different lengths (A, black line). The frequency of different length homopolymers on the target region is illustrated with grey line. The probability of homopolymer miscalling was calculated by dividing the frequency of false positive calls with the frequency of homopolymers (B) Sequencing results of normal control samples that were considered to be free of these mutations.
Control cell lines
Two cell lines, HT-29 and Caco-2 were tested using our panel. According to the COSMIC database, there are three mutations at the target region, APC p.T1556fs*3, BRAF V600E and TP53 R273H in the HT-29 cell line, while the Caco-2 cell line has only one mutation in SMAD4 (D351H). These mutations were corroborated by our results, except for the APC insertion, which was fallen into a 6-mer adenine homopolymer repeat. The coverage at this variant was 857, and the good quality of reads in case of HT-29 sample indicates the correct technical result (data not presented).
Variants detected by the GS Junior panel
In total, 34 distinct variants were detected by our panel by sequencing the 58 colonic samples (Table 3). One proved to be a single nucleotide polymorphism (SNP) (APC c.4479:G>A, SNP reference number: rs41115). Three of all mutations were not registered either in COSMIC, the Human Gene Mutation Database (HGMD), or in the SNP database, so are presumably novel mutations detected for the first time (CTNNB1 c.47C>T; FBXW7 c.1740:C>G and SMAD4 c.413C>G). As detailed later in this article, two of these unknown variants were confirmed by Sanger sequencing (Figure 5), but not the CTNNB1 c.47C>T variant that was found to be wild type (Figure 7E). Another APC variant (c.3871C>T nonsense mutation) was a potential germline mutation found in a normal colonic sample with 58% allele frequency.
All variants detected by the GS Junior panel.
| sample type | sample number | mutations (gene symbol, cDNA position, type, percentage in the sample) | other variants | ||
|---|---|---|---|---|---|
| NAT | 1 | APC 3871:C/T (59%) [germ] | |||
| AD-LGD | 9 | KRAS 38:G/A (31%) | |||
| AD-LGD | 10 | APC 4314:A/- (69%) | KRAS 35:G/T (36%) | ||
| AD-LGD | 11 | KRAS 35:G/C (47%) | APC SNP 4479:G/A (100%) | ||
| AD-LGD | 12 | FBXW7 1513:C/T (40%) | KRAS 35:G/A (49%) | APC SNP 4479:G/A (47%) | |
| AD-LGD | 13 | KRAS 35:G/A (31%) | APC SNP 4479:G/A (47%) | ||
| AD-LGD | 14 | CTNNB1 134:C/T (16%) | APC SNP 4479:G/A (100%) | ||
| AD-LGD | 17 | APC 3927:AAAGA/----- (23%) | |||
| AD-LGD | 20 | APC 3964:G/T (21%) | APC SNP 4479:G/A (100%) | ||
| AD-LGD | 21 | APC 4241.:-/T (40%) | APC SNP 4479:G/A (61%) | ||
| AD-LGD | 22 | APC 4033:G/T (38%) | APC SNP 4479:G/A (100%) | ||
| AD-LGD | 24 | APC SNP 4479:G/A (41%) | |||
| AD-HGD | 25 | SMAD4 1528:G/A (47%) | APC SNP 4479:G/A (79%) | ||
| AD-HGD | 26 | BRAF 1799:T/A (33%) | APC SNP 4479:G/A (54%) | ||
| AD-HGD | 27 | APC SNP 4479:G/A (99%) | |||
| AD-HGD | 28 | APC 3925:G/T (26%) | APC SNP 4479:G/A (50%) | ||
| AD-HGD | 29 | APC 3927:AAAGA/----- (55%) | KRAS 35:G/C (29%) | APC SNP 4479:G/A (51%) | |
| AD-HGD | 30 | APC 3927:AAAGA/----- (87%) | KRAS 35:G/A (35%) | SMAD4 400:G/A (82%) | |
| AD-serr | 31 | APC SNP 4479:G/A (47%) | |||
| AD-serr | 33 | BRAF 1799:T/A (29%) | APC SNP 4479:G/A (51%) | ||
| AD-serr | 34 | BRAF 1799:T/A (4%) | APC SNP 4479:G/A (73%) | ||
| AD-serr | 37 | APC 4348:C/T (20%) | FBXW7 1745:C/T (3%) | TP53 845:G/A (6%) | |
| AD-serr | 38 | APC 4348:C/T (4%) | FBXW7 1745:C/T (9%) | TP53 845:G/A (4%) | |
| AD-serr | 39 | CTNNB1 47:C/T (21%) # | TP53 845:G/A (8%) | ||
| AD-serr | 40 | FBXW7 1745:C/T (2%) | TP53 845:G/A (11%) | ||
| AD-serr | 41 | FBXW7 1745:C/T (5%) | TP53 845:G/A (4%) | ||
| CRC | 42 | APC 4135:G/T (73%) + | FBXW7 1740:C/G (22%) [new] + | KRAS 35:G/A (15%) * | |
| CRC | 43 | APC 3927:AAAGA/----- (74%) + | SMAD4 413:C/G (70%) [new] + | TP53 711:G/C (59%) | |
| CRC | 45 | FBXW7 1393:C/T (41%) | FBXW7 1745:C/T (56%) | ||
| CRC | 46 | TP53 814:G/A (23%) | APC SNP 4479:G/A (31%) | ||
| CRC | 47 | APC SNP 4479:G/A (100%) | |||
| CRC | 48 | TP53 733:G/A (12%) | APC SNP 4479:G/A (50%) | ||
| CRC | 49 | APC 3916:G/T (41%) + | APC SNP 4479:G/A (13%) + | ||
| CRC | 50 | NRAS 181:C/A (19%) * | SMAD4 1569:C/G (8%) | TP53 1538:C/T (45%) | APC SNP 4479:G/A (100%) + |
| CRC | 51 | APC 3927:AAAGA/----- (16%) + | FBXW7 1745:C/T (18%) | TP53 845:G/A (18%) | APC SNP 4479:G/A (100%) + |
| CRC | 52 | TP53 845:G/A (13%) | APC SNP 4479:G/A (49%) | ||
| CRC | 53 | KRAS 35:G/T (14%) * | TP53 814:G/A (13%) | APC SNP 4479:G/A (48%) + | |
| CRC | 54 | APC SNP 4479:G/A (97%) | |||
| CRC | 55 | APC 3915:A/- (20%) + | KRAS 35:G/A (13%) # ! | KRAS 38:G/A (6%) * + | APC SNP 4479:G/A (47%) + |
| CRC | 56 | KRAS 35:G/A (43%) * | APC SNP 4479:G/A (74%) + | ||
| CRC | 57 | KRAS 35:G/T (17%) * | SMAD4 1051:G/C (18%) | TP53 845:G/A (14%) | APC SNP 4479:G/A (32%) + |
| CRC | 58 | BRAF 1799:T/A (35%) * | TP53 818:G/A (66%) | TP53 845:G/A (9%) | APC SNP 4479:G/A (95%) + |
| cell line | 59 | SMAD4 1051:G/C (100%) | APC SNP 4479:G/A (100%) | ||
| cell line | 60 | BRAF 1799:T/A (31%) | TP53 818:G/A (100%) | APC SNP 4479:G/A (100%) | |
+ : variants that have been validated by Sanger sequencing with a concordant result. * : variants that have been validated by PyroMark pyrosequencing with a concordant result. # : variants that have been validated by Sanger sequencing with a different result. ! : variants that have been validated by PyroMark pyrosequencing with a different result. [new]: potential new mutation/not described in COSMIC or HGMD databases. [germ]: suspected germline mutation. NAT: normal adjacent tumor; AD-LGD: low-grade adenoma; AD-HGD: high-grade adenoma; AD-serr: serrated adenoma; CRC: colorectal cancer.
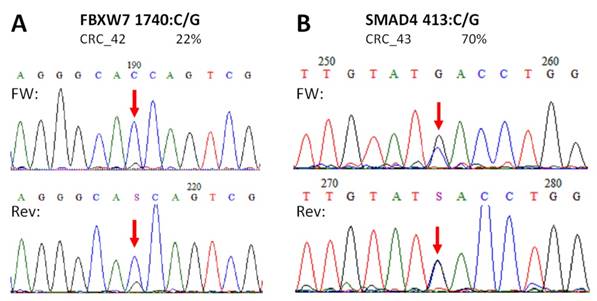
Novel mutations discovered by the panel. FBXW7 c.1740:C>G missense substitution (A), and SMAD4 c.413C>G nonsense mutation (B) were re-sequenced by Sanger sequencing protocol. The name of the variant, the sample and the allele frequency obtained by the GS Junior instrument is indicated above the electropherograms. Variable positions are signed with red arrows. The FBXW7 mutation causes a His580Gln amino acid change in the protein sequence, while SMAD4 mutation causes the formation of a stop codon, thus the product is a truncated protein. FW: forward sequencing primer; Rev: reverse sequencing primer.
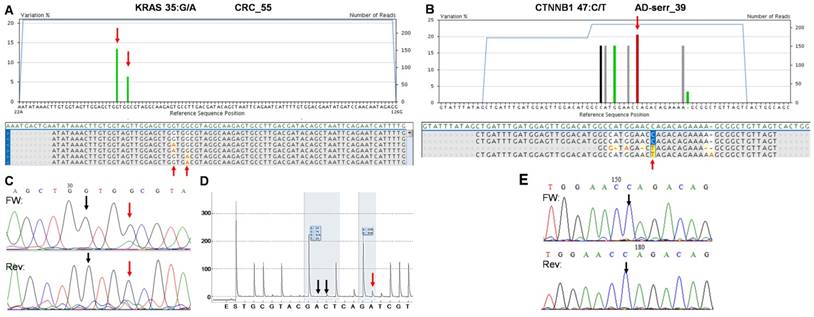
The two false positive mutations identified by the multiplex NGS panel. AVA Global alignment of the false positive KRAS (A) and CTNNB1 (B) mutations after GS Junior sequencing. Sequencing depth is illustrated with blue lines, while the allele frequency of variants is visualized as green columns. Consensus sequences of reads is also represented in the global alignment. AVA detected two KRAS mutations (35G>A and 38G>A) in CRC_55 sample (A, red arrows), but only the 38G>A proved to be valid by Sanger sequencing (C) and pyrosequencing (D). Seven CTNNB1 variants appeared on AVA global alignment of AD-serr_39 sample, but only the 47C>T variant passed the AVA criteria and was annotated as a mutation (B, red arrow). Even this latter variant could not be confirmed by Sanger re-sequencing (E, black arrow), so CTNNB1 47C>T was also considered a false mutation call. Black vertical arrows point at wild type peaks, while red arrows show the peaks or position of mutations detected by the corresponding method.
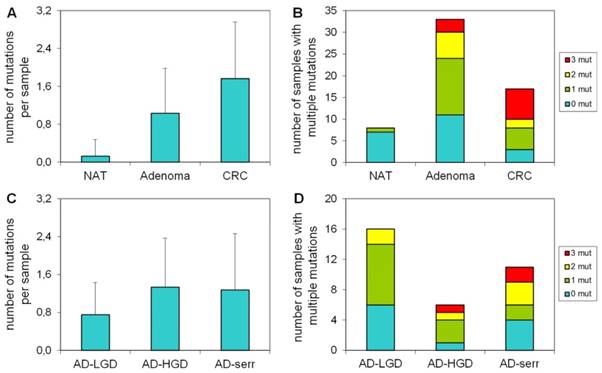
Number of mutations per sample in different stages
Our results demonstrate that the average number of mutations found by the panel is higher in CRC samples, than in adenomas or normal samples (Figure 3A). Accordingly, the proportion of samples bearing 3 mutations was higher in the CRC group, than in adenomas (Figure 3B). Only 1 of 8 normal samples had a mutation in APC with 58% allele frequency (c.3871C>T causing Q1291stop), which can be a germline mutation. In case of adenomas, the greatest number of mutations per sample and the highest proportion of samples having three mutations were observed in the serrated group (Figure 3C, 3D).
The number of mutations per sample in different pathological groups detected with the multiplex panel. The number of mutations (A) and the number of samples bearing multiple mutations (B) increases along the adenoma-CRC sequence (red color: samples with 3 mutations; yellow: samples with 2 mutations; green: samples with 1 mutation). Similar tendency is visible in the number of mutations (C) and the proportion of multiple mutated samples (D) in different types of the adenomas. NAT: normal adjacent tumor samples; AD-LGD: low-grade adenoma samples; AD-HGD: high-grade adenoma samples; AD-serr: serrated adenoma samples; CRC: colorectal cancer samples.
Frequency of mutations in different pathology groups
The portion of mutated samples in the CRC group was as follows: APC: 29.4%; TP53: 52.9%; KRAS: 29.4%; SMAD4: 17.6%; BRAF: 5.9%. In adenomas, these data were slightly different: APC: 30.3%; TP53: 15.2%; KRAS: 21.2%; SMAD4: 6.1%; BRAF: 9.1% (Figure 4A). APC was found to be the most frequently mutated gene. Its mutations affected both adenoma and CRC samples equally (30.3% and 29.4%, respectively), moreover, one of the normal samples as well. Within the adenoma group, the frequency of APC mutations was highest in AD-LG and AD-HGD samples (30% and 50%, respectively), while slightly lower in serrated adenomas (18%) (Figure 4B). The frequency of TP53 mutations showed the highest difference between adenoma and CRC samples (15.2% and 52.9% respectively). The highest frequency of BRAF mutations was found in serrated adenomas and AD-HGD samples (18% and 17%, respectively), while in CRC it was found to be not more than 6% (Figure 4A and 4B).
Mutation frequencies in colorectal cancer and different stages of adenomas. The figure demonstrates the proportion of samples in different pathological groups bearing at least one mutation in a given gene. NAT: normal adjacent tumor samples; CRC: colorectal cancer samples; AD-LGD: low-grade adenoma samples; AD-HGD: high-grade adenoma samples; AD-serr: serrated adenoma samples.
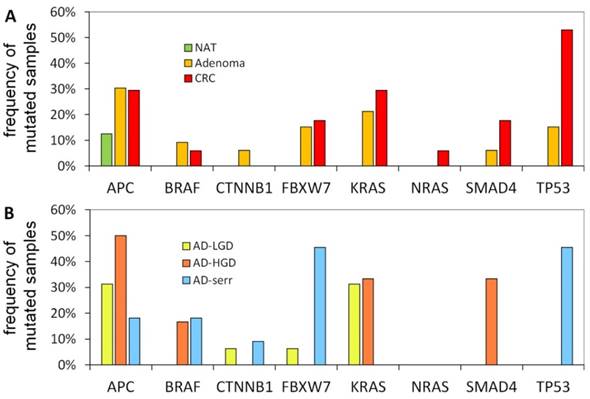
In addition, a notable difference was found between the mutation pattern of serrated and non-serrated adenomas. While TP53 and FBXW7 were mutated characteristically in serrated adenomas, KRAS and SMAD4 mutations occurred exclusively in non-serrated adenomas (AD-HGD and AD-LGD-s). However, each of the four genes was often mutated in CRC samples.
Re-sequencing of variants
To validate our results APC, KRAS, NRAS and BRAF mutations of CRC samples as well as the unknown CTNNB1, FBXW7 and SMAD4 mutations were re-sequenced by Sanger or PyroMarkQ24 sequencing instruments with primer sets different from the ones used for the panel (Table 4).
In case of APC, all mutations and SNP-s detected in CRC samples with our NGS panel were Sanger sequenced providing similar results (Figure S1). Moreover, no other APC variants were detected by Sanger re-sequencing than those by the NGS panel. Two of the three unknown, supposedly novel mutations (FBXW7 c.1740:C>G and SMAD4 c.413C>G) were confirmed by Sanger unambiguously too (Figure 5).
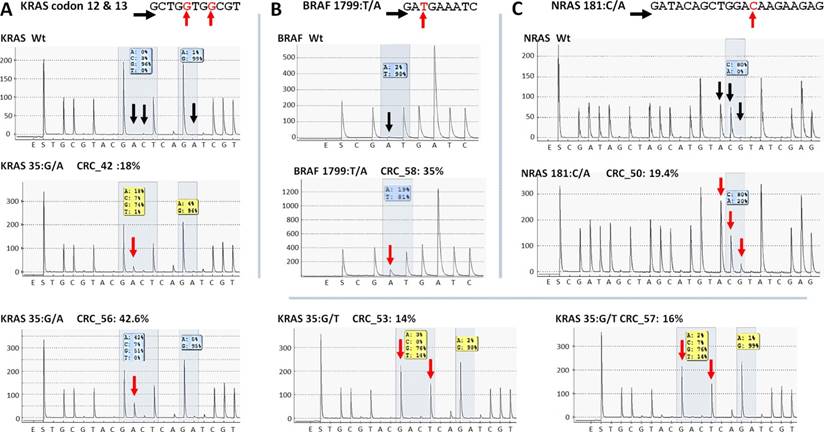
Five KRAS mutations (Figure 6A) together with the only BRAF and NRAS mutations (Figure 6B and C) among CRC group were also successfully verified by pyrosequencing. One KRAS mutation (c.35G>A) and the CTNNB1 variants proved to be false positive mutation calls, since wild type sequences were detected by PyroMark and Sanger re-sequencing (Figure 7).
Re-sequencing of KRAS, BRAF and NRAS variants on the PyroMark Q24 instrument. KRAS (A), BRAF (B) and NRAS (C) point mutations of CRC samples were validated by pyrosequencing. The name of the variant, sample and allele frequency detected by the GS Junior instrument together with the short sequence to analyze are indicated. The 5'-3' direction of sequencing primer and the position of the variable nucleotide peaks are signed with black horizontal and red vertical arrows, respectively. Black vertical arrows point at wild type peaks of the variable nucleotides, while red arrows show abnormal peaks denoting the presence of a mutation. Wt: wild type sequence.
On the whole, 22 variants were confirmed and two (KRAS 35G>A and CTNNB1 47C>T) proved to be false positive mutation calls in the course of re-sequencing (Table 3). It means that the specificity of our panel is around 92%, and the sensitivity can be 100%, since no other variants were detected with alternative sequencing methods. Data of the two false positive mutations is expanded in more details in Figure 7. In the CRC_55 sample two KRAS mutations (35G>A and 38G>A) were visible on the 454 sequencing alignment with 13% and 6% allele frequencies, respectively (Figure 7A). However, only the mutant allele at position 38 but not at 35 was verified by Sanger sequencing (Figure 7C) and pyrosequencing (Figure 7D). In AD-serr_39 sample, the 47C>T variant passed the AVA criteria and was annotated as a mutation by the GS Junior (Figure 7B), but not by Sanger sequencing (E). In case of this latter mutation, 6 other variants were also apparent on the AVA global alignment, which suggests poor sequencing quality. These other variants were then filtered out, since these were detected only unidirectionally.
Discussion
The number of disease-specific NGS applications is rising. In contrast with affinity enrichment techniques, multiplex PCR-based library preparation for targeted sequencing enables detection of sequence variants from as low as 10 ng input DNA [19]. In the present study, we constructed a mutation hot spot sequencing panel and tested it using 60 normal, adenoma- or adenocarcinoma colonic tissue samples and the GS Junior NGS platform. The panel comprised frequently mutated regions of 12 selected genes by sequencing samples with 39 amplicons.
To achieve a medium sequencing depth with an average of 250 times coverage, eight samples were sequenced in parallel.
In the course of testing, one of the main issues was the unexpectedly high deviation in the read number of different amplicons. As a consequence, analysis of 5 / 39 amplicons failed consistently due to their low coverage. This ratio of failed amplicons can be reduced either by the reduction of amplicons or samples sequenced at once, or by further optimizing the library construction method. Reducing the number of samples sequenced in parallel from 8 to 4 could raise the average sequencing depth up to a 500 times coverage. Another way to reduce the fluctuation in sequencing depth of different amplicons is to change the library preparation method from adaptor ligation to a two-step, PCR-based method using universal tailed amplicons [20].
It is well known that 454 and Ion sequencing methods are challenged in homopolymer regions [21-23] and therefore, detection of insertions or deletions affecting these regions is difficult, especially in case of longer homopolymers. Accordingly, in the course of cell line sequencing, the only mutation that our colon panel was not able to detect was an insertion affecting a 6-mer adenine homopolymer. In order to estimate the limit of homopolymer sequencing, we calculated the possibility of homopolymer miscalling as a function of their real length. We estimated a noticeable increase in the uncertainty of GS Junior sequencing from 4 base long homopolymers by counting the false positive insertion / deletion calls in normal colonic samples. Thus, we concluded that our panel is not able to detect insertions or deletions affecting 4 bases or longer homopolymers. Similar results were found about homopolymer errors by re-sequencing of an E. coli strain [10]. Higher coverage of homopolymer regions did not influence the accuracy of their sequencing appreciably.
Despite the variance in read numbers and the homopolymer issue, novel mutations were determined by the panel. The FBXW7 c.1740:C>G causes a H580Q substitution in the gene product. The SMAD4 c.413C>G substitution is a nonsense mutation, and forms a stop codon (TCA>TGA) producing a truncated protein with 137 amino acids in length.
In addition to the discovery of new mutations, the frequency of gene mutations estimated by our panel in CRC samples corroborated with literature data. According to a study based on The Cancer Genome Atlas (TCGA) data, the mutation frequency in MSS CRC is in a similar range to those estimated by our panel: 60% (TCGA) vs. 53% (our data) in case of TP53; 43% vs. 29% (for KRAS); 11% vs. 24% (FBXW7); 10% vs. 18% (SMAD4); 3% vs. 5% (BRAF); 4% vs. 0% (CTNNB1) and 3% vs 4% (NRAS) [24]. A remarkable difference between our and TCGA data was only found in case of APC (81% vs. 29%). The lower frequency detected by us could arise from the small target area investigated by the GS Junior panel. TCGA data are from transcriptome sequencing and based on those results, only 44% of the mutations falls into our target area (Figure S2). Additional facts explaining this difference are the relative high frequency of insertions and deletions in APC homopolymer regions undetectable by our panel and the significantly lower number of CRC samples investigated in our study. Moreover, the frequency of APC mutations in sporadic CRC can be different in the Hungarian patient population investigated in our study. Another reason to the difference in APC mutation frequency could be the fact that left-sided CRC samples were analyzed in our study, while in the TCGA study tumor samples derived from all anatomical regions of the colon and rectum were included.
The highest difference in mutation frequencies was found in case of TP53 between adenoma and CRC samples (15.2% vs. 52.9%). This finding is in harmony with literature data [25].
There were two genes mutated exclusively in serrated adenomas, while mutations in other genes were specific for non-serrated ones. This difference in the mutation pattern found by our panel may reflect the altered origin, and different way of development of these adenoma types, although it can also be an artificial observation considering the low number of CRC samples investigated. Nevertheless, all four genes were equally mutated in CRC samples, which suggest that both serrated and non-serrated adenomas can form malignant tumors [26, 27].
In the set of 60 colonic tissue samples, adenomas and adenocarcinomas were included, that allowed us to observe the accumulation of different mutations during the development of disease along the adenoma-carcinoma sequence, as described by the Vogelstein model [2]. Focusing on the total number of mutations per sample detected by our panel, such accumulation can be established, clearly seen in the transition from low- to high-grade adenomas.
In the course of re-sequencing APC, KRAS, NRAS and BRAF variants of CRC samples as well as the unknown variants, presumably new mutations were validated by alternative sequencing methods. According to these results, no other variants were detected so the sensitivity of our panel was 100%. The specificity was found to be 92%, since 22 of the 24 variants were confirmed and two of them proved to be false positive mutation calls. The read number in case of the false KRAS and CTNNB1 mutation calls was 238 and 209, respectively, and variants were detected both in the forward and reverse reads with 13% and 21% frequencies. After a careful investigation of AVA data we concluded that the false CTNNB1 mutation could be filtered out by more strict AVA variant criteria, but in that case some of the verified variants with allele frequencies below 5% would also be filtered out, decreasing the sensitivity of the panel.
In conclusion, this study summarizes the design and testing of a disease-specific, multiplex PCR based library preparation panel for NGS sequencing. This mutation panel is suitable for sequencing mutation hot spots of 12 top genes affected in CRC using the GS Junior instrument. The design and the protocol could further be developed in the future, since deviations in the sequencing depth of different regions were experienced too high. However, high sensitivity and specificity were confirmed by re-sequencing experiments and mutation frequencies were in harmony with literature data. In addition, two novel mutations were detected by this panel as well.
This work is the first multiplex PCR-based library preparation panel to screen colon cancer somatic mutations in CRC with the GS Junior instrument and can be helpful in developing NGS mutation panels for diagnostic purposes in the future.
Abbreviations
PCR: polymerase chain reaction; NGS: next-generation sequencing; APC: adenomatous polyposis coli (gene symbol); BRAF: B-Raf proto-oncogene, serine/threonine kinase (gene symbol); CTNNB1: catenin (cadherin-associated protein), beta 1 (gene symbol); EGFR: epidermal growth factor receptor (gene symbol); FBXW7: F-box and WD repeat domain containing 7, E3 ubiquitin protein ligase (gene symbol); KRAS: Kirsten rat sarcoma viral oncogene homolog (gene symbol); MSH6: mutS homolog 6 (gene symbol); NRAS: neuroblastoma RAS viral (v-ras) oncogene homolog (gene symbol); PIK3CA: phosphatidylinositol-4,5-bisphosphate 3-kinase, catalytic subunit alpha (gene symbol); SMAD2: SMAD family member 2 (gene symbol); SMAD4: SMAD family member 4 (gene symbol); TP53: tumor protein p53 (gene symbol); NAT: normal adjacent tissue; DNA: deoxyribonucleic acid; CRC: colorectal cancer; BRCA1: breast cancer 1, early onset (gene symbol); COSMIC: catalogue of somatic mutations in cancer; HGMD: Human Gene Mutation Database; N: normal; AD: adenoma; AD-LGD: low-grade adenoma; AD-HGD: high-grade adenoma; AD-Serr: serrated adenoma; dsDNA: double-stranded DNA; emPCR: emulsion PCR; AQ20: Quality Following Alignment; AVA: amplicon variant analysis software; TSA: traditional serrated adenoma; cDNA: complementary DNA.
Supplementary Material
Supplementary figures.
Acknowledgements
This study was supported by the National Office for Research and Technology, Hungary (TECH_08-A1/2-2008-0114 and KMR-12-1-2012-0216 grants).
Ethics approval
The study was approved by the Semmelweis University Regional and Institutional Committee of Science and Research Ethics (ETT TUKEB 23970/2011). Written informed consent was provided by all patients.
Authors' contributions
ÁVP and AK collected colonic samples. ÁVP, TM and IK performed histological analysis of samples. BP designed the colon panel. BP and AK performed the experiments. BP, PH, AB, IC and BW analyzed data. KE and PH executed re-sequencing experiments. BP and AK wrote the manuscript. ZT, IK and BM contributed to the design and project management of the study (supplied reagents/materials/analysis tools) as well as to data analysis. All authors read the manuscript carefully.
Competing Interests
The authors have declared that no competing interest exists.
References
1. Vogelstein B, Fearon ER, Hamilton SR, Kern SE, Preisinger AC, Leppert M. et al. Genetic alterations during colorectal-tumor development. N Engl J Med. 1988;319:525-32
2. Fearon ER, Vogelstein B. A genetic model for colorectal tumorigenesis. Cell. 1990;61:759-67
3. Baker SJ, Fearon ER, Nigro JM, Hamilton SR, Preisinger AC, Jessup JM. et al. Chromosome 17 deletions and p53 gene mutations in colorectal carcinomas. Science. 1989;244:217-21
4. Powell SM, Zilz N, Beazer-Barclay Y, Bryan TM, Hamilton SR, Thibodeau SN. et al. APC mutations occur early during colorectal tumorigenesis. Nature. 1992;359:235-7
5. Watson IR, Takahashi K, Futreal PA, Chin L. Emerging patterns of somatic mutations in cancer. Nat Rev Genet. 2013;14:703-18
6. Vogelstein B, Kinzler KW. Cancer genes and the pathways they control. Nat Med. 2004;10:789-99
7. Fearon ER. Molecular genetics of colorectal cancer. Annual review of pathology. 2011;6:479-507
8. Klee EW, Hoppman-Chaney NL, Ferber MJ. Expanding DNA diagnostic panel testing: is more better? Expert Rev Mol Diagn. 2011;11:703-9
9. Margulies M, Egholm M, Altman WE, Attiya S, Bader JS, Bemben LA. et al. Genome sequencing in microfabricated high-density picolitre reactors. Nature. 2005;437:376-80
10. Loman NJ, Misra RV, Dallman TJ, Constantinidou C, Gharbia SE, Wain J. et al. Performance comparison of benchtop high-throughput sequencing platforms. Nat Biotechnol. 2012;30:434-9
11. Singh RR, Patel KP, Routbort MJ, Reddy NG, Barkoh BA, Handal B. et al. Clinical validation of a next-generation sequencing screen for mutational hotspots in 46 cancer-related genes. J Mol Diagn. 2013;15:607-22
12. Screening Cancer Genes Using NimbleGen Sequence Capture Arrays and the GS Junior Sequencing System. Seq App Note Roche Diagnostics GmbH. 2011:1-4
13. Feliubadalo L, Lopez-Doriga A, Castellsague E, del Valle J, Menendez M, Tornero E. et al. Next-generation sequencing meets genetic diagnostics: development of a comprehensive workflow for the analysis of BRCA1 and BRCA2 genes. Eur J Hum Genet. 2013;21:864-70
14. Forbes S, Clements J, Dawson E, Bamford S, Webb T, Dogan A. et al. Cosmic 2005. Br J Cancer. 2006;94:318-22
15. Patai AV, Valcz G, Hollosi P, Kalmar A, Peterfia B, Patai A. et al. Comprehensive DNA Methylation Analysis Reveals a Common Ten-Gene Methylation Signature in Colorectal Adenomas and Carcinomas. PloS one. 2015;10:e0133836
16. Richman SD, Seymour MT, Chambers P, Elliott F, Daly CL, Meade AM. et al. KRAS and BRAF mutations in advanced colorectal cancer are associated with poor prognosis but do not preclude benefit from oxaliplatin or irinotecan: results from the MRC FOCUS trial. J Clin Oncol. 2009;27:5931-7
17. Sivertsson A, Platz A, Hansson J, Lundeberg J. Pyrosequencing as an alternative to single-strand conformation polymorphism analysis for detection of N-ras mutations in human melanoma metastases. Clin Chem. 2002;48:2164-70
18. Royo JL, Hidalgo M, Ruiz A. Pyrosequencing protocol using a universal biotinylated primer for mutation detection and SNP genotyping. Nature protocols. 2007;2:1734-9
19. Chang F, Li MM. Clinical application of amplicon-based next-generation sequencing in cancer. Cancer Genet. 2013;206:413-9
20. Daigle D, Simen BB, Pochart P. High-throughput sequencing of PCR products tagged with universal primers using 454 life sciences systems. Curr Protoc Mol Biol. 2011 Chapter 7: Unit7.5
21. Gilles A, Meglecz E, Pech N, Ferreira S, Malausa T, Martin JF. Accuracy and quality assessment of 454 GS-FLX Titanium pyrosequencing. BMC genomics. 2011;12:245
22. Luo C, Tsementzi D, Kyrpides N, Read T, Konstantinidis KT. Direct comparisons of Illumina vs. Roche 454 sequencing technologies on the same microbial community DNA sample. PloS one. 2012;7:e30087
23. Bragg LM, Stone G, Butler MK, Hugenholtz P, Tyson GW. Shining a light on dark sequencing: characterising errors in Ion Torrent PGM data. PLoS Comput Biol. 2013;9:e1003031
24. Cancer Genome Atlas Network; Comprehensive molecular characterization of human colon and rectal cancer. Nature. 2012;487:330-7
25. Hao XP, Frayling IM, Sgouros JG, Du MQ, Willcocks TC, Talbot IC. et al. The spectrum of p53 mutations in colorectal adenomas differs from that in colorectal carcinomas. Gut. 2002;50:834-9
26. Pancione M, Remo A, Colantuoni V. Genetic and epigenetic events generate multiple pathways in colorectal cancer progression. Patholog Res Int. 2012:509348
27. Patai AV, Molnar B, Tulassay Z, Sipos F. Serrated pathway: alternative route to colorectal cancer. World J Gastroenterol. 2013;19:607-15
Author contact
![]() Corresponding author: peterfia.balintsemmelweis-univ.hu.
Corresponding author: peterfia.balintsemmelweis-univ.hu.