Impact Factor ISSN: 1837-9664

 Global reach, higher impact
J Cancer 2026; 17(5):1050-1072. doi:10.7150/jca.129718 This issue Cite
Research Paper
Integrative Bulk and Single-Cell Transcriptome Profiling of Telomere-Related Genes Reveals a Robust Prognostic Signature and Immunotherapeutic Landscape in Neuroblastoma
Yeerfan Aierken*, Lulu Zheng*, Tao Liu, Kezhe Tan ![]() , Zhibao Lv
, Zhibao Lv ![]()
Department of General Surgery, Shanghai Children's Hospital, School of Medicine, Shanghai Jiao Tong University, Shanghai, 200040, China
*These authors contributed equally to this work.
Received 2025-12-10; Accepted 2026-4-27; Published 2026-5-18
Abstract

Purpose: Neuroblastoma (NB) is the most common extracranial solid tumor in children with poor overall survival. Increasing evidence indicates that telomeres contribute to tumorigenesis and influence cancer prognosis. However, the biological and clinical implications of telomere-related genes (TRGs) in NB remain poorly defined.
Materials and Methods: We integrated data from multiple independent cohorts to elucidate the roles of TRGs in NB. Differential expression and weighted gene co-expression network analyses (WGCNA) were performed to identify telomere-related differentially expressed genes (TRDEGs) linked to patient survival. Consensus clustering based on TRDEG expression patterns was conducted to stratify molecular subtypes, followed by functional enrichment analysis. A prognostic signature was then built using machine-learning algorithms to predict clinical outcomes and potential therapeutic responses. Single-cell RNA sequencing (scRNA-seq) data were used for signature gene expression validation and to guide functional candidate selection. Quantitative RT-PCR was performed to verify the TRDEG signature, and functional assays were performed to explore the role of PSAT1 in NB progression.
Results: First, we identified 103 telomere-related differentially expressed genes (TRDEGs) significantly linked to NB patient survival. Consensus clustering of TRDEGs revealed two NB molecular subtypes with distinct biological processes and clinical outcomes. We established an eight-gene prognostic signature (ARHGAP23, CHD5, E2F3, ELOVL6, FEN1, GMPS, LRR1, and PSAT1) that demonstrated high predictive accuracy, with 1-, 3-, and 5-year survival AUCs of 0.885, 0.903, and 0.911, respectively. The model showed consistent robustness across validation cohorts. Multivariate Cox regression confirmed the risk score as an independent prognostic factor. Integrating the risk score with clinical parameters within a nomogram yielded superior prognostic performance compared with traditional stratification schemes. High-risk patients showed decreased immune cell infiltration and increased immune evasion patterns, corresponding to poorer immunotherapy response. Distinct chemosensitivity profiles characterized the two risk groups. Quantitative RT-PCR validated the TRDEG signature. Last, PSAT1 was identified as a representative gene within the TRDEG signature through integration of scRNA-seq data, exhibited tumor-cell-specific expression, and was experimentally confirmed to promote NB cell proliferation, inhibit apoptosis, and enhance migratory capacity.
Conclusion: TRGs play a pivotal role in shaping NB prognosis and treatment response. The validated TRDEG signature provides a foundation for individual risk assessment and future development of precision therapies and immunotherapeutic strategies. Among these genes, PSAT1 emerges as a key oncogenic driver.
Keywords: neuroblastoma, telomere-related genes (TRGs), prognostic model, tumor immune microenvironment, PSAT1
Introduction
Neuroblastoma (NB) is the predominant extracranial solid tumor in pediatric populations, responsible for an estimated 8-10% of all childhood cancers and contributing to 15% of cancer-related mortality in children [1]. Current risk stratification, as established by the Children's Oncology Group (COG), classifies NB patients into very low-, low-, intermediate-, and high-risk categories using criteria including age, the International Neuroblastoma Staging System (INSS), histopathological findings, DNA copy number variations, MYCN amplification status, and other clinical characteristics. Despite advances in treatment, the overall survival (OS) rate for high-risk NB remains dismal at under 50%, underscoring the urgent need to enhance treatment outcomes and quality of life for these patients [2]. Although genetic alterations in genes including MYCN, ALK, TERT, PHOX2B, and ATRX are recognized as important risk factors, high-risk neuroblastoma exhibits considerable genetic heterogeneity. Notably, more than 25% of these patients lack the aforementioned aberrations [3]. Consequently, discovering novel biomarkers is imperative to improve prognostic accuracy and current clinical evaluation system.
Telomeres, composed of repetitive TTAGGG sequences at eukaryotic chromosome ends, play critical roles in regulating cellular lifespan and division potential. In healthy human cells, telomere length undergoes progressive shortening with each cell division [4]. This attrition is directly linked to several pathologies, including tumorigenesis [5, 6]. Nevertheless, the role of telomere shortening in cancer is complex and controversial, as it can function as a tumor suppressor by inhibiting cell proliferation, yet also promote genomic instability, thereby increasing the risk of tumor development [7]. Numerous researches have explored the potential applications of telomeres and telomere-related genes (TRGs) as biomarkers for glioma, breast cancer, bladder cancer, and pancreatic cancer [8-12]. In NB, emerging evidence indicated that heritable extensions in leukocyte telomere length confer susceptibility to its pathogenesis [13]. Moreover, the acquisition of a telomere maintenance mechanisms (TMMs) is a fundamental hallmark of high-risk NB [14]. This occurs primarily through two mutually exclusive pathways: telomerase activation, commonly driven by MYCN amplification or TERT rearrangements, or the alternative lengthening of telomeres (ALT) pathway, which is strongly associated with ATRX mutations [15-17]. Importantly, the presence of either TMMs, and particularly the ALT phenotype, is linked to aggressive disease and poorer patient outcomes. The biological understanding of these mechanisms has revealed profound therapeutic insights; for instance, ALT-positive cells exhibit constitutive ataxia-telangiectasia mutated (ATM) activation due to chronic telomere dysfunction, which confers resistance to conventional chemotherapy but also creates a unique vulnerability to ATM inhibition [18]. Additionally, epigenetic mechanisms such as METTL3-mediated m6A modification of TERRA lncRNA contribute to ALT, highlighting further therapeutic opportunities [19]. Despite these insights, prior research has predominantly focused on telomere length and stability in cancer prognosis, leaving the specific roles of TRGs in NB inadequately explored.
This study aimed to develop an innovative risk model based on TRGs to predict clinical outcomes in NB, while also evaluating its potential implications in tumor immune evasion and the therapeutic drug selection. Through analyzing single-cell RNA sequencing (scRNA-seq) data, we examined the expression profiles of these model genes across multiple cell types, strongly implicating PSAT1 in malignant cells. Functional cell experiments confirmed PSAT1's critical role in driving NB progression. Together, our results contribute not only to the identification of novel prognostic biomarkers and the advancement of TRG research in NB, but also provided essential insights for early diagnosis, optimization of treatment strategies, and enhanced management of prognosis in NB.
Materials and Methods
Acquisition of TRGs and transcriptome data
The workflow of this study is illustrated in Figure S1. We obtained RNA expression profiles and associated clinical annotations from multiple cohorts, including GSE62564, GSE16476, GSE85047, E-MTAB-8248, E-TABM-38 and EGAS00001001308 (abbreviated as EGAS), from the Gene Expression Omnibus (GEO) and the R2 platform (https://hgserver1.amc.nl/cgi-bin/r2/main.cgi). GSE62564, which had the largest sample size and the most comprehensive clinical as well as survival information, was designated as the training cohort, while the remaining datasets were used for validation purposes. We also analyzed three immunotherapy cohorts with varying treatment responses, which were downloaded from the TIGER portal (http://tiger.canceromics.org/). These datasets included GSE91061 (anti-PD-1), phs000452 (anti-PD-1), and RCC-Braun_2020 (anti-PD-1 and EVEROLIMUS). The data from GEO were processed with log2(x) transformation to acquire samples with normalized RNA-seq or microarray data, batch effects were assessed and corrected using the “sva” package in R software. The data from R2 were pre-processed according to the platform's guidelines to ensure consistency and comparability across datasets.
The TelNet database, accessible at http://www.cancertelsys.org/telnet/, compiles data on telomere-associated genes, cataloging approximately 2,000 human genes and over 1,100 yeast genes. These genes include annotations on maintenance mechanisms, functional roles, homologs, and significance scores related to telomere biology [20]. From this resource, we extracted 2,089 human genes linked to telomere functions (Table S1).
Analysis of scRNA-seq data
NB scRNA-seq data were acquired from the GEO repository under accession number GSE220946. The dataset comprised 15 samples, collectively containing 38,026 cells (2,535 cells per sample). Preprocessing and quality control were performed applying the “Seurat” R package. Low-quality cells and genes were filtered using the following thresholds: 1) Cells expressing <500 or >9,500 genes excluded; 2) Genes detected in <3 cells excluded; 3) Cells retaining ≥3% red blood cell genes excluded. Following filtration, 34,697 high-quality cells were retained. Gene expression data were processed with the NormalizeData method to achieve normalization, after which highly variable features were selected. Dimensionality reduction was performed by applying principal component analysis (PCA), and the first 20 principal components were retained for subsequent analyses. The Harmony algorithm was employed to correct for technical batch effects between samples. Using the FindClusters function at a resolution of 0.5, we identified 23 cell clusters. Two-dimensional visualization was achieved via uniform manifold approximation and projection (UMAP). Cluster-specific marker genes were determined by employing the FindAllMarkers function with normalized counts. Finally, clusters were annotated using specific biomarkers for each cell type, enabling quantification and evaluation of cell type proportions (Table S2).
Weighted gene co-expression network analysis (WGCNA)
To elucidate the co-expression patterns among candidate genes and identify clusters of closely correlated genes, WGCNA was utilized. In this study, the top 5000 genes with the highest variance values were selected and subjected to WGCNA. The soft-thresholding power (β) was determined through the utilization of the PickSoftThreshold function available in the “WGCNA” R package, with an optimal threshold value of 0.9 chosen to guarantee a scale-free network topology. The identification of modules was conducted through hierarchical clustering of the genes. The module eigengenes served as representations of the summarized expression profiles corresponding to each module. These modules were visualized as distinct branches in the dendrogram, each assigned a unique color for differentiation. Furthermore, the associations between individual genes and modules, as well as the interrelationships among modules, were comprehensively investigated.
Identification of telomere-related differentially expressed genes (TRDEGs) and functional enrichment analysis
In order to pinpoint differentially expressed genes (DEGs) in high-risk NB, we utilized the DESeq2 package to analyze the transcriptomic data from the GSE62564 cohort. By comparing the gene expression profiles between COG high-risk and low-risk tissues, we set a threshold of |log2 fold change| > 0.5 and an adjusted P < 0.05 (adjusted via the Benjamini-Hochberg method) to identify significant DEGs, and the results were visualized as volcano plots using the “ggplot2” R package. This approach enabled us to effectively distinguish key genetic markers associated with NB progression.
TRDEGs were identified through intersecting three distinct datasets: 1) DEGs between COG risk-stratified groups, 2) telomere maintenance genes curated in the TelNet database, and 3) module genes derived from WGCNA. Then, through applying the RCircos package, the chromosomal positions of TRDEGs (top 25 genes with P < 0.05) were displayed. Heatmaps were generated to illustrate the top 25 significantly upregulated and downregulated genes (P < 0.05). Functional enrichment was assessed through Gene Ontology (GO) analysis—encompassing biological processes (BP), cellular components (CC), and molecular functions (MF)—and Kyoto Encyclopedia of Genes and Genomes (KEGG) pathways analysis using the “clusterProfiler” package in R. Enrichment results with a P < 0.05 were considered statistically significant.
Construction of subtype analysis according to key TRDEGs
To identify distinct molecular subtypes of NB based on the TRDEGs, consensus clustering was carried out with the “ConsensusClusterPlus” package in R. This approach involved an unsupervised analysis with the partitioning around medoids (PAM) algorithm and Euclidean distance metric to quantify the stability of clustering outcomes across multiple iterations. Specifically, we evaluated potential cluster numbers ranging from k=2 to k=10, repeatedly resampling subsets of the NB cohort at an 80% rate to generate consensus matrices and ensure classification robustness. The optimal number of clusters was determined by analyzing the cumulative distribution function (CDF) to maximize agreement across iterations. Furthermore, PCA was applied to validate the derived molecular subtypes, and Kaplan-Meier survival analysis was performed to assess their clinical significance in relation to patient prognosis. Additionally, we not only employed gene set variation analysis (GSVA) to obtain variations in KEGG pathway enrichment among subtypes but also explored the correlations between these subtypes, presenting the findings through heatmaps.
Gene set enrichment analysis (GSEA) in telomere-associated subtypes
GSEA, a widely used computational method, assessed the biological functions of gene cohorts by systematically evaluating overlaps with predefined gene sets from established databases. Using the R/Bioconductor package “clusterProfiler”, we computed enrichment score for genes ordered based on their log2FC values. This was performed with 1,000 permutations to establish empirical significance, and gene sets were restricted to sizes between 10 and 500 members to ensure robustness. In order to control false discoveries, statistical significance was assessed with Benjamini-Hochberg-adjusted p-values. As the reference database, we employed the specific c2.cp.kegg.v7.5.1.symbols gene set curated from MSigDB.
Establishment of prognostic risk model according to TRDEGs
To establish a robust prognostic signature reflecting telomere biology in NB, we conducted comprehensive survival analyses. Utilizing gene expression profiles and OS data from a cohort of 498 NB patients, we first performed univariate Cox proportional hazards regression analysis on TRDEGs. This initial screen, conducted using the survival package in R with a significance threshold of P < 0.05, identified TRDEGs exhibiting significant associations with patient OS. To enhance the prognostic model and reduce the risk of overfitting, the candidate TRDEGs underwent Least Absolute Shrinkage and Selection Operator (LASSO) Cox regression analysis, which was conducted using the "glmnet" package in R. The optimization of the model was achieved through tenfold cross-validation, which was employed to ascertain the ideal penalization parameter (λ). Specifically, the λ.min value yielding the minimal mean cross-validated error was selected. This process yielded an optimal set of eight key prognostic genes. A prognostic risk score for each patient was then calculated using the linear predictor derived from this LASSO-Cox model: Risk score = Σ (Gene Expressionᵢ × Coefficientᵢ), where Expressionᵢ represents the standardized expression level of each model gene, and Coefficientᵢ denotes its corresponding LASSO-Cox regression coefficient, reflecting the gene's weighted contribution to the prognostic risk.
Construction of a predictive nomogram
NB patients were categorized into low- and high-risk groups using median LASSO risk score (LRS) from training and validation cohorts. To assess the differences in OS between these groups, Kaplan-Meier survival curves were generated utilizing the “survminer” and “survival” packages in R. Furthermore, the performance of the predictive signature for survival at 1, 3, and 5 years was evaluated through receiver operating characteristic (ROC) curves, which were constructed using the “timeROC” and “ggplot2” packages, with the area under the curve (AUC) metrics serving as the evaluation criteria. Scatter and risk plots were also utilized for Visualization of patient risk distributions within the groups and estimation of death risk. Furthermore, Clinical factors (age, gender, INNS stage, MYCN status) were extracted from both training and validation cohorts, summarized in Table S3. Each factor's prognostic discriminatory power was calculated via the concordance index (C-index), followed by a bar chart comparing C-index values among datasets. To determine the independent prognostic significance of the risk score for NB OS, we conducted both univariate and multivariate Cox regression analyses, which included the aforementioned clinical factors. A forest plot was generated using the “forestplot” R package. A predictive nomogram along with an associated calibration plot for estimating OS probabilities at 1, 3, and 5 years was constructed utilizing the “rms” package in R. Finally, the clinical applicability of the predictive model was evaluated using decision curve analysis (DCA), which measured true-positive and false-positive rates at incrementally varying clinical decision thresholds.
The stemness index calculation
For the GSE62564 cohort, the mRNA stemness index (mRNAsi)—a quantitative measure of cellular reprogramming potential—was predicted for each sample using one-class logistic regression. All resulting mRNAsi values were subsequently normalized to a scale ranging from 0 to 1. This normalization allowed for more consistent and interpretable comparisons across samples. Elevated mRNAsi scores are indicative of an increased stem-like phenotype.
Characterizing the immune infiltration landscape and predicting immunotherapy responses
We assessed the immune cell microenvironment through various algorithms, including the ESTIMATE, EPIC, MCPCOUNTER, QUANTISEQ, and XCELL algorithms, all part of the “IOBR” R package. The results were validated using the single-sample gene set enrichment analysis (ssGSEA) algorithm. We generated group comparison maps using the “ggplot2” R package to illustrate the differences in immune cell expression and immune functions across various groups. Additionally, we calculated the correlation between key genes, TRDEGs risk score, and immune cells using the Spearman algorithm, and we visualized these correlations via heatmaps created with the “ggplot2” package in R.
We further evaluated the TRDEGs risk score's predictive value for immunotherapy response by analyzing key immunological indicators: the tumor immune dysfunction and exclusion (TIDE, available at http://tide.dfci.harvard.edu/) score, cytotoxic T lymphocytes (CTL) score, mRNAsi and expression of PD-L1. Utilizing these findings, we computed the telomere-related risk score for patients within the training cohort to explore its role in immunotherapy. Wilcoxon tests were employed to determine the statistical significance of differences in these immunotherapy predictor distributions between patients stratified into high-risk and low-risk categories. Spearman analysis was conducted to explore the relationship between risk score and mRNAsi. The above distribution was visualized using scatter plots, accompanied by its corresponding p-values. In addition, we incorporated multiple immunotherapy cohorts with annotated clinical response data to validate the predictive efficacy of the immunotherapy response. The LASSO-COX algorithm was consistently employed to compute individualized risk scores. Kaplan-Meier survival analysis, implemented via the "survival" R package, was utilized to compare survival outcomes between high- and low-risk groups, with between-group differences assessed using the log-rank test.
Sensitivity prediction analysis of chemotherapeutic agents
The association between the risk score of TRDEGs and drug sensitivity was predicted utilizing the GDSC and CTRP datasets through the application of the "oncoPredict" R packages. Simultaneously, the "Hmsic" R package was utilized to analyze the correlation between transcriptional profiles and chemotherapeutic sensitivity.
Cell culture
We acquired the hTERT-immortalized retinal pigmented epithelial cell line (RPE-1)—a commonly used non-NB control—along with the NB cell lines BE(2)-C, SK-N-BE2, IMR-32, SK-N-SH, and SH-SY5Y from the Chinese Academy of Sciences Cell Bank (Shanghai, China). BE(2)-C and RPE-1 cell lines were cultured in Dulbecco's Modified Eagle Medium/Nutrient Mixture F-12 (DMEM/F12; Gibco, #11330032) containing 10% fetal bovine serum (FBS; Sigma-Aldrich, #F8318) and 1% penicillin-streptomycin (Gibco, #15140-122). IMR-32 and SH-SY5Y cells were cultured in a 1:1 mixture of Eagle's Minimum Essential Medium (MEM; BasalMedia, #L510KJ) and Ham's F-12 Nutrient Mix (BasalMedia, #L410KJ), also supplemented with 10% FBS and 1% penicillin-streptomycin. SK-N-BE2 and SK-N-SH cells were cultured in Dulbecco's Modified Eagle Medium (DMEM; Gibco, #11885084) enriched with 10% FBS and 1% penicillin-streptomycin. All cell lines were kept under standard culture conditions at 37°C with 5% CO2 in a cell incubator.
RNA extraction and quantitative RT-PCR
Total RNA was extracted from cells with TRIzol reagent (#15596018, Invitrigen, Carlsbad, USA), followed by reverse transcription using Evo M-MLV RT Premix (#11706, Accurate biology, Hunan, China). Quantitative PCR analysis was performed using the Hieff UNICON qPCR SYBR Green Master Mix (#11198ES03, YEASEN, Shanghai, China). Relative gene expression was calculated via the 2⁻△△CT method, normalized to GAPDH. The sequences of the primers are detailed in Table S4.
Small interfering RNA transfection
Small interfering RNA (siRNA) targeting PSAT1, along with a control siRNA, were procured from RIOBIO (Zorin, Shanghai, China). SK-N-BE2 and BE(2)-C cells, which were selected based on the mRNA expression pattern of PSAT1, were transfected using ExFect Transfection Reagent (#T101-01, Vazyme, Nanjing, China) according to the manufacturer's instruction. siRNA interference sequences are shown as follows: si-PSAT1-1 (sense: 5′-CCGGGCCUCUCUGUAUAAUTT-3′; antisense: 3′-AUUAUACAGAGAGGCCCGGTT-5′), si-PSAT1-2 (sense: 5′-GCCGCACUCAGUGUUGUUATT-3′; antisense: 3′-UAACAACACUGAGUGCGGCTT-5′), and nontargeting control siRNA (si-NC, sense: 5′-UUCUCCGAACGUGUCACGUTT-3′; antisense: 3′-ACGUGACACGUUCGGAGAATT-5′). Efficiency of siRNAs were detected by western blot.
Cell viability assay
Cell viability in NB cell lines was evaluated using the Cell Counting Kit-8 (CCK-8, #K1018, APExBIO, Houston, USA). Cells were seeded into 96-well plates at 5 × 10³ cells per well in 100 µL medium. After incubation, CCK-8 reagent was introduced to achieve a 10% final concentration, and the plates were incubated at 37 °C for 4 hours. Absorbance at 450 nm (OD450) was then measured using a microplate reader., and viability was calculated as a percentage relative to untreated control wells.
Wound healing assay
NB Cells were plated in 6-well plates and grown to 90% confluence under standard conditions (37°C, 5% CO₂). The cell layer was scratched with a 200-µl pipette suction head after achieving 90% confluence. Then The wells were rinsed twice with PBS to clear cellular debris and replenished with low-serum medium. Precise positioning marks were made adjacent to each wound to ensure consistent imaging fields. Wound areas were photographed at 0 h (baseline) and after a 24 h incubation period using an inverted microscope. Quantification of cell migration into the wound area was performed using ImageJ software.
Apoptosis measurement by annexin V-FITC/PI flow cytometry
NB cells transfected with siRNAs targeting PSAT1 (si-PSAT1-1 and si-PSAT1-2) or si-NC were harvested, washed with PBS. Subsequently, the transfected cells were plated in 6-well plates at a density of 3×10⁵ cells per well and cultured for 48 hours. Apoptosis was quantified with the FITC Annexin V Apoptosis Detection Kit I (#2139225, BD Biosciences, New Jersey, USA) according to the manufacturer's instructions, and data were processed with FlowJo software.
Western blot
Cellular lysis used RIPA buffer (#P0013B, Beyotime, Shanghai, China), with protein concentrations quantified via BCA Protein Assay Kit (#P002, Beyotime, Shanghai, China). We resolved 30 µg samples per lane on 10% SDS-PAGE gels, transferring proteins to PVDF membranes. After 2-hour blocking in 5% BSA, membranes underwent overnight incubation at 4°C with primary antibodies: anti-PSAT1 (10501-1-AP, Proteintech, Wuhan, China; dilution 1:5000) and anti-HSP90 (13171-1-AP, Proteintech, Wuhan, China; dilution 1:5000). Following three times TBST washes, membranes were incubated with an HRP-conjugated secondary antibody for 1 hour at room temperature, after which protein bands were visualized using an ECL detection system (Bio-Rad, California, USA).
Statistical analysis
Data analyses and figure generation were conducted using GraphPad Prism (v10.0) and R (v4.4.0), respectively. Pairwise group comparisons employed the Wilcoxon rank-sum test, while differences across multiple groups were assessed using either ANOVA or the Kruskal-Wallis test. Categorical variables underwent chi-square or Fisher's exact testing. For correlation analysis, Spearman's rank correlation method was employed. Survival outcomes were compared using Kaplan-Meier curves with log-rank testing. All experiments included ≥3 biological replicates, with data presented as mean ± standard error of the mean (SEM) in figures. Statistical significance was defined as P < 0.05.
Results
Identification of TRDEGs between COG high- and low-risk NB
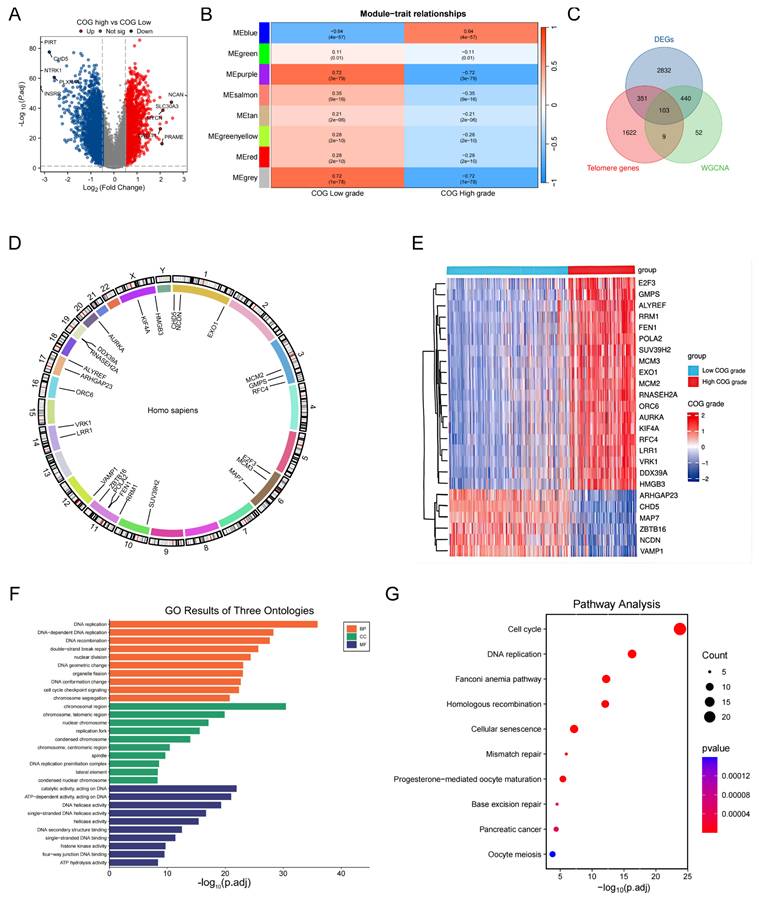
A comprehensive analysis of transcriptomic data from the GSE62564 samples revealed 3726 DEGs (Table S5) between COG high-and low-risk NB (a threshold of |log2FC| > 0.5 and P < 0.05). Among these 3726 DEGs, 1400 were found to be upregulated while 2426 were downregulated in the high-risk COG NB, as illustrated in the volcano plot (Figure 1A). As shown in Figure 1B, the blue module exhibited a strong positive correlation with COG high risk NB, with the coefficient of 0.64. A total of 103 overlapping genes among DEG, TRGs in the TelNet database, and the module genes highly and positively correlated with COG high risk NB after WGCNA (Table S6) were found and deemed as TRDEGs between COG high- and low- risk NB (Figure 1C) (Table S7). The chromosome localization map showed that the top 25 TRDEGs (based on adjusted p-value) were mainly located on chromosomes 1, 3, 6 and 11, including CHD5, NCDN and EXO1 on chromosome 1; MCM2, GMPS and RFC4 on chromosome 3; E2F3, MCM3 and MAP7 on chromosome 6; RRM1, ZBTB16, FEN1 and POLA2 were located on chromosome 11 (Figure 1D). The top 25 TRDEGs among different COG groups were identified based on the intersection results (Figure 1E). GO analysis, which includes biological processes (BP), cellular components (CC) and molecular functions (MF), underscored their significance in “DNA REPLICATION”, “CELL CHECKPOINT SIGNALING PATHWAYS” and “DOUBLE-STRAND BREAK REPAIR” (Figure 1F). Furthermore, The KEGG analysis, depicted using a bubble plot, revealed enrichment of these genes in pathways such as “CELL CYCLE”, “CELLULAR SENSCENCE”, “MISMATCH REPAIR”, “HOMOLOGOUS RECOMBINATION” and “DNA REPLICATION” (Figure 1G).
Identification and characterization of TRDEGs in NB. (A) Volcano plot showing 3726 DEGs between COG High-and Low-risk groups. (B) Heatmap illustrating module-trait relationships identified by WGCNA. (C) Overlapping genes among DEGs, TRGs from the TelNet database and WGCNA-derived module genes. (D) Chromosome mapping of the top 25 TRDEGs. (E) Heatmap of the top 25 TRDEGs. (F-G) GO and KEGG enrichment analyses of 103 TRDEGs.
Discovery of telomere-associated subtypes in NB via consensus clustering analysis
Next, we performed consensus clustering on 498 samples from the GSE62564 to investigate the potential telomere-related subtypes in NB. The optimal number of clusters was determined to be 2, based on the area under the curve of the CDF plot (Figure 2A, B). A clear separation between these two clusters was evidenced by PCA (Figure 2C). Patients in Cluster 2 exhibited significantly better survival outcomes compared to those in Cluster 1, who had relatively poorer prognoses (Figure 2D). Additionally, the expression patterns of the top 25 TRDEGs were found to effectively distinguish between the two subtypes (Figure 2E).
Discovery and functional characterization of TRDEGs-associated molecular subtypes. (A) Consensus score matrix of all samples when k = 2. (B) CDF curves of consensus matrix under k = 2-10. (C) PCA showing notable variations between two TRDEGs patterns from training cohort. (D) Kaplan-Meier curves comparing survival between Cluster 1 and Cluster 2. (E) Violin plots showing the expression differences in top 25 TRDEGs among two clusters. (F) GSVA showing pathway enrichment differences between Cluster 1 and Cluster 2. (G-H) GSEA based on “c2.cp.kegg.v7.5.1.symbols” gene sets showing pathways enriched in Cluster 1 and Cluster 2. *P < 0.05, ** P < 0.01, *** P < 0.001.
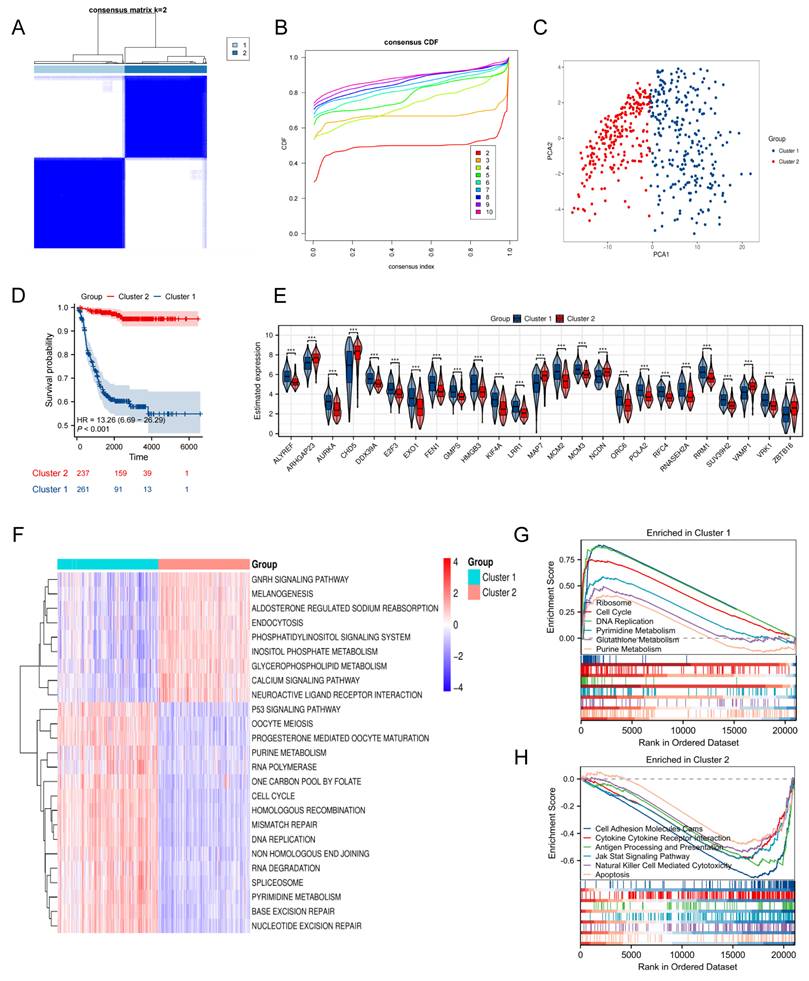
To explore pathway enrichment patterns distinguishing NB Cluster 1 and Cluster 2, we conducted GSVA (Table S8) and GSEA (Table S9). GSVA highlighted that Cluster 1 showed marked enrichment in processes such as "CELL CYCLE", "P53 SIGNALING PATHWAY", "ONE CARBON POOL BY FOLATE", and "PYRIMIDINE METABOLISM". In contrast, Cluster 2 was notably enriched in "ENDOCYTOSIS", "CALCIUM SIGNALING PATHWAY", and "GNRH SIGNALING PATHWAY" (Figure 2F). Supporting these findings, GSEA further indicated that Cluster 1 was strongly associated with "RIBOSOME", "CELL CYCLE", "DNA REPLICATION", and "PYRIMIDINE METABOLISM", whereas Cluster 2 exhibited dominant enrichment in "APOPTOSIS", "ANTIGEN PROCESSING AND PRESENTATION", and "CYTOKINE-CYTOKINE RECEPTOR INTERACTION" (Figure 2G, H). Our integrated results reveal a clear divergence in biological processes between the two clusters—with Cluster 1 enriched in proliferation and metabolism, and Cluster 2 enriched in immune and regulatory functions—underscoring fundamental molecular differences across these NB subtypes.
Construction and validation of a prognostic model according to TRDEGs
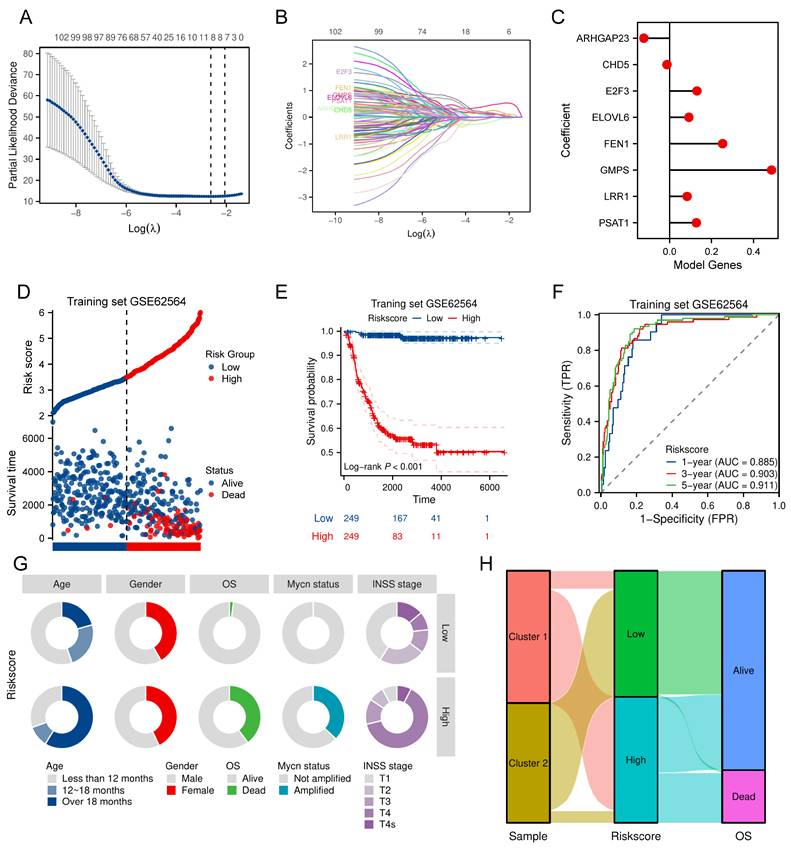
Univariate Cox regression was first conducted in the training cohort to evaluate the relationship of TRDEGs to survival outcomes. This approach revealed that each of the examined genes demonstrated statistically significant associations with survival outcomes (P < 0.05, Table S10). Based on these 103 TRDEGs, a refined prognostic signature—designated the TRDEGs signature—was subsequently developed using LASSO regression (Figure 3A, B). The LRS was calculated employing coefficients obtained from the LASSO algorithm (Figure 3C, LRS = -0.12276 × ARHGAP23 + -0.01241 × CHD5 + 0.13063 × E2F3 + 0.09201 × ELOVL6 + 0.25257 × FEN1 + 0.48589 × GMPS + 0.08329 × LRR1 + 0.12765 × PSAT1). We then classified NB patients into low- and high-risk groups according to the median LRS. Risk curves and scatter plots revealed clear separation between low- and high-risk groups, demonstrating the risk score's effectiveness in stratifying patients according to survival outcomes (Figure 3D). In accordance with this stratification, Kaplan-Meier survival analysis confirmed that individuals in the high-risk group exhibited substantially inferior OS relative to those in the low-risk group within the training cohort (Figure 3E). The time-dependent ROC curves were applied to assess the predictive performance of the prognostic signature at 1, 3, and 5 years. The signature displayed robust discriminative capacity, as evidenced by AUC values of 0.885, 0.903, and 0.911 for the respective time points (Figure 3F). Extending beyond the training cohort, the signature's generalizability was rigorously evaluated across five independent validation cohorts: GSE16476, GSE85047, EGAS, E-TABM-38, and E-MTAB-8248. Comprehensive analyses within these diverse NB cohorts validated the signature's strong performance as evidenced by risk plots (Figure S2A-E), Kaplan-Meier curves (Figure S2F-J), and ROC curve analyses (Figure S2K-O). Furthermore, A donut chart and Sankey Diagram illustrated the correlation among signature's risk score, telomere-related subcluster and clinical characteristics, suggesting TRDEGs signature's potential utility in clinical prognosis (Figure 3G, H).
Construction of a prognostic risk model based on key TRDEGs in the training cohort. (A) LASSO regression screen in training cohort showing 8 of 103 core genes at the least deviance. (B) LASSO regression screen in training cohort showing coefficients of core genes at different λ levels. (C) Forest plot showing the coefficients of the eight model genes. (D) Distribution of risk scores and survival status of patients in the training cohort. (E) Kaplan-Meier curve of training cohort between the two risk groups determined by the 8-gene prognostic risk model. (F) Time-dependent ROC curves in training cohort for 8-gene prognostic risk model. (G) Distribution of clinical characteristics (age, gender, OS, MYCN status, and INSS stage) between the two risk groups. (H) Sankey diagram showing the relationships among subclusters, TRDEG-based risk score and survival status.
Development of the nomogram including the TRDEGs risk score
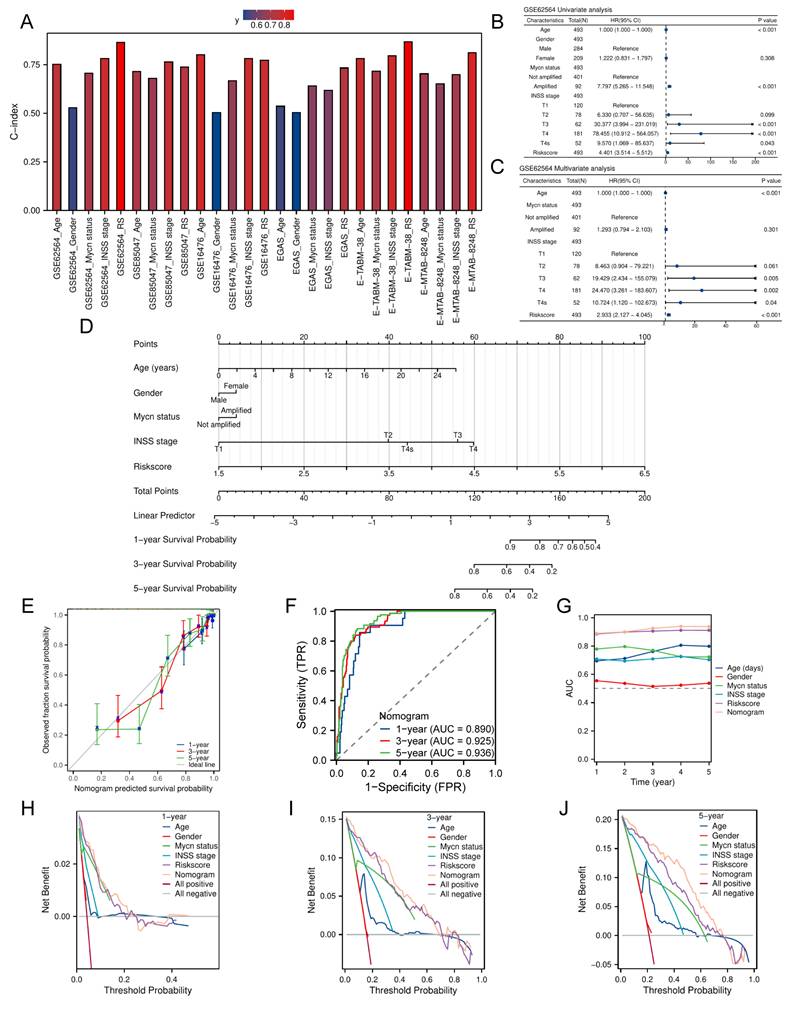
We calculated the clinical factors (age, gender, MYCN status, INSS stage, etc.) and risk score C-index for NB patients and compared the differences in the C-index across each cohort. The results showed that every cohort had up to at least three clinical characteristics and the risk score, which was calculated based on the TRDEGs signature's coefficients, demonstrated superior predictive accuracy as measured by C-index compared to any other clinical characteristics (Figure 4A). To establish the independent prognostic capacity of this risk score and clinical parameters, we performed univariate and multivariate Cox analyses within all cohorts respectively. We included five NB clinical characteristics - age, gender, MYCN status, INSS stage, and risk score - in Cox regression analyses within the training cohort. Univariate Cox regression indicated non-significant associations for gender and INSS stage 2 (P > 0.05), whereas INSS stages 3, 4, and 4S, age, MYCN status and risk score (HR > 1, P < 0.05; Figure 4B) exhibited significant prognostic relevance. In subsequent multivariate analysis, though MYCN status no longer showed statistical significance (P > 0.05), the risk score still maintained its significance as a strong independent prognostic indicator (HR = 2.933, P < 0.001; Figure 4C). External validation across multiple cohorts consistently corroborated these findings (Figure S3A-J). Furthermore, we constructed a predictive nomogram model that integrates multiple clinical characteristics, including the TRDEGs signature's risk score, to predict OS at 1, 3, and 5 years for NB patients (Figure 4D), and the nomogram C-index was 0.887 (95% CI 0.875-0.900). As illustrated by the calibration curve, the nomogram demonstrated excellent predictive performance (Figure 4E). Our model's high accuracy was further underscored by the AUCs, which attained 0.890, 0.925, and 0.936 for the 1-, 3-, and 5-year intervals, respectively (Figure 4F). In addition, ROC analysis further confirmed that the nomogram incorporating other clinical factors demonstrated superior predictive performance (Figure 4G). The nomogram provided considerable net benefit in predicting survival outcomes at 1, 3, and 5 years, as confirmed by DCA (Figure 4H-J). Collectively, these findings affirmed that our TRDEGs risk score-based model can serve as an independent and accurate prognostic indicator.
Nomogram construction in the training cohort. (A) Comparison of C-index for the risk score and different clinical characteristics across training cohort and five external validation cohorts. (B) Univariate Cox regression forest plot including various clinical characteristics and risk score. (C) Multivariate Cox regression forest plot including various clinical characteristics and risk score. (D) Nomogram established to predict overall survival probability based on clinical characteristics and TRDEGs risk score. (E) Calibration plot for the nomogram. (F) The time-dependent ROC curves of the nomogram model for the 1-, 3- and 5-year OS. (G) ROC curve analysis showing the AUC of age, gender, MYCN status, INSS stage, risk score and nomogram. (H-J) DCA curves of the nomogram for 1-, 3- , and 5- year OS.
Immune characteristic related to TRDEGs signature
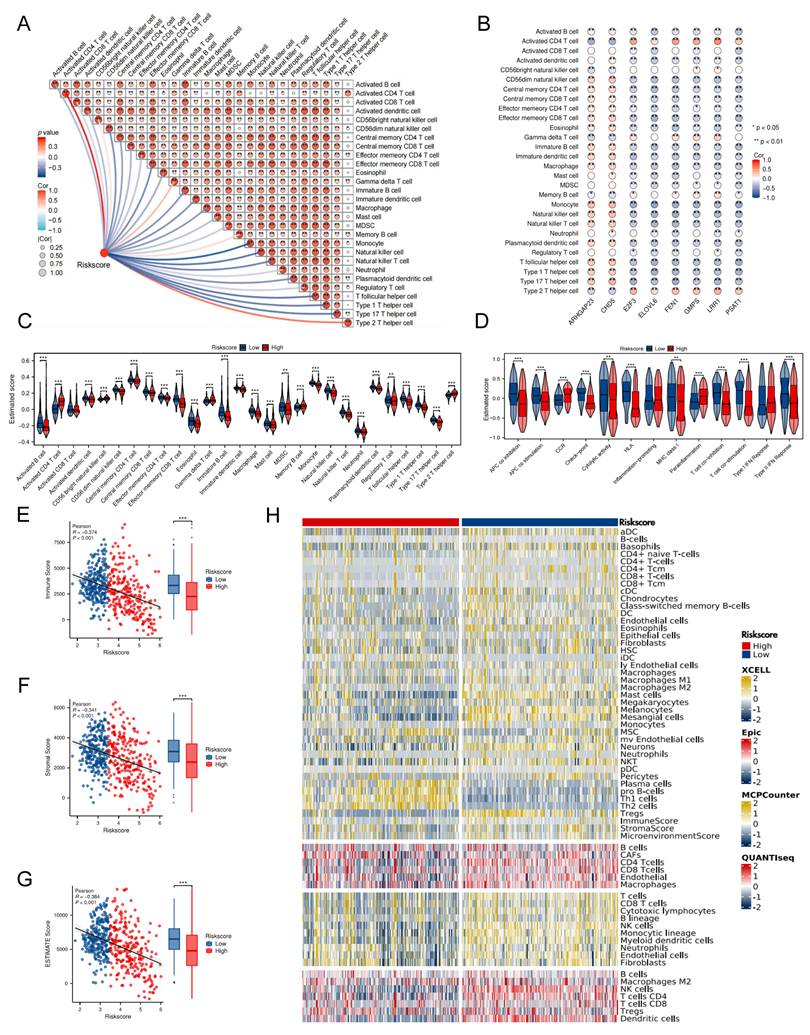
Initial ssGSEA analysis of the training cohorts revealed significant inverse associations between the TRDEGs risk score and most signature hub genes (excluding ARHGAP23 and CHD5) and the infiltration levels of diverse tumor-infiltrating immune cells (Figure 5A, B). Consequently, high-risk patients exhibited a significant decrease in various types of anti-tumor immune cells. This impairment encompassed both components of innate immunity, such as eosinophils, macrophages, monocytes, natural killer (NK) cells, neutrophils, and plasmacytoid dendritic cells, as well as elements of adaptive immunity, comprising activated B cells, type 1 T helper cells, type 17 T helper cells, and T follicular helper cells (Figure 5C). Further analysis of immune functional activity demonstrated broad downregulation in the high-risk group; however, CCR activity, parainflammation, and Type I IFN response were elevated (Figure 5D). Consistently, Stromal, Immune, and Estimate scores were markedly reduced in the high-risk group relative to low-risk patients, reflecting a disrupted tumor immune microenvironment (TIME) and a poorer prognostic outcome (Figure 5E-G). Validating these findings, complementary analyses employing EPIC, MCPCOUNTER, QUANTISEQ, and XCELL algorithms yielded similar results (Figure 5H).
Characterization of tumor microenvironment between two risk groups. (A) Correlation heatmap presenting the association between risk score and the relative abundance of immune cells. (B) Correlation heatmap showing the relationship between 8 prognostic genes and 28 immune cells infiltration. (C) The immune cell infiltration between two risk groups. (D) Comparison of immune function in two different groups. (E-G) Scatter and box plots showing differences in Immune, Stromal, and Estimate scores between the TRDEG-based risk groups. (H) Heatmap of immune cell infiltration between two risk groups using multiple computational algorithms.
TRDEG-based signature predicts NB response to immunotherapy
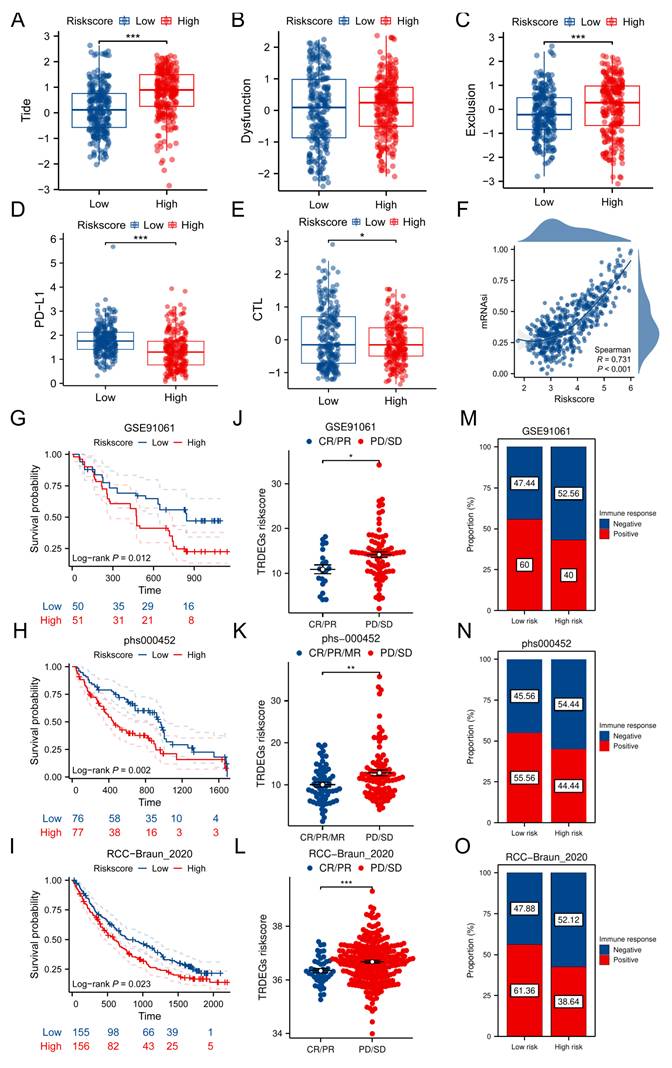
We firstly used TIDE algorithms, CTL score and expression pattern of PD-L1 to assess the immunotherapy reaction using transcriptomic information from patients with NB. Though no notable disparities were observed in dysfunction score, the results indicated that the high-risk group was associated with elevated TIDE and decreased CTL, PD-L1 levels. This suggests that patients belonging to the low-risk group might experience greater advantages from immunotherapy (Figure 6A-E). Secondly, our results indicated a significant positive correlation of TRDEGs risk scores with tumor mRNAsi. The GSE62564 dataset scatter plot validated a strong linear association (R = 0.731, P < 0.001), where the fitted trend line clearly underscored this direct relationship (Figure 6F). Furthermore, building on prior analysis, we computed TRDEGs risk scores in three immunotherapy cohorts: GSE91061 (anti-PD-1), phs000452 (anti-PD-1), and RCC-Braun_2020 (anti-PD-1 + EVEROLIMUS). Notably, low-risk patients in each cohort exhibited significantly improved survival outcomes and were more responsive to immunotherapy (Figure 6G-O).
TRDEG-based risk score predicts response of immunotherapy. (A-E) Boxplots exhibiting the significant difference in TIDE, Dysfunction, Exclusion, PD-L1 and CTL score. (F) Correlation analysis between model risk score and mRNAsi index. (G-I) Kaplan-Meier curves demonstrating a significant variation in survival rate between risk groups in the GSE91061, phs000452, and RCC-Braun_2020. (J-L) Wilcoxon rank-sum test of TRDEGs risk score variation in the GSE91061, phs000452, and RCC-Braun_2020. (M-O) The stacked histogram illustrating immunotherapy response variation across risk groups in GSE91061, phs000452, and RCC-Braun_2020. *P < 0.05, ** P < 0.01, *** P < 0.001.
Forecasting chemotherapeutic response in NB using TRDEG-based risk score
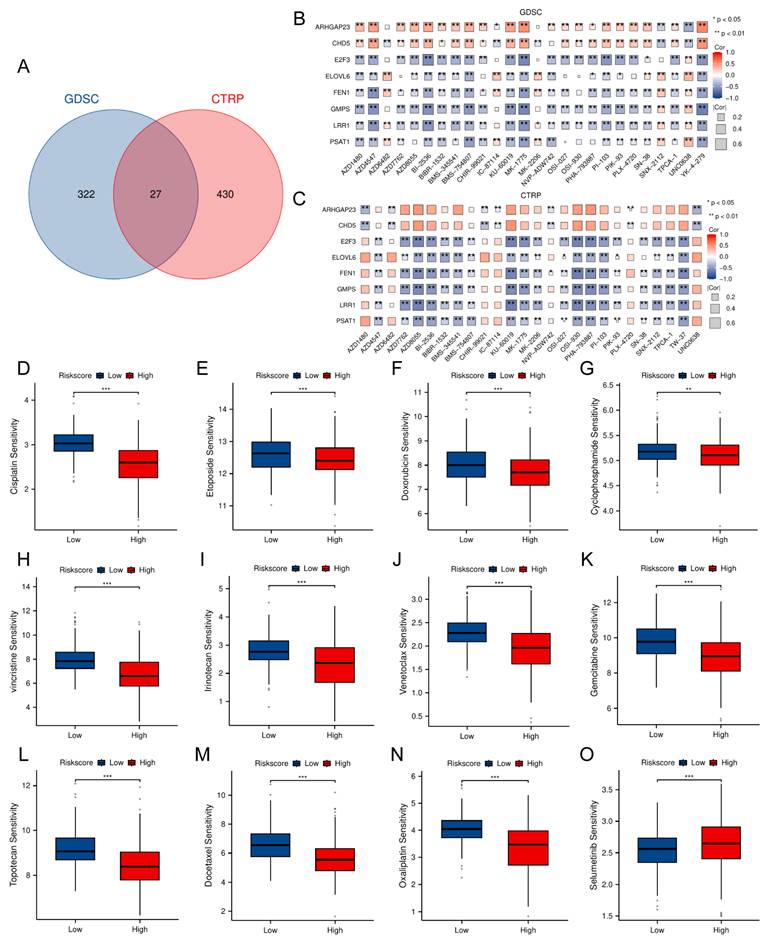
To identify potential therapeutic agents associated to the TRDEGs risk score, we performed drug sensitivity analysis using the "oncoPredict" R package. Differential drug response between risk groups was assessed via Wilcoxon rank-sum test (P < 0.05), identifying 349 significantly sensitive compounds in GDSC (from 442 tested) and 457 in CTRP (from 545 tested) (Figure 7A). Subsequent analysis focused on identifying drug intersections within the two drug databases. Correlation between the TRDEG signature genes and drug sensitivity was evaluated via Spearman's method. While antagonistic interactions were observed for some gene-drug pairs (e.g., ARHGAP23 and CHD5), synergistic relationships were identified for others, including E2F3, ELOVL6, FEN1, GMPS, LRR1, and PSAT1 (Figure 7B, C). To evaluate the TRDEG signature's utility for guiding chemotherapy, we applied the TRDEGs risk score to guide chemotherapeutic selection for NB in clinical practice. Exploring in the NB related chemotherapy drugs, most agents, excluding selumetinib, demonstrated enhanced efficacy in the low-risk group compared to the high-risk group (Figure 7D-O). These results highlight the feasibility of tailoring chemotherapy regimens to specific NB risk subgroups, supporting precision oncology approaches.
Association between the TRDEG-based risk score and drug sensitivity in NB. (A) The Venn diagram shows a total of 27 potential therapeutic agents from GDSC and CTRP. (B-C) Matrix showing correlation between 27 potential drugs sensitivity and mRNA expression of the prognostic model genes. (D-O) Evaluation of NB related clinical chemotherapy drugs sensitivity between two risk groups. *P < 0.05, ** P < 0.01, *** P < 0.001.
Analysis of single-cell RNA-seq data of TRDEG-based signature in NB
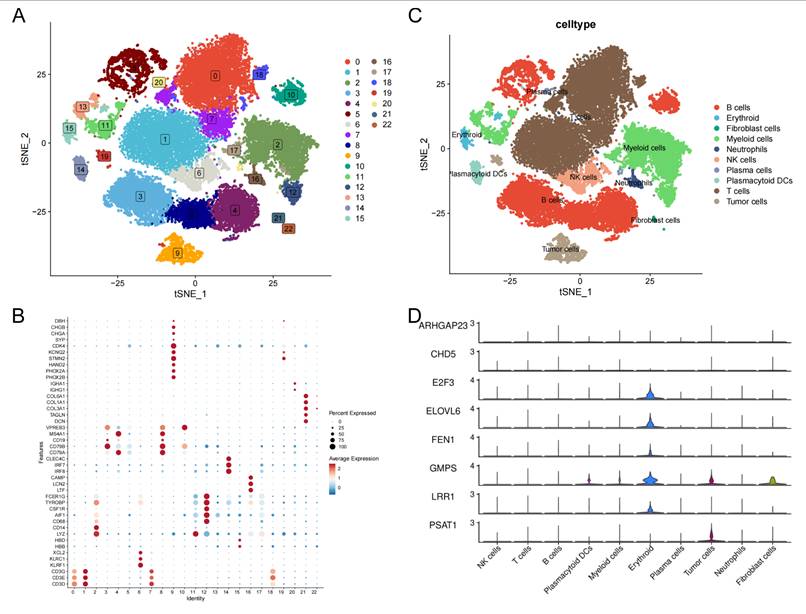
This study further validated the expression level of TRDEGs signature's hub genes at the single cell level. For single-cell transcriptomic sequencing data derived from GSE220946 (38,026 cells of 15 NB patients), initial processing included quality control, normalization, and batch effect removal. After tSNE-based dimensionality reduction organized cells into 23 clusters, cell-type annotation using established markers revealed 10 distinct populations, including B cells (CD79A, CD79B, CD19, MS4A1, VPREB3), erythroid (HBD, HBB), fibroblast cells (DCN, TAGLN, COL3A1, COL1A1, COL6A1), myeloid cells (LYZ, CD14, CD68, AIF1, CSF1R, TYROBP, FCER1G), neutrophils (LTF, LCN2, CAMP), NK cells (KLRF1, KLRC1, XCL2), plasma cells (IGHG1, IGHA1), plasmacytoid DCs (IRF7, IRF8, CLEC4C), T cells (CD3D, CD3E, CD3G) and tumor cells (PHOX2B, PHOX2A, HAND2, STMN2, KCNQ2, CDK4, SYP, CHGA, CHGB, DBH) (Figure 8A-C). We discovered that E2F3, ELOVL6, FEN1 and LRR1 were primarily expressed in erythroid; GMPS was mainly expressed in plasmacytoid DCs, myeloid cells, erythroid, fibroblast cells and tumor cells; PSAT1 was predominantly expressed in tumor cells. However, there were no significant differences among cells on the expression pattern of ARHGAP23 and CHD5 (Figure 8D).
Single-cell transcriptomic landscape of TRDEG-based genes in the NB tumor microenvironment. (A) t-SNE plot illustrating the distribution of 23 cell clusters. (B) Dot plot showing canonical marker genes used to annotate individual clusters. (C) Annotated t-SNE clustering of cell types. (D) Violin plots depicting the expression patterns of TRDEG-based prognostic genes across various cell populations.
PSAT1 serves as a predominant NB-associated gene within the TRDEG model
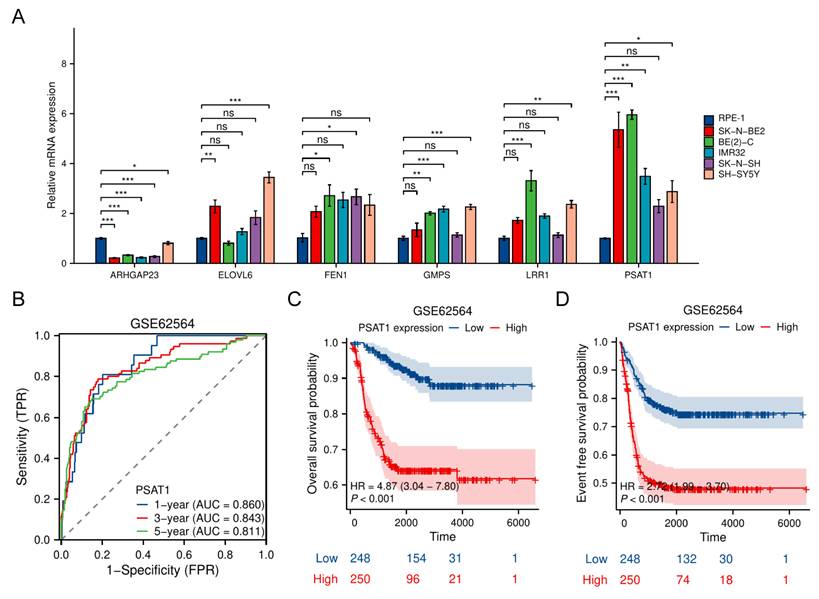
To experimentally validate the expression and function of the TRDEGs risk score, we measured expression of six risk model genes via quantitative RT-PCR in NB cell lines. The other two genes including CHD5 and E2F3 have been demonstrated by other researchers [21-24]. Most NB cell lines exhibited markedly elevated PSAT1 expression compared to the normal RPE-1 cells, with the highest levels observed in SK-N-BE2 and BE(2)-C. Conversely, ARHGAP23 expression was substantially higher in RPE-1 cells (Figure 9A). Importantly, scRNA-seq data led to the identification of PSAT1 as a representative gene within the TRDEG signature (Figure 8). Time-dependent ROC curve analysis demonstrated that PSAT1 possessed robust predictive accuracy for 1-, 3-, and 5-year survival, with AUCs of 0.860, 0.843, and 0.811, respectively (Figure 9B). Kaplan-Meier survival analyses further revealed that patients with high PSAT1 expression had significantly poorer OS (Figure 9C) and event-free survival (Figure 9D) compared with those with low expression.
PSAT1 serves as a NB-dependent gene within the TRDEG-based model. (A) Relative mRNA expression of representative TRGs in normal RPE-1 cells and various NB cells. (B) Time-dependent ROC curves of PSAT1 in the GSE62564 cohort predicting 1-, 3-, and 5-year survival. (C-D) Kaplan-Meier survival curves comparing OS and EFS between high and low PSAT1 expression groups.
PSAT1 acts as a key oncogenic driver in NB progression
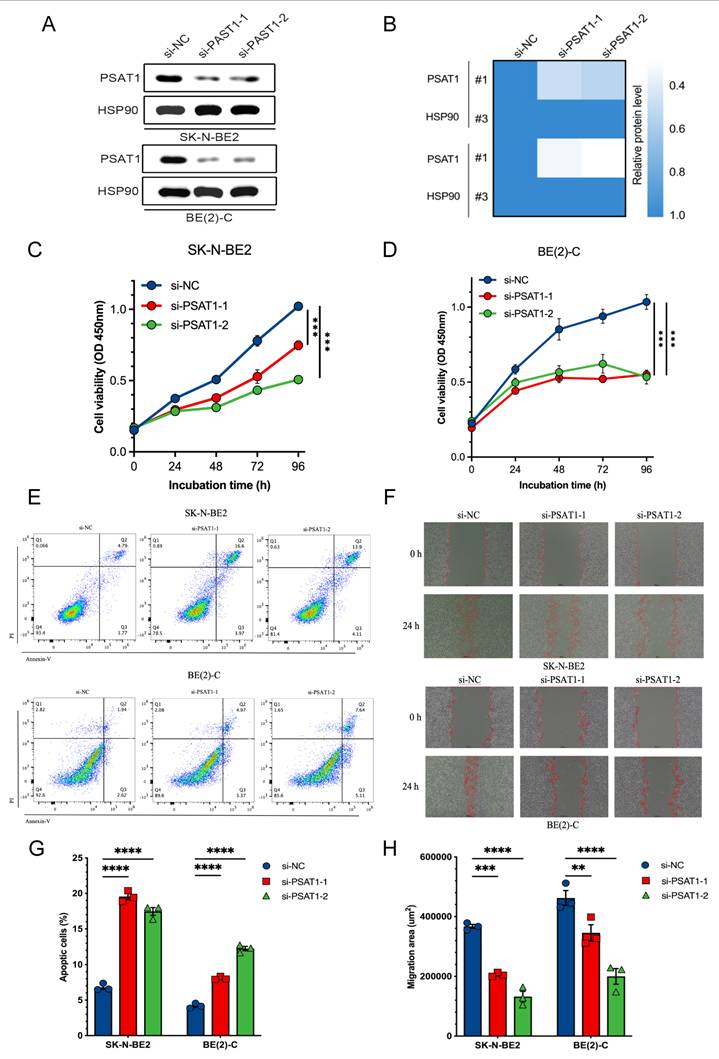
We first performed PSAT1 knockdown to verify its experimental relevance using siRNAs in both SK-N-BE2 and BE(2)-C cell lines, as determined by immunoblotting (Figure 10A, B). Then CCK-8 analysis assessed proliferative responses to PSAT1 knockdown in NB cells and both siRNAs significantly suppressed proliferation across SK-N-BE2 and BE(2)-C cell lines (Figure 10C, D). In addition, increased apoptosis was identified following PSAT1 knockdown in NB cells using Annexin V/PI staining (Figure 10E, G). A 24-h wound healing assay also confirmed that PSAT1 inhibition effectively attenuated the migration ability of NB cells (Figure 10F, H). Collectively, these results demonstrate that PSAT1 downregulation inhibits NB cell proliferation and migration while inducing apoptosis, highlighting its oncogenic function in NB.
Functional validation of PSAT1 silencing in NB cells. (A) Immunoblotting analysis showing PSAT1 silenced in SK-N-BE2 and BE(2)-C cells using two independent siRNAs. (B) Heatmap showing relative protein levels of PSAT1 normalized to HSP90 following siRNA-mediated silencing. (C-D) Cell viability curves showing reduced proliferation after PSAT1 silenced in SK-N-BE2 and BE(2)-C cells. (E) Flow cytometry analysis of apoptosis in SK-N-BE2 (upper panel) and BE(2)-C (lower panel) cells. (F) Wound-healing images showing that inhibited cell migration after PSAT1 silenced in SK-N-BE2 (upper panel) and BE(2)-C (lower panel) cells. (G-H) Quantification of apoptotic cell percentages and migration areas. *P < 0.05, ** P < 0.01, *** P < 0.001.
Discussion
Responsible for approximately 15% of childhood cancer fatalities, NB persists as the most frequent extracranial solid tumor in children [25, 26]. Pronounced molecular heterogeneity drives divergent clinical outcomes and frequently limits therapeutic efficacy, necessitating novel biomarkers and refined molecular subtyping systems to guide personalized treatment decisions [27]. Bioinformatics strategies show particular promise for these investigations. Telomeres—specialized nucleoprotein complexes at chromosomal termini—maintain genomic stability. Key telomere-associated genes include telomerase components, telomeric repeats, telomerase-activating receptors, and telomerase inhibitors [28, 29]. Dysregulation of these elements correlates strongly with oncogenesis in multiple malignancies: renal carcinoma, lung adenocarcinoma, pancreatic cancer, and glioma [7, 10, 12, 30]. Although TMMs constitute a fundamental cancer hallmark enabling limitless replication, TRGs' broader influence on NB's TIME and clinical progression remains inadequately characterized. We elucidate TRGs' contribution to NB development and prognosis through advanced bioinformatics analysis of transcriptomic datasets. Bulk and scRNA-seq integration established and validated a TRG-based prognostic risk model. The risk score demonstrated robust correlations with OS, clinicopathological parameters, immune infiltration patterns, and chemotherapy/immunotherapy responses. These findings establish both theoretical foundations and novel predictive tools for precision management of this challenging pediatric malignancy.
To achieve this objective, a set of 103 TRDEGs was identified at the intersection of DEGs, TRGs from the TelNet database and WGCNA-derived module genes exhibiting strong positive correlation with COG high-risk NB. Using the expression profiles of these selected genes, we stratified NB patients into two discrete molecular subtypes: cluster 1 and cluster 2. This clustering not only differentiated the patient populations but also indicated divergent prognostic outcomes, with Cluster 1 demonstrating poorer prognoses enriched in pathways related to cell proliferation and metabolism, such as the cell cycle and P53 signaling pathways, in contrast to Cluster 2 which was associated with immune regulatory processes, including Cytokine-Cytokine Receptor Interaction and antigen processing. Moreover, most of the top 25 TRDEGs were significantly increased in cluster 1 comparing cluster 2. These findings suggest that immune function in cluster 1 may be suppressed relative to that in cluster 2, potentially mediated by the specific roles of these dysregulated telomere-related molecules.
Moreover, we developed a prognostic risk score model for NB. Through univariate Cox regression and LASSO-Cox regression analysis, eight TRDEGs (ARHGAP23, CHD5, E2F3, ELOVL6, FEN1, GMPS, LRR1, and PSAT1) were identified as core components of this model. CHD5, the fifth member of the nine-protein CHD family, is located on chromosome 1p36. This region is frequently deleted in high-risk NB, and the subsequent low expression of CHD5 is strongly associated with stage 4 NB [21]. Diverse functional assays demonstrated that forced CHD5 expression in NB cell lines harboring 1p loss significantly impaired key metastatic processes, including anchorage-independent growth, endothelial adhesion, invasion, and migration in vitro [21, 22]. As a key regulator of G1/S transition in the cell cycle, the E2F3 belongs to the E2F family. This family modulates numerous oncogenic processes—including DNA transcription, apoptosis, DNA damage repair, senescence, and autophagy [31]. Additionally, E2F3 has been reported to interact synergistically with MYCN and its downregulation significantly induces apoptosis and differentiation [32, 33]. Thus, CHD5 is established as a tumor suppressor in NB, actively inhibiting tumor growth and progression, while E2F3 is documented as a cancer promoter, exacerbating NB development.
While the functions of the remaining core genes in NB are rarely explored, existing literature shows that these genes are strongly associated with tumor progression, invasion, and metastasis. ARHGAP23 is a member of the ARH gene family and functions as encoding a GTPase in the Rho family. It acts not only as a tumor suppressor by inhibiting RhoA/Rac1-driven invasion and metastasis, but also contributes to oncogenesis through genetic rearrangements like the ARHGAP23::FER fusion [34, 35]. We hypothesize that ARHGAP23 may act as an anti-oncogene based on its markedly reduced mRNA levels in NB cell lines, but its protective mechanism remains unclear; Within FGFR3-driven bladder tumors, ELOVL6-driven lipid composition preserves mitochondrial function, thereby enabling cell proliferation and oncogenic progression [36]; The knockdown of FEN1 was shown to attenuate AKT/mTOR signaling activation, inhibit pancreatic cell progression in vitro, and suppress tumor growth in vivo in mouse xenografts [37]; GMPS, an enzyme integral to purine biosynthesis that utilizes glutamine as a nitrogen donor, has emerged as a critical metabolic node in tumorigenesis. For instance, elevated GMPS mRNA levels have been found to correlate with higher Gleason scores and to predict reduced overall and disease/progression-free survival rates in prostate cancer patients [38]. Importantly, Pharmacological inhibition of GMPS with angustmycin A, a potent and selective antagonist, led to the marked attenuation of PD-L1 expression and oncogenic progression in hepatocellular carcinoma (HCC), concurrently enhancing susceptibility to anti-CTLA-4 immunotherapy [39]. These findings in other malignancies suggest that GMPS may also play a significant role in NB progression and influence the tumor's response to immunotherapy; Moreover, LRR1 plays a pivotal role in maintaining genomic stability by facilitating the disassembly of the replisome complex during DNA replication. Disruption of LRR1 activity, particularly through the CRL2LRR1 enzyme complex, results in the activation of an ATR-mediated G2/M checkpoint, causing cell cycle arrest and mitotic blockage [40]; PSAT1, which is a pivotal enzyme in the serine synthesis pathway, functions as a central node in cancer metabolism and progression, with roles spanning from enzymatic support to non-canonical signaling in migration, metastasis, and therapy resistance [41, 42]. To confirm the model's validity, PSAT1 was selected as a primary regulator among TRDEGs, and subsequent cellular assays demonstrated its role in driving NB cell proliferation and migration. Together, these results underscore the prognostic relevance of these genes and their potential clinical utility in evaluating NB progression and outcomes.
Beyond its well-characterized enzymatic role as the rate-limiting enzyme in the serine synthesis pathway (SSP), PSAT1 functions as a core constituent of the telomere-related prognostic signature established in our study. Notably, PSAT1 is officially annotated as a telomere-associated gene in the TelNet database, yet direct experimental evidence linking PSAT1 to telomere homeostasis regulation in human malignancies has yet to be reported. To address this clear research gap, we outline evidence-based mechanistic hypotheses to delineate the indirect but functionally coherent links between PSAT1 and telomere biology in NB, focusing specifically on two core metabolic regulatory axes. The first axis centers on PSAT1's essential role in supplying nucleotide precursors for telomere maintenance: as both the rate-limiting enzyme for de novo serine biosynthesis and a key modulator of intracellular one-carbon metabolism, PSAT1 drives serine production, which serves as the primary cellular source of one-carbon units required for de novo purine and pyrimidine synthesis [43,44]. This metabolic cascade provides key upstream metabolic support for telomeric DNA replication and length maintenance [41], processes mediated by either telomerase activation or the alternative lengthening of telomeres (ALT) pathway in high-risk NB [14-17]. The second, equally critical axis focuses on PSAT1's ability to preserve telomere structural integrity through redox homeostasis regulation. Telomeric DNA is defined by G-rich repeat sequences, a structural feature that confers extreme vulnerability to oxidative damage from reactive oxygen species (ROS), and this form of oxidative damage is repeatedly demonstrated in prior studies as a core driver of non-replicative, accelerated telomere shortening [45, 46]. Through the SSP, PSAT1 generates glycine, an essential precursor for the production of glutathione (GSH), the cell's primary endogenous antioxidant. By sustaining intracellular redox balance and scavenging excess ROS, PSAT1 limits oxidative damage to telomeric DNA, and in turn, indirectly protects the structural integrity of telomeres [47, 48]. Importantly, we explicitly note that all the associations outlined above are evidence-based hypotheses derived from existing published research, and the direct causal relationship between PSAT1 and telomere homeostasis in NB still requires systematic functional validation in future studies.
TIME encompasses the structural, metabolic, and cellular components—including stromal, immune, and malignant cells—within the host tissue of a tumor. Crosstalk between tumor cells and immune components within the TIME critically regulates disease progression processes like tumor growth, metastasis, and drug resistance, while also influencing anti-tumor immunity [49, 50]. Besides, recent studies have revealed that TRGs significantly associate with immune cell infiltration levels, the composition of TIME, and predicted or potential response to immunotherapy across various cancers [51-53]. Given this, elucidating the correlation between the TIME and TRDEGs risk score is essential. Our findings revealed distinct immune landscapes and differential immune cell infiltration between high- and low-risk NB patients. Low-risk NB patients manifested an immunologically active ("hot") microenvironment, characterized by increased infiltration of activated B cells, DCs, CD8⁺ T cells, NK cells, macrophages, and type 1 T helper (Th1) cells, whereas high-risk patients exhibited an immunologically suppressed ("cold") profile dominated by type 2 T helper (Th2) cell accumulation. Prior studies indicate Th1 cells are significant within the TIME, primarily through their activation of CD8+ T cells to drive antitumor responses [54]. NK cells critically control tumor cell destruction and metastasis, functioning collaboratively within the TIME (55). By secreting immunoglobulins, B cells support humoral responses and tumor suppression (50). Additionally, CD56dim NK cells and macrophages execute vital anticancer roles across malignancies [56, 57]. In contrast to these favorable roles, Fridman's review highlighted that the infiltration of Th2 cells correlates with unfavorable prognoses in ovarian, pancreatic, and gastric cancers, findings that align with our observations [58]. Moreover, the low-risk NB patients exhibited higher ESTIMATE, CTL, and PD-L1 scores alongside a lower TIDE score compared to high-risk patients, indicating a more favorable response to immunologic treatment. To validate these results, we analyzed the TRDEGs risk score in multiple immunotherapy cohorts, with analyses consistently demonstrating prolonged survival and significantly elevated treatment response rates in low-risk patients relative to high-risk counterparts. These results indicate that immunotherapy response in NB could be modified by TRGs through immunocyte efficacy regulation. Understanding these immune dynamics in conjunction with TRGs expression patterns may provide critical insights into optimizing treatment regimens that leverage the patient's immune response while addressing the inherent tumor biology of NB.
This study has several limitations that should be considered. Our findings rely largely on publicly accessible transcriptomic datasets. Although these datasets offer breadth, they likely fail to capture the full pathophysiological spectrum of NB in clinical settings. A particular constraint is the lack of large-scale clinical validations for the TRDEGs identified, which limits opportunities to explore their functional mechanisms and could affect how broadly applicable our results are. For our in vitro experiments, we only applied two MYCN-amplified NB cells, which included SK-N-BE(2) and its clonal subline BE(2)-C. The lack of parallel functional tests in other MYCN-amplified and MYCN-not amplified NB cell models may further limit the widely applicability of our conclusions across different NB subtypes. Moreover, we did not validate our findings in xenograft models. This means we cannot fully recapitulate NB's in vivo tumor microenvironment and physiological growth, so the clinical translation potential of our findings need further exploration. Our single-cell analyses face dual constraints: limited sample sizes inherent to available scRNA-seq datasets, and unavoidable subjectivity during cellular subtype annotation—factors that possibly influenced interpretive accuracy. For immunotherapy response prediction, we used immunotherapy cohorts from melanoma and renal cell carcinoma, and substantial heterogeneity in the tumor immune microenvironment across different cancer types is an inherent limitation of this cross-cancer analysis. Additionally, the modest size of available retrospective cohorts further restricts the robustness of our findings, and future prospective validation in dedicated NB immunotherapy cohorts is essential to confirm its clinical applicability. Overall, further studies with larger clinical samples and in-depth functional assays are needed to verify the clinical translation potential of our findings.
In conclusion, through integrated bioinformatics analysis, we identify that TRGs play a pivotal role in shaping NB prognosis and treatment response. The validated TRDEG signature provides a foundation for individual risk assessment and future development of precision therapies and immunotherapeutic strategies. Among these genes, PSAT1 emerges as a key oncogenic driver.
Abbreviations
ALT: Alternative Lengthening of Telomeres; ARHGAP23: Rho GTPase Activating Protein 23; AUC: Area Under the Curve; BP: Biological Processes; BSA: Bovine Serum Albumin; CCK-8: Cell Counting Kit-8; CC: Cellular Components; CDF: Cumulative Distribution Function; CHD5: Chromodomain Helicase DNA Binding Protein 5; COG: Children's Oncology Group; CR: Complete Response; CTRP: Cancer Therapeutics Response Portal; DCA: Decision Curve Analysis; DEGs: Differentially Expressed Genes; E2F3: E2F Transcription Factor 3; EFS: Event-Free Survival; ELOVL6: ELOVL Fatty Acid Elongase 6; EPIC: Estimation of the Proportions of Immune and Cancer cells; ESTIMATE: Estimation of Stromal and Immune cells in Malignant Tumor tissues using Expression data; FEN1: Flap Endonuclease 1; GDSC: Genomics of Drug Sensitivity in Cancer; GEO: Gene Expression Omnibus; GMPS: Guanine Monphosphate Synthase; GO: Gene Ontology; GSEA: Gene Set Enrichment Analysis; HCC: Hepatocellular Carcinoma; HR: Hazard Ratio; INSS: International Neuroblastoma Staging System; KEGG: Kyoto Encyclopedia of Genes and Genomes; LASSO: Least Absolute Shrinkage and Selection Operator; LRR1: Leucine-Rich Repeat protein 1; LRS: LASSO Risk Score; MCPCOUNTER: Microenvironment Cell Population Counter; MF: Molecular Functions; mRNAsi: mRNA Stemness Index; NB: Neuroblastoma; OS: Overall Survival; PCA: Principal Component Analysis; PD: Progressive Disease; PR: Partial Response; PSAT1: Phosphoserine Aminotransferase 1; QUANTISEQ: Quantification of the Tumor Immune Contexture from RNA-seq data; ROC: Receiver Operating Characteristic; SD: Stable Disease; TIDE: Tumor Immune Dysfunction and Exclusion; TIME: Tumor Immune Microenvironment; TMMs: Telomere Maintenance Mechanisms; TRGs: Telomere-Related Genes; TRDEGs: Telomere-Related Differentially Expressed Genes; UMAP: Uniform Manifold Approximation and Projection; WGCNA: Weighted Gene Co-expression Network Analysis.
Supplementary Material
Supplementary figures.
Supplementary tables.
Acknowledgements
We are deeply thankful to the researchers for making their public datasets available online. The availability of this data was pivotal to our work and greatly enriched our analytical outcomes.
Funding
This study was funded by the Shanghai Children's Hospital National Natural Science Foundation Cultivation Special Youth Project (2022YGZQ03) and the National Natural Science Foundation of China (82302992).
Data Availability Statement
All data and results utilized in this study were obtained from the following database: GEO (http://www.ncbi.nlm.nih.gov/geo/, accessed on 1 September 2025), R2 platform (https://hgserver1.amc.nl/cgi-bin/r2/main.cgi, accessed on 1 September 2025) and TIGER portal (http://tiger.canceromics.org/, accessed on 25 August 2025). Other data relevant to this study are available upon reasonable request from the corresponding author.
Authors Contributions
Conceptualization: Yeerfan Aierken and Tao Liu; Data curation: Yeerfan Aierken; Methodology: Yeerfan Aierken and Lulu Zheng; Formal analysis and investigation: Yeerfan Aierken and Tao Liu; Visualization: Lulu Zheng and Tao Liu; Writing—original draft preparation: Yeerfan Aierken and Lulu Zheng; Writing—review and editing: Zhibao Lv; Funding acquisition: Kezhe Tan; Supervision: Zhibao Lv and Kezhe Tan. All authors have read and approved the final manuscript.
Competing Interests
The authors have declared that no competing interest exists.
References
1. Louis CU, Shohet JM. Neuroblastoma: molecular pathogenesis and therapy. Annu Rev Med. 2015;66:49-63 doi:10.1146/annurev-med-011514-023121
2. Modak S, Cheung NK. Neuroblastoma: therapeutic strategies for a clinical enigma. Cancer Treat Rev. 2010;36(4):307-317 doi:10.1016/j.ctrv.2010.02.006
3. Almstedt E, Elgendy R, Hekmati N, Rosén E, Wärn C, Olsen TK. et al. Integrative discovery of treatments for high-risk neuroblastoma. Nat Commun. 2020;11(1):71 doi:10.1038/s41467-019-13817-8
4. Zhang H, Kong W, Xie Y, Zhao X, Luo D, Chen S. et al. Telomere-related genes as potential biomarkers to predict endometriosis and immune response: development of a machine learning-based risk model. Front Med (Lausanne). 2023;10:1132676 doi:10.3389/fmed.2023.1132676
5. Saunders CN, Kinnersley B, Culliford R, Cornish AJ, Law PJ, Houlston RS. Relationship between genetically determined telomere length and glioma risk. Neuro Oncol. 2022;24(2):171-181 doi:10.1093/neuonc/noab208
6. Ruan Y, Lv W, Li S, Cheng Y, Wang D, Zhang C. et al. Identification of telomere-related genes associated with aging-related molecular clusters and the construction of a diagnostic model in Alzheimer's disease based on a bioinformatic analysis. Comput Biol Med. 2023;159:106922 doi:10.1016/j.compbiomed.2023.106922
7. Li SC, Jia ZK, Yang JJ, Ning XH. Telomere-related gene risk model for prognosis and drug treatment efficiency prediction in kidney cancer. Front Immunol. 2022;13:975057 doi:10.3389/fimmu.2022.975057
8. Li Q, Liu H. Investigating the prognostic role of telomerase-related cellular senescence gene signatures in breast cancer using machine learning. Biomedicines. 2025;13(4):826 doi:10.3390/biomedicines13040826
9. Chen X, Qin Z, Zhu X, Wang L, Li C, Wang H. Identification and validation of telomerase related lncRNAs signature to predict prognosis and tumor immunotherapy response in bladder cancer. Sci Rep. 2023;13(1):21816 doi:10.1038/s41598-023-49167-1
10. Zhou Q, Wang Y, Xin C, Wei X, Yao Y, Xia L. Identification of telomere-associated gene signatures to predict prognosis and drug sensitivity in glioma. Comput Biol Med. 2024;168:107750 doi:10.1016/j.compbiomed.2024.107750
11. Mafi A, Mannani R, Khalilollah S, Hedayati N, Salami R, Rezaee M. et al. The significant role of microRNAs in gliomas angiogenesis: a particular focus on molecular mechanisms and opportunities for clinical application. Cell Mol Neurobiol. 2023;43(7):3277-3299 doi:10.1007/s10571-023-01385-x
12. Chen S, Hu S, Zhou B, Cheng B, Tong H, Su D. et al. Telomere-related prognostic biomarkers for survival assessments in pancreatic cancer. Sci Rep. 2023;13(1):10586 doi:10.1038/s41598-023-37836-0
13. Walsh KM, Whitehead TP, de Smith AJ, Smirnov IV, Park M, Endicott AA. et al. Common genetic variants associated with telomere length confer risk for neuroblastoma and other childhood cancers. Carcinogenesis. 2016;37(6):576-582 doi:10.1093/carcin/bgw037
14. Yu EY, Cheung NV, Lue NF. Connecting telomere maintenance and regulation to the developmental origin and differentiation states of neuroblastoma tumor cells. J Hematol Oncol. 2022;15(1):117 doi:10.1186/s13045-022-01337-w
15. Persaud N, Gundem G, Kushner BH, Ladanyi M, Shukla N, Modak S. Clinical significance of TERT promoter mutations in neuroblastoma. JCO Precis Oncol. 2025;9:e2500074 doi:10.1200/PO-25-00074
16. Burkert M, Blanc E, Thiessen N, Weber C, Toedling J, Monti R. et al. Copy-number dosage regulates telomere maintenance and disease-associated pathways in neuroblastoma. iScience. 2024;27(10):110918 doi:10.1016/j.isci.2024.110918
17. Djos A, Thombare K, Vaid R, Gaarder J, Umapathy G, Reinsbach SE. et al. Telomere maintenance mechanisms in a cohort of high-risk neuroblastoma tumors and its relation to genomic variants in the TERT and ATRX genes. Cancers (Basel). 2023;15(24):5732 doi:10.3390/cancers15245732
18. Koneru B, Farooqi A, Nguyen TH, Chen WH, Hindle A, Eslinger C. et al. ALT neuroblastoma chemoresistance due to telomere dysfunction-induced ATM activation is reversible with ATM inhibitor AZD0156. Sci Transl Med. 2021;13(607):eabd5750 doi:10.1126/scitranslmed.abd5750
19. Vaid R, Thombare K, Mendez A, Burgos-Panadero R, Djos A, Jachimowicz D. et al. METTL3 drives telomere targeting of TERRA lncRNA through m6A-dependent R-loop formation: a therapeutic target for ALT-positive neuroblastoma. Nucleic Acids Res. 2024;52(5):2648-2671 doi:10.1093/nar/gkad1242
20. Braun DM, Chung I, Kepper N, Deeg KI, Rippe K. TelNet - a database for human and yeast genes involved in telomere maintenance. BMC Genet. 2018;19(1):32 doi:10.1186/s12863-018-0617-8
21. Laut AK, Dorneburg C, Fürstberger A, Barth TFE, Kestler HA, Debatin KM. et al. CHD5 inhibits metastasis of neuroblastoma. Oncogene. 2022;41(5):622-633 doi:10.1038/s41388-021-02081-0
22. Higashi M, Kolla V, Iyer R, Naraparaju K, Zhuang T, Kolla S. et al. Retinoic acid-induced CHD5 upregulation and neuronal differentiation of neuroblastoma. Mol Cancer. 2015;14:150 doi:10.1186/s12943-015-0425-y
23. Parodi S, Ognibene M, Haupt R, Pezzolo A. The over-expression of E2F3 might serve as prognostic marker for neuroblastoma patients with stage 4S disease. Diagnostics (Basel). 2020;10(5):315 doi:10.3390/diagnostics10050315
24. Pandher R, Xue C, Gamble LD, Milazzo G, Di Gioia SA, Murray J. et al. The cell-permeable iron chelator M606 inhibits MYCN-driven neuroblastoma via an E2F3-mediated response. Proc Natl Acad Sci U S A. 2025;122(23):e2420011122 doi:10.1073/pnas.2420011122
25. Siegel RL, Kratzer TB, Giaquinto AN, Sung H, Jemal A. Cancer statistics, 2025. CA Cancer J Clin. 2025;75(1):10-45 doi:10.3322/caac.21871
26. Ponzoni M, Bachetti T, Corrias MV, Brignole C, Pastorino F, Calarco E. et al. Recent advances in the developmental origin of neuroblastoma: an overview. J Exp Clin Cancer Res. 2022;41(1):92 doi:10.1186/s13046-022-02281-w
27. Irwin MS, Naranjo A, Zhang FF, Cohn SL, London WB, Gastier-Foster JM. et al. Revised neuroblastoma risk classification system: a report from the Children's Oncology Group. J Clin Oncol. 2021;39(29):3229-3241 doi:10.1200/JCO.21.00278
28. Jafri MA, Ansari SA, Alqahtani MH, Shay JW. Roles of telomeres and telomerase in cancer, and advances in telomerase-targeted therapies. Genome Med. 2016;8(1):69 doi:10.1186/s13073-016-0324-x
29. Liu S, Fu Z, Liu H, Wang Y, Zhou M, Ding Z, Feng Z. Lipid profiles, telomere length, and the risk of malignant tumors: a Mendelian randomization and mediation analysis. Biomedicines. 2024;13(1):13 doi:10.3390/biomedicines13010013
30. Jiang Y, Liu J, Pan B, Yu S, Hu C, Li Q. et al. Prediction of lung adenocarcinoma prognosis and clinical treatment efficacy by telomere-associated gene risk model. Discov Oncol. 2025;16(1):1102 doi:10.1007/s12672-025-02977-3
31. Xie D, Pei Q, Li J, Wan X, Ye T. Emerging role of E2F family in cancer stem cells. Front Oncol. 2021;11:723137 doi:10.3389/fonc.2021.723137
32. De Rosa P, Severi F, Zadran SK, Russo M, Aloisi S, Rigamonti A. et al. MYCN amplification, along with wild-type RB1 expression, enhances CDK4/6 inhibitors' efficacy in neuroblastoma cells. Int J Mol Sci. 2023;24(6):5408 doi:10.3390/ijms24065408
33. Welch C, Chen Y, Stallings RL. MicroRNA-34a functions as a potential tumor suppressor by inducing apoptosis in neuroblastoma cells. Oncogene. 2007;26(34):5017-5022 doi:10.1038/sj.onc.1210293
34. Müller L, Keil R, Glaß M, Hatzfeld M. Plakophilin 4 controls the spatio-temporal activity of RhoA at adherens junctions to promote cortical actin ring formation and tissue tension. Cell Mol Life Sci. 2024;81(1):291 doi:10.1007/s00018-024-05329-6
35. Sadaf A, Szabo S, Ferguson K, Sorger JI, Sumegi J, Bridge JA. et al. Novel ARHGAP23-FER fusion in a metastatic spindle cell-predominant neoplasm with a myofibroblastic phenotype and a sustained metabolic response to lorlatinib. Cancer. 2021;127(22):4124-4130 doi:10.1002/cncr.33854
36. Matsuda E, Hasebe S, Matsuzaka T, Hayashi A, Ohno H, Motomura K. et al. Inhibition of ELOVL6 activity impairs mitochondrial respiratory function and inhibits tumor progression in FGFR3-mutated bladder cancer cells. Biochim Biophys Acta Mol Basis Dis. 2025;1871(8):168023 doi:10.1016/j.bbadis.2025.168023
37. Xia Y, Guo N, Zhu CL, Gao JY, Da MX. Flap endonuclease-1 promotes pancreatic cancer progression via AKT/mTOR signaling pathway. World J Gastrointest Oncol. 2025;17(7):104402 doi:10.4251/wjgo.v17.i7.104402
38. Wang Q, Guan YF, Hancock SE, Wahi K, van Geldermalsen M, Zhang BK. et al. Inhibition of guanosine monophosphate synthetase (GMPS) blocks glutamine metabolism and prostate cancer growth. J Pathol. 2021;254(2):135-146 doi:10.1002/path.5665
39. Guo X, Cui T, Sun L, Fu Y, Cheng C, Wu C. et al. A STT3A-dependent PD-L1 glycosylation modification mediated by GMPS drives tumor immune evasion in hepatocellular carcinoma. Cell Death Differ. 2025;32(5):944-958 doi:10.1038/s41418-024-01432-0
40. Fan Y, Köberlin MS, Ratnayeke N, Liu C, Deshpande M, Gerhardt J. et al. LRR1-mediated replisome disassembly promotes DNA replication by recycling replisome components. J Cell Biol. 2021;220(8):e202009147 doi:10.1083/jcb.202009147
41. Yang X, Li C, Chen Y. Phosphoserine aminotransferase 1: a metabolic enzyme target of cancers. Curr Cancer Drug Targets. 2023;23(3):171-186 doi:10.2174/1568009622666220829105300
42. Shu M, Liu Y, Wang J. Protein post-translational modifications in serine synthetic pathway: functions and molecular mechanisms. Cell Commun Signal. 2025;23(1):311 doi:10.1186/s12964-025-02327-4
43. Mattaini KR, Sullivan MR, Vander Heiden MG. The importance of serine metabolism in cancer. J Cell Biol. 2016;214(3):249-57 doi:10.1083/jcb.201604085
44. Tajan M, Hennequart M, Cheung EC, Zani F, Hock AK, Legrave N. et al. Serine synthesis pathway inhibition cooperates with dietary serine and glycine limitation for cancer therapy. Nat Commun. 2021;12(1):366 doi: 10.1038/s41467-020-20223-y
45. Tao HY, Zhao CY, Wang Y, Sheng WJ, Zhen YS. Targeting Telomere Dynamics as an Effective Approach for the Development of Cancer Therapeutics. Int J Nanomedicine. 2024;19:3805-3825 doi: 10.2147/IJN.S448556
46. Sayed ME, Yuan L, Robin JD, Tedone E, Batten K, Dahlson N. et al. NOVA1 directs PTBP1 to hTERT pre-mRNA and promotes telomerase activity in cancer cells. Oncogene. 2019;38(16):2937-2952 doi:10.1038/s41388-018-0639-8
47. Jiang J, Chen HN, Jin P, Zhou L, Peng L, Huang Z. et al. Targeting PSAT1 to mitigate metastasis in tumors with p53-72Pro variant. Signal Transduct Target Ther. 2023;8(1):65 doi: 10.1038/s41392-022-01266-7
48. Zhang Y, Li J, Dong X, Meng D, Zhi X, Yuan L. et al. PSAT1 Regulated Oxidation-Reduction Balance Affects the Growth and Prognosis of Epithelial Ovarian Cancer. Onco Targets Ther. 2020;13:5443-5453 doi:10.2147/OTT.S250066
49. Garcia-Gomez A, Rodríguez-Ubreva J, Ballestar E. Epigenetic interplay between immune, stromal and cancer cells in the tumor microenvironment. Clin Immunol. 2018;196:64-71 doi:10.1016/j.clim.2018.02.013
50. Xiao Y, Yu D. Tumor microenvironment as a therapeutic target in cancer. Pharmacol Ther. 2021;221:107753 doi:10.1016/j.pharmthera.2020.107753
51. Kang K, Nie H, Kuang W, Li X, Zhou Y. A novel telomere-associated genes signature for the prediction of prognosis and treatment responsiveness of hepatocellular carcinoma. Biol Proced Online. 2025;27(1):8 doi:10.1186/s12575-025-00271-8
52. Li X, Wang X, Yu F, Li Z, Chen D, Qi Y. et al. Development and validation of a prognostic and drug sensitivity model for gastric cancer utilizing telomere-related genes. Transl Oncol. 2025;52:102232 doi:10.1016/j.tranon.2024.102232
53. Xie Q, Liu T, Zhang X, Ding Y, Fan X. Construction of a telomere-related gene signature to predict prognosis and immune landscape for glioma. Front Endocrinol (Lausanne). 2023;14:1145722 doi:10.3389/fendo.2023.1145722
54. Johnson AM, Bullock BL, Neuwelt AJ, Poczobutt JM, Kaspar RE, Li HY. et al. Cancer cell-intrinsic expression of MHC class II regulates the immune microenvironment and response to anti-PD-1 therapy in lung adenocarcinoma. J Immunol. 2020;204:2295-2307 doi:10.4049/jimmunol.1900778
55. Shimasaki N, Jain A, Campana D. NK cells for cancer immunotherapy. Nat Rev Drug Discov. 2020;19:200-218 doi:10.1038/s41573-019-0052-1
56. Wang SS, Liu W, Ly D, Xu H, Qu L, Zhang L. et al. Tumor-infiltrating B cells: their role and application in anti-tumor immunity in lung cancer. Cell Mol Immunol. 2019;16:6-18 doi:10.1038/s41423-018-0027-x
57. Blander JM. Macrophage barrier responses to oncogenic transformation. Curr Opin Immunol. 2025;92:102524 doi:10.1016/j.coi.2024.102524
58. Fridman WH, Pagès F, Sautès-Fridman C, Galon J. The immune contexture in human tumours: impact on clinical outcome. Nat Rev Cancer. 2012;12:298-306 doi:10.1038/nrc3245
Author contact
![]() Corresponding authors: Zhibao Lv, email: zhibaolyucom, and Kezhe Tan, email: genuistkzcom.
Corresponding authors: Zhibao Lv, email: zhibaolyucom, and Kezhe Tan, email: genuistkzcom.