Impact Factor ISSN: 1837-9664

 Global reach, higher impact
J Cancer 2026; 17(1):177-196. doi:10.7150/jca.123965 This issue Cite
Research Paper
Multi-Omics and Single-Cell Dissection of Exostosin Glycosyltransferases (EXT1/EXT2) Reveals Divergent Oncogenic Roles and Therapeutic Vulnerabilities in Gliomas
Yi-Chun Chiang1,2†, Chih-Yang Wang3,4†, Neethu Palekkode4,5, Shun-Fa Yang1,6, Kai-Fu Chang7,8, Ching-Chung Ko9,10,11, Chih-Hsuan Chang7,12, Hui-Ru Lin12,13, Chi-Jen Wu12,14, Yu-Cheng Ho15, Chih-Chun Lin16, Chien-Han Yuan7,12,17,18, Sachin Kumar3,4,19, Dahlak Daniel Solomon3,20, Juan Lorell Ngadio3,21, Fitria Sari Wulandari3, Do Thi Minh Xuan22, Chung-Bao Hsieh23, Meng-Chi Yen24,25, I-Jeng Yeh24,25, Pi-Chan Ko26, Chia-Lung Shih27, Hoi-Bor Chan26 ![]() , Yung-Kuo Lee7,8,12,28
, Yung-Kuo Lee7,8,12,28 ![]() , Ngoc Uyen Nhi Nguyen29,30
, Ngoc Uyen Nhi Nguyen29,30 ![]()
1. Institute of Medicine, Chung Shan Medical University, Taichung 40201, Taiwan.
2. Department of Surgery, Division of Neurosurgery, Kaohsiung Armed Forces General Hospital, Kaohsiung 80284, Taiwan.
3. Graduate Institute of Cancer Biology and Drug Discovery, College of Medical Science and Technology, Taipei Medical University, Taipei 11031, Taiwan.
4. PhD Program for Cancer Molecular Biology and Drug Discovery, College of Medical Science and Technology, Taipei Medical University, Taipei 11031, Taiwan.
5. Department of Biotechnology, Mother Teresa Women's University, Kodaikanal, Tamil Nadu, 624101, India.
6. Department of Medical Research, Chung Shan Medical University Hospital, Taichung 40201, Taiwan.
7. Medical Laboratory, Medical Education and Research Center, Kaohsiung Armed Forces General Hospital, Kaohsiung 80284, Taiwan.
8. Division of Experimental Surgery Center, Department of Surgery, Tri-Service General Hospital, National Defense Medical University, Taipei 11490, Taiwan.
9. Department of Medical Imaging, Chi-Mei Medical Center, Tainan710402, Taiwan.
10. Department of Health and Nutrition, Chia Nan University of Pharmacy and Science, Tainan 71710, Taiwan.
11. School of Medicine, College of Medicine, National Sun Yat-Sen University, Kaohsiung 80424, Taiwan.
12. Institute of Medical Science and Technology, National Sun Yat-Sen University, Kaohsiung 80424, Taiwan.
13. Nursing Department, Kaohsiung Armed Forces General Hospital, Kaohsiung 80284, Taiwan.
14. College of Nursing, Kaohsiung Medical University, Kaohsiung 80708, Taiwan.
15. School of Medicine, College of Medicine, I-Shou University, Kaohsiung 82445, Taiwan.
16. Department of Physical Therapy, I-Shou University, Kaohsiung 824005, Taiwan.
17. Department of Otolaryngology, Kaohsiung Armed Forces General Hospital, Kaohsiung 80284, Taiwan.
18. Department of Otolaryngology, National Defense Medical University, Taipei 11490, Taiwan.
19. Faculty of Applied Sciences and Biotechnology, Shoolini University of Biotechnology and Management Sciences, Himachal Pradesh 173229, India.
20. Yogananda School of AI Computers and Data Sciences, Shoolini University, Solan 173229, India.
21. Department of Bioinformatics, School of Life Sciences, Indonesia International Institute for Life Sciences, Jl. Pulomas Barat Kav 88, Jakarta Timur 13210, Indonesia.
22. Faculty of Pharmacy, Van Lang University, 69/68 Dang Thuy Tram Street, Binh Loi Trung Ward, Ho Chi Minh City, 70000, Vietnam.
23. Division of General Surgery, Department of Surgery, Tri-Service General Hospital, Taipei 114202, Taiwan.
24. Department of Emergency Medicine, Kaohsiung Medical University Hospital, Kaohsiung Medical University, Kaohsiung 80708, Taiwan.
25. Graduate Institute of Clinical Medicine, College of Medicine, Kaohsiung Medical University, Kaohsiung 80708, Taiwan.
26. Department of Neurosurgery, Ditmanson Medical Foundation Chiayi Christian Hospital, Chiayi 60002, Taiwan.
27. Clinical Research Center, Ditmanson Medical Foundation Chiayi Christian Hospital, Chiayi City 60002, Taiwan.
28. School of Medicine, National Defense Medical University, Taipei 11490, Taiwan.
29. Center for Regenerative Medicine, University of South Florida Health Heart Institute, Tampa, Florida 33602, USA.
30. Division of Cardiology, Department of Internal Medicine, Morsani School of Medicine, University of South Florida, Tampa, Florida 33602, USA.
† Equal contribution.
Received 2025-8-19; Accepted 2025-11-27; Published 2026-1-1
Abstract

Exostosin glycosyltransferase 1 (EXT1) and exostosin glycosyltransferase 2 (EXT2) catalyze heparan sulfate chain elongation and are increasingly implicated in cancer biology, but their roles in gliomas remain incompletely defined. Here, we performed an integrative multi-omics analysis to dissect the transcriptional, epigenetic, and microenvironmental landscape of EXT1 and EXT2 across gliomas. Bulk transcriptomic data from The Cancer Genome Atlas (TCGA) and the Chinese Glioma Genome Atlas (CGGA) revealed that both EXT1 and EXT2 are upregulated in high-grade gliomas and associate with adverse survival, with EXT1 showing the strongest and most consistent prognostic impact. Gene set enrichment analysis (GSEA) and gene set variation analysis (GSVA) indicated that EXT1-high tumors are enriched for DNA damage and replication stress programs, cell cycle progression, inflammatory response, and stromal activation pathways, whereas EXT2 expression is preferentially linked to extracellular matrix remodeling, cytoskeletal organization and angiogenesis-related signaling. Single-cell RNA sequencing and Immune deconvolution using Cell-type Identification By Estimating Relative Subsets Of RNA Transcripts (CIBERSORT) and Estimation of STromal and Immune cells in MAlignant Tumor tissues using Expression data (ESTIMATE) showed that EXT1 correlates with increased stromal and immune scores, and reduced cytotoxic T cell signatures, consistent with an immunosuppressive tumor microenvironment. EXT2 expression is enriched in gliomas with pronounced vascular and mesenchymal features, supporting a complementary role in invasive growth and tissue remodeling. Immunohistochemistry on a glioma tissue microarray validated the upregulation of EXT1 protein in high-grade tumors. The study findings identified EXT1 as a central glycosylation-linked regulator of replication stress tolerance and immune remodeling in gliomas, and suggest that EXT2 contributes to extracellular matrix and cytoskeletal reprogramming. The exostosin axis represents a promising source of prognostic biomarkers and potential therapeutic targets in glioma.
Keywords: Glycosylation, Exostosin Glycosyltransferase 1 (EXT1), Exostosin Glycosyltransferase 2 (EXT2), Glioma, Multi-Omics, Biomarker
1. Introduction
Gliomas are the most prevalent and clinically challenging primary brain tumors in adults, comprising a heterogeneous group of malignancies that range from low-grade gliomas (LGG) to the highly aggressive glioblastoma multiforme (GBM) [1]. Among them, GBM is the most lethal subtype, marked by pronounced intratumoral heterogeneity, rapid progression, and poor responses to standard therapies. Despite advances in neurosurgery, radiotherapy, and temozolomide-based chemotherapy, the median survival of GBM patients remains dismal, rarely exceeding 15 months [2-4]. This persistent therapeutic failure is largely attributed to the molecular and cellular complexity of gliomas, including transcriptional subtypes, therapy-resistant stem-like cell populations, and an immunosuppressive tumor microenvironment (TME).
Recent studies emphasized the role of post-translational modifications such as glycosylation, along with epigenetic reprogramming and cell-type-specific regulatory programs, in shaping gliomas' pathobiology [5]. Among these, glycosylation, a tightly regulated enzymatic process essential for proteoglycan biosynthesis, and extracellular matrix (ECM) remodeling has gained particular attention. The exostosin family of glycosyltransferases, including EXT1 and EXT2 [6, 7], catalyzes the polymerization of heparan sulfate (HS) chains, which in turn modulate cell signaling, growth factor availability, and immune surveillance [8, 9]. While inactivating mutations in EXT1/2 are well-documented in hereditary exostoses [10], their functional roles in cancer [11, 12], and in gliomas specifically, remain poorly defined. Pan-cancer analyses suggested context-dependent oncogenic or tumor-suppressive functions for EXT1 and EXT2, but a systematic investigation of their transcriptional, epigenetic, and functional states in gliomas is lacking [13, 14]. The emerging large-scale analyses have further highlighted the growing importance of glycosylation in glioma biology [15, 16]. A study based on glycosylation-related gene signatures (GRMSs) identified an independent prognostic factor across TCGA, CGGA, and Rembrandt glioma cohorts, demonstrating that aberrant glycosylation strongly influences the tumor grade, immune infiltration, and overall survival (OS) [17-21]. Similarly, large-scale transcriptomic surveys revealed that glycosylation pathway genes are coordinately dysregulated across multiple cancers, positioning glycosyltransferases as central mediators of metabolic and structural adaptation in the TME [22-24]. However, most existing studies have treated glycosylation as a broad transcriptional signature rather than dissecting the functional contributions of individual glycosyltransferases. In particular, the upstream enzymes that initiate HS chain synthesis, such as EXT1 and EXT2, have not been systematically evaluated in gliomas [25, 26].
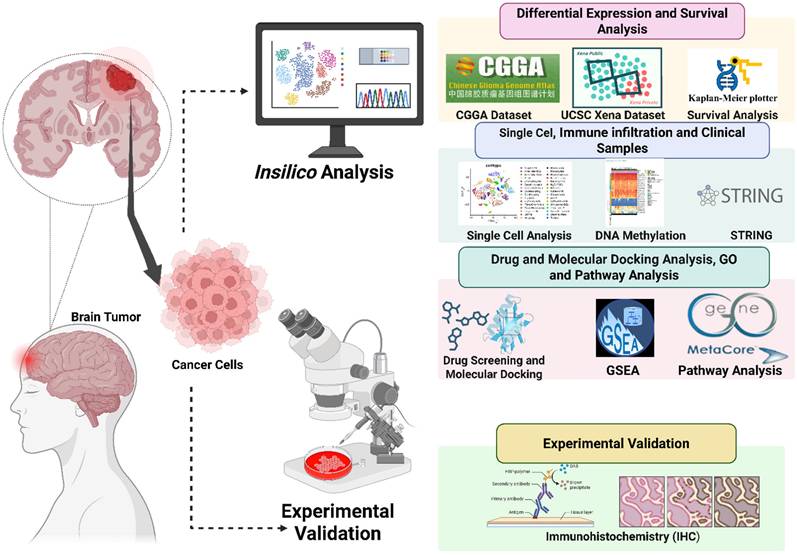
Previous work largely focused on downstream heparinase or sulfatase 2 (SULF2)-mediated extracellular remodeling, leaving a major gap in our understanding of how core HS-polymerizing enzymes regulate tumor cell signaling, spatial heterogeneity, and therapeutic resistance [27]. Moreover, single-cell atlases that capture spatial distributions of glycosylation enzymes in gliomas have not yet been fully integrated with DNA methylation or pharmacogenomic data. By addressing these questions, our study provides one of the first molecular and spatially resolved characterizations of the EXT1/2 axis in gliomas. Beyond elucidating the mechanism, this integrative approach defines a glycosylation-centered landscape that can guide the development of glycosyltransferase-based biomarkers and precision therapeutic strategies for patient stratification in malignant gliomas (Fig. 1).
Schematic workflow of integrated in silico and in vitro analyses of EXT1/EXT2 in gliomas.
2. Materials and Methods
2.1 Data Acquisition, Preprocessing, and Gene Expression Analysis
In this study, multiple publicly available datasets were integrated to comprehensively analyze EXT1 and EXT2 expressions, epigenetic regulation, and pathway associations in human gliomas. Bulk RNA-sequencing (RNA-seq) expression profiles, corresponding clinical annotations, and OS data were obtained from TCGA through the UCSC Xena browser (https://xenabrowser.net/), and from the CGGA database (http://www.cgga.org.cn/) [28, 29]. Normal brain tissue transcriptomic data were retrieved from the GTEx project (https://gtexportal.org/), which provides reference expression profiles from non-diseased tissues. The GEPIA web platform (http://gepia.cancer-pku.cn/) was used for initial pan-cancer comparisons of EXT1 and EXT2 expressions between tumor and normal tissues [30]. GEPIA integrates TCGA and GTEx datasets under a unified processing pipeline, allowing differential expression analyses using normalized transcript per million (TPM) values and log₂(TPM+1) transformation [31-33]. Box plots were generated through GEPIA's visualization interface to assess differential expression across cancer types, including gliomas. Survival analyses were performed using both CGGA and TCGA glioma cohorts to evaluate the prognostic significance of EXT1 and EXT2 expressions. Normalized RNA-seq and clinical survival data were obtained from the CGGA portal, which hosts harmonized CGGA datasets [29]. In addition, the GlioVis portal (https://gliovis.bioinfo.cnio.es/) was used as an independent validation interface to visualize expression and survival relationships of EXT1 and EXT2 across multiple glioma datasets, including TCGA-GBM, TCGA-LGG, and TCGA-GBM/LGG datasets, ensuring consistency across independent cohorts [34]. For both datasets, gene expression values were log2(TPM+1) transformed, and patients were dichotomized into high- and low-expression groups based on median expression levels of EXT1 and EXT2 [35-37]. Kaplan-Meier survival curves were generated using the survival and survminer R packages, and log-rank tests were applied to assess statistical significance. Hazard ratios (HRs) and 95% confidence intervals (CIs) were calculated using univariate Cox proportional hazards models [38-40].
2.2 Protein-Protein Interaction (PPI) Network and DNA Methylation Analysis
To explore functional associations of EXT1- and EXT2-related gene networks, we used the STRING database (https://www.string-db.org/) to construct PPI networks. Genes strongly co-expressed with EXT1 or EXT2 in TCGA glioma datasets were uploaded to STRING, and networks were generated using a confidence score threshold of 0.7 (high confidence). Network visualizations highlighted hub genes based on degree of centrality and functional clustering, providing insights into biological pathways potentially regulated by EXT1 and EXT2 [41]. For the DNA methylation analysis, we used MethSurv (https://biit.cs.ut.ee/methsurv/) to assess the prognostic significance of cytosine-phosphate-guanine (CpG) methylation sites within EXT1 and EXT2 loci. Illumina HumanMethylation450K beta values from TCGA glioma samples were queried, and individual CpG sites were evaluated for their association with OS using univariate Cox proportional hazards models. CpG sites showing strong negative correlations with gene expression were prioritized, consistent with potential transcriptional repression. Heatmaps and survival plots were generated directly from MethSurv, and results were integrated with our expression and network analyses to characterize the epigenetic regulation of EXT1 and EXT2 in gliomas [42].
2.3 Single cell RNA-sequencing (scRNA-seq)
The scRNA-seq datasets of human gliomas (GSE182109) were obtained from the Gene Expression Omnibus (GEO), which together provide comprehensive coverage of glioblastoma and lower-grade glioma specimens with annotated cellular identities. Expression matrices and accompanying metadata were downloaded as provided by the original studies. All analyses were performed in R (v4.2.2) using the Seurat package (v4.3.0). Cells were filtered to remove low-quality profiles, retaining those with 200-7000 detected genes and <10% mitochondrial gene content. Data normalization was conducted using Seurat's NormalizeData function with a scale factor of 10,000, followed by log-transformation (log1p) and scaling with ScaleData to standardize expression across genes [43-45]. The top 2000 variable genes were selected using the “vst” method implemented in FindVariableFeatures. To minimize technical variability between datasets and enable direct comparisons, we applied Seurat's integration workflow (FindIntegrationAnchors and IntegrateData) using canonical correlation analysis (CCA). Integration was performed using the top 30 principal components (dims = 1:30) to align shared biological features while reducing dataset-specific noise. Dimensionality reduction and visualization were conducted using Uniform Manifold Approximation and Projection (UMAP), and clusters were annotated based on canonical lineage markers to identify glioma cells, oligodendrocyte precursor (OPC)-like cells, astrocytic-like cells, mesenchymal-like cells, myeloid cells (microglia/macrophages), T and B lymphocytes, endothelial cells, and pericytes. These annotations were cross-validated with the original metadata to ensure consistent labeling across cohorts [46, 47]. Expression patterns of EXT1 and EXT2 were visualized using Seurat's FeaturePlot, VlnPlot, and DotPlot functions across cell-type clusters. All visualizations were generated using standardized color scales and log-normalized expression values to ensure comparability between datasets [48, 49].
2.4. Comprehensive Gene Set Enrichment (GSEA) and Pathway Analyses
To investigate the functional pathways linked to EXT1 and EXT2 expressions in gliomas, we performed a GSEA using the clusterProfiler package in R (v4.2.2). Processed RNA-seq expression data for glioma patients were obtained from TCGA-LGG and TCGA-GBM cohorts via the UCSC Xena browser. Samples were divided into EXT1-high/low and EXT2-high/low groups according to their respective median expression levels. An enrichment analysis was conducted against the Molecular Signatures Database (MSigDB v7.5), including Hallmark gene sets. Ranked gene lists were generated based on log2 fold-change (FC) values from a differential expression analysis, and enrichment scores were computed using the preranked method with 1000 permutations. Pathways meeting the thresholds of an FDR q-value of < 0.25 and a nominal p-value of < 0.05 were considered significant [50, 51]. To complement the GSEA results, MetaCore (Clarivate Analytics) was used for functional annotation and signaling pathway mapping [52-54]. For this analysis, the top 10% of EXT1- and EXT2-correlated genes (Spearman |ρ| ≥ 0.6, FDR < 0.001) were identified from TCGA datasets, and pathway enrichment was performed in MetaCore to identify significantly overrepresented biological processes and molecular networks [55-57]. Statistical significance was defined as p < 0.05, and results were visualized using bar plots, enrichment maps, and network diagrams to highlight key pathways associated with EXT1 and EXT2 in gliomas [58-62].
2.5. Drug Sensitivity Analysis and Molecular Docking
Expression-drug sensitivity correlations were evaluated via GSCA using Genomics of Drug Sensitivity in Cancer (GDSC) and Clinical Trials Reporting Program (CTRP) datasets [63, 64]. EXT1/2 expressions were correlated with 50% inhibitory concentration (IC50) values. Docetaxel, bleomycin, and tanespimycin (17-N-allylamino-17-demethoxygeldanamycin (17-AAG)) were selected for modeling. To further validate EXT1/2's roles, molecular docking was conducted to predict interactions with small-molecule inhibitors [65-67]. 17-AAG, bleomycin, and docetaxel were selected based on the GSCA and CTRP analyses and validated using molecular docking methods [26-28]. The SDF structure file of 17-AAG was retrieved from PubChem (https://pubchem.ncbi.nlm.nih.gov/) while SMILES values of bleomycin and docetaxel were converted to PDB using NovoPro (https://www.novoprolabs.com/tools/smiles2pdb). Ligand preprocessing was performed using PyMol and AutoDockTools prior to docking. Protein structures of EXT1/2 were taken from RCSB PDB (https://www.rcsb.org/) using the structure code 7SCJ. Chain A of the structure was used, representing the EXT1/EXT2 complex, and was cleaned using standard preprocessing workflows in PyMol and AutoDockTools. The binding site was determined using uridine-5'-diphosphate (UDP) as the main binding location according to the PDB entry. Docking was then performed using Vina with an energy range of 4 and an exhaustiveness setting of 8. Three-dimensional and two-dimensional visualizations of the docked complexes were generated using PyMol and LigPlot+ [68, 69].
2.6. Clinical Tissue Microarray (TMA) and Immunohistochemistry (IHC)
Formalin-fixed paraffin-embedded (FFPE) samples from gliomas patients (n = 52) were collected from Kaohsiung Armed Forces General Hospital with Institutional Review Board (IRB) approval (KAFGHIRB 113-050), comprising World Health Organization (WHO) grade II (n = 20), III (n = 16), IV (n = 16) gliomas, and five adjacent normal brain tissues. Representative tumor cores (1.5 mm) were arrayed into TMAs by Hao-Long Biotechnology-Ltd., Kaohsiung City, Taiwan. Sections (4 μm) were deparaffinized and rehydrated, followed by citrate buffer-based antigen retrieval. EXT1 staining was performed using anti-EXT1 (HPA044394, 1:200, Merck) and horseradish peroxidase (HRP)-based DAB detection (Vector Labs), with hematoxylin counterstaining. Slides were scanned (Leica AT2), and EXT1 intensity was quantified using QuPath v0.3.2 based on the H-score formula = ∑(i × Pi), where i = staining intensity (0-3) and Pi = percentage of cells. Interobserver agreement was high (κ > 0.90). Statistical analyses were performed using one-way analysis of variance (ANOVA) followed by Tukey's post-hoc test [70-72].
2.7 Statistical Analysis
The statistical analyses were performed using R (v4.1.0). Kaplan-Meier survival curves were plotted, and the log-rank test was used for survival comparisons. Cox regression analysis evaluated HRs for EXT1/2 expression levels in relation to LGG patient survival. Spearman's correlation was used to examine the relationship between EXT1/2 expressions and DNA methylation. A p-value < 0.05 was considered statistically significant.
3. Results
3.1 EXT1/2 Are Differentially Expressed Across Cancers and Prioritized in Gliomas
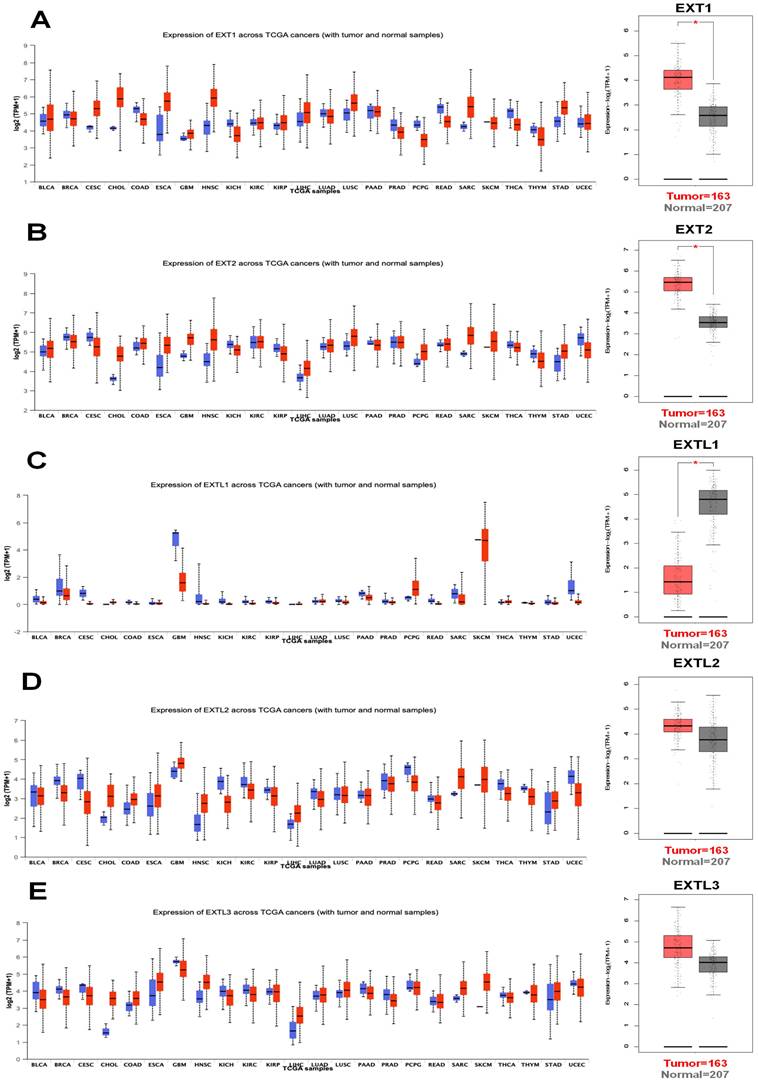
To identify glycosyltransferases relevant to gliomas, we conducted a pan-cancer analysis of EXT family genes (EXT1, EXT2, and EXTL1-3) using harmonized TCGA and GTEx transcriptomic datasets. Among the 33 tumor types analyzed, EXT1 and EXT2 were significantly upregulated in all primary glioma samples relative to normal brain samples (Fig. 2A, B), a pattern similarly observed in several other tumor types. Conversely, EXTL1, EXTL2, and EXTL3 showed inconsistent and context-specific expression patterns across cancers (Fig. 2C-E). Given their consistent dysregulation and biological relevance, EXT1 and EXT2 were selected as the principal isoforms for downstream multi-omics analyses in gliomas. To further confirm their glioma-specific transcriptional upregulation, we performed a differential expression analysis between glioma and normal brain samples from the TCGA cohort (Supplementary Fig. S1A). Both EXT1 and EXT2 appeared among the significantly upregulated genes (log2fold change (FC) > 1.5, adjusted p < 0.001), underscoring their potential oncogenic activation.
Pan-cancer expression profiles of EXT family genes with emphasis on gliomas. Boxplots display mRNA expression levels of (A) EXT1, (B) EXT2, (C) EXTL1, (D) EXTL2, and (E) EXTL3 across 33 tumor types, including low-grade gliomas (LGG), using transcriptomic data from TCGA and GTEx. Expression values are presented as log₂(TPM + 1). Tumor and matched normal tissues are respectively shown in red and blue boxes. Numbers of tumor (T) and normal (N) samples for each cancer type are indicated below each plot. Statistical comparisons were performed using Student's t-test; asterisks (*) denote significance at p < 0.05.
3.2 EXT1 and EXT2 Stratify Clinical Subtypes and Predict Survival of Glioma Patients
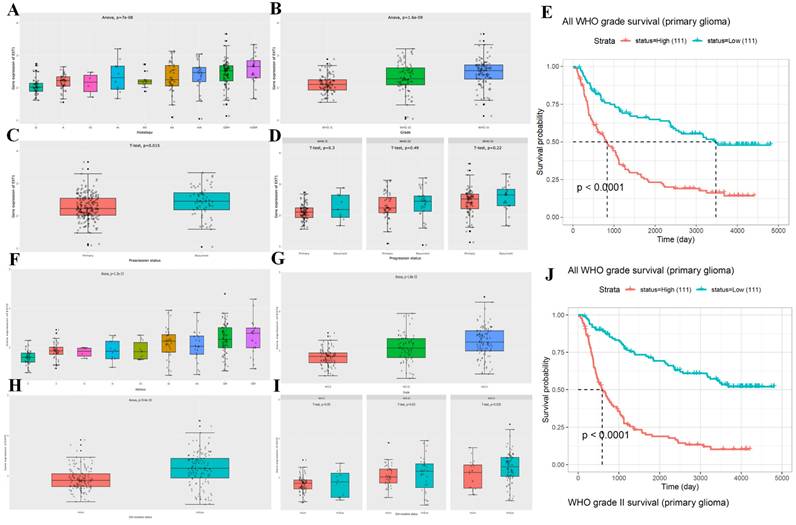
We then analyzed the expression patterns of EXT1 and EXT2 across clinical and molecular subtypes in the CGGA glioma patient cohort. EXT1 expression significantly varied by WHO grade, with higher levels observed in high grade gliomas (Fig. 3A, B). Additionally, EXT1 was modestly upregulated in recurrent compared to primary tumors and showed a positive correlation with tumor progression metrics (Fig. 3C, D). A Kaplan-Meier analysis revealed that patients with high EXT1 expression had markedly shorter OS, with the strongest prognostic discrimination in WHO II/III tumors (Fig. 3E). In contrast, EXT2 displayed a similar but less robust pattern across glioma subtypes (Fig. 3F-I), showing modest elevation in lower grades but no significant difference between primary and recurrent tumors. Survival analysis indicated that EXT2-high expression was associated with poorer outcomes (Fig. 3J). To further validate these survival trends, we extended the analysis to an independent public dataset (Supplementary Fig. S1B, C). These findings position EXT1 as a stronger and more consistent prognostic biomarker, particularly in lower-grade gliomas, and suggest that EXT1 may aid clinical risk stratification beyond existing molecular classifiers.
Clinical and prognostic correlations of EXT1 and EXT2 expressions in primary glioma patients across WHO grades. Boxplots (A-D, F-I) and Kaplan-Meier survival curves (E, J) illustrate the clinical relevance of EXT1 and EXT2 expression in gliomas. (A) EXT1 expression differs significantly among histological subtypes (ANOVA, p < 7 × 10⁻⁸), with higher levels in more aggressive phenotypes such as GBM. (B) EXT1 expression increases with advancing WHO grade (II-IV; ANOVA, p < 1.6 × 10⁻⁹). (C) Overall, recurrent gliomas show significantly higher EXT1 expression than primary tumors (t-test, p = 0.015). (D) When stratified by WHO grade II, III, and IV, EXT1 expression does not differ significantly between primary and recurrent tumors (all t-tests p > 0.2), suggesting that the difference in panel C is largely driven by grade composition. (E) High EXT1 expression is associated with significantly worse overall survival in primary glioma across all WHO grades (log-rank p < 0.0001). (F) EXT2 expression varies significantly across histological subtypes (ANOVA, p < 1 × 10⁻¹³), with higher levels in more aggressive glioma phenotypes. (G) EXT2 levels increase with higher WHO grades (ANOVA, p < 1 × 10⁻¹⁵). (H) EXT2 expression is significantly higher in IDH-wildtype than in IDH-mutant gliomas (ANOVA, p < 4 × 10⁻¹⁰). (I) Within WHO grades II, III, and IV, EXT2 expression does not differ significantly between IDH-mutant and IDH-wildtype tumors (all t-tests p > 0.05), indicating that the strong association in panel H is mainly driven by grade distribution. (J) Kaplan-Meier survival analysis shows that high EXT2 expression predicts poorer overall survival specifically in WHO grade II primary gliomas (log-rank p < 0.0001).
3.3. EXT1 and EXT2 Exhibit Distinct Protein Interaction Networks and Epigenetic in Gliomas
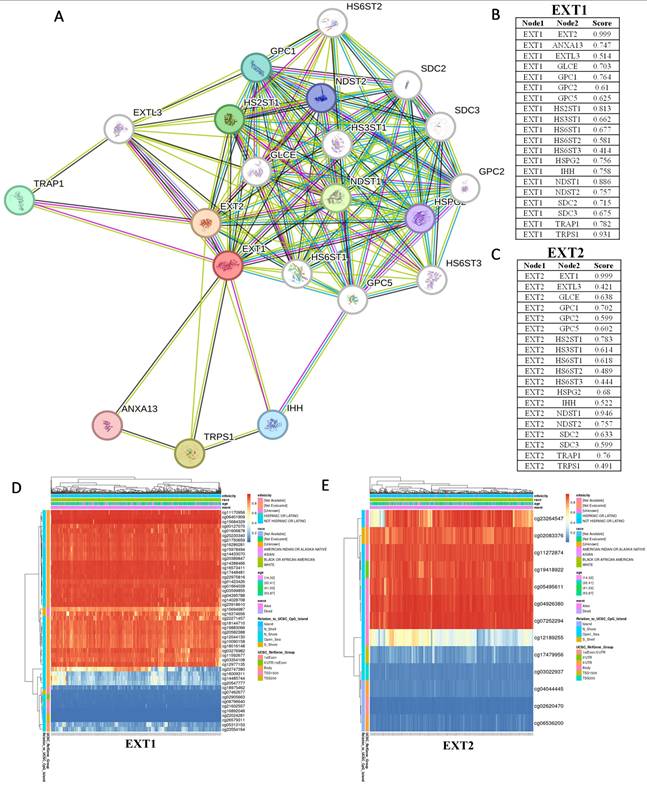
To further elucidate the molecular contexts of EXT1 and EXT2, we constructed PPI networks using STRING based on their top co-expressed genes in gliomas. Both EXT1 and EXT2 were embedded within the HS biosynthetic machinery, clustering tightly with N-deacetylase/N-sulfotransferase 1/2 (NDST1/2), HS 5-O-sulfotransferase 1/2 (HS6ST1/2), D-glucuronyl C5-epimerase (GLCE), and glypican family members, highlighting their conserved roles in HS chain elongation. Beyond this shared enzymatic module, however, the networks revealed distinct interaction biases. EXT1 exhibited strong associations with tumor necrosis factor receptor-associated protein 1 (TRAP1) and other stress-adaptive regulators, suggesting a role in replication stress buffering and checkpoint fidelity, which aligns with our transcriptomic analyses implicating EXT1 in ATR/checkpoint kinase 1 (CHK1) signaling. By contrast, EXT2 preferentially interacted with glypicans and syndecans, reinforcing its involvement in cell adhesion and cytoskeletal remodeling, consistent with its enrichment in mesenchymal-like glioma cells and Ras homology (Rho) guanosine triphosphatase (GTPase)-driven invasive programs. These findings support the idea that EXT1 and EXT2 occupy non-redundant yet complementary hubs within the glioma interactome, contributing both to replication-stress adaptation in stromal compartments and to tumor-intrinsic invasion (Fig. 4A-C). To further investigate upstream mechanisms driving their dysregulation, we next analyzed the DNA methylation landscapes of EXT1 and EXT2 in TCGA gliomas (Fig. 4D, E). Hierarchical clustering of CpG probes revealed recurrent hypomethylated clusters within both genes, particularly at promoter and gene-body regulatory sites.
Protein-protein interaction (PPI) networks and DNA methylation profiles of EXT1 and EXT2 in gliomas. (A-C) STRING-based PPI networks highlight interaction partners of EXT1 (red node) and EXT2 (orange node). The line thickness corresponds to interaction confidence scores. Right panels show ranked confidence values for top EXT1- and EXT2-interacting proteins. (D, E) Heatmap visualization of DNA methylation profiles for EXT1 and EXT2 loci across TCGA glioma patients. Unsupervised clustering identified hypomethylated CpG clusters (blue) as being strongly correlated with increased EXT1/2 expressions (red), supporting epigenetic de-repression as a mechanism. Clinical covariates (WHO grade, IDH status, and 1p/19q codeletion) are annotated above each heatmap.
3.4. Single-Cell Transcriptomic Profiling Reveals Compartmentalized Expressions of EXT1 and EXT2 in Gliomas
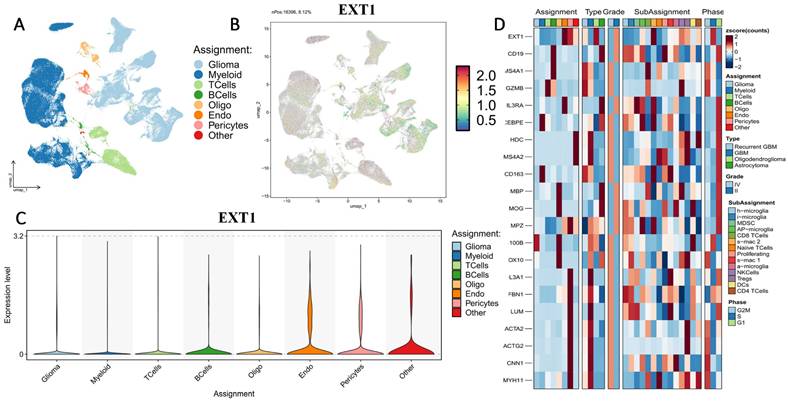
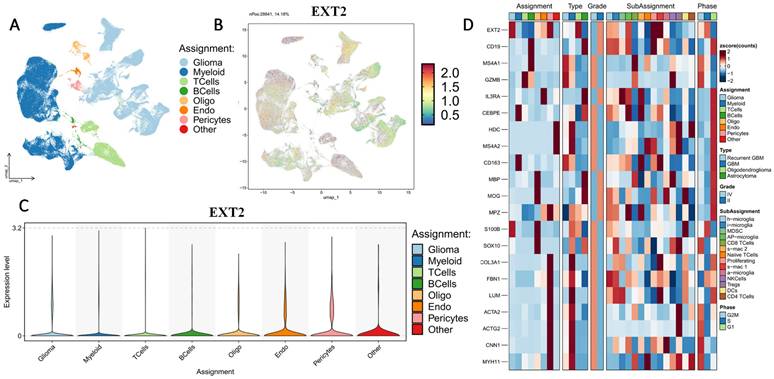
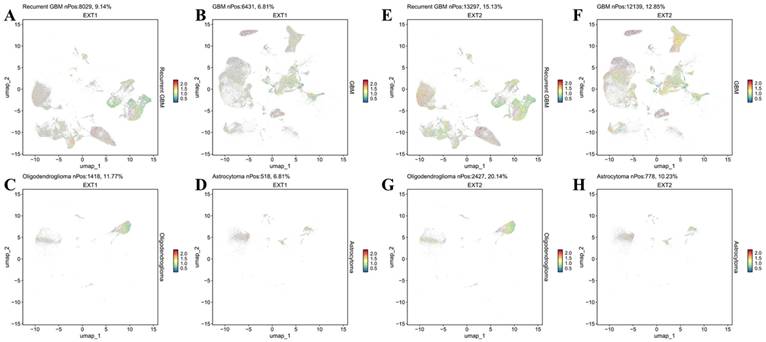
First, we examined the cell-type-specific distribution of EXT1. The UMAP projection revealed that EXT1 expression was highly concentrated in endothelial and pericyte populations, with moderate expression observed in OPC-like glia (Fig. 5). In Supplementary Figure S2, EXT1 expression was predominantly confined to vascular-stromal compartments, with detectable transcripts in 10,975 glioma cells (13.4%), 3473 myeloid cells (3.8%), and markedly higher proportions of endothelial (28.9%) and pericyte (27.2%) clusters. Expression in lymphoid subsets, including T and B cells, remained negligible (<8 %). This distribution pattern suggests that EXT1 aligns with endothelial cells (forming blood vessels) and stromal cells (supporting connective tissue), indicating a role in maintaining ECM integrity and microvascular structure. Because EXT1 encodes a key HS polymerase, its enrichment in vascular territories supports the hypothesis that it contributes to angiogenesis and endothelial-tumor communication. Moreover, these perivascular territories are known to buffer replication stress and foster immune exclusion. The co-expression of EXT1 with stromal markers such as ACTA2, lumican (LUM), and COL3A1 suggests that it may promote myofibroblast-like states, reinforcing basement membrane deposition and limiting cytotoxic immune infiltration. Figure 5 thus aligns well with our earlier findings that EXT1 participates in replication-stress adaptation and stromal niche conditioning, highlighting its supportive role in the TME. Next, we analyzed expression patterns of EXT2 across single-cell clusters (Fig. 6). In contrast to EXT1, EXT2 was predominantly expressed in malignant glioma cell populations, particularly those enriched in mesenchymal and contractile gene signatures. EXT2-high clusters co-expressed COL3A1, FBN1, ACTA2, CNN1, and MYH11, indicating activation of cytoskeletal and motility-related pathways. These features are consistent with a mesenchymal-like glioma phenotype, in which cytoskeletal-remodeling and focal-adhesion signaling enable enhanced traction generation and cell migration. The presence of EXT2 in these aggressive cell states implies a role in mechanical adaptability and resistance to mitotic or DNA-damaging stress, which aligns with our pharmacogenomic results showing reduced drug sensitivity in EXT2-high tumors. Supplementary Figure S3 extends these observations by comparing EXT1 and EXT2 expressions across histologic subtypes, genomic states, and tumor grades. Both genes were markedly upregulated in recurrent and high-grade gliomas (WHO III and IV), confirming their progressive activation during malignant transformation. EXT1 and EXT2 were particularly enriched in recurrent GBM and oligodendrogliomas, consistent with EXT1's vascular-stromal localization and EXT2's mesenchymal distribution (Fig. 7).
Single-cell transcriptomic profiling of EXT1 in gliomas. (A) UMAP plot showing major cell-type clusters, including gliomas, myeloid cells, T cells, B cells, oligodendrocytes (Oligo), endothelial cells (Endo), pericytes, and others. (B) UMAP feature plot showing the expression distribution of EXT1 across all cells. (C) Violin plot of EXT1 expression levels in each cell type. (D) Heatmap showing scaled expression (z-score) of EXT1 and representative marker genes across different cell-type assignments, tumor types, WHO grades, immune subpopulations, and cell cycle phases.
Single-cell transcriptomic profiling of EXT2 in gliomas. (A) UMAP plot showing major cell-type clusters, including glioma, myeloid cells, T cells, B cells, oligodendrocytes (Oligo), endothelial cells (Endo), pericytes, and others. (B) UMAP feature plot showing the expression distribution of EXT2 across all cells. (C) Violin plot of EXT2 expression levels in each cell type. (D) Heatmap showing scaled expression (z-score) of EXT2 and representative marker genes across different cell-type assignments, tumor types, WHO grades, immune subpopulations, and the cell cycle.
Histology-specific single-cell expression patterns of EXT1 and EXT2 in GBM. (A-D) UMAP feature plots showing normalized EXT1 expression in GBM, oligodendroglioma, and astrocytoma. (E-H) Corresponding UMAP feature plots for EXT2 expression in the same histologic subtypes. Each dot represents an individual cell colored by scaled gene expression (blue = low, red = high). “nPos” indicates the number of cells within that tumor type with expression above the detection threshold, and the percentage (%) denotes their proportion relative to the total number of cells in that histology.
3.5 EXT1 and EXT2 Drive Distinct Oncogenic Programs as Revealed by a GSEA
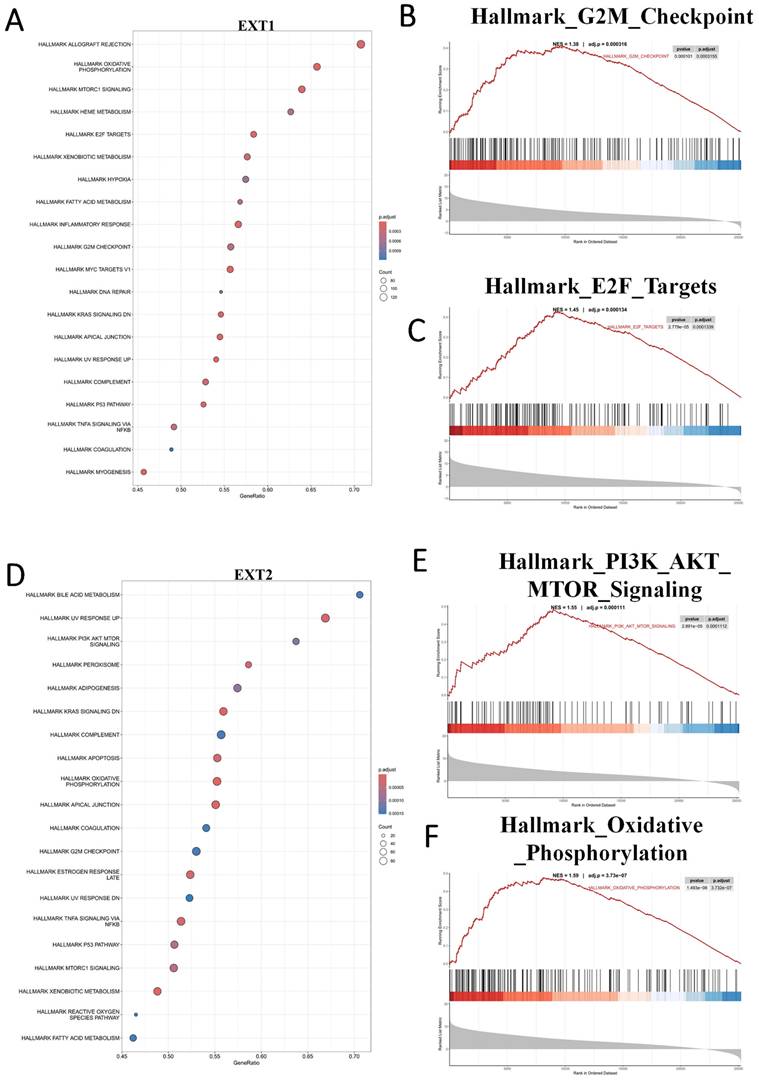
To further characterize the divergent oncogenic roles of EXT1 and EXT2, we performed a GSEA on glioma cohorts stratified by high versus low expression of each gene. EXT1 was significantly enriched in pathways related to DNA repair and replication stress adaptation, including ATR/CHK1 checkpoint signaling, E2F target activation, and G2/M checkpoint control. These findings support our earlier co-expression analyses, reinforcing the role of EXT1 in safeguarding replication fork stability and coordinating DNA repair, particularly within stromal-like tumor niches. Such enrichment is consistent with the observation that EXT1-high gliomas exhibit resistance to genotoxic agents, likely through enhanced tolerance to replication stress (Fig. 8A-C). In contrast, EXT2 showed strong enrichment in cytoskeleton- and motility-related pathways, including EMT, apical junction remodeling, and Rho GTPase-driven actin reorganization. Additional enrichment in complement and inflammatory response pathways further suggests that EXT2 contributes to a pro-invasive and immune-modulatory tumor phenotype (Fig. 8D-F).
Gene set enrichment analysis (GSEA) reveals distinct oncogenic programs associated with EXT1 and EXT2 in gliomas. (A) Dot plot summarizing MSigDB Hallmark gene sets positively enriched in EXT1-high tumors. (B, C) Representative GSEA enrichment plots demonstrating upregulation of the Hallmark G2M checkpoint and Hallmark E2F targets signatures in EXT1-high samples. (D) Dot plot summarizing MSigDB Hallmark gene sets positively enriched in EXT2-high tumors. (E,F) Representative GSEA enrichment plots demonstrating PI3K/AKT/MTOR signaling and the Hallmark oxidative phosphorylation signature in EXT2-high samples.
3.6 EXT1 and EXT2 Co-expression Modules Define Distinct Functional Programs
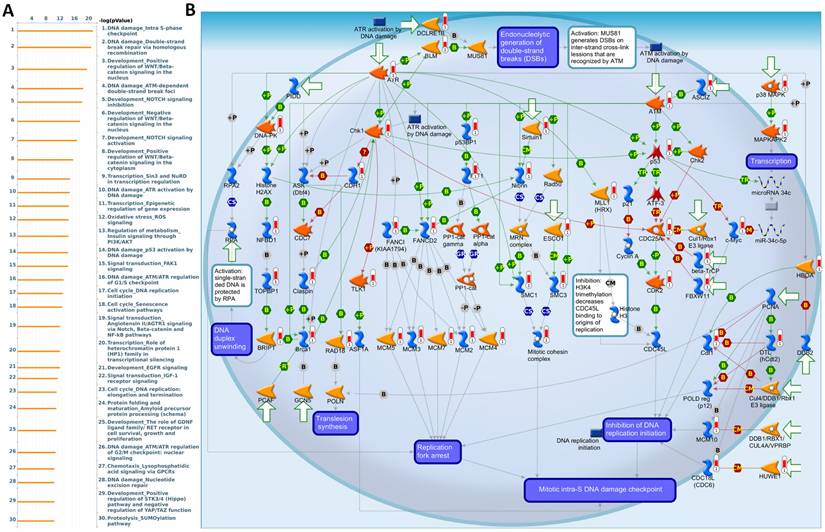
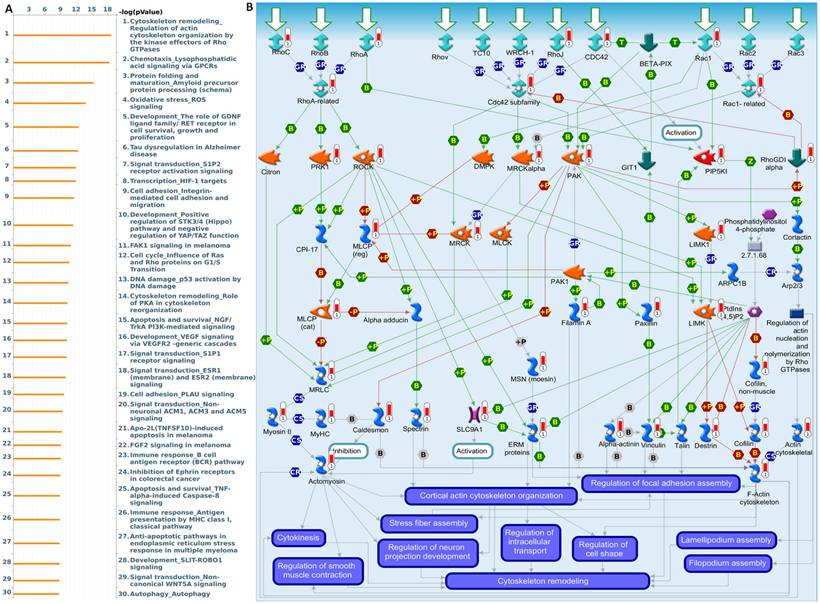
To further validate and investigate the functional divergence between EXT1 and EXT2, we performed genome-wide co-expression analyses using TCGA-Glioma transcriptomic data. Genes exhibiting strong positive correlations with EXT1 or EXT2 (|R| > 0.4, p < 0.001) were independently subjected to pathway enrichment analysis using the MetaCore platform. EXT1-associated co-expression networks were highly enriched for pathways related to DNA replication initiation, replication fork arrest, and checkpoint activation particularly involving the ATR-CHK1 axis (Fig. 9A, B). Notable co-regulated genes included members of the MCM2-7 (mini-chromosome maintenance 2-7) helicase complex, CDC45 (cell division cycle 45), BRIP1 (BRCA1-interacting protein 1), FANCI (Fanconi anemia, complementation group 1), and GINS (GINS complex subunit) components, which collectively form the core DNA replication machinery essential for origin licensing and fork stabilization. MetaCore pathway mapping highlighted EXT1 as part of a broader regulatory module controlling intra-S phase checkpoint activation, homologous recombination repair, and mitotic spindle assembly, suggesting that EXT1 may confer resistance to replication stress through coordination of checkpoint fidelity and damage tolerance. Pathway enrichment terms such as “DNA duplex unwinding”, “Double-strand break repair,” “G2/M checkpoint,” and “Translesion synthesis” further support a role for EXT1 in maintaining genomic integrity under replication perturbation. In contrast, EXT2-associated gene modules were significantly enriched in cytoskeletal remodeling pathways, including Rho GTPase, PAK1 (p21-activated kinase 1), and LIMK1 (LIM domain kinase 1) signaling cascades (Fig. 10A, B). Co-expressed genes such as ROCK1 (Rho-associated coiled-coil kinase 1), RAC1 (Ras-related C3 botulinum toxin substrate 1), ACTN4 (alpha-actinin-4), and ARP2/3 (actin-related protein 2/3) complex members are involved in actin polymerization, lamellipodium extension, and focal adhesion dynamics, hallmarks of invasive and mesenchymal-like glioma phenotypes. Pathway enrichment terms including “Actin cytoskeleton organization”, “Stress fiber assembly”, and “Cell-substrate adhesion” were strongly overrepresented, reinforcing EXT2's role in tumor cell migration, plasticity, and ECM interactions. The detailed MetaCore pathway maps for EXT1-related modules are presented in Supplementary Figures S4, illustrating enriched signaling circuits involved in replication fork stabilization, ATR-CHK1 activation, and mitotic checkpoint control. Pathway maps for EXT2 are shown in Supplementary Figures S5, highlighting networks regulating Rho GTPase-mediated actin remodeling, cell-substrate adhesion, and motility signaling. The specific correlated genes contributing to each pathway, along with corresponding enrichment scores and adjusted p values, are listed in Supplementary Table S1-2, providing a quantitative framework that links individual EXT1/2 interactors to their respective functional modules.
MetaCore pathway enrichment analysis of the EXT1 co-expression genes in gliomas patients from TCGA. (A) Top 30 enriched pathways identified by MetaCore using genes co-expressed with EXT1 ranked by -log₁₀(p value). (B) Representative MetaCore process network map highlighting the “DNA damage - intra S-phase checkpoint” pathway.
MetaCore pathway enrichment analysis of the EXT2 co-expression genes in gliomas patients from TCGA. (A) Top 30 enriched pathways identified by MetaCore using genes co-expressed with EXT2 ranked by -log₁₀(p value). (B) Representative MetaCore process network map highlighting the “Cytoskeleton remodeling - Regulation of actin cytoskeleton by Rho GTPases” pathway.
3.7 Drug Sensitivity and Therapeutic Implications of EXT1/2 Expressions
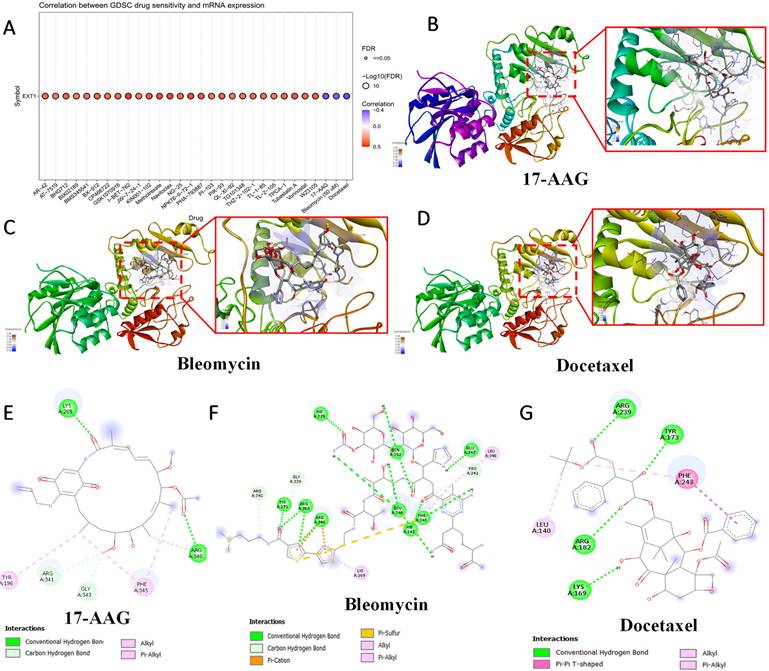
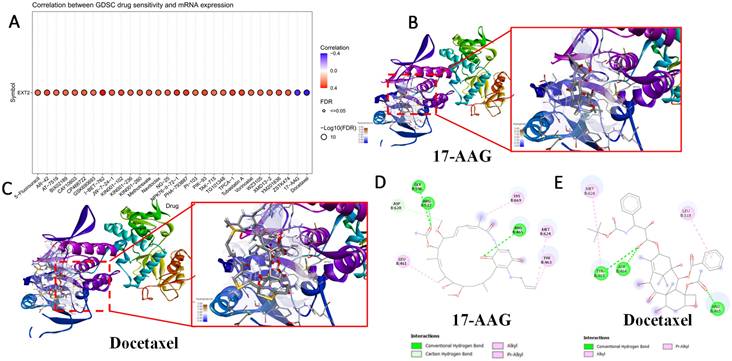
To evaluate the clinical relevance of EXT1 and EXT2 in the context of therapeutic responses, we analyzed drug sensitivity correlations using the Genomics of Drug Sensitivity in Cancer (GDSC) database. Pearson correlation analysis between EXT1/2 expressions and IC50 values across 265 compounds revealed distinct pharmacogenomic profiles for each gene. EXT1 expression was broadly and positively correlated with resistance to several DNA-damaging agents and antimitotic compounds, including bleomycin, etoposide, and docetaxel (Fig. 11). To explore potential drug-target interactions, we performed molecular docking simulations for EXT2 with selected compounds showing strong GDSC correlations (Fig. 12). Docetaxel demonstrated the highest predicted binding affinity to EXT2 (-8.4 kcal/mol), supported by extensive hydrophobic contacts, suggesting a stable, albeit indirect, interaction with EXT2-associated molecular surfaces. 17-AAG and bleomycin exhibited moderate binding (-7.1 and -7.0 kcal/mol, respectively), with bleomycin forming the most significant number of hydrogen bonds but showing the weakest overall affinity, indicating that binding stability is not solely determined by the interaction quantity but by structural complementarity and energy minimization. Importantly, neither EXT1 nor EXT2 expression showed a significant correlation with temozolomide (TMZ) sensitivity, implying that their resistance mechanisms operate independently of the canonical MGMT-mediated alkylator response axis. This observation raises the possibility that EXT1/2 expressions could serve as biomarkers for patient stratification in alternative treatment contexts, especially where resistance to TMZ is observed despite the MGMT methylation status. These pharmacogenomic and structural modeling findings reinforce the distinct therapeutic implications of EXT1 and EXT2. EXT1-high tumors may be vulnerable to synthetic lethality approaches involving checkpoint inhibition (CHK1 or ATR inhibitors), whereas EXT2-driven gliomas might respond to combinatorial regimens targeting cytoskeletal remodeling or focal adhesion dynamics [73-75]. These insights support the potential of EXT1 and EXT2 as predictive biomarkers and targets for rational drug design in gliomas.
Molecular docking analysis of selected compounds with the EXT1 protein. (A) Drug Sensitivity (GDSC) analysis showing correlations between EXT1 mRNA expression and predicted IC₅₀ responses across pharmacologic agents. (B-C) 3D docking poses of 17-AAG, bleomycin, and pentostatin, respectively, showing the binding orientation within the EXT1 active site. The protein secondary structure is color-coded, with magnified insets highlighting ligand placement in the binding pocket. (D) 2D interaction diagrams for 17-AAG (E), bleomycin (F), and docetaxel (G) depicting key molecular interactions, including conventional hydrogen bonds (green), carbon hydrogen bonds (light blue), alkyl and π-alkyl interactions (pink), π-sulfur interactions (yellow), and π-π T-shaped stacking (purple). Residues involved in ligand binding are labeled, with corresponding interaction types indicated in the legend.
Molecular docking analysis of selected compounds with the EXT2 protein. (A) Drug Sensitivity (GDSC) analysis showing correlations between EXT2 mRNA expression and predicted IC₅₀ responses across pharmacologic agents. (B-C) 3D docking poses of 17-AAG, docetaxel, and their overlay, respectively, showing the binding orientation within the active site. The protein secondary structure is color-coded, with magnified insets highlighting ligand placement in the binding pocket. (D, E) 2D interaction diagrams for 17-AAG and docetaxel, depicting key molecular interactions, including conventional hydrogen bonds (green), alkyl interactions (pink), and π-alkyl interactions (purple). Residues involved in ligand binding are labeled, with corresponding interaction types as indicated in the legend.
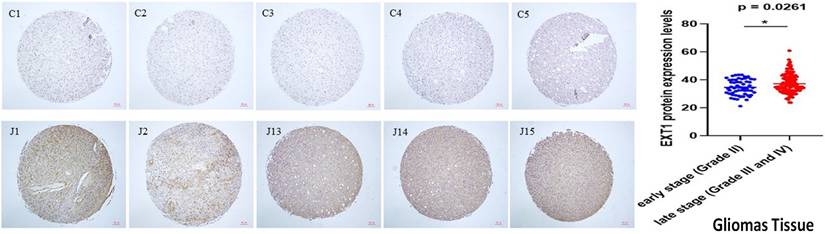
3.8 IHC Validation of EXT1 Expression in Glioma Progression
While both EXT1 and EXT2 were found to be upregulated in gliomas, we prioritized EXT1 for immunohistochemical (IHC) validation due to its stronger transcriptomic association with immune suppression, stromal activation, and clinical outcomes. EXT1 also exhibited more robust staining in pilot assays using validated antibodies. Therefore, we performed an IHC analysis on a TMA containing glioma samples spanning low- to high-grade tumors: WHO grade II (astrocytomas), grade III (anaplastic astrocytomas), and grade IV (glioblastomas). Representative IHC images (Fig. 13) showed minimal EXT1 expression in low-grade gliomas, whereas high-grade tumors exhibited strong cytoplasmic staining, predominantly localized to non-neuronal stromal regions rather than neuronal compartments. A quantitative evaluation confirmed a statistically significant increase in EXT1 protein levels in high-grade tumors compared to low-grade tumors (p = 0.0261). Nonetheless, the complementary roles of EXT2 in ECM remodeling and angiogenesis merit further investigation at the protein level.
IHC staining of the EXT1 protein across gliomas tissue microarrays. Left panel: Representative EXT1 staining in early-stage (WHO grade II; C1-C5) and late-stage (WHO grades III-IV; J1-J5) glioma cores from a tissue microarray. Early-stage tumors show relatively weaker EXT1 immunoreactivity, whereas late-stage tumors display stronger and more diffuse cytoplasmic staining. Right panel: Quantitative comparison of EXT1 protein expression scores between early-stage (blue dots) and late-stage (red dots) gliomas, demonstrating significantly higher EXT1 levels in advanced tumors (p = 0.0261).
4. Discussion
Despite significant advances in molecular and epigenomic profiling, the glycosylation landscape of gliomas remains largely uncharacterized [76]. Most prior studies focused on extracellular HS modifiers such as heparinase or SULF2 [77, 78], which remodel the tumor matrix and influence angiogenesis and invasion [79, 80]. However, the core polymerizing enzymes of the HS biosynthetic pathway, EXT1 and EXT2, have been widely overlooked. By integrating bulk cohorts, single-cell atlases, methylome and network analyses, pharmacogenomics, limited structure-guided modeling, and targeted protein readouts, we delineate a nonredundant dual-axis organization of EXT1 and EXT2. Both enzymes are elevated and associated with inferior survival. Single-cell maps and histology converge on EXT1 enrichment in endothelial, pericytic, and stromal territories and glia, whereas EXT2 concentrates in malignant mesenchymal-like states that co-express contractile and adhesion machinery. This partition provides a substrate for immune exclusion, angiogenic and matrix conditioning on one side, and traction generation and motility on the other, which rationalizes the observed outcome associations.
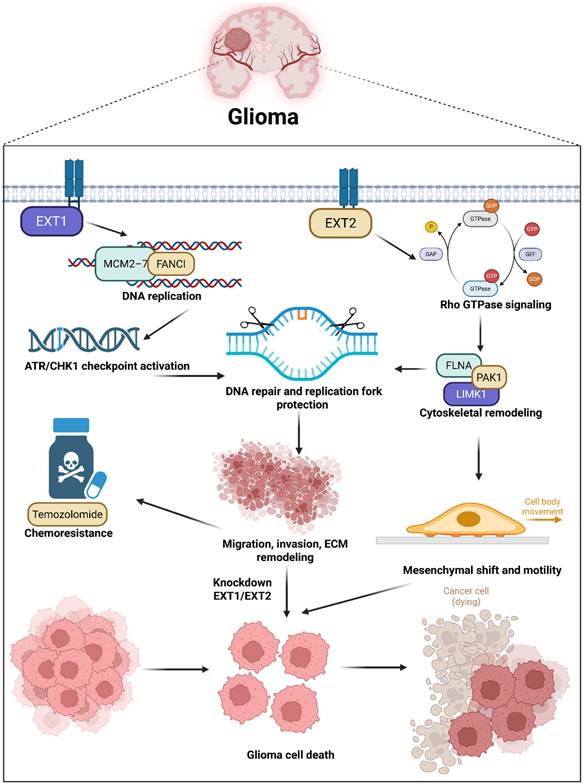
Schematic illustration summarizing the proposed dual-axis model of EXT1's and EXT2's functions in glioma biology. EXT1 and EXT2 exhibit distinct yet complementary oncogenic roles within the glioma ecosystem. These parallel programs orchestrate ECM remodeling, invasion, and tumor progression, with EXT1 sustaining replication-stress adaptations and stromal stability, while EXT2 drives the mesenchymal transition and invasiveness. This figure illustrates how the EXT1-EXT2 glycosylation axis integrates DNA damage tolerance and cytoskeletal dynamics, shaping glioma heterogeneity and therapeutic resistance.
Pathway and network analyses revealed that EXT1 program aligns with E2F and G2M cell-cycle modules, replication-stress tolerance, and checkpoint biology, consistent with dependence on ATR-CHK1 under genotoxic pressure. The EXT2 program aligns with PI3K-AKT-MTOR signaling, focal adhesion, Rho-directed actin remodeling, and oxidative metabolism, consistent with adhesion competence, cytoskeletal plasticity, and invasive fitness. Meanwhile, both enzymes sit within conserved HS biosynthetic machinery, yet interactome neighborhoods and epigenetic features diverge. EXT1 shows promoter and gene-body hypomethylation correlated with transcriptional upregulation in aggressive disease, while EXT2 clusters with glypican and syndecan modules that scaffold adhesion complexes. These observations argue that upstream HS polymerization is not a uniform Golgi-confined process but a context-dependent regulator that biases downstream signaling along stromal and mesenchymal axes. These IHC results thus provide wet-lab validation of our computational model, confirming that EXT1 activation is not merely transcriptional but extends to the protein level within malignant glioma compartments. Our pharmacogenomic analyses provide translational insights into the therapeutic relevance of this model. EXT1-high tumors displayed resistance to DNA-damaging agents such as bleomycin and etoposide and mitotic inhibitors like docetaxel, supporting a replication stress-tolerant phenotype [81-83]. Conversely, EXT2-high tumors exhibited resistance to microtubule-disrupting drugs such as vinblastine and paclitaxel, consistent with cytoskeletal resilience [84]. These patterns not only highlight EXT1 and EXT2 as predictive biomarkers of drug responses but also suggest that targeting replication stress checkpoints (ATR/CHK1 inhibitors) or actin-myosin pathways (ROCK/FAK inhibitors) may selectively sensitize EXT1- or EXT2-driven gliomas, respectively [85]. Such stratification could guide personalized therapy in clinical settings where current genomic markers (IDH and MGMT) offer limited predictive resolution.
The novelty of this study lies in revealing that EXT1 and EXT2, traditionally viewed as redundant HS polymerases, are in fact spatially partitioned regulators of glioma aggressiveness. Through integrated multi-omics and single-cell approaches, we demonstrated that glycosylation interfaces directly with DNA replication, immune modulation, and cytoskeletal dynamic dimensions previously disconnected in glioma biology. The identification of an EXT1 or EXT2 axis glycosylation circuit introduces a new conceptual framework linking ECM synthesis to intracellular oncogenic signaling. Importantly, this study establishes a foundation for glycan-centered therapeutic targeting, positioning the EXT family as a previously unrecognized vulnerability in cancer pathogenesis [86, 87]. Several limitations define the next-phase agenda. Reliance on public cohorts carries batch and composition biases despite cross-cohort validation. Transcriptomes are imperfect surrogates for glycan fine structure, since chain length, sulfation pattern, and site occupancy are post-transcriptionally controlled. Spatial resolution at vascular-stromal interfaces remains limited in available single-cell datasets. Pharmacogenomic and docking signals are correlative and structural in nature, requiring genetic perturbation and rescue experiments for confirmation.
In conclusion, this study integrates bulk cohorts, single-cell topologies, pathway and network models, and immunohistochemistry to provide a coherent biological narrative explaining adverse survival associations and linking glycosylation to immune exclusion, angiogenesis, and invasion. The framework yields tractable axis-specific strategies: in EXT1-dominant contexts, testing combinations that impair fork protection and checkpoint fidelity, such as ATR or CHK1 inhibitors layered on genotoxic backbones; in EXT2-dominant contexts, targeting focal adhesion assembly, Rho-actomyosin effectors, or allied cytoskeletal circuits to blunt invasive fitness. By aligning multi-omic signals with niche topology, the EXT1 or EXT2 axis model offers a rigorous template for glyco-oncology in glioma and a roadmap for prospective validation in organoids, patient-derived xenografts, and early translational research.
Abbreviations
ANOVA: analysis of variance; ATR: ataxia telangiectasia and Rad3-related protein; CGGA: Chinese Gliomas Genome Atlas; CHK1: checkpoint kinase 1; CIBERSORT: Cell-type Identification By Estimating Relative Subsets Of RNA Transcripts; CpG: cytosine-phosphate-guanine; CTLA4: cytotoxic T-lymphocyte-associated protein 4; CTRP: Cancer Therapeutics Response Portal; DNA-seq: DNA sequencing; DSS: disease-specific survival; ECM: extracellular matrix; EXT1: exostosin-1; EXT2: exostosin-2; ESTIMATE: Estimation of STromal and Immune cells in MAlignant Tumors using Expression data; FAK: focal adhesion kinase; FFPE: formalin-fixed paraffin-embedded; FDR: false discovery rate; GBM: glioblastoma multiforme; GDSC: Genomics of Drug Sensitivity in Cancer; GO: gene ontology; GTEx: Genotype-Tissue Expression; H-score: histological score; HR: hazard ratio; HS: heparan sulfate; IHC: immunohistochemistry; IDH: isocitrate dehydrogenase; KEGG: Kyoto Encyclopedia of Genes and Genomes; LASSO: Least Absolute Shrinkage and Selection Operator; LGG: low-grade glioma; MD: molecular dynamics; MM-PBSA: Molecular Mechanics Poisson-Boltzmann Surface Area; OPC: oligodendrocyte precursor cell; OS: overall survival; PCA: principal component analysis; PD-1: programmed cell death protein 1; PD-L1: programmed death-ligand 1; PFI: progression-free interval; RNA-seq: RNA sequencing; Rho: Ras homolog family of GTPases; RMSD: root mean square deviation; SASA: solvent-accessible surface area; TCGA: The Cancer Genome Atlas; TGF-β: transforming growth factor beta; TIGIT: T cell immunoreceptor with Ig and ITIM domains; TIMER: Tumor Immune Estimation Resource; TMA: tissue microarray; TMZ: temozolomide; TPM: transcripts per million; TME: tumor microenvironment; UMAP: Uniform Manifold Approximation and Projection; WHO: World Health Organization.
Supplementary Material
Supplementary figures and table.
Acknowledgements
The authors appreciate the professional English editing by Daniel P. Chamberlin from the Office of Research and Development at Taipei Medical University, Taiwan. The authors acknowledge the online platform for data analysis and visualization (http://www.bioinformatics.com.cn/). We thank the staff of the Office of Data Science, Taipei Medical University, for their technical support. We would like to acknowledge Yi-Ting Wu, Chien-Cheng Chao, Yun-Yu Lin, and Yueh-Yuan Shieh for their excellent technical support at the Laboratory of Research and Medical Education and Research Center, Kaohsiung Armed Forces General Hospital. This research was funded by the National Science and Technology Council (NSTC) of Taiwan (113-2320-B-393-001, 114-2320-B-393 -003, 114-2320-B-393 -004, 114-2314-B-038 -133 -MY3, 114-2811-B-038 -046), by Kaohsiung Armed Forces General Hospital (KAFGH_D_114024 and KAFGH_D_114053), and by the Ditmanson Medical Foundation Chiayi Christian Hospital (R113-064). The APC was funded by Kaohsiung Armed Forces General Hospital. This work was financially supported by the Higher Education Sprout Project of the Ministry of Education (MOE) in Taiwan.
Availability of data and materials
All datasets and materials generated in this study can be provided by the corresponding author upon reasonable request.
Competing Interests
The authors have declared that no competing interest exists.
References
1. Teraiya M, Perreault H, Chen VC. An overview of glioblastoma multiforme and temozolomide resistance: can LC-MS-based proteomics reveal the fundamental mechanism of temozolomide resistance? Frontiers in Oncology. 2023;13:1166207
2. Avci NG, Ebrahimzadeh-Pustchi S, Akay YM, Esquenazi Y, Tandon N, Zhu J-J. et al. NF-κB inhibitor with Temozolomide results in significant apoptosis in glioblastoma via the NF-κB (p65) and actin cytoskeleton regulatory pathways. Scientific reports. 2020;10:13352
3. Azab MA. Expression of Anaplastic Lymphoma Kinase (ALK) in glioma and possible clinical correlations. A retrospective institutional study. Cancer Treatment and Research Communications. 2023;36:100703
4. Singh N, Miner A, Hennis L, Mittal S. Mechanisms of temozolomide resistance in glioblastoma-a comprehensive review. Cancer drug resistance. 2021;4:17
5. Abdelfattah N, Kumar P, Wang C, Leu J-S, Flynn WF, Gao R. et al. Single-cell analysis of human glioma and immune cells identifies S100A4 as an immunotherapy target. Nature communications. 2022;13:767
6. Whitelock JM, Iozzo RV. Heparan sulfate: a complex polymer charged with biological activity. Chemical reviews. 2005;105:2745-64
7. Ohkawa Y, Wade A, Lindberg OR, Chen KY, Tran VM, Brown SJ. et al. Heparan sulfate synthesized by Ext1 regulates receptor tyrosine kinase signaling and promotes resistance to EGFR inhibitors in GBM. Molecular Cancer Research. 2021;19:150-61
8. Wang Y, Huang Y, Zhu H, Guo Z, Cheng J, Zhang C. et al. Exostoisns (EXT1/2) in head and neck cancers: An in silico analysis and clinical correlates. International Dental Journal. 2024;74:446-53
9. Wuyts W, Van Hul W. Molecular basis of multiple exostoses: mutations in the EXT1 and EXT2 genes. Human mutation. 2000;15:220-7
10. Niwa A, Tomita H, Hara A, Tomita H. Tumor Promotion or Suppression: Revisiting the Role of EXT1 and Heparan Sulfate. Histology and histopathology. 18985.
11. Prado MB, Coelho BP, Iglesia RP, Alves RN, Boccacino JM, Fernandes CF. et al. Prion protein regulates invasiveness in glioblastoma stem cells. BMC cancer. 2024;24:1539
12. Chiba R, Akiya M, Hashimura M, Oguri Y, Inukai M, Hara A. et al. ALK signaling cascade confers multiple advantages to glioblastoma cells through neovascularization and cell proliferation. PLoS One. 2017;12:e0183516
13. Melrose J. Hippo cell signaling and HS-proteoglycans regulate tissue form and function, age-dependent maturation, extracellular matrix remodeling, and repair. American Journal of Physiology-Cell Physiology. 2024;326:C810-C28
14. Whitelock J, Melrose J. Heparan sulfate proteoglycans in healthy and diseased systems. Wiley Interdisciplinary Reviews: Systems Biology and Medicine. 2011;3:739-51
15. Häuselmann I, Borsig L. Altered tumor-cell glycosylation promotes metastasis. Frontiers in oncology. 2014;4:28
16. Tang G, Tan L, Yuan H, Yin W. Glycosylation modification patterns reveal distinct tumor metabolism and immune microenvironment landscape in lower-grade gliomas. Frontiers in Cell and Developmental Biology. 2022;10:886989
17. Lin JC, Liu TP, Chen YB, Huang TS, Chen TY, Yang PM. Inhibition of CDK9 exhibits anticancer activity in hepatocellular carcinoma cells via targeting ribonucleotide reductase. Toxicol Appl Pharmacol. 2023;471:116568
18. Lin JC, Liu TP, Chen YB, Yang PM. PF-429242 exhibits anticancer activity in hepatocellular carcinoma cells via FOXO1-dependent autophagic cell death and IGFBP1-dependent anti-survival signaling. Am J Cancer Res. 2023;13:4125-44
19. Hsieh YY, Du JL, Yang PM. Repositioning VU-0365114 as a novel microtubule-destabilizing agent for treating cancer and overcoming drug resistance. Mol Oncol. 2024;18:386-414
20. Hsieh YY, Cheng YW, Wei PL, Yang PM. Repurposing of ingenol mebutate for treating human colorectal cancer by targeting S100 calcium-binding protein A4 (S100A4). Toxicol Appl Pharmacol. 2022;449:116134
21. Ko CC, Yang PM. Hypoxia-induced MIR31HG expression promotes partial EMT and basal-like phenotype in pancreatic ductal adenocarcinoma based on data mining and experimental analyses. J Transl Med. 2025;23:305
22. Chrysinas P, Venkatesan S, Ang I, Ghosh V, Chen C, Neelamegham S. et al. Cell-and tissue-specific glycosylation pathways informed by single-cell Transcriptomics. NAR Genomics and Bioinformatics. 2024;6:lqae169
23. Shen C, Zheng B, Chen Z, Zhang W, Chen X, Xu S. et al. Identification of prognostic models for glycosylation-related subtypes and tumor microenvironment infiltration characteristics in clear cell renal cell cancer. Heliyon. 2024 10
24. Schjoldager KT, Narimatsu Y, Joshi HJ, Clausen H. Global view of human protein glycosylation pathways and functions. Nature reviews Molecular cell biology. 2020;21:729-49
25. Imran T. The Roles of EXT-Like Proteins in Heparan Sulphate Biosynthesis. 2011.
26. Busse M, Feta A, Presto J, Wilén M, Grønning M, Kjellén L. et al. Contribution of EXT1, EXT2, and EXTL3 to heparan sulfate chain elongation. Journal of Biological Chemistry. 2007;282:32802-10
27. Takashima Y, Keino-Masu K, Yashiro H, Hara S, Suzuki T, van Kuppevelt TH. et al. Heparan sulfate 6-O-endosulfatases, Sulf1 and Sulf2, regulate glomerular integrity by modulating growth factor signaling. American Journal of Physiology-Renal Physiology. 2016;310:F395-F408
28. Goldman M, Craft B, Hastie M, Repečka K, McDade F, Kamath A. et al. The UCSC Xena platform for public and private cancer genomics data visualization and interpretation. biorxiv. 2018: 326470.
29. Zhao Z, Zhang K-N, Wang Q, Li G, Zeng F, Zhang Y. et al. Chinese Glioma Genome Atlas (CGGA): a comprehensive resource with functional genomic data from Chinese glioma patients. Genomics, proteomics & bioinformatics. 2021;19:1-12
30. Tang Z, Kang B, Li C, Chen T, Zhang Z. GEPIA2: an enhanced web server for large-scale expression profiling and interactive analysis. Nucleic acids research. 2019;47:W556-W60
31. Lin JC, Liu TP, Yang PM. CDKN2A-Inactivated Pancreatic Ductal Adenocarcinoma Exhibits Therapeutic Sensitivity to Paclitaxel: A Bioinformatics Study. J Clin Med. 2020 9
32. Liu LW, Hsieh YY, Yang PM. Bioinformatics Data Mining Repurposes the JAK2 (Janus Kinase 2) Inhibitor Fedratinib for Treating Pancreatic Ductal Adenocarcinoma by Reversing the KRAS (Kirsten Rat Sarcoma 2 Viral Oncogene Homolog)-Driven Gene Signature. J Pers Med. 2020 10
33. Hsieh YY, Liu TP, Chou CJ, Chen HY, Lee KH, Yang PM. Integration of Bioinformatics Resources Reveals the Therapeutic Benefits of Gemcitabine and Cell Cycle Intervention in SMAD4-Deleted Pancreatic Ductal Adenocarcinoma. Genes (Basel). 2019 10
34. Bowman RL, Wang Q, Carro A, Verhaak RG, Squatrito M. GlioVis data portal for visualization and analysis of brain tumor expression datasets. Neuro-oncology. 2017;19:139-41
35. Chiang YC, Wang CY, Kumar S, Hsieh CB, Chang KF, Ko CC. et al. Metal ion transporter SLC39A14-mediated ferroptosis and glycosylation modulate the tumor immune microenvironment: pan-cancer multi-omics exploration of therapeutic potential. Cancer Cell Int. 2025;25:363
36. Su BH, Kumar S, Cheng LH, Chang WJ, Solomon DD, Ko CC. et al. Multi-omics profiling reveals PLEKHA6 as a modulator of β-catenin signaling and therapeutic vulnerability in lung adenocarcinoma. Am J Cancer Res. 2025;15:3106-27
37. Xuan DTM, Yeh IJ, Liu HL, Su CY, Ko CC, Ta HDK. et al. A comparative analysis of Marburg virus-infected bat and human models from public high-throughput sequencing data. Int J Med Sci. 2025;22:1-16
38. Kumar S, Wu CC, Wulandari FS, Chiao CC, Ko CC, Lin HY. et al. Integration of multi-omics and single-cell transcriptome reveals mitochondrial outer membrane protein-2 (MTX-2) as a prognostic biomarker and characterizes ubiquinone metabolism in lung adenocarcinoma. J Cancer. 2025;16:2401-20
39. Xuan DTM, Wu CC, Wang WJ, Hsu HP, Ta HDK, Anuraga G. et al. Glutamine synthetase regulates the immune microenvironment and cancer development through the inflammatory pathway. Int J Med Sci. 2023;20:35-49
40. Xuan DTM, Yeh IJ, Su CY, Liu HL, Ta HDK, Anuraga G. et al. Prognostic and Immune Infiltration Value of Proteasome Assembly Chaperone (PSMG) Family Genes in Lung Adenocarcinoma. Int J Med Sci. 2023;20:87-101
41. Szklarczyk D, Franceschini A, Wyder S, Forslund K, Heller D, Huerta-Cepas J. et al. STRING v10: protein-protein interaction networks, integrated over the tree of life. Nucleic acids research. 2015;43:D447-D52
42. Modhukur V, Iljasenko T, Metsalu T, Lokk K, Laisk-Podar T, Vilo J. MethSurv: a web tool to perform multivariable survival analysis using DNA methylation data. Epigenomics. 2018;10:277-88
43. Solomon DD, Ko CC, Chen HY, Kumar S, Wulandari FS, Xuan DTM. et al. A machine learning framework using urinary biomarkers for pancreatic ductal adenocarcinoma prediction with post hoc validation via single-cell transcriptomics. Brief Bioinform. 2025 26
44. Li CY, Anuraga G, Chang CP, Weng TY, Hsu HP, Ta HDK. et al. Repurposing nitric oxide donating drugs in cancer therapy through immune modulation. J Exp Clin Cancer Res. 2023;42:22
45. Hagerling C, Gonzalez H, Salari K, Wang CY, Lin C, Robles I. et al. Immune effector monocyte-neutrophil cooperation induced by the primary tumor prevents metastatic progression of breast cancer. Proc Natl Acad Sci U S A. 2019;116:21704-14
46. Wu A-C, Yang W-B, Chang K-Y, Lee J-S, Liou J-P, Su R-Y. et al. HDAC6 involves in regulating the lncRNA-microRNA-mRNA network to promote the proliferation of glioblastoma cells. Journal of Experimental & Clinical Cancer Research. 2022;41:47
47. Li C-Y, Anuraga G, Chang C-P, Weng T-Y, Hsu H-P, Ta HDK. et al. Repurposing nitric oxide donating drugs in cancer therapy through immune modulation. Journal of Experimental & Clinical Cancer Research. 2023;42:22
48. Ye P-H, Li C-Y, Cheng H-Y, Anuraga G, Wang C-Y, Chen F-W. et al. A novel combination therapy of arginine deiminase and an arginase inhibitor targeting arginine metabolism in the tumor and immune microenvironment. American Journal of Cancer Research. 2023;13:1952
49. Kumar S, Wu C-C, Wulandari FS, Chiao C-C, Ko C-C, Lin H-Y. et al. Integration of multi-omics and single-cell transcriptome reveals mitochondrial outer membrane protein-2 (MTX-2) as a prognostic biomarker and characterizes ubiquinone metabolism in lung adenocarcinoma. Journal of Cancer. 2025;16:2401
50. Shi J, Walker MG. Gene set enrichment analysis (GSEA) for interpreting gene expression profiles. Current Bioinformatics. 2007;2:133-7
51. Liberzon A, Subramanian A, Pinchback R, Thorvaldsdóttir H, Tamayo P, Mesirov JP. Molecular signatures database (MSigDB) 3.0. Bioinformatics. 2011;27:1739-40
52. Wang CY, Chao YJ, Chen YL, Wang TW, Phan NN, Hsu HP. et al. Upregulation of peroxisome proliferator-activated receptor-α and the lipid metabolism pathway promotes carcinogenesis of ampullary cancer. Int J Med Sci. 2021;18:256-69
53. Liu HL, Yeh IJ, Phan NN, Wu YH, Yen MC, Hung JH. et al. Gene signatures of SARS-CoV/SARS-CoV-2-infected ferret lungs in short- and long-term models. Infect Genet Evol. 2020;85:104438
54. Wu YH, Yeh IJ, Phan NN, Yen MC, Hung JH, Chiao CC. et al. Gene signatures and potential therapeutic targets of Middle East respiratory syndrome coronavirus (MERS-CoV)-infected human lung adenocarcinoma epithelial cells. J Microbiol Immunol Infect. 2021;54:845-57
55. Tang D, Chen M, Huang X, Zhang G, Zeng L, Zhang G. et al. SRplot: A free online platform for data visualization and graphing. PLoS One. 2023;18:e0294236
56. Wickham H, Sievert C. ggplot2: elegant graphics for data analysis: Springer, New York; 2009
57. Chen PS, Hsu HP, Phan NN, Yen MC, Chen FW, Liu YW. et al. CCDC167 as a potential therapeutic target and regulator of cell cycle-related networks in breast cancer. Aging (Albany NY). 2021;13:4157-81
58. Mwale PF, Hsieh CT, Yen TL, Jan JS, Taliyan R, Yang CH. et al. Chitinase-3-like-1: a multifaceted player in neuroinflammation and degenerative pathologies with therapeutic implications. Mol Neurodegener. 2025;20:7
59. Chen IC, Lin HY, Liu ZY, Cheng WJ, Yeh TY, Yang WB. et al. Repurposing Linezolid in Conjunction with Histone Deacetylase Inhibitor Access in the Realm of Glioblastoma Therapies. J Med Chem. 2025;68:2779-803
60. Shen CJ, Chen HC, Lin CL, Thakur A, Onuku R, Chen IC. et al. Contribution of Prostaglandin E2-Induced Neuronal Excitation to Drug Resistance in Glioblastoma Countered by a Novel Blood-Brain Barrier Crossing Celecoxib Derivative. Adv Sci (Weinh). 2025: e06336.
61. Chen HC, Lin HY, Chiang YH, Yang WB, Wang CH, Yang PY. et al. Progesterone boosts abiraterone-driven target and NK cell therapies against glioblastoma. J Exp Clin Cancer Res. 2024;43:218
62. Liu CC, Yang WB, Chien CH, Wu CL, Chuang JY, Chen PY. et al. CXCR7 activation evokes the anti-PD-L1 antibody against glioblastoma by remodeling CXCL12-mediated immunity. Cell Death Dis. 2024;15:434
63. Liu C-J, Hu F-F, Xie G-Y, Miao Y-R, Li X-W, Zeng Y. et al. GSCA: an integrated platform for gene set cancer analysis at genomic, pharmacogenomic and immunogenomic levels. Briefings in bioinformatics. 2023;24:bbac558
64. Yang W, Soares J, Greninger P, Edelman EJ, Lightfoot H, Forbes S. et al. Genomics of Drug Sensitivity in Cancer (GDSC): a resource for therapeutic biomarker discovery in cancer cells. Nucleic acids research. 2012;41:D955-D61
65. Wu YJ, Chiao CC, Chuang PK, Hsieh CB, Ko CY, Ko CC. et al. Comprehensive analysis of bulk and single-cell RNA sequencing data reveals Schlafen-5 (SLFN5) as a novel prognosis and immunity. Int J Med Sci. 2024;21:2348-64
66. Anuraga G, Lang J, Xuan DTM, Ta HDK, Jiang JZ, Sun Z. et al. Integrated bioinformatics approaches to investigate alterations in transcriptomic profiles of monkeypox infected human cell line model. J Infect Public Health. 2024;17:60-9
67. Wang CY, Xuan DTM, Ye PH, Li CY, Anuraga G, Ta HDK. et al. Synergistic suppressive effects on triple-negative breast cancer by the combination of JTC-801 and sodium oxamate. Am J Cancer Res. 2023;13:4661-77
68. Trott O, Olson AJ. AutoDock Vina: improving the speed and accuracy of docking with a new scoring function, efficient optimization, and multithreading. Journal of computational chemistry. 2010;31:455-61
69. Wallace AC, Laskowski RA, Thornton JM. LIGPLOT: a program to generate schematic diagrams of protein-ligand interactions. Protein engineering, design and selection. 1995;8:127-34
70. Chiao CC, Liu YH, Phan NN, An Ton NT, Ta HDK, Anuraga G. et al. Prognostic and Genomic Analysis of Proteasome 20S Subunit Alpha (PSMA) Family Members in Breast Cancer. Diagnostics (Basel). 2021 11
71. Anuraga G, Wang WJ, Phan NN, An Ton NT, Ta HDK, Berenice Prayugo F. et al. Potential Prognostic Biomarkers of NIMA (Never in Mitosis, Gene A)-Related Kinase (NEK) Family Members in Breast Cancer. J Pers Med. 2021 11
72. Ta HDK, Wang WJ, Phan NN, An Ton NT, Anuraga G, Ku SC. et al. Potential Therapeutic and Prognostic Values of LSM Family Genes in Breast Cancer. Cancers (Basel). 2021 13
73. da Costa A, Chowdhury D, Shapiro GI, D'Andrea AD, Konstantinopoulos PA. Targeting replication stress in cancer therapy. Nat Rev Drug Discov. 2023;22:38-58
74. Dutertre M, Lambert S, Carreira A, Amor-Guéret M, Vagner S. DNA damage: RNA-binding proteins protect from near and far. Trends in biochemical sciences. 2014;39:141-9
75. Ngoi NYL, Pilié PG, McGrail DJ, Zimmermann M, Schlacher K, Yap TA. Targeting ATR in patients with cancer. Nature Reviews Clinical Oncology. 2024;21:278-93
76. Yang Y, Teng H, Zhang Y, Wang F, Tang L, Zhang C. et al. A glycosylation-related gene signature predicts prognosis, immune microenvironment infiltration, and drug sensitivity in glioma. Frontiers in Pharmacology. 2024;14:1259051
77. Marques C. Decoding Heparan Sulfate unique structural epitopes involved in cancer cell signaling: University of Porto; Université Grenoble Alpes; 2024
78. Vicente CM, Lima MA, Nader HB, Toma L. SULF2 overexpression positively regulates tumorigenicity of human prostate cancer cells. J Exp Clin Cancer Res. 2015;34:25
79. Hammond E, Khurana A, Shridhar V, Dredge K. The role of heparanase and sulfatases in the modification of heparan sulfate proteoglycans within the tumor microenvironment and opportunities for novel cancer therapeutics. Frontiers in oncology. 2014;4:195
80. Tran VM, Wade A, McKinney A, Chen K, Lindberg OR, Engler JR. et al. Heparan sulfate glycosaminoglycans in glioblastoma promote tumor invasion. Molecular Cancer Research. 2017;15:1623-33
81. Hossny A, Hassan HA, Fahmy SA, Abdelazim H, Kamel MM, Osman AH. et al. EXT1 as an Independent Prognostic Biomarker in Breast Cancer: Its Correlation with Immune Infiltration and Clinicopathological Parameters. Immuno. 2024;5:1
82. Morse DL, Gray H, Payne CM, Gillies RJ. Docetaxel induces cell death through mitotic catastrophe in human breast cancer cells. Molecular cancer therapeutics. 2005;4:1495-504
83. Liu M, Hales BF, Robaire B. Effects of four chemotherapeutic agents, bleomycin, etoposide, cisplatin, and cyclophosphamide, on DNA damage and telomeres in a mouse spermatogonial cell line. Biology of reproduction. 2014;90:72 1-10
84. Bates D, Eastman A. Microtubule destabilising agents: far more than just antimitotic anticancer drugs. British journal of clinical pharmacology. 2017;83:255-68
85. Nadanaka S, Kagiyama S, Kitagawa H. Roles of EXTL2, a member of the EXT family of tumour suppressors, in liver injury and regeneration processes. Biochemical Journal. 2013;454:133-45
86. Leisico F, Omeiri J, Le Narvor C, Beaudouin J, Hons M, Fenel D. et al. Structure of the human heparan sulfate polymerase complex EXT1-EXT2. Nature Communications. 2022;13:7110
87. Solaimuthu B, Khatib A, Tanna M, Karmi A, Hayashi A, Abu Rmaileh A. et al. The exostosin glycosyltransferase 1/STAT3 axis is a driver of breast cancer aggressiveness. Proc Natl Acad Sci U S A. 2024;121:e2316733121
Author contact
![]() Corresponding authors: Hoi-Bor Chan, 07027org.tw; Yung-Kuo Lee, yungkuoleecom.
Corresponding authors: Hoi-Bor Chan, 07027org.tw; Yung-Kuo Lee, yungkuoleecom.