Impact Factor ISSN: 1837-9664

 Global reach, higher impact
J Cancer 2025; 16(14):4245-4256. doi:10.7150/jca.111126 This issue Cite
Research Paper
Local Genetic Correlations and Pleiotropy Reveal Shared Genetic Architecture Between COVID-19 Phenotypes and Prostate Cancer in European Populations
Rong Xiang1, Xunying Zhao2, Lin Chen2, Xueyao Wu2, Jinyu Xiao2, Xia Jiang1,2,3 ![]()
1. Department of Nutrition and Food Hygiene, West China School of Public Health and West China Fourth Hospital, Sichuan University, Chengdu, China.
2. Department of Epidemiology and Biostatistics and West China-PUMC C. C. Chen Institute of Health, West China School of Public Health and West China Fourth Hospital, Sichuan University, Chengdu, Sichuan, China.
3. Department of Clinical Neuroscience, Center for Molecular Medicine, Karolinska Institutet, Solna, Stockholm, Sweden.
Received 2025-1-26; Accepted 2025-6-10; Published 2025-10-10
Abstract

Background: While a link between coronavirus disease 2019 (COVID-19) and prostate cancer (PrCa) has been observed in clinical settings, the shared underlying genetic influences remain unclear.
Methods: Leveraging summary statistics from the hitherto largest genome-wide association studies (GWASs) of European-ancestry populations, we performed the first comprehensive genome-wide cross-trait analysis to investigate the shared genetic architecture, pleiotropy, and potential causal relationships between three COVID-19 phenotypes and PrCa.
Results: We found no evidence of significant genome-wide genetic correlations between COVID-19 phenotypes and PrCa (P > 0.05). However, after partitioning the whole genome into 2353 independent regions, we observed significant local genetic correlations at chromosome 1 (chr1), chr7, and chr14 for PrCa with at least one COVID-19 phenotype (P < 0.05/2353). Cross-trait meta-analysis identified 22 independent single nucleotide polymorphisms (SNPs) shared between PrCa and at least one COVID-19 phenotype, totalling 25 associations, including 2 with infection, 14 with hospitalization, and 9 with critical illness. Transcriptome-wide association study (TWAS) revealed eight distinct shared genes (CCHCR1, TCF19, ADAM15, HLA-C, CYP21A1P, HCP5, ATF6B, and HLA-DQB2), predominantly enriched in tissues of the respiratory, neurological, and reproductive systems. Bidirectional Mendelian randomization (MR) demonstrated no causal association between COVID-19 phenotypes and PrCa.
Conclusions: Using a multi-layered analytical framework, our study provides novel insights into the shared genetic bases between COVID-19 phenotypes and PrCa, supported by significant local genetic correlations, pleiotropic SNPs, and shared genes. These findings highlight common biological mechanisms rather than direct causal relationships, suggesting the limited benefits of additional PrCa screening in COVID-19 survivors. Furthermore, the identified genes represent promising targets for future mechanistic research and clinical interventions, warranting further validation.
Keywords: COVID-19, prostate cancer, genetic correlation, genome-wide cross-trait analysis, transcriptome-wide association study, Mendelian randomization
Introduction
The male preponderance of coronavirus disease 2019 (COVID-19), caused by acute respiratory syndrome coronavirus 2 (SARS-CoV-2), has been well-documented in terms of both morbidity and mortality [1, 2]. Men appear to be more likely to develop severe clinical outcomes [3], with nearly three times the odds of ICU admission and a 39% higher risk of death compared to women [4], despite roughly equivalent infection rates [5]. In addition to respiratory damage [6], adverse impacts of COVID-19 have also been observed in the male reproductive system, with a particular focus on the testis and spermatogenesis damage [7, 8].
Prostate cancer (PrCa), on the other hand, is the most common cancer of the male reproductive system which also poses a considerable burden on global public health [9]. Epidemiological studies suggest a potential phenotypic link between COVID-19 and PrCa, driven by shared risk factors such as sex, age, and comorbidities. For instance, a population-wide study in Veneto, Italy, found a higher risk of SARS-CoV-2 infection in male cancer patients compared to the male general population [odds ratio (OR) = 1.79, 95% confidence interval (CI) = 1.62-1.98, P < 0.0001] [10]. Moreover, COVID-19 patients with cancer tend to have a higher mortality rate (OR = 2.34; 95% CI = 1.15-4.77; P = 0.03) and more severe outcomes when compared with the noncancer population [11]. Previous evidence also suggests that COVID-19 may predispose recovered patients to the development of PrCa [12, 13]. However, the observational nature of these studies precludes definitive causal conclusions due to potential biases from confounding and reverse causation.
Mendelian randomization (MR) provides a robust framework for causal inference by utilizing genetic variants as instrumental variables (IVs), thereby minimizing the limitations inherent in observational studies. To date, only four MR studies have investigated the causal relationships between COVID-19 phenotypes and PrCa, consistently reporting null associations (all P-values > 0.05) [14-17]. However, these studies exhibit several key limitations: (i) reliance on a single COVID-19 phenotype (i.e., COVID-19 hospitalization) [14] and outdated GWAS datasets (Release 5 vs. our Release 7) [14-16], resulting in an approximately threefold smaller case sample; (ii) use of broad, non-specific outcome definitions (e.g., male genital cancers) with an approximately 12-fold smaller case sample [14]; and (iii) dependence on basic MR approaches [14-16], or limited extensions to genome-wide genetic correlation and colocalization analyses [17], without incorporating a comprehensive cross-trait genetic framework. Beyond causality, shared signaling pathways involving androgen secretion, immunosuppression, and inflammation have been linked to the relationship between COVID-19 and PrCa [1, 18]. Moreover, the TMPRSS2 gene may underlie this relationship [19, 20], implying a common biological connection. Despite advances in statistical genetics and the growing availability of large-scale GWASs of European ancestry, no study has yet systematically investigated the shared genetic architecture underlying COVID-19 phenotypes and PrCa.
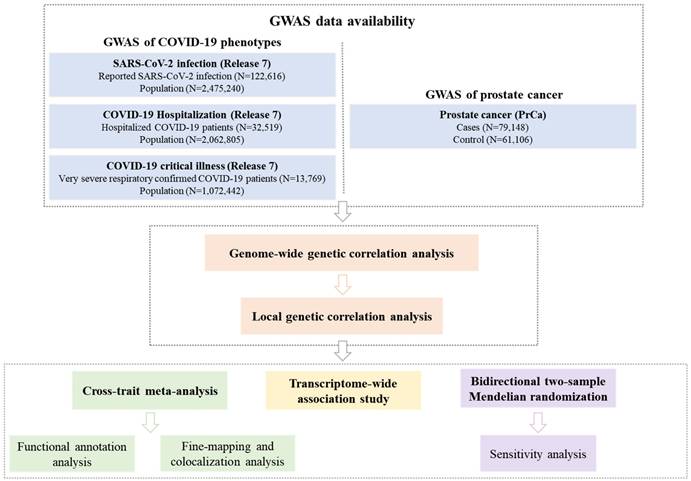
To address this gap, we conducted a comprehensive genome-wide cross-trait analysis to investigate the genetic overlap and potential causal relationship between COVID-19 phenotypes and PrCa. Our analytical framework included: (I) global and local genetic correlation analyses to quantify shared genetic architecture; (II) cross-trait meta-analysis to identify pleiotropic loci; (III) transcriptome-wide association study (TWAS) to pinpoint shared gene-tissue pairs; and (IV) MR to evaluate causal effects. The overall study design is presented in Figure 1.
Overall study design of the current genome-wide cross-trait analysis. Note: Leveraging GWAS summary statistics from the hitherto largest publicly available GWAS and gene expression weights across 49 tissues from the GTEx (version 8) database, we conducted a comprehensive genome-wide cross-trait analysis to explore shared genetic architecture underlying the traits. This analysis utilizes a range of statistical genetic methods, including genetic correlation analysis to identify the shared genetic basis, cross-trait meta-analysis to detect shared loci, TWAS to identify gene-tissue pairs, and MR to infer causality. GWAS: genome-wide association study. GTEx: Genotype-Tissue Expression. TWAS: transcriptome-wide association studies. MR: Mendelian randomization.
Materials and Methods
GWAS data sets
Summary statistics for PrCa and COVID-19 were retrieved from publicly available GWASs, all of European ancestry (details listed in Supplementary Table 1).
The GWAS summary data of PrCa was obtained from a meta-analysis of eight GWASs in the Prostate Cancer Association Group to Investigate Cancer Associated Alterations in the Genome (PRACTICAL) consortium [21], involving 79,148 cases and 61,106 controls. Quality control (QC) excluded samples with call rates < 95%, extreme heterozygosity (> 4.9 standard deviations [SDs]), duplicates, and first-degree relatives. SNPs with call rates < 95%, Hardy-Weinberg Equilibrium (HWE) P-values < 10-7 (controls) or < 10-12 (cases), minor allele frequency (MAF) < 1%, and imputation r² < 0.3 were excluded. The first seven principal components (PCs) and relevant covariates were adjusted to minimize bias.
For COVID-19, the hitherto largest GWAS was conducted by the COVID-19 Host Genetics Initiative (HGI, Release 7) [22] (https://www.covid19hg.org/), with the subjects of 23andMe excluded due to data restrictions. Three phenotypes were selected and further divided into two categories, representing COVID-19 susceptibility and severity. SARS-CoV-2 infection, cases with reported SARS-CoV-2 infection regardless of symptoms (N = 122,616) vs. population (N = 2,475,240), was used to index COVID-19 susceptibility. COVID-19 hospitalization, moderate or severe COVID-19 patients who were hospitalized due to COVID-19 symptoms (N = 32,519) vs. population (N = 2,062,805), and COVID-19 critical illness, severe COVID-19 patients who needed respiratory support or who died due to the disease (N = 13,769) vs. population (N = 1,072,442), were used to index COVID-19 severity. QC excluded samples with call rates < 98%, extreme heterozygosity (> 0.2 SD), and sex inconsistencies. SNPs with call rates < 95% (or < 98% for strict datasets), HWE P-value < 10-6 (controls) or < 10-10 (cases), and missing data differences > 2% were excluded. Confounding factors, including age, sex, PCs, and study-specific covariates were controlled to minimize bias.
Statistical analyses
Genome-wide genetic correlation analysis to quantify global shared genetic basis
To assess the average genetic effects shared between PrCa and COVID-19 phenotypes, we performed a genome-wide genetic correlation analysis using linkage disequilibrium (LD) score regression (LDSC) [23]. LDSC estimates global genetic correlation (rg), ranging from -1 (complete negative correlation) to +1 (complete positive correlation). We utilized pre-computed LD scores from ~1.2 million common and well-imputed SNPs in individuals of European ancestry represented in the Hapmap3 reference panel [24]. Bonferroni correction was applied to account for multiple testing (P < 0.05/3).
Local genetic correlation analysis to quantify local shared genetic basis
Genome-wide genetic correlation analysis evaluates the overall genetic similarity between two traits but may overlook specific genomic regions that contribute discretely to this similarity. Therefore, we further measured the pairwise local genetic correlations between COVID-19 phenotypes and PrCa using SUPERGNOVA [25]. SUPERGNOVA provides a precise quantification of genetic correlation between trait pairs by quantifying genetic variation within 2,353 independent LD blocks, each with an average length of 1.6 centimorgans. Bonferroni correction was applied to account for multiple testing (P < 0.05/2353).
Cross-trait meta-analysis to identify pleiotropic loci affecting both traits
The Cross-phenotype association analysis (CPASSOC) was performed to identify pleiotropic loci affecting both traits [26]. Using GWAS summary statistics of single SNP-trait associations, CPASSOC provides two test statistics, SHom and SHet. SHom, based on the fixed-effect meta-analysis method, is more powerful for homogenous genetic effect sizes, whereas SHet is more powerful for heterogeneous effects, which are common when meta-analyzing distinct traits. Thus, we selected SHet to combine summary statistics for COVID-19 phenotypes with PrCa.
The PLINK (version 1.9) “clumping” function was applied to obtain independent loci with the following parameters: --clump-p1 5e-8 -clump-p2 1e-5 -clump-r2 0.2 -clump-kb 500 [27]. Significant pleiotropic SNPs were defined as index variants satisfying Psingle-trait < 1×10⁻⁴ (in each single trait) and PCPASSOC < 5×10⁻⁸ (in cross-traits). Novel pleiotropic SNPs were defined as shared SNPs that are neither driven by a single trait (5×10⁻⁸ < Psingle-trait < 1×10⁻⁴) nor in LD with index SNPs (r2 < 0.2) identified in the original single-trait GWASs.
The Ensembl Variant Effect Predictor (VEP) [28] was used for detailed functional annotation of the identified pleiotropic SNPs.
Fine-mapping credible set analysis to identify causal variants among index SNPs
The index SNPs may not directly represent causal variants due to complex LD patterns among SNPs [29]. Therefore, we conducted a fine-mapping analysis using FM-summary to identify a 99% credible set of causal variants within 250 kb of each index SNP [30]. FM-summary is a Bayesian fine-mapping algorithm that focuses on the primary signal, sets a flat prior, and produces a posterior inclusion probability (PIP) of a true trait/disease association for each variant using the steepest descent approximation.
Colocalization analysis to determine shared or distinct variants among GWAS signals
To investigate whether the same variants or distinct nearby variants are responsible for two GWAS signals, we performed a colocalization analysis using Coloc [31]. Coloc uses a Bayesian algorithm to generate posterior probabilities for five mutually exclusive hypotheses (H0: no association; H1/H2: association with one trait only; H3: association with both traits via two distinct SNPs; H4: association with both traits via a shared SNP). We extracted summary statistics for variants within 250 kb of the index SNP at each shared locus and calculated the posterior probability for H4 (PPH4). A locus was considered colocalized if PPH4 exceeded 0.5.
Transcriptome-wide association study to identify shared gene-tissue pairs
Genetic variants influence complex traits by regulating gene expression in various tissues, thereby affecting protein abundance. To identify genes with shared expression patterns between COVID-19 and PrCa in specific tissues, we performed a transcriptome-wide association study (TWAS) using FUSION [32]. We integrated GWAS summary data with expression weights across 49 tissues from the Genotype-Tissue Expression (GTEx, version 8) dataset, analyzing one tissue-trait pair at a time. Bonferroni correction was applied to account for multiple testing within each tissue.
Bidirectional two-sample Mendelian randomization analysis to infer causal relationships
To detect a putative causal relationship between COVID-19 phenotypes and PrCa, we performed a bidirectional two-sample MR analysis. For COVID-19, we identified independent IVs by clumping all variants that reached genome-wide significance (P < 5×10⁻⁸) using a strict criterion (r2 ≤ 0.001 within a 1.0Mb window). For PrCa, we collected independent index SNPs previously reported to reach genome-wide significance (P < 5×10⁻⁸) from corresponding GWAS. The F-statistic was calculated to evaluate instrument strength, with a value greater than 10 indicating a strong instrument [33].
We applied the inverse-variance weighted (IVW) approach [34] as our primary approach, assuming all IVs are valid to provide reliable estimates. To further evaluate the robustness of our results and validate MR model assumptions, we performed several important sensitivity analyses, including: (I) the MR-Egger regression [35] to account for directional pleiotropy by incorporating an intercept term; (II) the weighted median approach [36] to improve robustness against invalid IVs (with fewer than half invalid); (III) the MR-Pleiotropy Residual Sum and Outlier (MR-PRESSO) approach [37] to detect and correct horizontal pleiotropy by identifying and removing outlying IVs; (IV) the leave-one-out analysis to detect outliers by removing one IV at a time and performing IVW on the remaining IVs; (V) the IVW method excluding palindromic IVs with strand ambiguity to avoid errors in effect allele identification; (VI) the IVW method excluding pleiotropic IVs associated with potential confounding phenotypes to mitigate the effects of pleiotropy based on the GWAS catalog (https://www.ebi.ac.uk/gwas/). A causal estimate was considered robustly significant if it was significant in IVW and showed consistency in all sensitivity analyses. Additionally, we performed reverse-direction MR to exclude potential reverse causality. Bonferroni correction was applied to account for multiple testing (P < 0.05/3).
Results
Genome-wide genetic correlation
We found no evidence of an overall shared genetic basis between PrCa and any of the COVID-19 phenotypes (infection: rg = -0.06, P = 0.20; hospitalization: rg = -0.04, P = 0.27; critical illness: rg = -0.04, P = 0.20) (Table 1).
Genome-wide genetic correlation between prostate cancer and COVID-19 phenotypes
| Trait 1 | Trait 2 | rg | rg_SE | P-value |
|---|---|---|---|---|
| Prostate cancer | SARS-CoV-2 infection | -0.06 | 0.05 | 0.20 |
| Prostate cancer | COVID-19 hospitalization | -0.04 | 0.04 | 0.27 |
| Prostate cancer | COVID-19 critical illness | -0.04 | 0.03 | 0.20 |
Note: rg: genetic correlation; SE: standard error; Infection: reported SARS-CoV-2 infection vs. population; Hospitalization: hospitalized COVID-19 patients vs. population; Critical illness: very severe respiratory confirmed COVID-19 patients vs. population.
Local genetic correlation
Partitioning the whole genome into 2353 independent LD blocks, we found four specific genomic regions that showed a significant local genetic correlation between PrCa and at least one COVID-19 phenotype (all P-values < 0.05/2353, Figure 2).
Local genetic correlation between prostate cancer and COVID-19 phenotypes. Note: (A-C) Manhattan plot showing the estimates of local genetic covariance between prostate cancer and COVID-19 phenotypes. The corresponding phenotype pairs are annotated at the left of each figure. For each plot, red dots represent loci with significant local genetic correlations after Bonferroni correction for multiple testing (P < 0.05/2353), reflecting true signals rather than random chance findings. (D-F) QQ-plot presenting region-specific P values from the local genetic correlation between prostate cancer and COVID-19 phenotypes. PC: prostate cancer; C2: SARS-CoV-2 infection; B2: COVID-19 hospitalization; A2: COVID-19 critical illness.
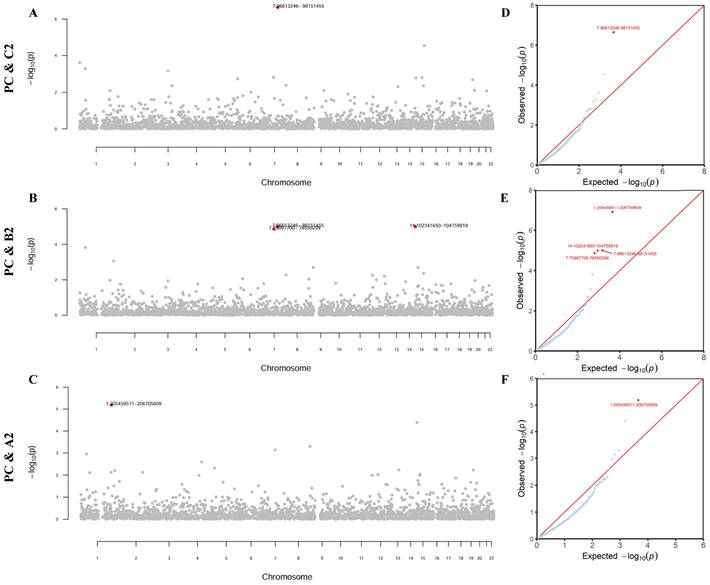
As detailed in Supplementary Table 2, one region (7q21.3-7q22.1) was shared by PrCa and infection rg = -4.79×10⁻⁴, P = 2.30×10⁻⁷). Additionally, four regions (1q32.1, 7q11.23, 7q21.3-7q22.1, and 14q32.31-14q32.33) were shared by PrCa and hospitalization (rg = -4.00×10⁻⁴~3.68×10⁻⁴, P = 1.01×10⁻⁵~1.38×10⁻⁵). Furthermore, one region (1q32.1) was shared by PrCa and critical illness (rg = 5.36×10⁻⁴, P = 6.51×10⁻⁶). Notably, two genomic regions, 7q21.3-7q22.1 and 1q32.1, were identified repeatedly as significant regions.
Cross-trait meta-analysis
To identify individual SNPs affecting both COVID-19 and PrCa, we next conducted a cross-trait meta-analysis. We identified a total of 22 independent pleiotropic SNPs shared between PrCa and at least one COVID-19 phenotype, totaling 25 associations, including 2 for infection, 14 for hospitalization, and 9 for critical illness (all fulfilled Psingle-trait < 1×10⁻⁴ and PCPASSOC < 5×10⁻⁸, Figure 3).
Pleiotropic loci between prostate cancer and COVID-19 phenotypes identified from the cross-trait meta-analysis. Note: (A-C) Circular Manhattan plots displaying pleiotropic loci identified for prostate cancer and COVID-19 phenotypes. The corresponding phenotype pairs are annotated at the top of each figure. For each plot, the outermost numbers represent chromosomes 1-22, and the red dots represent significant pleiotropic SNPs in the cross-trait meta-analysis (PCPASSOC < 5×10⁻⁸ and Psingle-trait < 1×10⁻⁴ in both traits). All 22 identified SNPs are listed in the textboxes with font colors denoting their classification. The fonts marked in red represent novel shared pleiotropic SNPs, and the fonts marked in (light/dark) blue represent shared pleiotropic SNPs for prostate cancer with at least two COVID-19 phenotypes. PC: prostate cancer; C2: SRAS-CoV-2 infection; B2: COVID-19 hospitalization; A2: COVID-19 critical illness; SNP: single nucleotide polymorphism.
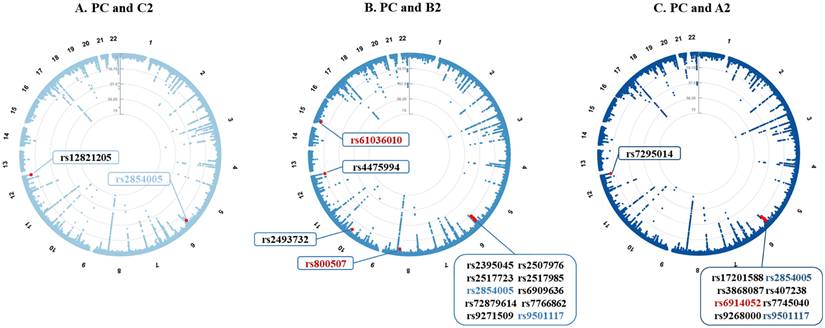
Additional details on the shared pleiotropic SNPs are provided in Supplementary Table 3, with their annotations included in Supplementary Table 4. Among these shared SNPs, the most significant was SNP rs4475994 (PCPASSOC = 4.89×10⁻¹⁸) located at 12q24.33 near FBRSL1. SNP rs9501117 located at 6q27 was found as a shared SNP between PrCa and the two COVID-19 severity phenotypes (hospitalization and critical illness), while SNP rs2854005 (harboring HLA-B) located at 6q27 was found as a shared SNP between PrCa and all three COVID-19 phenotypes.
After excluding SNPs that were in LD (r2 ≥ 0.2) with any of the previously reported single-trait-associated significant SNPs, we identified three novel shared SNPs for PrCa and two COVID-19 severity phenotypes. SNP rs6914052 (PCPASSOC = 4.96×10⁻⁸) located at 6q27 was shared between PrCa and critical illness, while the other two SNPs (rs61036010 and rs800507) were shared between PrCa and hospitalization. SNP rs61036010 (PCPASSOC = 1.05×10⁻⁸) located at 15q11.1-26.3 was near KLF13, while SNP rs800507 (PCPASSOC = 2.34×10⁻⁸) located at 8q24.3 was near TRPS1.
Fine-mapping credible set analysis
For all shared SNPs identified by the cross-trait meta-analysis, we identified a 99% credible set of causal variants. In total, 627 candidate SNPs were identified in the 99% credible set for PrCa and COVID-19 phenotypes, including 32 candidate SNPs for PrCa and infection, 395 candidate SNPs for PrCa and hospitalization, and 200 candidate SNPs for PrCa and critical illness. Lists of credible set SNPs in each shared pleiotropic SNP for PrCa and COVID-19 are shown in Supplementary Table 5.
Colocalization analysis
Colocalization analysis was further performed to determine whether genetic variants driving the association in two traits are the same. As shown in Supplementary Table 6, we found four shared loci to colocalize at the same candidate SNPs (PPH > 0.5), including one shared locus (rs12821205) for PrCa and infection, two shared loci (rs4475994 and rs800507) for PrCa and hospitalization, and one shared locus (rs6914052) for PrCa and critical illness.
Transcriptome-wide association study
We identified multiple TWAS-significant gene-tissue pairs shared between PrCa and COVID-19 phenotypes, suggesting gene-level genetic correlation across traits (Table 2). A total of eight genes were TWAS-significant for PrCa with at least one COVID-19 phenotype, including one for PrCa and infection, seven for PrCa and hospitalization, and five for PrCa and critical illness, mainly enriched in tissues of kidney cortex, adrenal gland, lung, brain, artery, whole blood, testis, uterus, and adipose. Among them, HLA-C, TCF19, and ADAM15 were shared by PrCa and the two COVID-19 severity phenotypes, while CCHCR1 was shared by PrCa and all three COVID-19 phenotypes. Notably, CCHCR1 was also close to the pleiotropic locus (lead SNP: rs2517985) identified by cross-trait meta-analysis.
TWAS-identified shared gene-tissue pairs between COVID-19 and prostate cancer.
| Gene | ID | Tissue Type | CHR | No. SNPs | Prostate cancer | COVID-19 | ||||
|---|---|---|---|---|---|---|---|---|---|---|
| BEST.GWAS.ID | TWAS.Z | PBonferroni | BEST.GWAS.ID | TWAS.Z | PBonferroni | |||||
| Prostate cancer and infection | ||||||||||
| CCHCR1 | ENSG00000204536.13 | Kidney Cortex | 6 | 171 | rs1265087 | -4.19 | 2.75E-05 | rs3130981 | 4.23 | 2.37E-05 |
| Prostate cancer and hospitalization | ||||||||||
| TCF19 | ENSG00000137310.11 | Artery Tibial | 6 | 174 | rs1265087 | -6.44 | 1.16E-10 | rs2844623 | 4.96 | 7.03E-07 |
| TCF19 | ENSG00000137310.11 | Brain Hippocampus | 6 | 172 | rs1265087 | -6.41 | 1.46E-10 | rs2844623 | 5.16 | 2.46E-07 |
| TCF19 | ENSG00000137310.11 | Brain Substantia nigra | 6 | 173 | rs1265087 | -6.95 | 3.70E-12 | rs2844623 | 4.85 | 1.21E-06 |
| TCF19 | ENSG00000137310.11 | Testis | 6 | 174 | rs1265087 | -5.68 | 1.37E-08 | rs2844623 | 4.79 | 1.67E-06 |
| TCF19 | ENSG00000137310.11 | Whole Blood | 6 | 174 | rs1265087 | -4.92 | 8.81E-07 | rs2844623 | 4.87 | 1.12E-06 |
| ADAM15 | ENSG00000143537.13 | Adipose Subcutaneous | 1 | 379 | rs3753639 | 4.72 | 2.34E-06 | rs35154152 | 4.85 | 1.24E-06 |
| CYP21A1P | ENSG00000204338.8 | Brain Putamen basal ganglia | 6 | 197 | rs1144708 | 5.82 | 6.06E-09 | rs2515919 | -4.45 | 8.77E-06 |
| HLA-C | ENSG00000204525.16 | Minor Salivary Gland | 6 | 204 | rs1265087 | -5.48 | 4.17E-08 | rs2844623 | 5.09 | 3.52E-07 |
| HLA-C | ENSG00000204525.16 | Small Intestine Terminal Ileum | 6 | 204 | rs1265087 | -4.80 | 1.55E-06 | rs2844623 | 5.47 | 4.60E-08 |
| CCHCR1 | ENSG00000204536.13 | Adrenal Gland | 6 | 174 | rs1265087 | -5.76 | 8.34E-09 | rs2844623 | 5.82 | 6.00E-09 |
| CCHCR1 | ENSG00000204536.13 | Brain Cortex | 6 | 173 | rs1265087 | -6.60 | 4.18E-11 | rs2844623 | 4.95 | 7.60E-07 |
| CCHCR1 | ENSG00000204536.13 | Brain Putamen basal ganglia | 6 | 174 | rs1265087 | -7.30 | 2.86E-13 | rs2844623 | 4.66 | 3.24E-06 |
| CCHCR1 | ENSG00000204536.13 | Breast Mammary Tissue | 6 | 173 | rs1265087 | -6.50 | 7.86E-11 | rs2844623 | 4.63 | 3.74E-06 |
| CCHCR1 | ENSG00000204536.13 | Colon Sigmoid | 6 | 174 | rs1265087 | -6.57 | 4.99E-11 | rs2844623 | 4.92 | 8.72E-07 |
| CCHCR1 | ENSG00000204536.13 | Esophagus Gastroesophageal Junction | 6 | 174 | rs1265087 | -4.54 | 5.70E-06 | rs2844623 | 5.05 | 4.46E-07 |
| CCHCR1 | ENSG00000204536.13 | Esophagus Muscularis | 6 | 174 | rs1265087 | -4.63 | 3.73E-06 | rs2844623 | 4.62 | 3.87E-06 |
| CCHCR1 | ENSG00000204536.13 | Heart Atrial Appendage | 6 | 172 | rs1265087 | -6.79 | 1.11E-11 | rs2844623 | 5.10 | 3.40E-07 |
| CCHCR1 | ENSG00000204536.13 | Kidney Cortex | 6 | 171 | rs1265087 | -4.19 | 2.75E-05 | rs2844623 | 4.19 | 2.77E-05 |
| CCHCR1 | ENSG00000204536.13 | Liver | 6 | 174 | rs1265087 | -7.06 | 1.64E-12 | rs2844623 | 4.99 | 5.92E-07 |
| CCHCR1 | ENSG00000204536.13 | Lung | 6 | 172 | rs1265087 | -6.38 | 1.76E-10 | rs2844623 | 5.63 | 1.80E-08 |
| CCHCR1 | ENSG00000204536.13 | Minor Salivary Gland | 6 | 174 | rs1265087 | -7.30 | 2.86E-13 | rs2844623 | 4.66 | 3.24E-06 |
| CCHCR1 | ENSG00000204536.13 | Pancreas | 6 | 173 | rs1265087 | -7.30 | 2.86E-13 | rs2844623 | 4.66 | 3.24E-06 |
| CCHCR1 | ENSG00000204536.13 | Pituitary | 6 | 174 | rs1265087 | -7.28 | 3.38E-13 | rs2844623 | 4.67 | 3.02E-06 |
| CCHCR1 | ENSG00000204536.13 | Prostate | 6 | 173 | rs1265087 | -7.30 | 2.86E-13 | rs2844623 | 4.66 | 3.24E-06 |
| CCHCR1 | ENSG00000204536.13 | Spleen | 6 | 175 | rs1265087 | -6.85 | 7.19E-12 | rs2844623 | 4.96 | 6.93E-07 |
| CCHCR1 | ENSG00000204536.13 | Stomach | 6 | 174 | rs1265087 | -7.30 | 2.86E-13 | rs2844623 | 4.66 | 3.24E-06 |
| CCHCR1 | ENSG00000204536.13 | Uterus | 6 | 173 | rs1265087 | -7.30 | 2.86E-13 | rs2844623 | 4.66 | 3.24E-06 |
| CCHCR1 | ENSG00000204536.13 | Vagina | 6 | 173 | rs1265087 | -7.30 | 2.86E-13 | rs2844623 | 4.66 | 3.24E-06 |
| HCP5 | ENSG00000206337.10 | Spleen | 6 | 275 | rs1265087 | 7.30 | 2.86E-13 | rs2844623 | -4.66 | 3.24E-06 |
| ATF6B | ENSG00000213676.10 | Heart Atrial Appendage | 6 | 163 | rs1144708 | 4.51 | 6.56E-06 | rs660895 | -4.70 | 2.64E-06 |
| ATF6B | ENSG00000213676.10 | Skin Sun Exposed Lower leg | 6 | 163 | rs1144708 | 4.63 | 3.63E-06 | rs660895 | -4.63 | 3.57E-06 |
| - | ENSG00000237285.1 | Testis | 6 | 171 | rs3891175 | 5.72 | 1.06E-08 | rs660895 | -4.63 | 3.64E-06 |
| - | ENSG00000272501.1 | Brain Putamen basal ganglia | 6 | 174 | rs1265087 | -4.73 | 2.24E-06 | rs2844623 | 6.47 | 9.55E-11 |
| - | ENSG00000272501.1 | Kidney Cortex | 6 | 171 | rs1265087 | -6.56 | 5.29E-11 | rs2844623 | 4.68 | 2.94E-06 |
| - | ENSG00000280287.1 | Cells EBV-transformed lymphocytes | 12 | 299 | rs11146929 | 4.57 | 4.90E-06 | rs12821205 | -5.11 | 3.15E-07 |
| Prostate cancer and critical illness | ||||||||||
| TCF19 | ENSG00000137310.11 | Artery Tibial | 6 | 174 | rs1265087 | -6.44 | 1.16E-10 | rs3130981 | 4.90 | 9.76E-07 |
| TCF19 | ENSG00000137310.11 | Brain Hippocampus | 6 | 172 | rs1265087 | -6.41 | 1.46E-10 | rs3130981 | 5.06 | 4.27E-07 |
| TCF19 | ENSG00000137310.11 | Whole Blood | 6 | 174 | rs1265087 | -4.92 | 8.81E-07 | rs3130981 | 4.80 | 1.55E-06 |
| ADAM15 | ENSG00000143537.13 | Testis | 1 | 379 | rs3753639 | 5.10 | 3.35E-07 | rs35154152 | 5.09 | 3.63E-07 |
| HLA-C | ENSG00000204525.16 | Minor Salivary Gland | 6 | 204 | rs1265087 | -5.48 | 4.17E-08 | rs3130981 | 5.05 | 4.53E-07 |
| HLA-C | ENSG00000204525.16 | Small Intestine Terminal Ileum | 6 | 204 | rs1265087 | -4.80 | 1.55E-06 | rs3130981 | 4.92 | 8.85E-07 |
| CCHCR1 | ENSG00000204536.13 | Adrenal Gland | 6 | 174 | rs1265087 | -5.76 | 8.34E-09 | rs3130981 | 5.58 | 2.44E-08 |
| CCHCR1 | ENSG00000204536.13 | Breast Mammary Tissue | 6 | 173 | rs1265087 | -6.50 | 7.86E-11 | rs3130981 | 4.52 | 6.17E-06 |
| CCHCR1 | ENSG00000204536.13 | Colon Sigmoid | 6 | 174 | rs1265087 | -6.57 | 4.99E-11 | rs3130981 | 4.98 | 6.24E-07 |
| CCHCR1 | ENSG00000204536.13 | Esophagus Gastroesophageal Junction | 6 | 174 | rs1265087 | -4.54 | 5.70E-06 | rs3130981 | 5.27 | 1.35E-07 |
| CCHCR1 | ENSG00000204536.13 | Esophagus Muscularis | 6 | 174 | rs1265087 | -4.63 | 3.73E-06 | rs3130981 | 5.28 | 1.30E-07 |
| CCHCR1 | ENSG00000204536.13 | Heart Atrial Appendage | 6 | 172 | rs1265087 | -6.79 | 1.11E-11 | rs3130981 | 5.08 | 3.68E-07 |
| CCHCR1 | ENSG00000204536.13 | Heart Left Ventricle | 6 | 174 | rs1265087 | -4.70 | 2.63E-06 | rs3130981 | 4.54 | 5.60E-06 |
| CCHCR1 | ENSG00000204536.13 | Kidney Cortex | 6 | 171 | rs1265087 | -4.19 | 2.75E-05 | rs3130981 | 4.72 | 2.37E-06 |
| CCHCR1 | ENSG00000204536.13 | Liver | 6 | 174 | rs1265087 | -7.06 | 1.64E-12 | rs3130981 | 4.56 | 5.05E-06 |
| CCHCR1 | ENSG00000204536.13 | Lung | 6 | 172 | rs1265087 | -6.38 | 1.76E-10 | rs3130981 | 5.42 | 6.11E-08 |
| CCHCR1 | ENSG00000204536.13 | Spleen | 6 | 175 | rs1265087 | -6.85 | 7.19E-12 | rs3130981 | 4.56 | 5.11E-06 |
| CCHCR1 | ENSG00000204536.13 | Uterus | 6 | 173 | rs1265087 | -7.30 | 2.86E-13 | rs3130981 | 4.29 | 1.78E-05 |
| CCHCR1 | ENSG00000204536.13 | Vagina | 6 | 173 | rs1265087 | -7.30 | 2.86E-13 | rs3130981 | 4.29 | 1.78E-05 |
| HLA-DQB2 | ENSG00000232629.8 | Brain Cortex | 6 | 259 | rs3891175 | 4.71 | 2.51E-06 | rs660895 | -4.49 | 7.21E-06 |
| - | ENSG00000272501.1 | Brain Putamen basal ganglia | 6 | 174 | rs1265087 | -4.73 | 2.24E-06 | rs3130981 | 6.77 | 1.25E-11 |
| - | ENSG00000272501.1 | Kidney Cortex | 6 | 171 | rs1265087 | -6.56 | 5.29E-11 | rs3130981 | 4.85 | 1.23E-06 |
| - | ENSG00000280287.1 | Cells EBV-transformed lymphocytes | 12 | 299 | rs11146929 | 4.57 | 4.90E-06 | rs10870551 | -6.39 | 1.70E-10 |
Infection: reported SARS-CoV-2 infection vs. population; Hospitalization: hospitalized COVID-19 patients vs. population; Critical illness: very severe respiratory confirmed COVID-19 patients vs. population; TWAS: transcriptome-wide association study; ID: identifier; CHR: Chromosome; SNP: single nucleotide polymorphism; No. SNPs: number of SNPs in the locus; GWAS: genome-wide association study; Z: Z value for TWAS.
Bidirectional two-sample Mendelian randomization
We finally conducted a bidirectional two-sample MR analysis to examine the causal association. We identified 16, 38, and 37 SNPs as IVs for SAS-CoV-2 infection, COVID-19 hospitalization, and COVID-19 critical illness, respectively. The F-statistics for these IVs were in the order of 105.06, 73.84, and 77.49, suggesting strong instruments. More details of IVs selected for COVID-19 phenotypes are listed in Supplementary Table 7. As shown in Figure 4 and Supplementary Table 8, no association between genetically predicted COVID-19 and PrCa was identified in IVW (infection: OR = 0.99, 95%CI = 0.91-1.08, P = 0.83; hospitalization: OR = 0.99, 95%CI = 0.93-1.05, P = 0.61; critical illness: OR = 1.01, 95%CI = 0.97-1.05, P = 0.73). Consistent with these findings, we did not observe any changes in the significance of estimates in MR-Egger (infection: P = 0.65; hospitalization: P = 0.20; critical illness: P = 0.22), weighted median (infection: P = 0.75; hospitalization: P = 0.86; critical illness: P = 0.64). Other sensitivity analyses (i.e., MR-PRESSO, IVW excluding palindromic or pleiotropic SNPs, and leave-one-out) yielded similar findings, with specific results presented in Supplementary Tables 8-9. The consistency in significance of estimates between IVW and all sensitivity analyses indicates the robustness of our findings.
Bidirectional causal relationship underlying COVID-19 phenotypes and prostate cancer. Note: (A-C) Estimates of causal effect for genetic liability to COVID-19 phenotypes with prostate cancer. (D) Estimates of causal effect for genetic liability to prostate cancer with COVID-19 phenotypes. Boxes represent the point estimates of causal effects, and error bars represent 95% confidence intervals. IVs: instrumental variables; OR: odds ratio; CI: confidence interval; SNP: single nucleotide polymorphism.
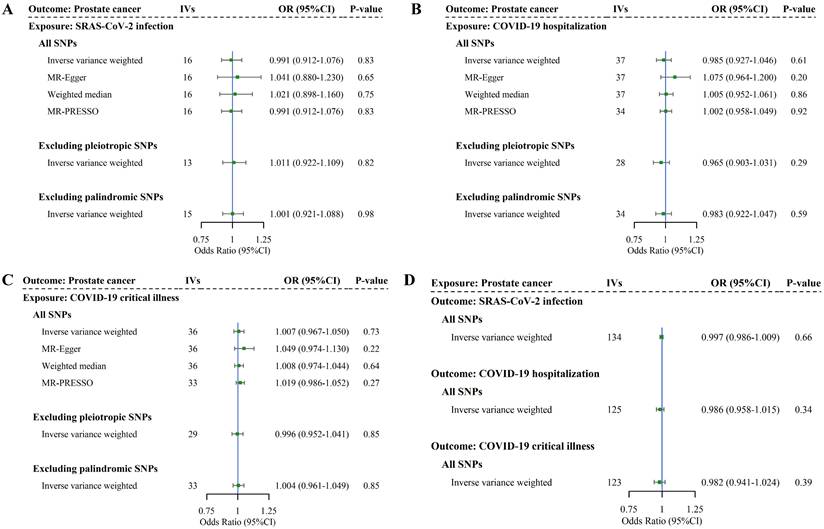
For reverse MR analysis, we identified 139 SNPs as IVs for PrCa, with an F-statistic of 91.18, suggesting strong instruments (more details of IVs selection for PrCa are listed in Supplementary Table 10). As shown in Figure 4 and Supplementary Tables 11-12, genetic predisposition to PrCa did not appear to affect any phenotype of COVID-19 in the reverse-direction MR (infection: OR = 1.00, 95%CI = 0.99-1.01, P = 0.66; hospitalization: OR = 0.99, 95%CI = 0.96-1.02, P = 0.34; critical illness: OR = 0.98, 95%CI = 0.94-1.02, P = 0.39). These results exclude reverse causality.
Discussion
To the best of our knowledge, this is the first large-scale genome-wide cross-trait analysis that systematically investigates the shared genetic basis underlying COVID-19 and PrCa. Although we found no evidence of genome-wide genetic correlations, after partitioning the whole genome, we found local genetic correlations at chr1, chr7, and chr14. By using cross-trait meta-analysis, we identified 22 SNPs shared between COVID-19 and PrCa. TWAS revealed eight shared genes, mostly enriched in tissues of the adrenal gland, lung, brain, and testis. Finally, bidirectional MR identified no causal association between COVID-19 and PrCa. The findings of our study further demonstrated biological links underlying these two complex traits, highlighting shared mechanisms rather than potential causal associations.
In our study, while no overall genetic correlation between COVID-19 and PrCa was found, local genetic correlations were observed after partitioning the whole genome into independent regions, indicating a non-trivial shared biology underlying these two traits at the regional rather than genome-wide level. Specifically, we found four significant shared genomic regions, with two regions at 1q32.1 and 7q21.3-7q22.1 shared between PrCa and two COVID-19 phenotypes. 1q32.1 harbors NFASC [38], a previously reported risk gene for COVID-19, and MDM4 [39], a previously reported risk gene for PrCa. 7q21.3-7q22.1 harbors SGCE [40] and LMTK2 [41] previously reported as risk genes for COVID-19 and PrCa, respectively. Besides, the region at 7q11.23 was previously found to map several risk genes independently associated with COVID-19 [38] and testosterone levels [42], while another region at 14q32.31-q32.33 was previously found to map several risk genes only associated with androgen-related male-pattern baldness [43]. Altogether, these local genetic correlations further validate the notion that the genome-wide genomic approach may fail to detect association signals at the local level. This phenomenon is not uncommon in complex trait studies and may reflect the effects of epigenetic regulation, gene-gene, or gene-environment interactions that are not captured by global analysis. Moreover, the findings suggest a shared genetic basis underlying COVID-19 and PrCa, which is either directly through variants affecting both traits (horizontal pleiotropy) or through the causal effect of one trait on the other (vertical pleiotropy) [44].
In the downstream analyses that were conducted to explore these alternatives, cross-trait meta-analysis identified 22 shared SNPs, indicating horizontal pleiotropy and shared biological mechanisms underlying COVID-19 and PrCa. Among shared genetic variants, SNP rs2854005 was shared between PrCa and all three COVID-19 phenotypes. The loci harbor HLA-B, a gene previously found to be associated with the loss of protective genes and reduced cell-mediated immunity in elderly PrCa patients [45], as well as with the modulation of the clinical severity of COVID-19 [46]. Our results, supported by previous research, indicate that gene HLA-B may serve as a potential target for mechanistic studies or interventions. Additionally, SNP rs800507 was novel and mapped to TRPS1 with strong evidence of colocalization (PPH4 > 0.5), demonstrating etiological connections. TRPS1 was found to be highly expressed in androgen-dependent prostate cancer (LNCaP-FGC) cells compared with androgen-independent prostate cancer (LNCaP-LNO) cells [47]. Chang et al. suggested its expression was associated with the apoptotic process in the rat ventral prostate [48] and was repressed by androgen in LNCaP-FGC cells, while was hardly detectable in LNCaP-LNO cells [49]. In addition, its overexpression in LNCaP-FGC cells also decreased androgen-induced prostate-specific antigen expression [50]. All these studies suggest that TRPS1 is androgen-repressible and involved in apoptosis, thus a crucial regulator in the development of PrCa. However, its role in COVID-19 has not been clarified, making it a potential key gene for future mechanistic studies on COVID-19 sequelae. Notably, androgens can influence the breadth of immune response by altering the activity of specific immune subsets (e.g. myeloid cells, dendritic cells) directly involved in viral clearance [51]. In addition, an androgen-responsive gene (i.e., TMPRSS2) was reported to play an important role in the initiation and progression of PrCa [19], as well as in the entry of human coronaviruses (e.g., SARS-CoV-2) into host cells [20].
Integrating GWAS and GTEx tissue-specific expression data, our TWAS analysis further revealed biological pleiotropy at a gene-tissue pair level. TWAS revealed eight genes shared by PrCa with at least one COVID-19 phenotype, largely enriched in the kidney cortex, adrenal gland, lung, brain, and testis. Among them, CCHCR1 was shared by PrCa with all three COVID-19 phenotypes, highlighting its significance in our study. CCHCR1 is a centrosome and processing body-localized protein regulating various cellular functions, including steroidogenesis that occurs in the adrenal cortex and testis [52]. Steroid exerts a significant effect on the T cell-mediated immune response, especially CD4+ T cells responsible for infectious immunity, making patients more susceptible to opportunistic infections [53]. CCHCR1 was found to be a testis-specific expression [21] and associated with androgen-related alopecia areata [54]. Androgen signaling usually targets the lung to enhance the expression of TMPRSS2 [55]. Although the specific role of CCHCR1 between COVID-19 and PrCa has not been reported, this evidence suggests possible mechanisms involving the combination of immunosuppression and androgens.
In contrast, a two-sample MR analysis was performed to investigate vertical pleiotropy, but no significant association between genetically predicted COVID-19 and PrCa was found, consistent with a previous MR study [16]. The COVID-19 pandemic has affected PrCa screening [56]. Our findings may suggest that transient infection with SARS-CoV-2 is very unlikely to increase the risk of PrCa development, further implying that extra PrCa screening of COVID-19 patients may have a minimal public health benefit. Similarly, reverse MR analysis showed that genetically predicted PrCa did not affect any phenotypes of COVID-19, aligning with results from previous MR studies [15, 16]. This finding may suggest that PrCa does not causally increase the risk of COVID-19, excluding potential reverse causality and indicating that androgen deprivation therapy (ADT), a typical PrCa treatment, may not be beneficial in reducing COVID-19 risk. For instance, one study found PrCa patients receiving ADT were significantly less vulnerable to COVID-19 than those not receiving ADT (OR = 4.05, 95%CI = 1.55-10.59) [10]; however, other studies reported no significant differences [57, 58]. Overall, these negative findings may suggest that COVID-19 has no long-term effect on PrCa; nevertheless, caution is warranted and further validation is needed when larger GWASs become available.
We acknowledge several potential limitations of our study. First, our analyses were restricted to European populations due to limited sample sizes and power in other ethnic groups. For example, standard clumping applied to East Asian GWASs yielded only one or no valid IVs, rendering MR analysis infeasible. While this limits generalizability, it helps reduce population stratification, and future studies in more diverse populations are needed for validation. Second, sex-combined GWAS summary data for COVID-19 phenotypes were used due to the unavailability of sex-specific data, which may introduce sex heterogeneity and potentially distort true genetic associations. Furthermore, the relatively recent emergence of COVID-19 may limit the GWAS summary data in capturing different SARS-CoV-2 variants and the full spectrum of genetic variations. Third, as most of the analytical software adopted in our study does not support the management and analysis of sex chromosomes, only autosomal data were included (except for MR analysis). Fourth, the power of our MR analysis may still be limited by sample size, case proportion, and heritability of IVs, leading to overall negative findings. Future larger GWASs with more powerful IVs are needed to validate our findings. Fifth, while our study identified multiple genes potentially relevant to COVID-19 and PrCa, their functional implications remain speculative. More experimental research is needed to understand the underlying pathophysiological mechanisms. Finally, the lack of individual-level data limits the exploration of gene-environment interactions, which should be an important focus for future research once such data become available. Despite the current limitations, our findings suggest promising avenues for further exploration.
Taken together, our study extends beyond conventional MR by implementing a comprehensive cross-trait analytical framework - including LDSC, SUPERGNOVA, cross-trait meta-analysis, TWAS, and MR - based on the most recent and well-powered GWAS data. We found no evidence supporting a direct causal effect of COVID-19 on PrCa, suggesting limited benefit from additional PrCa screening among COVID-19 survivors. Moreover, we identified several shared genes, such as HLA-B and CCHCR1, previously implicated in either COVID-19 or PrCa, which support the robustness of our findings and point to potential targets for diagnosis and therapy. These findings deepen our understanding of the genetic overlap and causal relationship between COVID-19 and PrCa, providing a foundation for future mechanistic studies. Further validation using large, sex-stratified, and multi-ethnic datasets is warranted.
Conclusions
In conclusion, our study demonstrates shared genetic bases between COVID-19 phenotypes and PrCa, driven by significant local genetic correlations, pleiotropic SNPs, and shared genes. These findings highlight common biological mechanisms rather than direct causal relationships, suggesting the limited benefits of additional PrCa screening for COVID-19 survivors. Furthermore, the identified shared genes may serve as promising candidates for future mechanistic research and clinical interventions. Validation in larger and more diverse datasets is required to confirm these findings.
Supplementary Material
Supplementary tables.
Acknowledgements
We thank all the patients, staff, and investigators who contributed to the COVID-19 Host Genetics Initiative and the Prostate Cancer Association Group to Investigate Cancer Associated Alterations in the Genome (PRACTICAL) consortium.
Funding
This study was supported by the Science Fund for Creative Research Groups of Science and Technology Bureau of Sichuan Province (2024NSFTD0030), the Recruitment Program for Young Professionals of China, the Promotion Plan for Basic Medical Sciences and the Development Plan for Cutting-Edge Disciplines, Sichuan University, and the Experimental Discipline Revitalization Plan of West China School of Public Health and West China Fourth Hospital (2023SY-03). The sponsors of this study had no role in study design, data collection, analysis, interpretation, writing of the report, or the decision for submission.
Ethics approval and consent to participate
The data used in this paper are publicly available and ethically approved, and the subjects have given their informed consent.
Availability of data and materials
This study did not generate new datasets or codes. All data used in our study are publicly available. GWAS summary statistics of the COVID-19 Host Genetics Initiative are accessible at https://www.covid19hg.org/. GWAS summary statistics for prostate cancer can be downloaded from the GWAS catalog (https://www.ebi.ac.uk/gwas/) or the websites of the consortium (http://practical.icr.ac.uk/). More details of the approaches as well as the codes are available at https://github.com/bulik/ldsc (LDSC), https://mrcieu.github.io/TwoSampleMR/ (TwoSampleMR), http://hal.case.edu/~xxz10/zhu-web/ (CPASSOC), https://github.com/hailianghuang/FM-summary (FM-summary), https://chr1swallace.github.io/coloc/ (Coloc), https://www.cog-genomics.org/plink/1.9/ (PLINK), https://grch37.ensembl.org/info/docs/tools/vep/index.html (VEP), http://gusevlab.org/projects/fusion/ (FUSION).
Author contributions
Conception and design: R.X., X.Z., and X.J.; Analysis and interpretation of data: R.X., X.Z., L.C., X.W., J. X., and X.J; R.X. and X.Z. wrote the paper, and all authors provided feedback and contributed to the final format of this manuscript.
Competing Interests
The authors have declared that no competing interest exists.
References
1. Chakravarty D, Nair SS, Hammouda N. et al. Sex differences in SARS-CoV-2 infection rates and the potential link to prostate cancer. Commun Biol. 2020;3:374
2. Jin JM, Bai P, He W. et al. Gender Differences in Patients With COVID-19: Focus on Severity and Mortality. Front Public Health. 2020;8:152
3. Gebhard C, Regitz-Zagrosek V, Neuhauser HK. et al. Impact of sex and gender on COVID-19 outcomes in Europe. Biol Sex Differ. 2020;11:29
4. Peckham H, de Gruijter NM, Raine C. et al. Male sex identified by global COVID-19 meta-analysis as a risk factor for death and ITU admission. Nat Commun. 2020;11:6317
5. Twitchell DK, Christensen MB, Hackett G. et al. Examining Male Predominance of Severe COVID-19 Outcomes: A Systematic Review. Androg Clin Res Ther. 2022;3:41-53
6. Gupta A, Madhavan MV, Sehgal K. et al. Extrapulmonary manifestations of COVID-19. Nature medicine. 2020;26:1017-1032
7. Ma X, Guan C, Chen R. et al. Pathological and molecular examinations of postmortem testis biopsies reveal SARS-CoV-2 infection in the testis and spermatogenesis damage in COVID-19 patients. Cell Mol Immunol. 2021;18:487-489
8. He Y, Wang J, Ren J. et al. Effect of COVID-19 on Male Reproductive System - A Systematic Review. Front Endocrinol (Lausanne). 2021;12:677701
9. Sung H, Ferlay J, Siegel RL. et al. Global Cancer Statistics 2020: GLOBOCAN Estimates of Incidence and Mortality Worldwide for 36 Cancers in 185 Countries. CA Cancer J Clin. 2021;71:209-249
10. Montopoli M, Zumerle S, Vettor R. et al. Androgen-deprivation therapies for prostate cancer and risk of infection by SARS-CoV-2: a population-based study (N = 4532). Ann Oncol. 2020;31:1040-1045
11. Dai M, Liu D, Liu M. et al. Patients with Cancer Appear More Vulnerable to SARS-CoV-2: A Multicenter Study during the COVID-19 Outbreak. Cancer Discov. 2020;10:783-791
12. Higgins V, Sohaei D, Diamandis EP. et al. COVID-19: from an acute to chronic disease? Potential long-term health consequences. Crit Rev Clin Lab Sci. 2021;58:297-310
13. Del Rio C, Collins LF, Malani P. Long-term Health Consequences of COVID-19. JAMA. 2020;324:1723-1724
14. Wang D, Ma Y, Yan L. et al. Exploring the association between COVID-19 and male genital cancer risk in European population: evidence from mendelian randomization analysis. BMC Genom Data. 2023;24:56
15. Li Z, Wei Y, Zhu G. et al. Cancers and COVID-19 Risk: A Mendelian Randomization Study. Cancers (Basel). 2022;14:2086
16. Liu J, Wan L, Zhu J. et al. Association between prostate cancer and susceptibility, hospitalization, and severity of COVID-19: Based on a Mendelian randomization study. Medicine (Baltimore). 2024;103:e39430
17. Yang F, Guo P, Wang K. et al. Insights from immunomics and metabolomics on the associations between prostatic diseases and coronavirus disease 2019. Prostate Int. 2024;12:167-177
18. Bahmad HF, Abou-Kheir W. Crosstalk between COVID-19 and prostate cancer. Prostate Cancer P D. 2020;23:561-563
19. Farooqi AA, Hou MF, Chen CC. et al. Androgen receptor and gene network: Micromechanics reassemble the signaling machinery of TMPRSS2-ERG positive prostate cancer cells. Cancer Cell Int. 2014;14:34
20. Hoffmann M, Kleine-Weber H, Schroeder S. et al. SARS-CoV-2 Cell Entry Depends on ACE2 and TMPRSS2 and Is Blocked by a Clinically Proven Protease Inhibitor. Cell. 2020;181:271-280 e278
21. Schumacher FR, Al Olama AA, Berndt SI. et al. Association analyses of more than 140,000 men identify 63 new prostate cancer susceptibility loci. Nat Genet. 2018;50:928-936
22. Initiative C-HG. The COVID-19 Host Genetics Initiative, a global initiative to elucidate the role of host genetic factors in susceptibility and severity of the SARS-CoV-2 virus pandemic. Eur J Hum Genet. 2020;28:715-718
23. Bulik-Sullivan B, Finucane HK, Anttila V. et al. An atlas of genetic correlations across human diseases and traits. Nat Genet. 2015;47:1236-1241
24. Bulik-Sullivan BK, Loh PR, Finucane HK. et al. LD Score regression distinguishes confounding from polygenicity in genome-wide association studies. Nat Genet. 2015;47:291-295
25. Zhang Y, Lu Q, Ye Y. et al. SUPERGNOVA: local genetic correlation analysis reveals heterogeneous etiologic sharing of complex traits. Genome Biol. 2021;22:262
26. Zhu XF, Feng T, Tayo BO. et al. Meta-analysis of Correlated Traits via Summary Statistics from GWASs with an Application in Hypertension. Am J Hum Genet. 2015;96:21-36
27. Purcell S, Neale B, Todd-Brown K. et al. PLINK: A tool set for whole-genome association and population-based linkage analyses. Am J Hum Genet. 2007;81:559-575
28. McLaren W, Gil L, Hunt SE. et al. The Ensembl Variant Effect Predictor. Genome biology. 2016;17:122
29. Schaid DJ, Chen W, Larson NB. From genome-wide associations to candidate causal variants by statistical fine-mapping. Nat Rev Genet. 2018;19:491-504
30. Farh KK, Marson A, Zhu J. et al. Genetic and epigenetic fine mapping of causal autoimmune disease variants. Nature. 2015;518:337-343
31. Giambartolomei C, Vukcevic D, Schadt EE. et al. Bayesian Test for Colocalisation between Pairs of Genetic Association Studies Using Summary Statistics. Plos Genet. 2014;10:e1004383
32. Gusev A, Ko A, Shi H. et al. Integrative approaches for large-scale transcriptome-wide association studies. Nature genetics. 2016;48:245-252
33. Burgess S, Thompson SG, Collaboration CCG. Avoiding bias from weak instruments in Mendelian randomization studies. Int J Epidemiol. 2011;40:755-764
34. Burgess S, Scott RA, Timpson NJ. et al. Using published data in Mendelian randomization: a blueprint for efficient identification of causal risk factors. Eur J Epidemiol. 2015;30:543-552
35. Bowden J, Smith GD, Burgess S. Mendelian randomization with invalid instruments: effect estimation and bias detection through Egger regression. Int J Epidemiol. 2015;44:512-525
36. Bowden J, Smith GD, Haycock PC. et al. Consistent Estimation in Mendelian Randomization with Some Invalid Instruments Using a Weighted Median Estimator. Genet Epidemiol. 2016;40:304-314
37. Verbanck M, Chen CY, Neale B. et al. Detection of widespread horizontal pleiotropy in causal relationships inferred from Mendelian randomization between complex traits and diseases. Nat Genet. 2018;50:693-698
38. Shelton JF, Shastri AJ, Ye C. et al. Trans-ancestry analysis reveals genetic and nongenetic associations with COVID-19 susceptibility and severity. Nat Genet. 2021;53:801-808
39. Conti DV, Darst BF, Moss LC. et al. Trans-ancestry genome-wide association meta-analysis of prostate cancer identifies new susceptibility loci and informs genetic risk prediction. Nat Genet. 2021;53:65-75
40. Hu J, Li C, Wang S. et al. Genetic variants are identified to increase risk of COVID-19 related mortality from UK Biobank data. Hum Genomics. 2021;15:10
41. Brandes N, Linial N, Linial M. Genetic association studies of alterations in protein function expose recessive effects on cancer predisposition. Sci Rep. 2021;11:14901
42. Ruth KS, Day FR, Tyrrell J. et al. Using human genetics to understand the disease impacts of testosterone in men and women. Nat Med. 2020;26:252-258
43. Yap CX, Sidorenko J, Wu Y. et al. Dissection of genetic variation and evidence for pleiotropy in male pattern baldness. Nat Commun. 2018;9:5407
44. Zhu ZZ, Hasegawa K, Camargo CA. et al. Investigating asthma heterogeneity through shared and distinct genetics: Insights from genome-wide cross-trait analysis. J Allergy Clin Immun. 2021;147:796-807
45. Sharad S, Allemang TC, Li H. et al. Age and Tumor Differentiation-Associated Gene Expression Based Analysis of Non-Familial Prostate Cancers. Front Oncol. 2020;10:584280
46. Dobrijevic Z, Gligorijevic N, Sunderic M. et al. The association of human leucocyte antigen (HLA) alleles with COVID-19 severity: A systematic review and meta-analysis. Rev Med Virol. 2022: e2378.
47. Chang GT, Blok LJ, Steenbeek M. et al. Differentially expressed genes in androgen-dependent and -independent prostate carcinomas. Cancer Res. 1997;57:4075-4081
48. Chang GT, Steenbeek M, Schippers E. et al. Characterization of a zinc-finger protein and its association with apoptosis in prostate cancer cells. J Natl Cancer Inst. 2000;92:1414-1421
49. Chang GT, van den Bemd GJ, Jhamai M. et al. Structure and function of GC79/TRPS1, a novel androgen-repressible apoptosis gene. Apoptosis. 2002;7:13-21
50. van den Bemd GJ, Jhamai M, Brinkmann AO. et al. The atypical GATA protein TRPS1 represses androgen-induced prostate-specific antigen expression in LNCaP prostate cancer cells. Biochem Biophys Res Commun. 2003;312:578-584
51. Gubbels Bupp MR, Jorgensen TN. Androgen-Induced Immunosuppression. Front Immunol. 2018;9:794
52. Ling YH, Wong CC, Li KW. et al. CCHCR1 interacts with EDC4, suggesting its localization in P-bodies. Exp Cell Res. 2014;327:12-23
53. Olnes MJ, Kotliarov Y, Biancotto A. et al. Effects of Systemically Administered Hydrocortisone on the Human Immunome. Sci Rep. 2016;6:23002
54. Oka A, Takagi A, Komiyama E. et al. Alopecia areata susceptibility variant in MHC region impacts expressions of genes contributing to hair keratinization and is involved in hair loss. Ebiomedicine. 2020;57:102810
55. Zong Z, Wei Y, Ren J. et al. The intersection of COVID-19 and cancer: signaling pathways and treatment implications. Mol Cancer. 2021;20:76
56. Mostafavi Zadeh SM, Tajik F, Gheytanchi E. et al. COVID-19 pandemic impact on screening and diagnosis of prostate cancer: a systematic review. BMJ Support Palliat Care. 2024;14:e1594-e1603
57. Schmidt AL, Tucker MD, Bakouny Z. et al. Association Between Androgen Deprivation Therapy and Mortality Among Patients With Prostate Cancer and COVID-19. Jama Netw Open. 2021;4:e2145075
58. Klein EA, Li J, Milinovich A. et al. Androgen Deprivation Therapy in Men with Prostate Cancer Does Not Affect Risk of Infection with SARS-CoV-2. J Urol. 2021;205:441-443
Author contact
![]() Corresponding author: Xia Jiang (xia.jiangse or xiajiangedu.cn).
Corresponding author: Xia Jiang (xia.jiangse or xiajiangedu.cn).