Impact Factor ISSN: 1837-9664

 Global reach, higher impact
J Cancer 2022; 13(3):877-889. doi:10.7150/jca.57008 This issue Cite
Research Paper
Identification of tumor microenvironment‐based genes associated with acquired resistance to EGFR Tyrosine Kinase Inhibitor in Lung Adenocarcinoma
Wenjie Chen1,4*, Wen Li1*, Zhenkun Liu1*, Guangzhi Ma1,2, Yunfu Deng1, Lingling Zhu1, Qinghua Zhou1,3 ![]()
1. Lung Cancer Center, West China Hospital, Sichuan University, Chengdu, China.
2. Department of Thoracic Surgery, West China Hospital, Sichuan University, Chengdu, China.
3. Tianjin Key Laboratory of Lung Cancer Metastasis and Tumor Microenvironment, Tianjin Lung Cancer Institute, Tianjin Medical University General Hospital, Tianjin, China.
4. Department of Thoracic Surgery, The Third Affiliated Hospital of Kunming Medical University (Yunnan Cancer Hospital, Yunnan Cancer Center), Kunming, China.
* These authors have contributed equally to this work
Received 2020-12-10; Accepted 2021-12-12; Published 2022-1-1
Abstract

Background: The tumor microenvironment evidently affects treatment response and clinical outcome. This study aims to construct a tumor microenvironment-based crosstalk between immunotherapy and epidermal growth factor receptor tyrosine kinase inhibitor (EGFR-TKI) in lung adenocarcinoma.
Methods: We used ESTIMATE algorithm to calculate stromal and immune scores. Differentially expressed genes (DEGs) were extracted based on the comprehensive analysis of immune score groups and EGFR-TKI resistance samples. The independent prognostic value of the five selected genes was assessed by univariate/multivariate Cox regression analysis, survival analysis and the receiver operating characteristic (ROC) curve. Correlation analysis was performed using Spearman's rho value through TIMER 2.0.
Results: The Kaplan-Meier survival curve show that patients with higher immune scores have significantly better overall survival. We identified 1328 DEGs from immune score groups and 806 DEGs from the EGFR-TKI resistance cohort GSE123066. A total of 19 co-regulated genes were found, and the Cox regression model produced a significant statistical prognosis for five genes (CENPF, CYSLTR1, GLDN, PIGR and SCGB3A1). Multivariate Cox regression analysis showed that the selected five gene signatures could be used as independent prognostic indicators. Furthermore, GSEA and correlation analysis demonstrated that CENPF was positively correlated to the signalling pathway which related to EGFR-TKI resistance and the well-known bypass gene.
Conclusion: Our findings indicate that CENPF, CYSLTR1, GLDN, PIGR and SCGB3A1 are independent prognostic biomarkers associated with acquired EGFR-TKI resistance and tumor immune cell infiltration in lung adenocarcinoma, and CENPF may be a potential target that can improve immunotherapy efficacy and overcome the acquired EGFR-TKI resistance.
Keywords: lung adenocarcinoma, tumor environment, immune cell infiltration, immunotherapy, EGFR-TKI resistance
Introduction
Lung cancer is one of the most frequently diagnosed malignancies and the leading cause of cancer related deaths [1]. It is categorised into adenocarcinoma (LUAD), squamous cell type and large cell type, and LUAD accounts for more than 40% of all lung cancer cases [2]. It has been reported that the activating mutations in tyrosine kinase domain of EGFR in LUAD were found 10%-15% in the American and Europe and 40%-50% in Asia [3]. Small molecule epidermal growth factor receptor tyrosine kinase inhibitors (EGFR-TKIs) are clinically effective for the first-line treatment of EGFR-mutated NSCLC [3-5]. However, the efficacy is transient, and the acquired resistance to EGFR-TKI is inevitable after 9-14 months of treatment [6-9].
The tumor microenvironment (TME) is consist of various cells, including endothelial cells, fibroblasts, immune cells and extra-cellular components that surround the tumor cells [10]. The TME can critically influence tumor initiation, progression and metastasis and plays a vital role in therapeutic efficacy [11]. Oncogenic alterations can promote an immunosuppressive TME through reduced tumor antigen expression and T-cell infiltration in tumor beds [12]. Tumor or stromal cells might result in microenvironment-induced drug resistance through secreting soluble factors, and tumor-associated macrophages have been generally considered the main regulators of therapeutic response in the TME [13].
Immune checkpoint plays a prominent role of immune suppression in tumors and their microenvironment [14]. In addition, tumors with low levels of immune infiltration are associated with the low rate of response to programmed death-1 (PD-1) inhibitors [15]. PD-1 inhibitors, such as nivolumab and pembrolizumab, are another important treatment for NSCLC. Compared with docetaxel, PD-1 inhibitors could prolong the overall survival of NSCLC patients who had been treated with platinum-based doublet chemotherapy [16, 17]. Moreover, a previous study found that PD-1 inhibitors are less effective in treating NSCLC patients with EGFR mutations, and low levels of both programmed death-ligand 1 (PD-L1) and CD8+tumor infiltrating lymphocytes in the TME might be the basis of this adverse clinical response [18]. Although immune-checkpoint inhibitors and EGFR-TKIs have shown promising clinical results for LUAD [19-21], the link between the two treatment remains unclear.
ESTIMATE is one of the widely used algorithms for quantifying the stromal and immune components in the TME of malignant tumor tissues [22]. It has shown effectiveness in a variety of malignancies, including breast cancer, urothelial cancer, multiple myeloma and neck squamous cell carcinoma [23-29]
In this study, we estimated the immune components of the TME and the EGFR-TKI resistance related genes and then identified reliable prognostic biomarkers for LUAD. The newly found genes might render tumor cells more sensitive to EGFR-TKIs and immunotherapy for LUAD patients.
Material and Methods
Data collection
The gene expression profiles and phenotype data such as pathological factors, and the survival outcome of the LUAD cohort, were obtained from The Cancer Genome Atlas (TCGA) (https://portal.gdc.cancer.gov/). Criteria for patient selection: Primary Site is bronchus and lung; Project ID is TCGA-LUAD; Workflow Type is HTSeq-Counts; Data Category is Transcriptome Profiling; Data Type is Gene Expression Quantification. The profiles of 526 LUAD and 59 adjacent normal lung tissues were included in the study.
Gene set GSE123066 profiles were obtained from Gene Expression Omnibus (GEO, https://www.ncbi.nlm.nih.gov/geo/). According to the selection criteria, three gefitinib-sensitive samples (GSM3494550, GSM3494551, GSM3494552) and three gefitinib-resistant samples (GSM3494553, GSM3494554, GSM3494555) were included.
Independent validation set GSE26939 profiles were obtained from Gene Expression Omnibus (GEO, https://www.ncbi.nlm.nih.gov/geo/).
Estimation of stromal and immune cells and identification of deferentially expressed genes
The stromal and immune scores of the TCGA data were calculated by using R package 'ESTIMATE' [22]. Survival curves were constructed based on Kaplan-Meier (K-M) by using R package 'survival', the log‐rank test P < 0.05 was set as the cut-off. The DEGs were screened by using the R package 'limma' [30], | Log2 (fold change) | ≥ 1.0 and p-value < 0.05 were set as the cut-off.
Function and pathway enrichment analysis of DEGs
The gene ontology (GO) analysis and the Kyoto Encyclopaedia of Genes and Genomes (KEGG) pathway enrichment analysis were performed by the R package 'clusterProfiler'[31], the false discovery rate (FDR) and p-value < 0.05 was set as the cut-off.
Validation of prognostic value of selected genes for LUAD
Univariate Cox hazards regression analysis was used to analyse the commonly regulated genes and confirm their estimated regression coefficients (β), and p < 0.05 was considered to have prognostic value. Kaplan-Meier plotter (www.kmplot.com/lung) [32] were used to verify the prognostic value of the selected genes. Immunohistochemical staining of prognostic genes obtained from The Human Protein Atlas (https://www.proteinatlas.org/) [33].
Prognostic signature construction and risk score calculation
The risk score formula: risk score = β gene [1] × Expression gene [1] +βgene [2] × Expression gene [2] +... +βgene [n] × Expression gene [n]. LUAD patients above the median risk score would be divided into the high-risk group, and the rest would be divided into the low-risk group. The ROC based on three-year survival and K-M survival curves were utilised to evaluate the diagnostic efficacies. The effects of risk score and clinicopathological variables on the overall survival were confirmed by multivariate Cox hazards regression analysis.
GSEA enrichment analysis
Among the 526 LUAD-TCGA samples, the top 100 samples (CENPF_pos) exhibited high levels of CENPF expression, and the bottom 100 samples (CENPF_neg) displayed low levels of CENPF expression. Then, we performed GSEA with the signal-to-noise measure to rank the genes in terms of their association with the LUAD groups (CENPF_pos vs. CENPF_neg).
PPI network construction and module analysis
The protein-protein interaction (PPI) network was obtained from the STRING database [34] (http://string-db.org). The PPI network was subsequently visualised using the Cytoscape [35] software, and the “cytohubba” plug-in was used for modular analysis to identify the top 10 hub genes.
Correlation analysis
The correlation between CENPF and the EGFR-TKI resistance associated genes [6] in the LUAD was identified through TMIE2.0 (https://cistrome.shinyapps.io/timer/), with the Spearman's rho value and the estimated statistical significance [36, 37].
Results
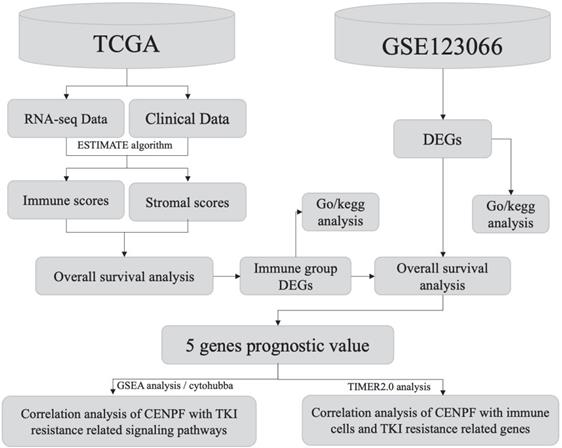
Workflow of the current work is displayed in Figure 1.
Workflow of the current work.
Tumor progression was associated with immune scores
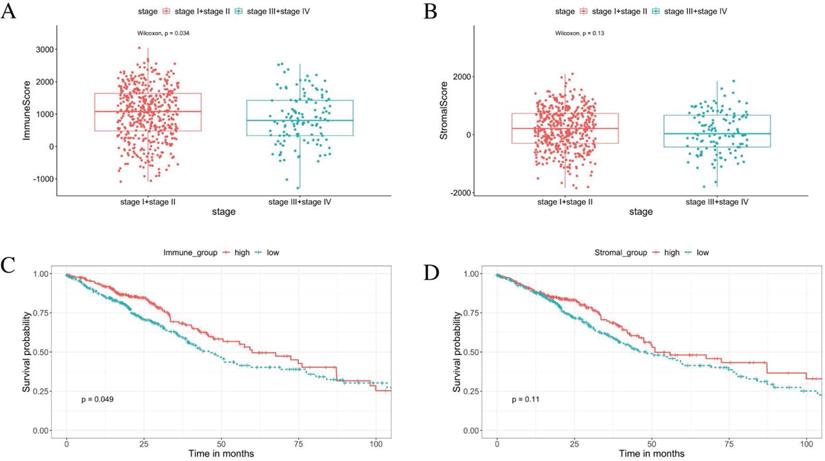
From the ESTIMATE analysis, immune scores ranging from -1284.72 to 3045.14 were generated, while the stromal scores ranged from -1842.88 to 2093.33 for the 585 LUAD patients enrolled in this study. To detect the correlation between the stromal/immune scores and tumor progression. We divided the tumor stage into stage I + stage II and stage III + stage IV groups. The result shows the tumor progression is significantly negative correlated with the immune scores. The patients in the stage I + stage II group obtained higher immune scores than those in the stage III + stage IV group (Figure 2A, p < 0.05). There was no significant association between the stromal scores and tumor progression (Figure 2B, p = 0.13).
Immune scores are associated with stage of LUAD progression and their overall survival. (A) The immune score is significantly negative associated with tumor progression (p < 0.05). (B) The stromal score is insignificantly associated with the early stage compared with the advanced stage (p = 0.13). (C) K-M curves showed that the overall survival of patients in the high immune score group were significantly better than that in the low immune score group (p < 0.05). (D) K-M survival curves show that there is no statistically significant difference in the stromal scores groups (p = 0.11).
Immune score was positively correlated with overall survival
Based on the median value of the stromal and immune scores, we divided the 526 patients into the high score groups and low score groups. The K-M survival curves showed that the overall survival of patients in the high immune score group were significantly better than that in the low immune score group (Figure 2C, log‐rank test p < 0.05). Furthermore, there was no statistical difference in overall survival between high and low stromal score groups (Figure 2D, log‐rank test p = 0.11). The correlations of the immune score groups and the clinicopathological variables are summarised in Table 1.
Immune score expression and clinicopathological factors in TCGA cases.
| Characteristics | Immune score | P-value | |
|---|---|---|---|
| High (n=235) | Low (n= 291) | ||
| Age | 0.0104 | ||
| ≤65 | 94 | 154 | |
| >65 | 130 | 129 | |
| unknown | 11 | 8 | |
| Smoking History | 0.0175 | ||
| smoked | 113 | 171 | |
| non- smoked | 122 | 120 | |
| Gender | 0.0354 | ||
| male | 97 | 147 | |
| female | 138 | 144 | |
| Pathologic Stage | 0.0341 | ||
| I | 141 | 145 | |
| II | 56 | 66 | |
| III | 26 | 58 | |
| IV | 9 | 17 | |
| no reported | 3 | 5 | |
| T_stage | 0.0786 | ||
| T1 | 85 | 87 | |
| T2 | 121 | 163 | |
| T3 | 21 | 27 | |
| T4 | 5 | 14 | |
| Tx | 3 | 0 | |
| N_stage | 0.0751 | ||
| N0 | 161 | 180 | |
| N1 | 43 | 52 | |
| N2 | 22 | 52 | |
| N3 | 1 | 1 | |
| Nx | 8 | 6 | |
| M_stage | 0.381 | ||
| M0 | 158 | 196 | |
| M1 | 8 | 17 | |
| Mx | 69 | 78 | |
Validation of the LUAD datasets from TCGA and identification of different expression genes based on the immune score groups
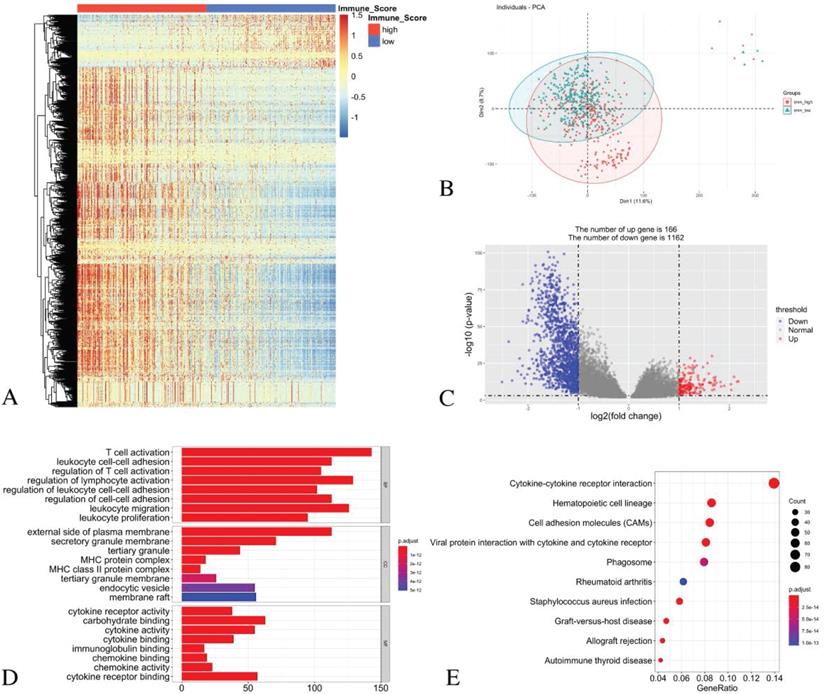
The principal component analysis (PCA) result indicates an acceptable intra-group data repeatability for immune scores. The distances between samples in the low immune scores group were short, while those between samples in the high immune scores group were also short in dimension-1 (Dim1) (Figure 3B). From the comparison of the low and high immune score groups, we identified 1328 different expression genes, including 166 up-regulated genes and 1162 down-regulated genes. The heatmap (Figure 3A) and the volcano plot (Figure 3C) show the representatives of the DEGs.
Identification of DEGs with immune scores in LUAD and GO/ KEGG pathway enrichment analysis. (A) Heatmap of DEGs with immune scores. (B) PCA of samples with immune scores in LUAD. (C) The volcano graph shows the distribution of DEGs based on the immune score. The X axis represents the fold changes of DEGs, and the Y axis represents the adjusted p-value. Red dots present up-regulated genes and blue dots present down-regulated genes (log2 fold change >1.0, p-value < 0.05). (D) GO enrichment analysis of DEGs. (E) The KEGG pathway enrichment analysis of DEGs.
GO and KEGG enrichment analyses
For the biological processes (BPs), the DEGs were primarily enriched in the T cell activation, the leukocyte cell-cell adhesion, the regulation of T cell activation, the regulation of lymphocyte activation, the regulation of leukocyte cell-cell adhesion, the regulation of cell-cell adhesion, leukocyte migration and leukocyte proliferation. For the cell component (CC), the DEGs were primarily enriched in the external side of the plasma membrane, the secretory granule membrane, the tertiary granule MHC protein complex, the MHC class II protein complex, the tertiary granule membrane, the endocytic vesicle and the membrane raft. For the molecular function (MF), the DEGs were mainly enriched in the cytokine receptor activity, the carbohydrate binding, the cytokine activity, the cytokine binding, the immunoglobulin binding, the chemokine binding, the chemokine activity and the cytokine receptor binding (Figure 3D).
The KEGG pathway analysis showed that all the DEGs were primarily clustered in the cytokine-cytokine receptor interaction, the hematopoietic cell lineage, the cell adhesion molecules, the viral protein interaction with cytokine and cytokine receptor, phagosome, rheumatoid arthritis, staphylococcus aureus infection, graft-versus-host disease, allograft rejection and autoimmune thyroid disease (Figure 3E).
Identification of DEGs in GSE123066 cohort and function enrichment analysis
By comparing three Gefitinib-resistant samples and three Gefitinib-sensitive samples, 806 DEGs were identified, including 327 up-regulated genes and 479 down-regulated genes. The heatmap (Figure 4A) and the volcano plot (Figure 4B) show the representatives of the DEGs.
Identification of DEGs in GSE123066 and GO/ KEGG pathway enrichment analysis of DEGs. (A) Heatmap of DEGs with immune scores. (B) Volcano maps show the distribution of DEGs. The X axis represents the fold changes of DEGs, and the Y axis represents the adjusted p-value. Red dots present up-regulated genes and blue dots present down-regulated genes (log2 fold change >1.0, p-value < 0.05). (C) GO enrichment analysis of DEGs. (D) The KEGG pathway enrichment analysis of DEGs. (E) Venn diagram shows the number of commonly up-regulated gene in low immune score group and EGFR-TKI resistance group. (F) Venn diagram shows the number of commonly down-regulated gene in low immune score group and EGFR-TKI resistance group.
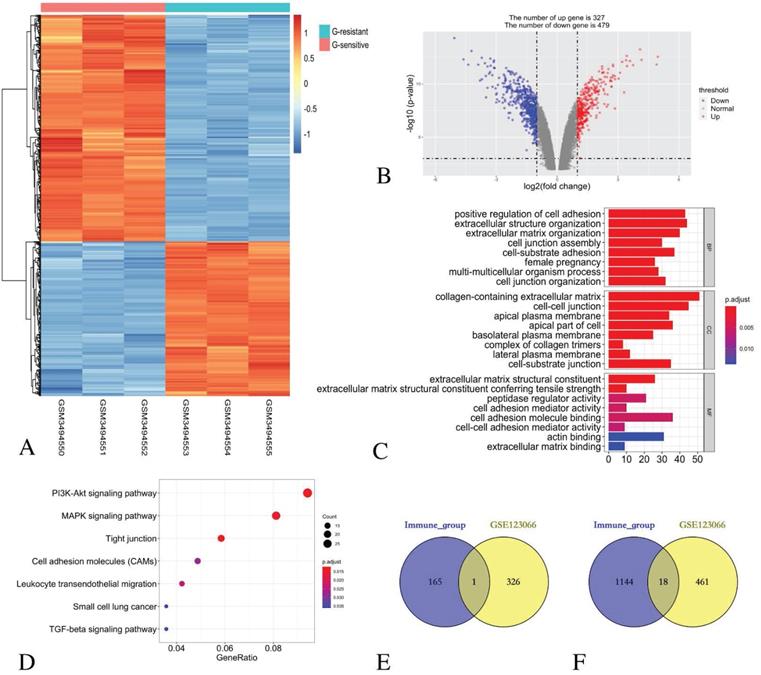
GO functional enrichment analysis revealed that the DEGs in the BP category were mainly enriched in the positive regulation of cell adhesion, extracellular structure organisation, extracellular matrix organisation, cell junction assembly, cell-substrate adhesion, female pregnancy, multi-multicellular organism process and cell junction organisation terms. For the enriched CC terms, the DEGs were primarily enriched in the collagen-containing extracellular matrix, the cell-cell junction, the apical plasma membrane, the apical part of the cell, the basolateral plasma membrane, the complex of collagen trimers, the lateral plasma membrane and the cell-substrate junction. For enriched MF terms, the DEGs were primarily enriched in cell adhesion molecule binding, extracellular matrix structural constituent, peptidase regulator activity, extracellular matrix structural constituent conferring tensile strength, cell adhesion mediator activity, cell-cell adhesion mediator activity, actin binding and extracellular matrix binding (Figure 4C).
The KEGG pathway revealed that all the DEGs were primarily enriched in the PI3K-Akt signalling pathway, the MAPK signalling pathway, the tight junction, the cell adhesion molecules, the leukocyte transendothelial migration, small cell lung cancer and the TGF-beta signalling pathway (Figure 4D).
Identification of common DEGs in immune score group and EGFR-TKI resistance group
The comparison based on immune scores and EGFR-TKI resistance indicates that 166 genes were up-regulated in the low score group, and 327 genes were up-regulated in the Gefitinib resistant group. Venn diagram revealed that only one gene CENPF was simultaneously contained within the two examined datasets (Figure 4E).
Similarly, 1162 genes were down-regulated in the low score group, and 479 genes were down-regulated in the Gefitinib resistance group. A Venn diagram reveals that 18 genes, namely, LCP1, CD14, SPOCK2, LMO2, CYSLTR1, FRMD3, GLDN, DHRS9, TMEM100, SERPINA1, CST6, PIGR, SCGB3A1, MMP7, SHISA3 and AZGP1, were simultaneously contained within the two examined datasets (Figure 4F).
Filter out prognostic genes from common DEGs and constructed prognostic risk signature model
The univariate Cox hazards regression analysis revealed that five genes (i.e., CENPF, CYSLTR1, GLDN, PIGR and SCGB3A1) were significantly related to the OS and their estimated regression coefficients were confirmed (P < 0.05, Table 2). Then, we constructed the K-M survival curves to validate the prognostic value of the selected genes. Remarkably, the high levels of CEBPF expression could significantly predict a poor OS, and the low levels of the CYSLTR1, GLDN, PIGR and SCGB3A1 expressions could significantly predict a poor OS (log-rank test p < 0.05, Figures 5A-E). Multivariate Cox regression analysis was performed with the following factors: gender, age, smoking history, AJCC stage and risk score. The results show that the risk score is still significantly related to OS (Figure 5F).
Identification of prognostic genes.
| Name | Descriptions | Immune score grouplow vs. high | EGFR-TKI groupresistant vs. sensitive | Univariate analysis | ||||||
|---|---|---|---|---|---|---|---|---|---|---|
| log2FC | P.Value | log2FC | P.Value | HR | 95% CI | logrank P | coef | |||
| CENPF | centromere protein F | 1.0418 | 3.11E-15 | 1.2755 | 1.07E-06 | 1.2 | 1.1 - 1.3 | 0.0017 | 0.15 | |
| CYSLTR1 | cysteinyl leukotriene receptor 1 | -1.1463 | 7.25E-30 | -2.5646 | 2.88E-09 | 0.89 | 0.8 - 0.98 | 0.022 | -0.12 | |
| GLDN | gliomedin | -1.3117 | 2.36E-22 | -1.5769 | 2.87E-10 | 0.91 | 0.84 - 1 | 0.044 | -0.09 | |
| PIGR | polymeric immunoglobulin receptor | -1.4312 | 2.01E-09 | -1.6955 | 3.75E-10 | 0.94 | 0.9 - 0.98 | 0.004 | -0.065 | |
| SCGB3A1 | secretoglobin family 3A member 1 | -1.6343 | 4.55E-09 | -5.0593 | 4.98E-15 | 0.93 | 0.9 - 0.97 | 0.00055 | -0.069 | |
log2FC, log2 fold change; P.Value, Nominal P Value; HR, hazard ratio; CI, confidence interval; coef, regression coefficient.
Validation of selected prognostic genes for LUAD (A-E) K-M survival curves for each selected DEGs. Red curves represent high level of gene expression and black curves represent low level of gene expression in LUAD (log-rank test p < 0.05). Overall survival in months. (F) Multivariate Cox regression analysis of the association between clinicopathological factors and risk score.
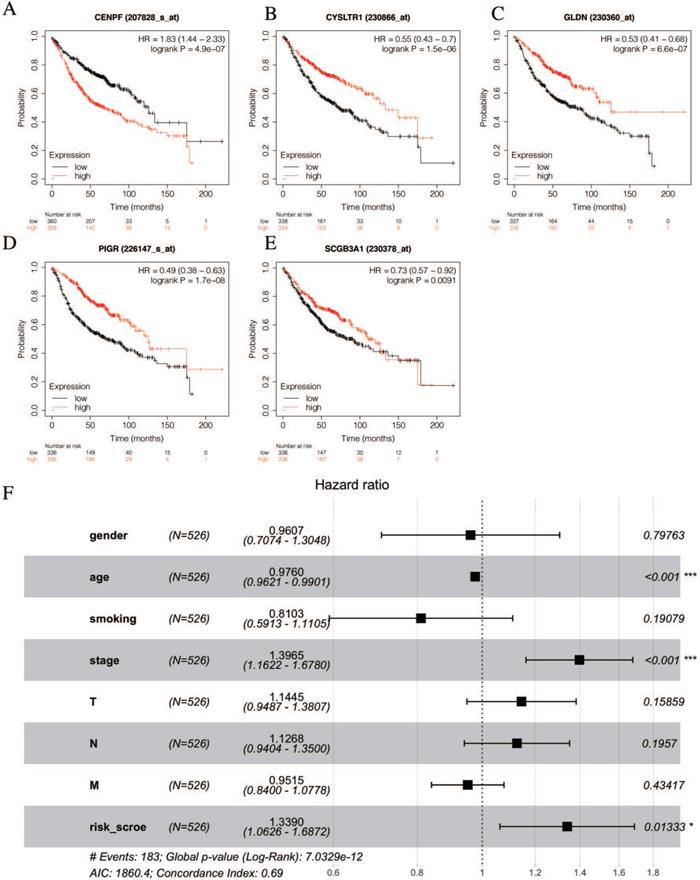
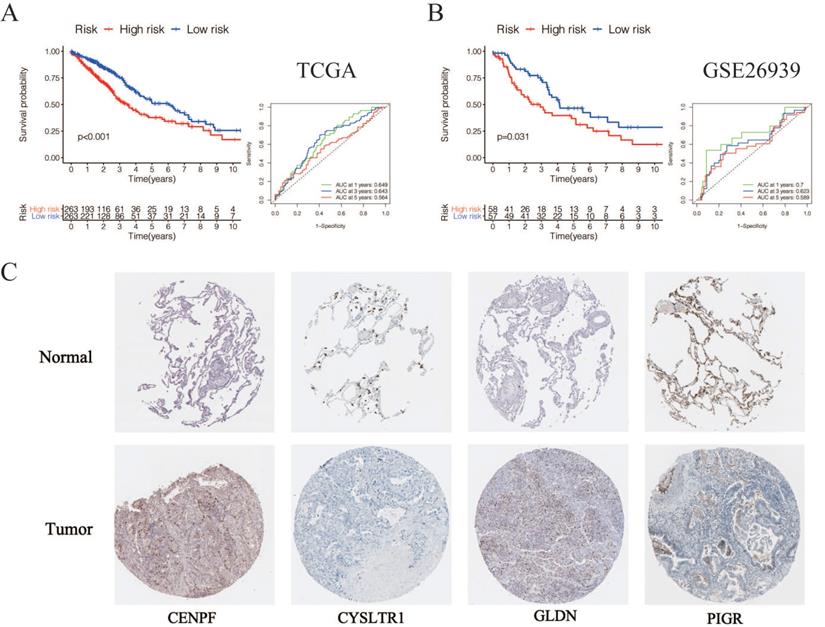
According to the following formula: risk score = (0.15 × Exp CENPF) + (-0.12 × Exp CYSLTR1) + (-0.09 × Exp GLDN) + (-0.065 × Exp PIGR) + (-0.069 × Exp SCGB3A1), we calculated the risk scores for LUAD patients in the TCGA. The sets were divided into the high- (n = 263) and low-risk groups (n = 263). Based on the median risk score, 263 patients were divided into high-risk group and the rest into low-risk group. The K-M curve shows that the OS of the low-risk group is significantly higher than the high-risk group (p < 0.05, Figure 6A). The K-M curve and ROC curves of the independent validation set GSE26939 showed that the OS of the low-risk group is significantly higher than the high-risk group (p < 0.05, Figure 6B). Immunohistochemical staining analysis of prognostic genes in lung cancer tissues from The Human Protein Atlas showed that the expression levels of CENPF were significantly higher than that in the normal lung tissue, the expression levels of CYSLTR1 were significantly lower than that in the normal lung tissue, the expression levels of GLDN were significantly higher than that in the normal lung tissue and the expression levels of PIGR were significantly lower than that in the normal lung tissue (Figure 6C). The expression levels of SCGB3A1 were not provided in The Human Protein Atlas.
Validation of selected prognostic genes for LUAD (A) K-M overall survival curve for risk score groups and ROC curves in the TCGA dataset (p < 0.05). (B) K-M overall survival curve for risk score groups and ROC curves in the GSE26939 (p < 0.05). (C) Immunohistochemical staining analysis of prognostic genes in lung cancer tissues from The Human Protein Atlas.
GSEA analysis of CENPF with EGFR-TKI resistance related pathways and genes
We ranked 526 LUAD samples by their relative CENPF expression in the TCGA dataset and compared the top 100 samples (CENPF_High) and the bottom 100 samples (CENPF_Low) through GSEA KEGG enrichment analysis. Given the limited space, only the top 20 pathways are listed in Table 3 (NOM p-value < 0.05, FDR < 0.25).
KEGG pathway enrichment analysis by GSEA.
| KEGG pathway name | NES | NOM p-val | FDR |
|---|---|---|---|
| CELL_CYCLE | 2.052 | 0.000 | 0.029 |
| LYSINE_DEGRADATION | 2.043 | 0.000 | 0.016 |
| HOMOLOGOUS_RECOMBINATION | 2.014 | 0.000 | 0.018 |
| DNA_REPLICATION | 1.975 | 0.000 | 0.023 |
| OOCYTE_MEIOSIS | 1.922 | 0.000 | 0.037 |
| MISMATCH_REPAIR | 1.897 | 0.000 | 0.040 |
| NUCLEOTIDE_EXCISION_REPAIR | 1.878 | 0.000 | 0.044 |
| UBIQUITIN_MEDIATED_PROTEOLYSIS | 1.871 | 0.000 | 0.046 |
| BASE_EXCISION_REPAIR | 1.861 | 0.000 | 0.045 |
| SPLICEOSOME | 1.855 | 0.000 | 0.043 |
| SMALL_CELL_LUNG_CANCER | 1.846 | 0.000 | 0.044 |
| PROGESTERONE_MEDIATED_OOCYTE_MATURATION | 1.842 | 0.000 | 0.042 |
| RNA_DEGRADATION | 1.816 | 0.002 | 0.052 |
| PURINE_METABOLISM | 1.786 | 0.004 | 0.068 |
| PYRIMIDINE_METABOLISM | 1.775 | 0.006 | 0.070 |
| PATHWAYS_IN_CANCER | 1.768 | 0.000 | 0.070 |
| ONE_CARBON_POOL_BY_FOLATE | 1.761 | 0.004 | 0.070 |
| CHRONIC_MYELOID_LEUKEMIA | 1.756 | 0.000 | 0.071 |
| ERBB_SIGNALING_PATHWAY | 1.754 | 0.002 | 0.069 |
| CYSTEINE_AND_METHIONINE_METABOLISM | 1.752 | 0.004 | 0.066 |
NES: normalized enrichment score; NOM p-val: Nominal P Value; FDR: The false discovery rate. Gene sets with NOM p-value < 0.05 and FDR q-value < 0.25 are considered as significant.
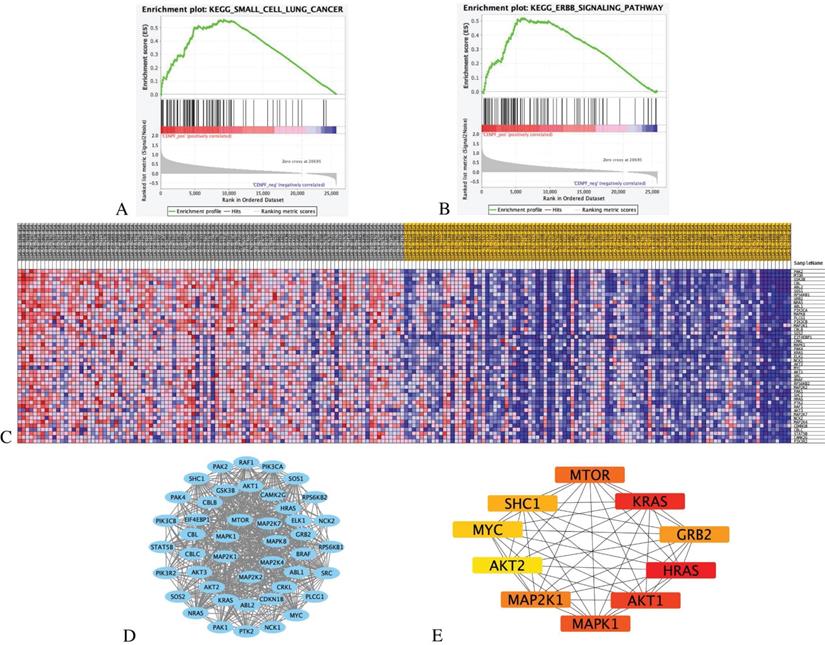
The results indicate that the CENPF_High tumor samples enrich the gene signatures associated with “small cell lung cancer” and “ErbB signalling pathway” compared with CENPF_Low samples (Figures 7A-B). The transcriptional expression profiles of the 45 core genes in the ErbB signalling pathway are presented in a heatmap (Figure 7C). To identify the significant module, the STRING online database and Cystoscope software were used to merge the 45 core genes. The PPI network of the core genes was constructed (Figure 7D), and the most significant module was obtained using the Cystoscope plug-in 'cytohubba' (Figure 7E and Table 4).
GSEA analysis of CENPF with EGFR-TKI resistance related pathways and genes. (A) GSEA indicated significant enrichment of EGFR-TKI resistance related pathway, small cell lung cancer pathway in the high expression level of CENPF. (B) ErbB signalling pathway in the high expression level of CENPF. (C) Heatmap of 45 core genes for enrichment of ErbB signalling pathway. (D) Based on the STRING database, a core genes PPI network was constructed. (E) Top 10 hub genes from core genes ranked by CytoHubba methods.
Identification of hub genes by cytoHubba.
| Gene Name | MCC | DMNC | MNC | Degree | EPC | Ec Centricity | Bottle Neck | Radiality | Betweenness | Closeness | Stress | Clustering Coefficient |
|---|---|---|---|---|---|---|---|---|---|---|---|---|
| HRAS | 4.8356E+11 | 0.8347 | 39 | 39 | 18.13 | 0.5 | 2 | 2.97727 | 88.73941 | 41.5 | 700 | 0.57085 |
| KRAS | 4.8351E+11 | 0.8675 | 37 | 37 | 18.23 | 0.5 | 1 | 2.93182 | 59.99892 | 40.5 | 584 | 0.6036 |
| AKT1 | 4.8247E+11 | 0.8229 | 39 | 39 | 18.29 | 0.5 | 4 | 2.97727 | 88.31896 | 41.5 | 702 | 0.56275 |
| MAPK1 | 4.7951E+11 | 0.8515 | 35 | 35 | 17.49 | 0.5 | 2 | 2.88636 | 79.52542 | 39.5 | 588 | 0.60336 |
| MTOR | 4.7521E+11 | 0.9829 | 29 | 29 | 17.29 | 0.5 | 6 | 2.75 | 16.07856 | 36.5 | 216 | 0.74138 |
| MAP2K1 | 4.7029E+11 | 0.9032 | 30 | 30 | 16.69 | 0.5 | 3 | 2.77273 | 43.3339 | 37 | 352 | 0.67356 |
| GRB2 | 4.6987E+11 | 0.8481 | 37 | 37 | 17.89 | 0.5 | 4 | 2.93182 | 76.8446 | 40.5 | 590 | 0.59009 |
| SHC1 | 4.4966E+11 | 0.9771 | 30 | 30 | 17.01 | 0.5 | 1 | 2.77273 | 17.16792 | 37 | 242 | 0.72874 |
| MYC | 4.3484E+11 | 0.9868 | 26 | 26 | 15.4 | 0.5 | 1 | 2.68182 | 10.86406 | 35 | 148 | 0.77231 |
| AKT2 | 4.2943E+11 | 0.9955 | 24 | 24 | 15.28 | 0.5 | 1 | 2.63636 | 8.93873 | 34 | 116 | 0.80072 |
Correlation analysis of CENPF expression with tumor infiltering immune cells and EGFR-TKI resistance related genes
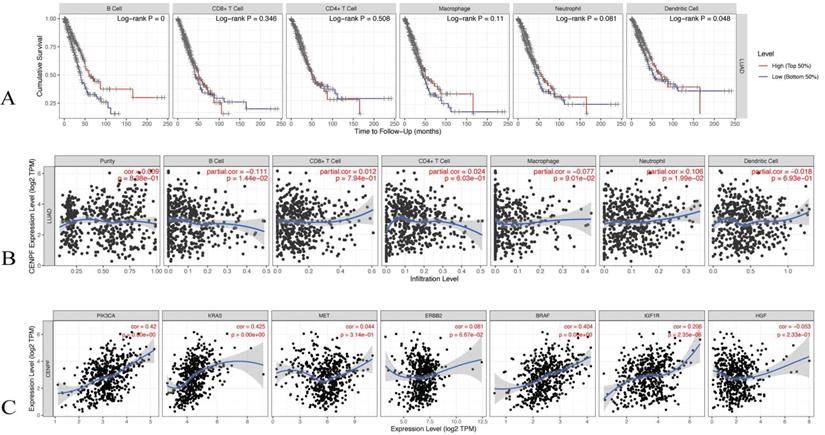
The TIMER database was utilised to evaluate the correlations of the CENPF expression with the tumor infiltering immune cells and the known EGFR-TKI resistance related genes. The infiltering levels of the B cells and the dendritic cell were associated with cumulative survival, that is, a high level predicts good prognosis (log-rank test p < 0.05, Figure 8A). The CENPF expression was positively associated with infiltering neutrophil (Cor = 0.106, p < 0.05), whereas the CENPF expression was negatively associated with infiltering B cells (Cor = -0.111, p < 0.05) and Macrophage (Cor = -0.077, p < 0.05, Figure 8B). Moreover, a positive correlation existed between the CENPF expression and the known EGFR-TKI resistance related genes, namely, PIK3CA (Cor = 0.42, p < 0.05), KRAS (Cor = 0.425, p < 0.05), BRAF (Cor = 0.404, p < 0.05) and IGF1R (Cor = 0.206, p < 0.05, Figure 8C).
Correlation analysis of CENPF expression with tumor infiltering immune cells and EGFR-TKI resistance related genes. (A) Cumulative survival was significantly related to the B cell infiltering level and dendritic cell infiltering level (log-rank test p < 0.05). (B) CENPF expression was negatively associated with infiltering B cells (Cor = -0.111, p < 0.05) and macrophage (Cor = - 0.077, p < 0.05). (C) CENPF expression was positive correlated with PIK3CA (Cor = 0.42, p < 0.05), KRAS (Cor = 0.425, p < 0.05), BRAF (Cor = 0.404, p < 0.05) and IGF1R (Cor = 0.206, p < 0.05).
Discussion
In the current work, we tried to identify prognostic genes based on the TME which may be related with the EGFR-TKIs resistance and the efficiency of immunotherapy in LUAD.
First, we find immune score was positively correlated with overall survival and advanced tumor stage have a lower immune score than the early stage. Immune suppression leads to tumor progression via modulating the TME in various ways, such as recruitment of immunosuppressive cells, tumor-associated myeloid-derived suppressor cells, tumor-associated macrophages, and Tregs to tumor sites by migratory and survival factors [38]. Then, we identified 1328 DEGs and GO term analysis revealed that many of these DEGs were related to the TME which suggested the immune cells played an important role in LUAD and the extracellular matrix molecules was closely associated with the establishment of the LUAD [39, 40]. In addition, KEGG pathway enrichment analysis shows that the DEGs were mainly involved in cell adhesion molecules and cytokine-cytokine receptor interaction, suggesting that the immune system was critical to form the complex LUAD tumor-microenvironment [41, 42]. These findings indicate that the up-regulation of the DEG in the low immune score group might be associated with the regulation of the TME, and immunosuppression was formed through this regulation, promoting tumor progression.
Next, we analysed 806 DEGs from EGFR-TKI resistance cohort GSE123066. GO term analysis reveals that many of the DEGs to be enriched in the positive regulation of cell adhesion and extracellular matrix organisation, collagen-containing extracellular matrix and cell-cell junction, and extracellular matrix structural constituent. Consistent with previous studies, the extracellular matrix serves as a microenvironmental clue to promoting EGFR-TKI resistance in lung cancer [43, 44]. Moreover, KEGG pathway enrichment reveals that the DEGs were mainly enriched in the PI3K-Akt signalling pathway, the MAPK signalling pathway, the tight junction, the cell adhesion molecules, leukocyte transendothelial migration, small cell lung cancer and the TGF-beta signalling pathway, and those pathways have been shown to be closely associated with promoting the acquired EGFR-TKI resistance and the TME [4, 45, 46].
We then identified 19 common DEGs that were involved in the immune score group and the EGFR-TKI resistance cohort GSE123066. Five of these common DEGs were proved to be related with the overall survival. CENPF, CYSLTR1, GLDN, PIGR and SCGB3A1 were selected as the prognostic biomarkers associated with TME immune cell infiltration and the acquired EGFR-TKI resistance.
We are particularly interested in CENPF which is the expression up-regulated in the low immune score group and EGFR-TKI resistance samples, and the expression level of CENPF was negatively related with the overall survival for LUAD. Centromere Protein F (CENPF) is related to the cell cycle and cell proliferation in several malignant tumors [47]. A previous study showed that the high expression level of CENPF in NSCLC indicated a poor clinical prognosis [48].
To further identify the functions of CENPF in LUAD, we performed KEGG enrichment by GSEA method. The result showed that small cell lung cancer and the ErbB signalling pathway were obviously enriched in CENPF high expression phenotype. These results are consistent with the GSE123066 KEGG analysis results, indicating that the high expression level of CENPF is related to the promotion of acquired EGFR-TKI resistance. Additionally, 45 core genes were identified in the enrichment of the ErbB signalling pathway, and 10 hub genes (i.e., HRAS, KRAS, AKT1, MAPK1, MTOR, MAP2K1, GRB2, SHC1, MYC, AKT2) were screened according to the Cytoscape plug-in cytoHubba. The mutations of KRAS, AKT1 and MAPK1 have been reported as bypass mutations which are another common mechanism of the acquired EGFR-TKI resistance that can activate the same key downstream effectors as EGFR, thereby promoting the growth and survival of tumor cells [45, 49]. Downstream of PI3K-AKT, increased mTOR expression is related to EGFR-TKI resistance in clinical samples [50].
The TIMER database shows that the high level of B cell infiltration is associated with good cumulative survival rate, and there is a significant negative correlation between the CENPF expression and the B cell infiltration. These findings indicate that CENPF may regulate the immune cell infiltration in LUAD. Furthermore, the CENPF expression was positively related with PIK3CA, KRAS, BRAF and IGF1R which are bypass mutations identified in acquired EGFR-TKI resistance patients, and all of them predicted a poor response to EGFR-TKI therapy [51-54]. These results validate the probable function of CENPF in promoting acquired EGFR-TKI resistance.
In conclusion, we extracted a series of genes related to the tumor microenvironment based on the immune score calculated by the ESTIMATE algorithm. Then we used GEO dataset to filter out genes related to EGFR-TKI resistance. Survival analysis and Cox hazards regression analysis were performed to validate prognostic value. Finally, we systematically identified that CENPF, CYSLTR1, GLDN, PIGR and SCGB3A1 are novel independent prognostic biomarkers associated with acquired EGFR-TKI resistance and immune infiltration for LUAD patients. Furthermore, GSEA analysis and TIMER2.0 were performed to detect the correlation of CENPF with bypass genes and tumor-infiltrating immune cells. However, further mechanism investigation has not been conducted, we believe these genes may provide novel insights for new targets to overcome EGFR-TKI resistance and regulation of the immune infiltration in LUAD.
Abbreviations
BP: biological process; CC: cell component; DEG: Differentially expressed gene; EGFR: epidermal growth factor receptor; FDR: false discovery rate; GEO: Gene Expression Omnibus; GO: gene ontology; KEGG: Kyoto Encyclopedia of Genes and Genomes; LUAD: Lung adenocarcinoma; TCGA: The Cancer Genome Atlas; TKI: tyrosine kinase inhibitor; MF: molecular function; NSCLC: Non-small cell lung cancer; OS: Overall survival; PPI: protein-protein interaction; PD-1: programmed death-1; PD-L1: programmed death-ligand 1; ROC: receiver operating characteristic.
Acknowledgements
This work was funded by the National Natural Science Foundation of China (Grant No. 81572288), the Key Project of International Cooperation of Science and Technology Innovation between Governments, the National Key Research and Development Plan of China (Grant No. 2016YEE0103400).
Data availability statement
All the data used in this study were publicly available at The Cancer Genome Atlas portal (TCGA, https://portal.gdc.cancer.gov/) and Gene Expression Omnibus (GEO, https://www.ncbi.nlm.nih.gov/geo/).
Ethical Statement
This article does not contain any studies with human participants or animals performed by any of the authors.
Author Contributions
WJ-C and QH-Z conceived and designed the study. WJ-C, W-L and ZK-L collected and analyzed the data. WJ-C, GZ-M and YF-D wrote the manuscript. ZK-L and W-L reviewed the draft. LL-Z prepared Figures and Tables. All authors have read and agreed to the published version of the manuscript.
Competing Interests
The authors have declared that no competing interest exists.
References
1. Siegel RL, Miller KD, Jemal A. Cancer statistics, 2020. CA Cancer J Clin. 2020;70:7-30
2. Herbst RS, Morgensztern D, Boshoff C. The biology and management of non-small cell lung cancer. Nature. 2018;553:446-54
3. Hirsch FR, Scagliotti GV, Mulshine JL, Kwon R, Curran WJ Jr, Wu YL. et al. Lung cancer: current therapies and new targeted treatments. Lancet. 2017;389:299-311
4. Wu YL, Zhou C, Liam CK, Wu G, Liu X, Zhong Z. et al. First-line erlotinib versus gemcitabine/cisplatin in patients with advanced EGFR mutation-positive non-small-cell lung cancer: analyses from the phase III, randomized, open-label, ENSURE study. Ann Oncol. 2015;26:1883-9
5. Duma N, Santana-Davila R, Molina JR. Non-Small Cell Lung Cancer: Epidemiology, Screening, Diagnosis, and Treatment. Mayo Clin Proc. 2019;94:1623-40
6. Westover D, Zugazagoitia J, Cho BC, Lovly CM, Paz-Ares L. Mechanisms of acquired resistance to first- and second-generation EGFR tyrosine kinase inhibitors. Ann Oncol. 2018;29:i10-i9
7. Wu SG, Shih JY. Management of acquired resistance to EGFR TKI-targeted therapy in advanced non-small cell lung cancer. Mol Cancer. 2018;17:38
8. Mitsudomi T, Morita S, Yatabe Y, Negoro S, Okamoto I, Tsurutani J. et al. Gefitinib versus cisplatin plus docetaxel in patients with non-small-cell lung cancer harbouring mutations of the epidermal growth factor receptor (WJTOG3405): an open label, randomised phase 3 trial. Lancet Oncol. 2010;11:121-8
9. Soria JC, Ohe Y, Vansteenkiste J, Reungwetwattana T, Chewaskulyong B, Lee KH. et al. Osimertinib in Untreated EGFR-Mutated Advanced Non-Small-Cell Lung Cancer. N Engl J Med. 2018;378:113-25
10. Hanahan D, Coussens LM. Accessories to the crime: functions of cells recruited to the tumor microenvironment. Cancer Cell. 2012;21:309-22
11. Quail DF, Joyce JA. Microenvironmental regulation of tumor progression and metastasis. Nat Med. 2013;19:1423-37
12. Ahn MJ, Sun JM, Lee SH, Ahn JS, Park K. EGFR TKI combination with immunotherapy in non-small cell lung cancer. Expert Opin Drug Saf. 2017;16:465-9
13. Wu T, Dai Y. Tumor microenvironment and therapeutic response. Cancer Lett. 2017;387:61-8
14. Li Y, Liang L, Dai W, Cai G, Xu Y, Li X. et al. Prognostic impact of programed cell death-1 (PD-1) and PD-ligand 1 (PD-L1) expression in cancer cells and tumor infiltrating lymphocytes in colorectal cancer. Mol Cancer. 2016;15:55
15. Teng MW, Ngiow SF, Ribas A, Smyth MJ. Classifying Cancers Based on T-cell Infiltration and PD-L1. Cancer Res. 2015;75:2139-45
16. Herbst RS, Baas P, Kim DW, Felip E, Perez-Gracia JL, Han JY. et al. Pembrolizumab versus docetaxel for previously treated, PD-L1-positive, advanced non-small-cell lung cancer (KEYNOTE-010): a randomised controlled trial. Lancet. 2016;387:1540-50
17. Rittmeyer A, Barlesi F, Waterkamp D, Park K, Ciardiello F, von Pawel J. et al. Atezolizumab versus docetaxel in patients with previously treated non-small-cell lung cancer (OAK): a phase 3, open-label, multicentre randomised controlled trial. Lancet. 2017;389:255-65
18. Gainor JF, Shaw AT, Sequist LV, Fu X, Azzoli CG, Piotrowska Z. et al. EGFR Mutations and ALK Rearrangements Are Associated with Low Response Rates to PD-1 Pathway Blockade in Non-Small Cell Lung Cancer: A Retrospective Analysis. Clin Cancer Res. 2016;22:4585-93
19. Peng S, Wang R, Zhang X, Ma Y, Zhong L, Li K. et al. EGFR-TKI resistance promotes immune escape in lung cancer via increased PD-L1 expression. Mol Cancer. 2019;18:165
20. Haratani K, Hayashi H, Tanaka T, Kaneda H, Togashi Y, Sakai K. et al. Tumor immune microenvironment and nivolumab efficacy in EGFR mutation-positive non-small-cell lung cancer based on T790M status after disease progression during EGFR-TKI treatment. Ann Oncol. 2017;28:1532-9
21. Han JJ, Kim DW, Koh J, Keam B, Kim TM, Jeon YK. et al. Change in PD-L1 Expression After Acquiring Resistance to Gefitinib in EGFR-Mutant Non-Small-Cell Lung Cancer. Clin Lung Cancer. 2016;17:263-70 e2
22. Yoshihara K, Shahmoradgoli M, Martinez E, Vegesna R, Kim H, Torres-Garcia W. et al. Inferring tumour purity and stromal and immune cell admixture from expression data. Nat Commun. 2013;4:2612
23. Reticker-Flynn NE, Engleman EG. Cancer systems immunology. Elife. 2020;9:e53839
24. Xu N, Ke ZB, Lin XD, Chen YH, Wu YP, Chen Y. et al. Development and validation of a molecular prognostic index of bladder cancer based on immunogenomic landscape analysis. Cancer Cell Int. 2020;20:302
25. Yi L, Wu G, Guo L, Zou X, Huang P. Comprehensive Analysis of the PD-L1 and Immune Infiltrates of m(6)A RNA Methylation Regulators in Head and Neck Squamous Cell Carcinoma. Mol Ther Nucleic Acids. 2020;21:299-314
26. Zeng D, Ye Z, Wu J, Zhou R, Fan X, Wang G. et al. Macrophage correlates with immunophenotype and predicts anti-PD-L1 response of urothelial cancer. Theranostics. 2020;10:7002-14
27. Huo Q, Li Z, Cheng L, Yang F, Xie N. SIRT7 Is a Prognostic Biomarker Associated With Immune Infiltration in Luminal Breast Cancer. Front Oncol. 2020;10:621
28. Foltz SM, Gao Q, Yoon CJ, Sun H, Yao L, Li Y. et al. Evolution and structure of clinically relevant gene fusions in multiple myeloma. Nat Commun. 2020;11:2666
29. Sun L, Jiang G, Gonzalez-Rivas D, Zhang P. An individualized immune prognostic signature in lung adenocarcinoma. Cancer Cell Int. 2020;20:156
30. Ritchie ME, Phipson B, Wu D, Hu Y, Law CW, Shi W. et al. limma powers differential expression analyses for RNA-sequencing and microarray studies. Nucleic Acids Res. 2015;43:e47
31. Yu G, Wang LG, Han Y, He QY. clusterProfiler: an R package for comparing biological themes among gene clusters. OMICS. 2012;16:284-7
32. Gyorffy B, Surowiak P, Budczies J, Lanczky A. Online survival analysis software to assess the prognostic value of biomarkers using transcriptomic data in non-small-cell lung cancer. PLoS One. 2013;8:e82241
33. Uhlen M, Zhang C, Lee S, Sjostedt E, Fagerberg L, Bidkhori G. et al. A pathology atlas of the human cancer transcriptome. Science. 2017;357:6352
34. Szklarczyk D, Franceschini A, Wyder S, Forslund K, Heller D, Huerta-Cepas J. et al. STRING v10: protein-protein interaction networks, integrated over the tree of life. Nucleic Acids Res. 2015;43:D447-52
35. Doncheva NT, Morris JH, Gorodkin J, Jensen LJ. Cytoscape StringApp: Network Analysis and Visualization of Proteomics Data. J Proteome Res. 2019;18:623-32
36. Li T, Fu J, Zeng Z, Cohen D, Li J, Chen Q. et al. TIMER2.0 for analysis of tumor-infiltrating immune cells. Nucleic Acids Res. 2020;48:W509-W14
37. Li T, Fan J, Wang B, Traugh N, Chen Q, Liu JS. et al. TIMER: A Web Server for Comprehensive Analysis of Tumor-Infiltrating Immune Cells. Cancer Res. 2017;77:e108-e10
38. Shimizu K, Iyoda T, Okada M, Yamasaki S, Fujii SI. Immune suppression and reversal of the suppressive tumor microenvironment. Int Immunol. 2018;30:445-54
39. Altorki NK, Markowitz GJ, Gao D, Port JL, Saxena A, Stiles B. et al. The lung microenvironment: an important regulator of tumour growth and metastasis. Nat Rev Cancer. 2019;19:9-31
40. Belli C, Trapani D, Viale G, D'Amico P, Duso BA, Della Vigna P. et al. Targeting the microenvironment in solid tumors. Cancer Treat Rev. 2018;65:22-32
41. Bremnes RM, Busund LT, Kilvaer TL, Andersen S, Richardsen E, Paulsen EE. et al. The Role of Tumor-Infiltrating Lymphocytes in Development, Progression, and Prognosis of Non-Small Cell Lung Cancer. J Thorac Oncol. 2016;11:789-800
42. Zhang D, Chen Z, Wang DC, Wang X. Regulatory T cells and potential inmmunotherapeutic targets in lung cancer. Cancer Metastasis Rev. 2015;34:277-90
43. Wang Y, Zhang T, Guo L, Ren T, Yang Y. Stromal extracellular matrix is a microenvironmental cue promoting resistance to EGFR tyrosine kinase inhibitors in lung cancer cells. Int J Biochem Cell Biol. 2019;106:96-106
44. Sun L, Dong Y, Zhao J, Yin Y, Tong B, Zheng Y. et al. NPPB modulates apoptosis, proliferation, migration and extracellular matrix synthesis of conjunctival fibroblasts by inhibiting PI3K/AKT signaling. Int J Mol Med. 2018;41:1331-8
45. Ercan D, Xu C, Yanagita M, Monast CS, Pratilas CA, Montero J. et al. Reactivation of ERK signaling causes resistance to EGFR kinase inhibitors. Cancer Discov. 2012;2:934-47
46. Sordella R, Bell DW, Haber DA, Settleman J. Gefitinib-sensitizing EGFR mutations in lung cancer activate anti-apoptotic pathways. Science. 2004;305:1163-7
47. Sun J, Huang J, Lan J, Zhou K, Gao Y, Song Z. et al. Overexpression of CENPF correlates with poor prognosis and tumor bone metastasis in breast cancer. Cancer Cell Int. 2019;19:264
48. Li R, Wang X, Zhao X, Zhang X, Chen H, Ma Y. et al. Centromere protein F and Forkhead box M1 correlation with prognosis of non-small cell lung cancer. Oncol Lett. 2020;19:1368-74
49. Nagano T, Tachihara M, Nishimura Y. Mechanism of Resistance to Epidermal Growth Factor Receptor-Tyrosine Kinase Inhibitors and a Potential Treatment Strategy. Cells. 2018;7:212
50. Karachaliou N, Codony-Servat J, Teixido C, Pilotto S, Drozdowskyj A, Codony-Servat C. et al. BIM and mTOR expression levels predict outcome to erlotinib in EGFR-mutant non-small-cell lung cancer. Sci Rep. 2015;5:17499
51. Cortot AB, Repellin CE, Shimamura T, Capelletti M, Zejnullahu K, Ercan D. et al. Resistance to irreversible EGF receptor tyrosine kinase inhibitors through a multistep mechanism involving the IGF1R pathway. Cancer Res. 2013;73:834-43
52. Ohashi K, Sequist LV, Arcila ME, Moran T, Chmielecki J, Lin YL. et al. Lung cancers with acquired resistance to EGFR inhibitors occasionally harbor BRAF gene mutations but lack mutations in KRAS, NRAS, or MEK1. Proc Natl Acad Sci U S A. 2012;109:E2127-33
53. Sequist LV, Waltman BA, Dias-Santagata D, Digumarthy S, Turke AB, Fidias P. et al. Genotypic and histological evolution of lung cancers acquiring resistance to EGFR inhibitors. Sci Transl Med. 2011;3:75ra26
54. Yu HA, Arcila ME, Rekhtman N, Sima CS, Zakowski MF, Pao W. et al. Analysis of tumor specimens at the time of acquired resistance to EGFR-TKI therapy in 155 patients with EGFR-mutant lung cancers. Clin Cancer Res. 2013;19:2240-7
Author contact
![]() Corresponding author: Qinghua Zhou zhouqh135com
Corresponding author: Qinghua Zhou zhouqh135com