Impact Factor ISSN: 1837-9664

 Global reach, higher impact
J Cancer 2021; 12(13):4025-4038. doi:10.7150/jca.52105 This issue Cite
Research Paper
Identification of the hub genes and prognostic indicators of gastric cancer and correlation of indicators with tumor-infiltrating immune cell levels
Yun Ji1,2, Lu Gao1,2, Can Zhang1,2, Xu Sun4, Liping Dai2, Zhenyu Ji2, Jianying Zhang2, Zhida Zhang1,2, Wei Cao3, Yang Zhao2 ![]() , Liguo Zhang2,3
, Liguo Zhang2,3 ![]()
1. BGI College, Zhengzhou University, No. 40 Daxue Road, Zhengzhou 450007, China.
2. Henan Institute of Medical and Pharmaceutical Science, Zhengzhou University, No. 40 Daxue Road, Zhengzhou 450052, China.
3. Zhengzhou Central Hospital Affiliated to Zhengzhou University, Zhengzhou University, Zhengzhou 450000, China.
4. Integrated TCM and Western Medicine Department, Affiliated Cancer Hospital of Zhengzhou University, Zhengzhou 450008, China.
Received 2020-8-18; Accepted 2021-4-25; Published 2021-5-13
Abstract

Aims: To identify the hub genes and prognostic indicators of gastric cancer (GC) and determine the correlation between prognostic indicators and the tumor-infiltrating immune cell levels so as to provide useful information for future GC diagnosis and treatment.
Methods: The Cancer Genome Atlas (TCGA) stomach adenocarcinoma dataset and two microarray datasets were used to screen the overlapping differentially expressed genes (DEGs) between normal gastric and GC tissue samples. Hub genes were screened via protein-protein interaction networks and module analysis of the overlapping DEGs. Their expression was validated at the cell level and tissue level using the ONCOMINE database. The prognostic indicators of overall survival (OS) and disease-free survival was identified by Cox proportional hazards regression analysis based on tumor grade and cancer stage. The expression of hub genes was validated at the cell level. The correlation of prognostic indicators with the tumor-infiltrating immune cell levels was analyzed using Tumor IMmune Estimation Resource.
Results: Ten hub genes, namely CDC6, CDC20, BUB1B, TOP2A, CDK1, AURKA, CCNA2, CCNB1, MAD2L1, and KIF11, were screened and their upregulation in the GC tissue was verified. Three prognostic factors, namely LUM, VCAN, and EFNA4, were identified; their expression was higher in GC cells than in normal cells. LUM, VCAN, and EFNA4 were correlated with tumor-infiltrating immune cell levels in GC.
Significance: The identified hub genes and prognostic indicators of GC could be useful indicators for future GC diagnosis and treatment.
Keywords: gastric cancer, differentially expressed genes, Hub gene, prognostic indicators, tumor-infiltrating immune cells
Introduction
Gastric cancer (GC) is one of the most common malignant tumors worldwide and the third leading cause of cancer-related mortality after lung and breast cancers [1]. The Global Cancer Statistics 2018 report stated that there were over 1,000,000 new GC cases and that approximately 8% of patients with GC died in 2018 [2]. The high mortality rate associated with GC is owing to its insidious onset, i.e., early symptoms are not obvious. Most patients with GC are diagnosed at the advanced stage; their 5-year overall survival (OS) is only 28.3% [3]. However, to date, the aspects ultimately affecting the occurrence, development, and prognosis of GC remain unclear.
Most researchers use bioinformatic methods to study microarray and RNA-sequencing (RNA-seq) data to identify the prognostic indicators and therapeutic targets associated with GC. Cao et al. used the Gene Expression Omnibus (GEO) dataset and subsequently identified key diagnostic genes and determined the pathways playing significant roles in GC progression [4]. Fei et al. identified the important prognostic indicators and pathways for GC treatment using the GEO dataset by identifying overlapping differentially expressed genes (DEGs) [5]. However, analysis on the related makers are inadequate and even contradictory owing to their different data processing methods or different sample sizes [6, 7]. Nevertheless, a comprehensive bioinformatic method has been applied in the research of various cancers and a large amount of valuable biological information has been discovered; this has made it possible to find useful and reliable molecular markers [8].
In this study, we performed comprehensive bioinformatics analysis to simultaneously analyze two microarray datasets and RNA-seq data of human GC and normal gastric tissue samples so as to identify the hub genes and prognostic indicators of GC. Further, the correlation between the identified novel prognostic indicators and tumor-infiltrating immune cell levels was verified to identify the possible role of these indicators in cancer immunoregulation.
Methods
Data and sources
A set of RNA-seq data of GC was downloaded from The Cancer Genome Atlas (TCGA). UCSC Xena database (http://xena.ucsc.edu/) which contains normal stomach tissues and TCGA-STAD tissues was utilized. Another three gene expression arrays of human GC datasets (GSE13911, GSE79973 and GSE56807) [9-11] were obtained from GEO. Further, the clinicopathological information and survival data of 443 patients with GC were obtained from TCGA. For further analysis, considering the factors that are not associated with disease mortality may bias the survival analysis, samples with a survival time of less than 90 days as well as those without gender, age, tumor pathological stage, and corresponding transcriptome data were eliminated. Finally, 317 samples that met the admission criteria were included in this study. Additionally, the disease-free survival (DFS) data of 246 patients with stomach adenocarcinoma (STAD) were acquired from cBioPortal (https://www.cbioportal.org/).
Identification of DEGs
DEGs were identified by comparing the normalized expression data of GC and adjacent normal tissues using the limma package in R software. DEG intersection was performed in three datasets, and |log2FC| ≥ 1, P-value of <0.05, and adjusted P-value of <0.05 were considered statistically significant. The method of adjusted P-value was Benjamini & Hochberg (BH). The expression of overlapping DEGs was based on that of STAD in TCGA.
Functional enrichment analysis of overlapping DEGs
To determine the biological functions and potential signaling pathways of overlapping DEGs, Gene Ontology (GO) and Kyoto Encyclopedia of Genes and Genomes (KEGG) pathway enrichment analyses were performed using the clusterProfiler [12] and org.Hs.eg.db [13] packages in R. The cutoff criteria were a P-value of <0.01 and an adjusted P-value of <0.05.
Hub genes and module analysis
The protein-protein interaction (PPI) network analysis of overlapping DEGs was performed using the STRING database [14]. A confidence score of ≥0.41 was selected to construct the PPI network with overlapping DEGs in Cytoscape version 3.7.1. CytoHubba [15] and Molecular Complex Detection [16] were used to screen the hub genes and perform module analysis, respectively.
ONCOMINE analysis
The ONCOMINE (www.oncomine.org) database was used to validate the expression of the 10 hub genes at the tissue level. In this study, a P-value of 0.05, a fold change of 2, and a gene rank in the top 10% were set as the significance thresholds. The data type was mRNA, and the Student's t-test was used to analyze the differences in the expression of the 10 hub genes in GC.
Survival analysis and establishment of the prognostic model
The data of 317 patients with GC, including the expression of overlapping DEGs, survival time (>90 days), and survival rate, were analyzed using the R package “survival” (R package version 2.38, https://CRAN.R-project.org/package=survival) in order to perform univariate Cox proportional hazards regression analysis. To identify prognostic indicators, overlapping DEGs with a P-value of <0.05 related to survival were selected as candidate genes and used for multiple Cox proportional hazards regression analysis. The following function was used: risk score = expression of gene1 × β1gene1 + expression of gene2 × β2gene2 + … expression of gene(n) × β(n)gene(n) [17]. Patients were classified into low-risk and high-risk groups based on their median prognostic risk score. Protective genes [hazard ratio (HR) < 1] or risk genes (HR > 1) were identified by calculating HR and 95% confidence interval (CI). The R package “survivalROC,” which performs time-dependent receiver operating characteristic curve analysis on 5-year OS data, was used to evaluate the performance of the prognostic model. A survival curve was generated using “survival” and “survminer.” The R software (version 3.6.1) was used for all statistical analyses. The survival package in R was used to explore the DFS of single gene signatures as potential prognostic genes. Based on the median expression of target genes, patients were divided into low-expression and high-expression groups.
UALCAN analysis and Gene Expression Profiling Interactive Analysis (GEPIA2)
The relative expression of three prognostic genes, namely VCAN, EFNA4, and LUM, in different tumor subgroups based on clinicopathological criteria, such as tumor stage and tumor grade, were analyzed using UALCAN [18] (http://ualcan.path.uab.edu/). GEPIA2 was used to study the survival rate of patients based on the expression of 13 prognostic genes, including the three prognostic genes with different isoforms (VCAN, EFNA4, and LUM) [19].
Analysis of tumor-infiltrating immune cells
Tumor IMmune Estimation Resource (TIMER), an online tool, with Spearman's method, was used to determine the potential correlation between prognostic genes and tumor-infiltrating immune cells, including B cells, CD4+ T cells, CD8+ T cells, neutrophils, macrophages, and dendritic cells [20] (https://cistrome.shinyapps.io/timer/).
Cell lines and cell culture
Two GC cell lines (SGC-7901 and MGC-803) and a normal human gastric mucosal cell line (GES-1) were purchased from the Chinese National Infrastructure of Cell Line Resource. The MGC-803 and GES-1 cell lines were cultured in 90% Dulbecco's Modified Eagle's medium (Invitrogen, Carlsbad, USA) supplemented with 10% fetal bovine serum (HyClone, USA). The SGC-7901 line was cultured in 90% RPMI-1640 (Invitrogen, Carlsbad, USA), supplemented with 10% fetal bovine serum (HyClone, USA).
Real-time quantitative PCR
Total RNA was isolated from whole-cell lysates using the TRIzol reagent (Solarbio, China). cDNAs were synthesized using the PrimeScriptTM RT Reagent Kit (TaKaRa, USA) with the gDNA Eraser. Real-time quantitative PCR was performed using TB Green Premix Ex TaqTM II (Tli RNaseH Plus, TaKaRa, USA). GAPDH was used as an endogenous control. The details of the primers are outlined in Additional file 1: Supplementary Table S1.
Results
DEG identification from the three datasets
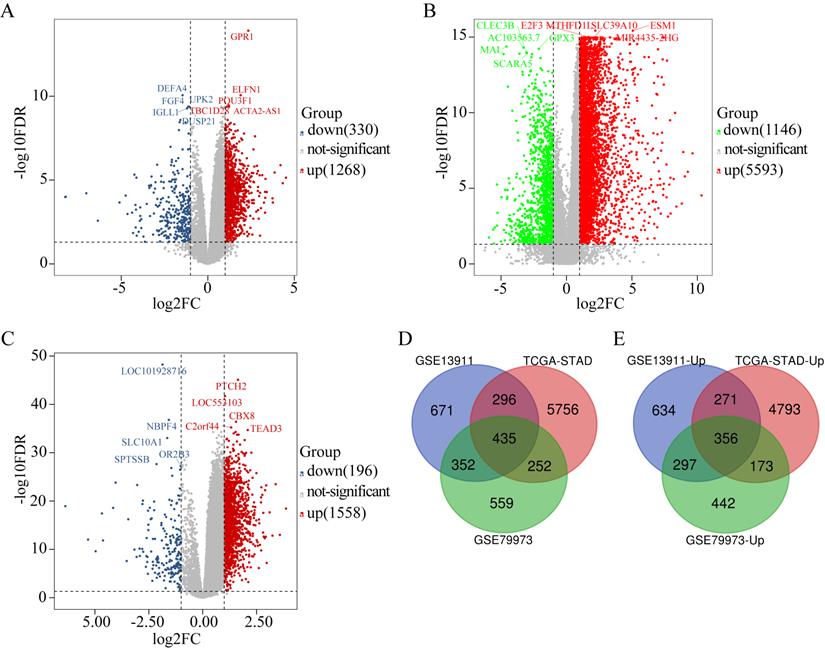
The DEGs obtained from GSE79973 included 1268 upregulated genes and 330 downregulated genes (Figure 1A). The DEGs obtained from the TCGA GC dataset included 5593 upregulated genes and 1146 downregulated genes (Figure 1B). Further, the DEGs obtained from GSE13911 included 1558 upregulated genes and 196 downregulated genes (Figure 1C). A total of 435 overlapping DEGs, including 356 upregulated genes (Figure 1E) and 79 downregulated genes, were identified by intersecting the DEGs obtained from the two microarrays and RNA-seq data analysis (Figure 1D).
Identification of DEGs in GC (|log2FC| ≥ 1, P < 0.05). (A) The volcano maps of 1268 up-regulated genes (red dots) and 330 down-regulated genes (blue dots) in the microarray dataset GSE79973; (B) The volcano maps of 5593 up-regulated genes (red dots) and 1146 down-regulated genes (green dots) from the TCGA GC dataset; (C) The volcano maps of 1558 up-regulated genes (red dots) and 196 down-regulated genes (blue dots) in the microarray dataset GSE13911; (D) Venn diagrams of the DEGs between the microarray dataset GSE79973, the microarray dataset GSE13911 and the TCGA GC dataset. (E) Venn diagrams of the up-regulated DEGs between the microarray dataset GSE79973, the microarray dataset GSE13911, and the TCGA GC dataset.
Functional enrichment analysis of DEGs
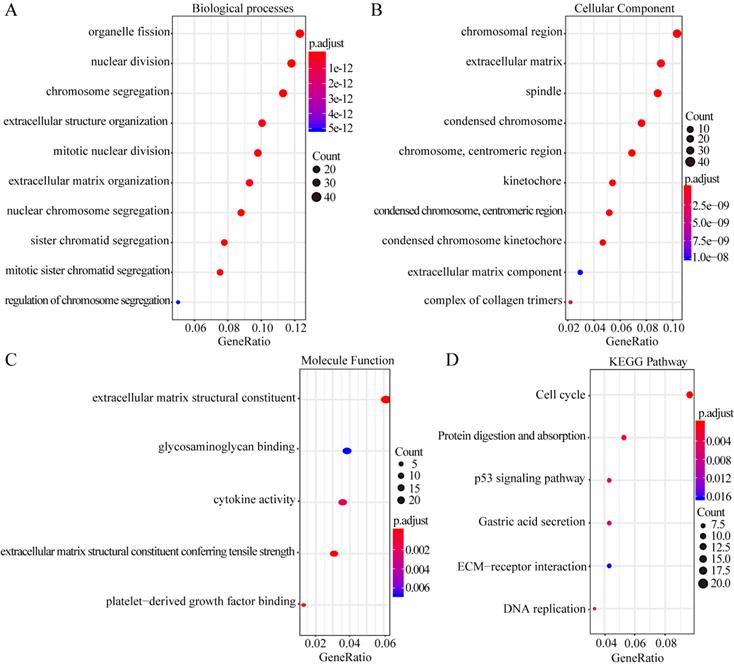
GO enrichment analysis of the biological processes indicated that the overlapping DEGs were mainly enriched in organelle fission, nuclear division, chromosome segregation, extracellular structure organization, and extracellular matrix organization (Figure 2A). Enrichment of cellular component GO terms showed that the 435 overlapping DEGs were mainly enriched in the chromosomal regions, extracellular matrix, and spindle cell components (Figure 2B). In addition, enrichment of molecular function GO terms showed that the main molecular functions of these overlapping DEGs were cytokine activity, glycosaminoglycan binding, and structural component formation in the extracellular matrix (Figure 2C). KEGG pathway analysis revealed that the overlapping DEGs participate in diverse metabolism-associated signaling pathways, including the cell cycle, DNA replication, protein digestion and absorption, p53 signaling, gastric acid secretion, and ECM-receptor interactions. The cell-cycle pathway is the main pathway enriched by the overlapping DEGs (Figure 2D).
GO enrichment and KEGG pathway analysis of the overlapping DEGs. Biological process GO terms for overlapping DEGs (A), Cellular component GO terms for overlapping DEGs, and (B) Molecular function GO terms for overlapping DEGs (C).The y-axis shows significantly enriched GO terms, and the x-axis shows different gene ratios. The different colors and sizes of the circles represent different P-value ranges and contents. The rich factor refers to the ratio of the number of DEGs enriched in a GO term to the number of all the annotated genes enriched in the GO term. In enriched KEGG pathways of DEGs, (D) the y-axis shows enriched pathways, and the x-axis shows different gene ratios; the different colors and sizes of the circles represent different P-value ranges and contents. The rich factor refers to the ratio of the number of DEGs enriched in a KEGG pathway to the number of all the annotated genes enriched in the KEGG pathway.
Identification of hub genes and key module
The overlapping DEGs were analyzed via PPI network analysis and 380 nodes and 5491 edges were identifieds. Topological feature analysis of the overlapping DEGs led to the identification of 10 hub genes, namely CCNB1, CDK1, MAD2L1, AURKA, BUB1B, CCNA2, CDC6, KIF11, TOP2A, and CDC20 (Figure 3A). Within this PPI network, 13 modules were obtained via module analysis. The highest scoring module was module 1 (Figure 3A), with a score greater than five times that of the other modules. Additionally, the 10 candidate hub nodes were mainly included in module 1 with all overexpressed genes. This indicates that module 1 represents the key biological characteristics of the PPI network.
Hub clustering module1and KEGG analysis. (A) Module 1 (MCODE score = 77.095). (B, C) KEGG analysis for genes in Module 1. All circles represent up-regulated genes, and red circles represent hub genes.
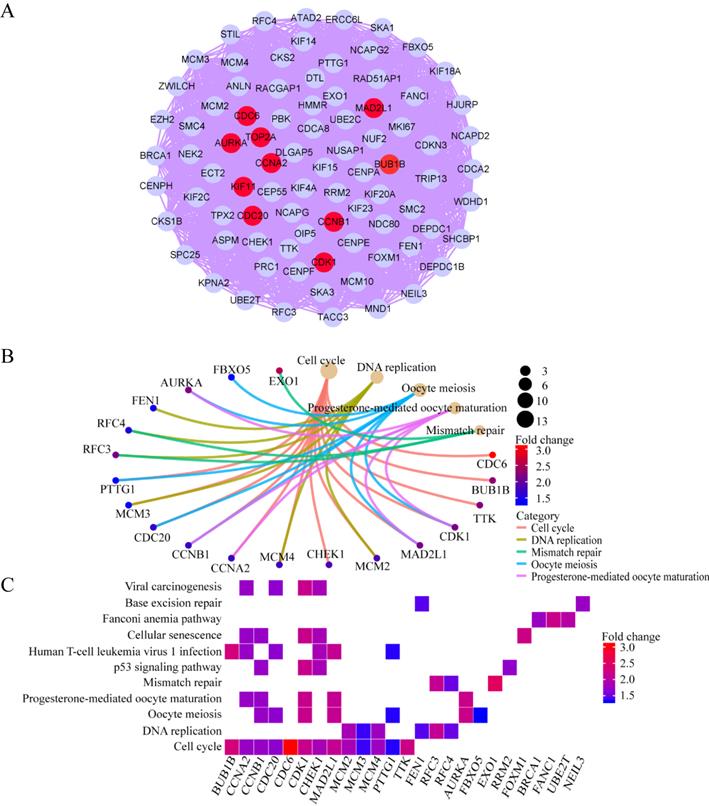
GO enrichment analysis revealed that the functions of the genes involved in module 1 are notably enriched in ATPase activity, histone kinase activity, nuclear division, chromosome segregation, the chromosome centromeric region, and spindles. KEGG enrichment analysis revealed that the cell cycle, DNA replication, and oocyte meiosis pathways are the main pathways enriched by the genes in module 1. Among the 10 hub genes, 7 (CCNB1, CDK1, MAD2L1, BUB1B, CCNA2, CDC6, and CDC20) are included in module 1 and are enriched in the cell-cycle pathway (Figure 3B and C). This finding further verifies that the hub genes in module 1 could be closely correlated with the cell cycle.
Verification of the expression levels of the 10 hub genes
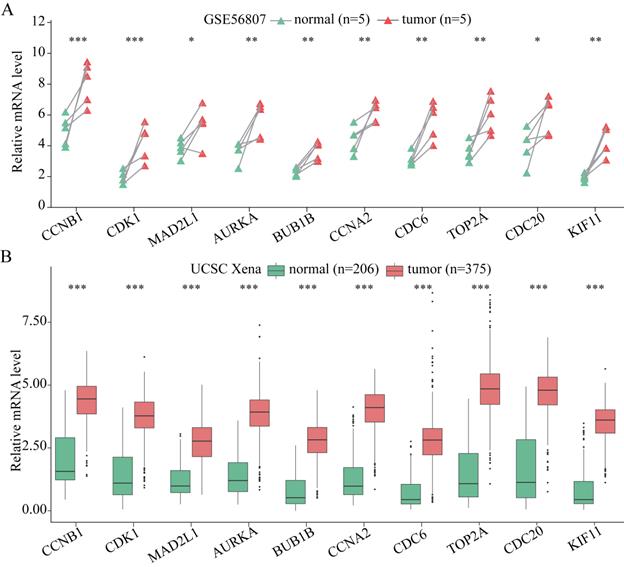
The expression of the 10 hub genes identified for GC was analyzed at the tissue level via using the ONCOMINE database. As shown in Figure S1, these 10 hub genes were shown to be obviously upregulated in GC samples, except for KIF11. The expression of KIF11 in GC tissue is not particularly significant, although its FC (2.04 listed in Table S2) is still more than 2. Therefore, the expression of KIF11 indicates that it is still upregulated in GC tissue, even though the expression is not significant. Moreover, the expression of these 10 hub genes was verified using GSE56807 dataset and the dataset from UCSC Xena database which is integrated with TCGA and GTEx. As shown in Figure 4, the expression of all the 10 hub genes were demonstrated to be significantly upregulated in GC samples.
The expression of the 10 hub genes in GC and normal gastric tissues datasets. (A) The expression of the 10 hub genes in GSE56807 dataset with paired 5 GC and 5 normal gastric tissues samples. (B) The expression of the 10 hub genes in the integrated 206 normal gastric tissues samples and 375 GC tissues samples from UCSC Xena database. Expression values of genes are log2-transformed. *P< 0.05; **P < 0.01; ***P < 0.001.
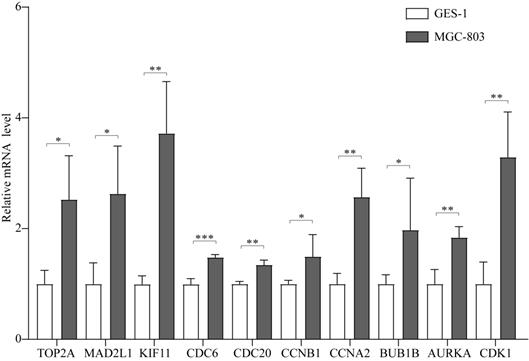
In addition, the expression of these 10 hub genes was verified in MGC-803 and GES-1 cells, as shown in Figure 5. All the 10 hub genes were demonstrated to be significantly upregulated in GC cells compared with that in normal cells. Their expression in GC cells was consistent with that in GC tissues, confirming that these genes are upregulated in GC.
The expression of the 10 hub genes in the GES-1 and MGC-803 cell lines. *P < 0.05; **P < 0.01; ***P < 0.001.
Identification of prognostic gene signatures
The results of univariate Cox proportional hazard regression model analysis revealed that approximately 42 genes were found to be significantly related to survival time (P < 0.05). Multivariate Cox proportional hazard regression model analysis revealed that the prognostic gene signature contained the following 13 genes: LINC01094, CKMT2, LUM, PSCA, TFF1, FAP, VCAN, FEN1, CTHRC1, CDC6, PRRX1, EFNA4, and PMEPA1 (Table 1).
Prognostic value of the 13 genes in the GC patients of the TCGA cohort
| Gene symbol | Univariate analysis | Multivariate analysis | |||
|---|---|---|---|---|---|
| HR (95% CI) | P-value | HR (95% CI) | P-value | Coefficient | |
| LINC01094 | 1.771 (1.322-2.372) | <0.001 | 1.803 (1.247-2.606) | 0.002 | 0.589 |
| CKMT2 | 1.118 (1.029-1.216) | 0.009 | 1.152 (1.041-1.275) | 0.006 | 0.141 |
| LUM | 1.001 (1.000-1.002) | 0.020 | 0.997 (0.995-1.000) | 0.022 | -0.003 |
| PSCA | 1.001 (1.000-1.001) | 0.002 | 1.001 (1.000-1.001) | 0.093 | 0.001 |
| TFF1 | 1.000 (1.000-1.000) | 0.003 | 1.000 (1.000-1.000) | 0.077 | 0.0002 |
| FAP | 1.071 (1.006-1.142) | 0.033 | 0.835 (0.697-0.999) | 0.048 | -0.181 |
| VCAN | 1.022 (1.008-1.036) | 0.002 | 1.027 (1.001-1.053) | 0.044 | 0.026 |
| FEN1 | 0.968 (0.943-0.994) | 0.015 | 0.969 (0.941-0.997) | 0.032 | -0.032 |
| CTHRC1 | 1.011 (1.004-1.018) | 0.001 | 1.016 (1.003-1.028) | 0.012 | 0.016 |
| CDC6 | 1.004 (1.001-1.007) | 0.015 | 1.007 (1.004-1.011) | 0.000 | 0.007 |
| PRRX1 | 1.052 (1.010-1.096) | 0.015 | 1.083 (0.979-1.197) | 0.120 | 0.080 |
| EFNA4 | 0.965 (0.935-0.997) | 0.031 | 0.970 (0.935-1.005) | 0.096 | -0.031 |
| PMEPA1 | 1.003 (1.000-1.006) | 0.037 | 1.003 (1.000-1.006) | 0.070 | 0.003 |
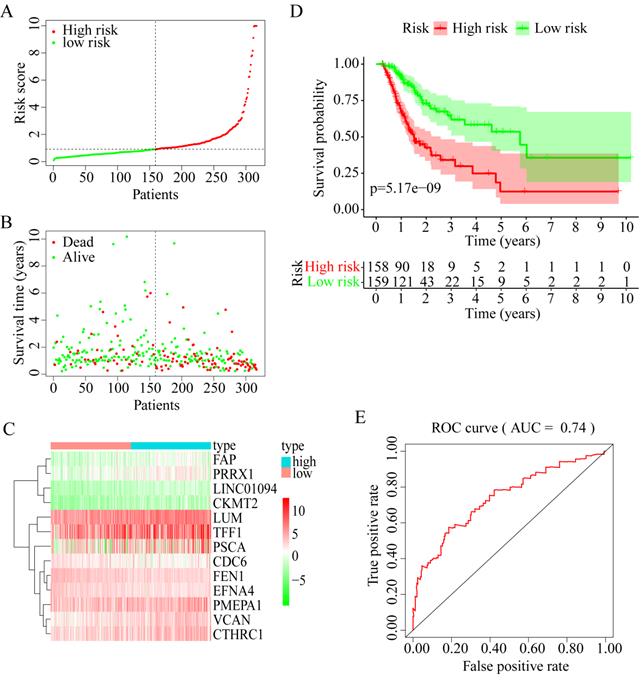
Among these 13 genes, LUM, EFNA4, FEN1, and FAP had an HR of <1 and were considered protective prognostic genes, whereas LINC01094, CKMT2, PRRX1, VCAN, CTHRC1, CDC6, PMEPA1, PSCA, and TFF1 had an HR of >1 and were considered risk prognostic genes. Figure 6A-C shows the prognostic risk score results. OS was significantly different between the high-risk and low-risk groups (P < 0.0001, Figure 6D). In particular, the 5-year OS was 53.52% (95% CI = 40.40-70.90%) in the low-risk group and 12.43% (95% CI = 4.02-38.50%) in the high-risk group. The AUC was 0.74 for 5-year OS, implying that the prognostic gene signature performed well in survival prediction (Figure 6E).
13 prognostic signatures identified from the overlapping 435 DEGs. (A) The risk score distribution. (B) The patients' survival status distribution. (C) The heat map of the 13 genes for low- and high-risk groups. In the heat map, each column represents one sample, and each row represents one gene, and the color gradient ranging from cyan-green to red represents the changing process from down- to upregulation. (D) The Kaplan-Meier curves for low- and high-risk groups. (E) The ROC curves for predicting OS in GC patients by the risk score.
OS and DFS analyses of the 13 genes
OS analysis of the GC samples in TCGA consistently revealed that the OS with VCAN, LUM, EFNA4, and CTHRC1 in low-candidate-gene content groups and high-candidate-gene content groups were different (P < 0.05) (Figure 7A-D).
OS and DFS analysis. (A) OS and DSF analysis of VCAN. (B) OS and DFS analysis of LUM. (C) OS and DFS analysis of EFNA4. (D) OS and DFS analysis of CTHRC1.
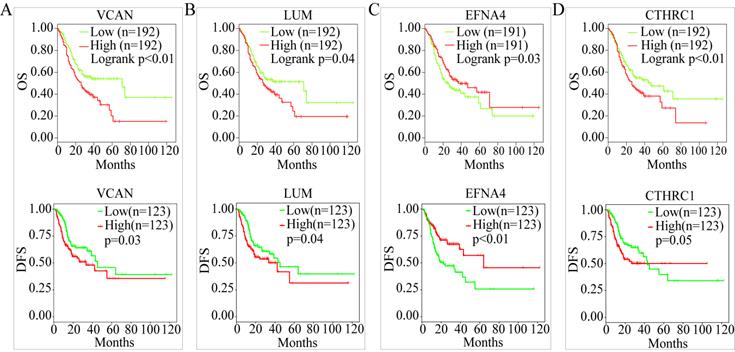
However, there was no difference in the OS with CKMT2, FEN1, PRRX1, LINC01094, FAP, PMEPA1, PSCA, TFF1, and CDC6 (P > 0.05) (Figure S2). Interestingly, DFS analysis of 246 GC samples in TCGA revealed that between the low-candidate-gene content groups and high-candidate-gene content groups, the DFS with VCAN, LUM, and EFNA4 was different (P < 0.05) (Figure 7A-C). Except for FEN1, there was no difference in the DFS with CKMT2, CTHRC1, PRRX1, LINC01094, FAP, PMEPA1, PSCA, TFF1, and CDC6 (P > 0.05) (Figure S3).
Therefore, LUM, VCAN, and EFNA4, with obvious differences in their OS and DFS, were considered potential prognostic genes.
Expressions of the potential prognostic genes in the GC subgroup
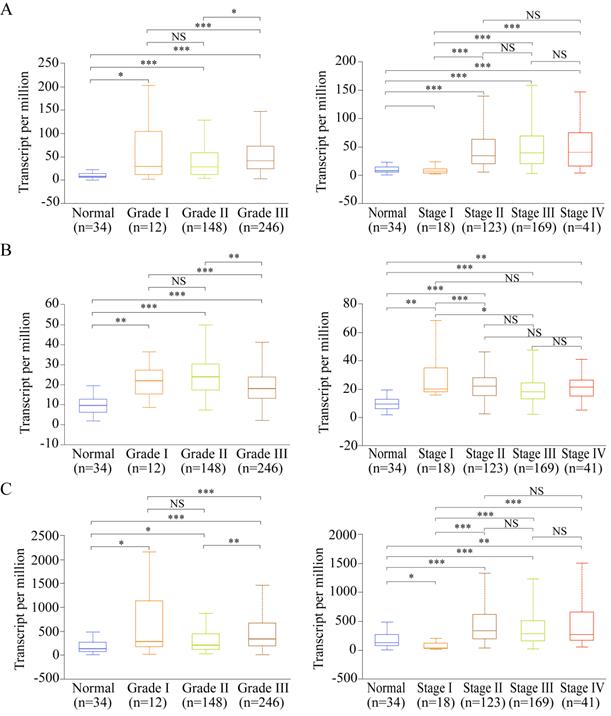
Among the 13 genes, the following three genes had significant differences in both OS and DFS: LUM, EFNA4, and VCAN. Therefore, they were defined as the potential prognostic genes. Based on subgroup analysis using clinicopathological features (tumor grade and cancer stage), we found that VCAN, EFNA4, and LUM have significantly higher expressions in patients with tumor grade than in healthy individuals (Figure 8A-C). Additionally, the expression of VCAN, EFNA4, and LUM was analyzed in each GC stage (I, II, III, and IV). EFNA4 was highly overexpressed in all GC stages, whereas VCAN and LUM were highly overexpressed in GC stages II, III, and IV (Figure 8A-C). Therefore, LUM, EFNA4, and VCAN are considered useful prognostic indicators.
Expression of the potential prognostic genes in GC subgroup. (A) Expression of VCAN in STAD based on tumor grade and individual cancer stage. (B) Expression of EFNA4 in STAD based on tumor grade and individual cancer stage. (C) Expression of LUM in STAD based on tumor grade and individual cancer stage. *P<0.05; **P<0.01; ***P<0.001; NS: not significance.
Construction of prognostic model with three prognostic genes
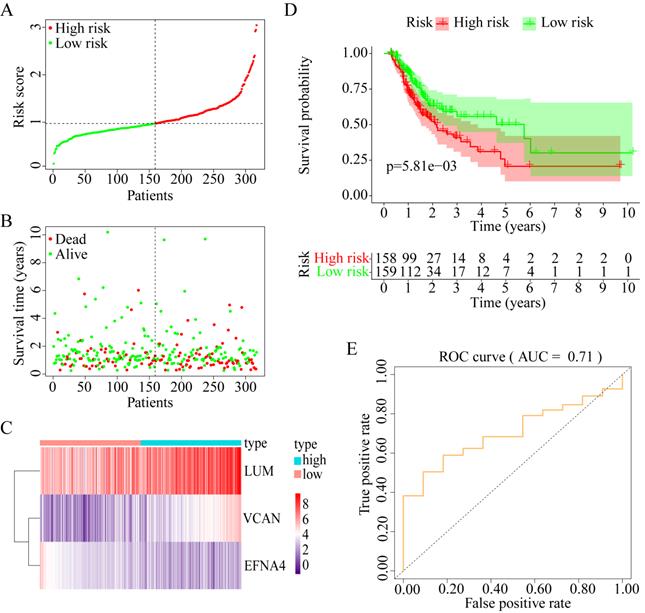
To explore whether the combination of these three genes performed well in survival prediction, the prognostic model was constructed with three prognostic genes. Figure 9A-C shows the prognostic risk score results. OS was significantly different between the high-risk and low-risk groups (P < 0.01, Figure 9D). The 5-year OS was 50.21% (95% CI = 37.17-67.82%) in the low-risk group and 20.70% (95% CI = 10.17-42.05%) in the high-risk group. Besides, the AUC was 0.71 for 5-year OS, which implied that the prognostic model constructed with the three prognostic genes had a good accuracy for survival prediction (Figure 9E).
Construction of progonostic model with 3 prognostic genes identified. (A) The risk score distribution. (B) The patients' survival status distribution. (C) The heat map of the 3 genes for low- and high-risk groups. In the heat map, each column represents one sample, and each row represents one gene, and the color gradient ranging from purple to red represents the changing process from down- to upregulation. (D) The Kaplan-Meier curves for low- and high-risk groups. (E) The ROC curves for predicting OS in GC patients by the risk score.
Verification of the expression of the prognostic factors
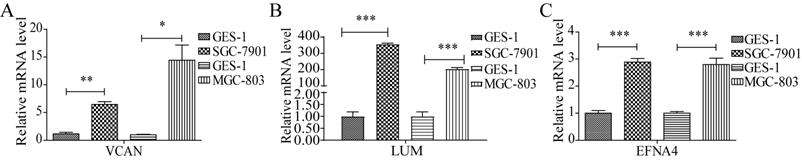
To verify the expression of LUM, VCAN, and EFNA4, real-time quantitative PCR analysis of GES-1 and SGC-7901 and MGC-803 cells was performed. The results revealed that the expression of VCAN, LUM, and EFNA4 were higher in SGC-7901 and MGC-803 cells than in GES-1 cells, as shown in Figure 10. In addition, the expression of the 3 prognostic genes was also verified using GSE56807 dataset and the integrated dataset from UCSC Xena database, as shown in Figure S4. The results displayed that the 3 prognostic genes were significantly upregulated in GC samples.
The expression of useful prognostic indicators in cell lines. *P<0.05; **P<0.01; ***P<0.001.
OS analysis of the prognostic indicator gene isoforms
Alternative splicing results in different transcripts; these transcripts are translated to different proteins and perform different biological functions. Therefore, we analyzed the isoforms of the three useful prognostic indicators of GC. Their isoforms were obtained via GEPIA2 analysis (Table 2). All transcripts of the three useful prognostic indicators were selected to explore their OS using GEPIA2 analysis. Two isoforms of LUM, five of VCAN, and one of EFNA4 showed significant differences in terms of OS (P < 0.05) (Figure 11).
The isoforms of three prognostic genes
| LUM_isoform | EFNA4_isoform | VCAN_isoform |
|---|---|---|
| ENST00000548071.1 | ENST00000427683.2 | ENST00000515397.1 |
| ENST00000546642.1 | ENST00000368409.7 | ENST00000513984.5 |
| ENST00000266718.4 | ENST00000359751.8 | ENST00000513960.5 |
| ENST00000243364.7 | ENST00000513016.5 | |
| ENST00000512590.6 | ||
| ENST00000507162.1 | ||
| ENST00000505615.1 | ||
| ENST00000503923.1 | ||
| ENST00000502527.2 | ||
| ENST00000343200.9 | ||
| ENST00000342785.8 | ||
| ENST00000265077.7 |
OS analysis of the capable prognostic gene isoforms. (A) VCAN. (B) LUM. (C) EFNA4.
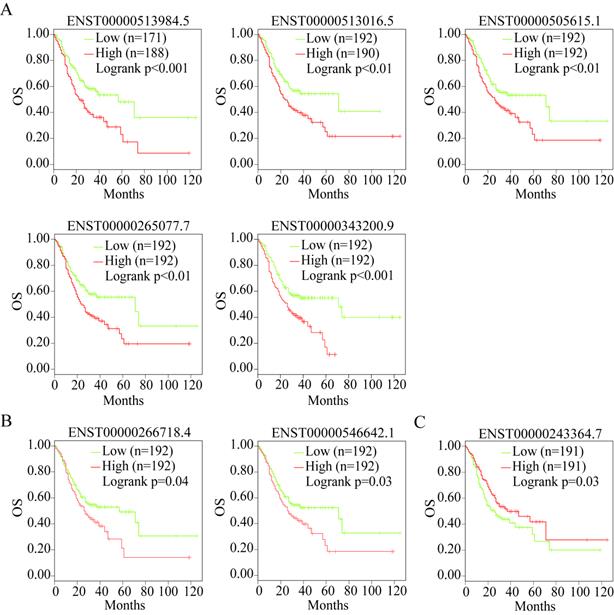
Therefore, the transcripts of the three useful prognostic indicators (VCAN, LUM, and EFNA4) that showed a difference in OS were defined as the valid prognostic indicators of GC (Table 2, bold).
Correlation analysis between the useful prognostic indicators and tumor-infiltrating immune cells
The tumor microenvironment mainly contains tumor-infiltrating immune cells. Several studies have documented the presence of an association between tumor-infiltrating immune cell levels and tumor cell proliferation and metastasis, therapeutic response, and prognosis [21-23]. They are thought to have a critical relationship with therapeutic response and prognosis [24]. Therefore, the correlation of the useful prognostic indicators verified above with six types of tumor-infiltrating immune cells (B cells, CD4+ T cells, CD8+ T cells, neutrophils, macrophages, and dendritic cells) was investigated using TIMER.
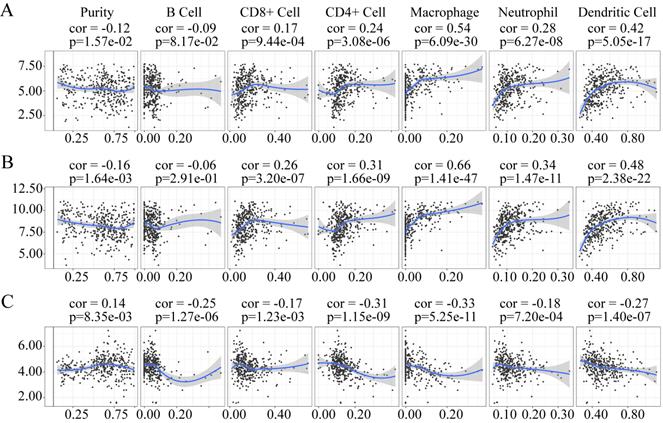
The expression of LUM and VCAN negatively correlated with tumor purity, whereas the expression of EFNA4 positively correlation with tumor purity (Figure 12). The expression of LUM, and VCAN had a noticeable positive correlation with infiltrating levels of CD8+ T cells, CD4+ T cells, macrophages, neutrophils, and dendritic cells in GC but had no apparent correlation with B cells (Figure 12A-B). A negative correlation was observed between the expression of EFNA4 and the six types of tumor-infiltrating immune cells (Figure 12C).
Association of VCAN (A), LUM (B), EFNA4 (C) with tumor-infiltration immune cells in GC. P <0 05 denotes significance. Each dot represents a sample in the TCGA-STAD dataset.
Discussion
Using integrative bioinformatics, 10 hub genes were identified in the PPI network of GC and their upregulation was validated in GC tissues and cell lines. Most of these genes closely correlated with the cell cycle. As hub genes, these genes may also have the potential to act as diagnostic genes. It has been reported that CCNB1 [25], CDK1 [26], MAD2L1 [27], CDC20 [28], and CDC6 [29] could be essential genes for GC diagnosis and that they directly or indirectly contribute toward cell proliferation and metastasis as well as toward other biological functions associated with the cell cycle. The regulatory role of CCNA2 in the MET-mediated cell-cycle pathway is reportedly blocked by miR-381-3p, which promotes the proliferation and metastasis of bladder cancer cells [30]. BUB1B can also be activated by Forkhead box protein M1 to promote cell proliferation in glioblastoma [31]. Nevertheless, studies on the regulatory mechanisms of CCNA2 and BUB1B in GC are scarce. Regarding the other three genes, the upregulation of TOP2A enhanced the recurrence risk in patients with stage II/III GC, whereas its downregulation may play a significant role in chromosome instability and tumorigenesis. The expression of TOP2A is commonly altered at both the gene copy number and gene expression levels in cancer cells [32]. KIF11 is overexpressed in GC [33]; its knockdown via RNAi inhibits the number and size of spheres formed in gastric cancer stem cells [34]. AURKA activates HDM2, leading to the ubiquitination of p53; its inhibition markedly decreases cell survival in vitro, and in vivo in a xenograft tumor growth model, suggesting that AURKA expression can indicate a poor response to chemotherapy in GCs [35]. All these genes appear to be promising candidate markers for GC therapy or diagnosis.
The three prognostic genes (LUM, VCAN, and EFNA4), with an obvious difference in OS and DFS, were highly expressed in patients with II, III, and IV GC. VCAN is highly expressed in advanced-stage GC and VCAN contributes to cell proliferation, cell differentiation, and tumor growth in GC [36]. Interestingly, VCAN can control tumor metastasis and may identify previously undetected therapeutic targets to treat metastatic diseases in patients with breast cancer [37]. The expression of LUM is closely associated with organ metastasis, lymphatic metastasis, and histological type in GC [38, 39]. EFNA4 encodes the human protein ephrin-A4, a member of the ephrin family [40]. Ephrins are the ligands to Eph receptors and stimulate bi-directional signaling of the Eph/ephrin axis [41]. Eph receptor and ephrin overexpression can result in tumorigenesis as related to tumor growth and survival and is associated with angiogenesis and metastasis in many types of human cancer [42]. EFNA4 upregulation in GC tissues has been identified using integrated transcriptomic and computational analysis methods [43]. Ephrin-A4 binds to and phosphorylate the receptor Eph A2-8 and is significantly overexpressed in liver cancer and glioblastoma [42]. In addition, the elevated expression of Eph-A4 in non-small cell lung carcinoma patients is also found to be significantly associated with favourable prognosis [44], which is similar to our finding about ephrin-A4. However, the detail mechanism of EFNA4 influencing the tumorgenesis, development and prognostic of GC needs further study. Our finding about LUM, VCAN, and EFNA4 that are highly expressed in GC cells proves they could be useful prognostic indicators of GC.
The effectiveness of the isoforms of LUM, VCAN, and EFNA4 as the prognostic indicators of GC was also confirmed by OS analysis. However, to the best of our knowledge, the feasibility of the isoforms of LUM, VCAN, and EFNA4 as prognostic indicators of GC has not been reported to date. Further studies are needed to verify these findings.
Because tumor-infiltrating immune cells have a clear relationship with tumor diagnostic and prognostic assessment [45], we explored the correlation between the three useful prognostic indicators and six types of tumor-infiltrating immune cells using TIMER. LUM and VCAN positively correlated with CD8+ T cells, CD4+ T cells, macrophages, neutrophils, and dendritic cells. In contrast, EFNA4 negatively correlated with the six types of tumor-infiltrating immune cells. LUM and VCAN are mainly expressed on both T cells (CD8+ T cells and CD4+ T cells) and antigen-presenting cells (macrophages, neutrophils, and dendritic cells). EFNA4 is not expressed on immune cells but is expressed on tumor cells. Therefore, all those three useful prognostic indicators, LUM, VCAN, and EFNA4 are considered to have a relationship with the immunoregulation of the tumor environment.
Conclusion
By analyzing the GC data from TCGA and two microarrays with combined bioinformatics tools, 10 hub genes and 3 useful prognostic indicators were identified as the possible indicators for future GC diagnosis and treatment. Identification of the correlation between the prognostic indicators and tumor-infiltrating immune cell levels in GC showed that three prognostic indicators play a role in cancer immunoregulation, which may be useful in cancer immunotherapy.
Abbreviations
GC: gastric cancer; OS: overall survival; GEO: Gene Expression Omnibus; RNA-seq: RNA-sequencing; DEGs: differentially expressed genes; STAD: stomach adenocarcinoma; TCGA: The Cancer Genome Atlas; DFS: disease-free survival; BH: Benjamini & Hochberg; GO: Gene Ontology; KEGG: Kyoto Encyclopedia of Genes and Genomes; PPI: protein-protein interaction; CI: confidence interval; GEPIA2: Gene Expression Profiling Interactive Analysis; TIMER: Tumor IMmune Estimation Resource.
Supplementary Material
Supplementary figures and tables.
Acknowledgements
The authors would like to thank Wenting Hou of Henan University of Urban Construction for her bioinformatics-related training and the support from Henan Key Laboratory for Pharmacology of Liver Diseases.
Funding
This work was supported by the National Natural Science Foundation of China (3160067, 81672917, and 81671542), Project of Basic Research Fund of Henan Institute of Medical and Pharmacological Sciences (2021BP0101), Key Scientific Research Projects of Colleges and Universities in Henan Province (21A416011), and Medical Science and Technique Project of Henan Province (SBGJ202002104).
Competing Interests
The authors have declared that no competing interest exists.
References
1. Nemtsova MV, Kalinkin AI, Kuznetsova EB. et al. Clinical relevance of somatic mutations in main driver genes detected in gastric cancer patients by next-generation DNA sequencing. Sci Rep. 2020;10:1-11
2. Bray F, Ferlay J, Soerjomataram I. et al. Global cancer statistics 2018: GLOBOCAN estimates of incidence and mortality worldwide for 36 cancers in 185 countries. CA Cancer J Clin. 2018;68:394-424
3. Siegel RL, Miller KD, Jemal A. Cancer statistics, 2016. CA Cancer J Clin. 2016;66:7-30
4. Cao L, Chen Y, Zhang M. et al. Identification of hub genes and potential molecular mechanisms in gastric cancer by integrated bioinformatics analysis. PeerJ. 2018;6:e5180
5. Fei H-J, Chen S-C, Zhang J-Y. et al. Identification of significant biomarkers and pathways associated with gastric carcinogenesis by whole genome-wide expression profiling analysis. Int J Oncol. 2018;52:955-66
6. Wang S, Chen X. Identification of potential biomarkers in cervical cancer with combined public mRNA and miRNA expression microarray data analysis. Oncol Lett. 2018;16(4):5200-5208
7. Li T, Gao X, Han L. et al. Identification of hub genes with prognostic values in gastric cancer by bioinformatics analysis. World J Surg Oncol. 2018;16:114
8. Huang X, Li Y, Guo X. et al. Identification of differentially expressed genes and signaling pathways in chronic obstructive pulmonary disease via bioinformatic analysis. FEBS Open Bio. 2019;9:1880-99
9. D'Errico M, Rinaldis ED, Blasi MF. et al. Genome-wide expression profile of sporadic gastric cancers with microsatellite instability. Eur J Cancer. 2009;450-469
10. He J, Jin Y, Chen Y. et al. Downregulation of ALDOB is associated with poor prognosis of patients with gastric cancer. Onco Targets Ther. 2016;9:6099-109
11. Wang J, Ni Z, Duan Z. et al. Altered Expression of Hypoxia-Inducible Factor-1α (HIF-1α) and Its Regulatory Genes in Gastric Cancer Tissues. PLoS ONE. 2014;9:e99835
12. Yu G, Wang L-G, Han Y. et al. clusterProfiler: an R package for comparing biological themes among gene clusters. Omics. 2012;16:284-7
13. Carlson M, Falcon S, Pages H. et al. org. Hs. eg. db: Genome wide annotation for Human. Omics. 2017;3:1
14. Szklarczyk D, Morris JH, Cook H. et al. The STRING database in 2017: quality-controlled protein-protein association networks, made broadly accessible. Nucleic Acids Res. 2017;45:D362-D368
15. Chin C-H, Chen S-H, Wu H-H. et al. cytoHubba: identifying hub objects and sub-networks from complex interactome. BMC Syst Biol. 2014;8:S11
16. Bader GD, Hogue CW. An automated method for finding molecular complexes in large protein interaction networks. BMC bioinformatics. 2003;4:2
17. Huang R, Liao X, Li Q. Identification and validation of potential prognostic gene biomarkers for predicting survival in patients with acute myeloid leukemia. OncoTargets Ther. 2017;10:5243
18. Chandrashekar DS, Bashel B, Balasubramanya SAH. et al. UALCAN: a portal for facilitating tumor subgroup gene expression and survival analyses. Neoplasia. 2017;19:649-58
19. Tang Z, Kang B, Li C. et al. GEPIA2: an enhanced web server for large-scale expression profiling and interactive analysis. Nucleic Acids Res. 2019;47:W556-W60
20. Li T, Fan J, Wang B. et al. TIMER: a web server for comprehensive analysis of tumor-infiltrating immune cells. Cancer Res. 2017;77:e108-e10
21. Jochems C, Schlom J. Tumor-infiltrating immune cells and prognosis: the potential link between conventional cancer therapy and immunity. Exp Biol Med. 2011;236:567-79
22. Swartz MA, Iida N, Roberts EW. et al. Tumor microenvironment complexity: emerging roles in cancer therapy. Cancer Res. 2012;72:2473-80
23. Luo Q, Shao WQ, Yang LY. et al. The metastasis-promoting roles of tumor-infiltrating immune cells and potential therapeutic strategies. Fudan Univ J Med Sci. 2016;43:104-9 and 21
24. Bremnes RM, Al-Shibli K, Donnem T. et al. The role of tumor-infiltrating immune cells and chronic inflammation at the tumor site on cancer development, progression, and prognosis: emphasis on non-small cell lung cancer. J Thorac Oncol. 2011;6:824-33
25. Chen E-B, Qin X, Peng K. et al. HnRNPR-CCNB1/CENPF axis contributes to gastric cancer proliferation and metastasis. Aging (Albany NY). 2019;11:7473
26. Zhang L, Kang W, Lu X. et al. LncRNA CASC11 promoted gastric cancer cell proliferation, migration and invasion in vitro by regulating cell cycle pathway. Cell Cycle. 2018;17:1886-900
27. Wang Y, Wang F, He J. et al. miR-30a-3p Targets MAD2L1 and Regulates Proliferation of Gastric Cancer Cells. OncoTargets Ther. 2019;12:11313
28. Kim Y, Choi J-W, Lee J-H. et al. Spindle assembly checkpoint MAD2 and CDC20 overexpressions and cell-in-cell formation in gastric cancer and its precursor lesions. Hum Pathol. 2019;85:174-83
29. Zhao B, Zhang J, Chen X. et al. Mir-26b inhibits growth and resistance to paclitaxel chemotherapy by silencing the CDC6 gene in gastric cancer. Arch Med Sci. 2019;15:498-503
30. Li J, Ying Y, Xie H. et al. Dual regulatory role of CCNA2 in modulating CDK6 and MET-mediated cell-cycle pathway and EMT progression is blocked by miR-381-3p in bladder cancer. FASEB J. 2018;33:1374-1388
31. Ma Q, Liu Y, Shang L. et al. The FOXM1/BUB1B signaling pathway is essential for the tumorigenicity and radioresistance of glioblastoma. Oncol Rep. 2017;38:3367-3375
32. Terashima M, Ichikawa W, Ochiai A. et al. TOP2A, GGH, and PECAM1 are associated with hematogenous, lymph node, and peritoneal recurrence in stage II/III gastric cancer patients enrolled in the ACTS-GC study. Oncotarget. 2017;8:57574-57582
33. Oue N, Sentani K, Sakamoto N. et al. Molecular carcinogenesis of gastric cancer: Lauren classification, mucin phenotype expression, and cancer stem cells. Int J Clin Oncol. 2019;24:771-8
34. Imai T, Oue N, Nishioka M. et al. Overexpression of KIF11 in gastric cancer with intestinal mucin phenotype. Pathobiology. 2017;84:16-24
35. Sehdev V, Katsha A, Arras J. et al. HDM2 regulation by AURKA promotes cell survival in gastric cancer. Clin Cancer Res. 2014;20:76-86
36. Li W, Han F, Fu M. et al. High expression of VCAN is an independent predictor of poor prognosis in gastric cancer. J Int Med Res. 2020;48:0300060519891271
37. Yihong Z, Xiuqun Z, Wenli Q. et al. Enhanced PAPSS2/VCAN sulfation axis is essential for Snail-mediated breast cancer cell migration and metastasis. Cell Death Differ. 2018;26:565-579
38. Guo J, Fu Z, Wei J. et al. PRRX1 promotes epithelial-mesenchymal transition through the Wnt/β-catenin pathway in gastric cancer. Med Oncol. 2015;32:393
39. Cui JA, Chen YB, Chou WC. et al. An integrated transcriptomic and computational analysis for biomarker identification in gastric cancer. Nucleic Acids Res. 2011;39:1197-207
40. Hafner C, Schmitz G, Meyer S. et al. Differential Gene Expression of Eph Receptors and Ephrins in Benign Human Tissues and Cancers. Clin Chem. 2004;50:490-9
41. Pasquale EB. Eph receptors and ephrins in cancer: bidirectional signalling and beyond. Nat Rev Cancer. 2010;10:165-80
42. Surawska H, Ma PC, Salgia R. The role of ephrins and Eph receptors in cancer. Cytokine Growth Factor Rev. 2004;15:419-33
43. Xing W, Zeng C. An integrated transcriptomic and computational analysis for biomarker identification in human glioma. Tumor Biol. 2016;37:7185-92
44. Giaginis C, Tsoukalas N, Bournakis E. et al. Ephrin (Eph) receptor A1, A4, A5 and A7 expression in human non-small cell lung carcinoma: associations with clinicopathological parameters, tumor proliferative capacity and patients' survival. BMC Clin Pathol. 2014;14:8
45. Jia D, Li S, Li D. et al. Mining TCGA database for genes of prognostic value in glioblastoma microenvironment. Aging (Albany NY). 2018;10:592
Author contact
![]() Corresponding authors: Liguo Zhang, E-mail: lgzhangedu.cn; Henan Institute of Medical and Pharmaceutical Science, Zhengzhou University, No. 40 Daxue Road, Zhengzhou 450052, China. Yang Zhao, E-mail: victoria226com; Henan Institute of Medical and Pharmaceutical Science, Zhengzhou University, No. 40 Daxue Road, Zhengzhou 450052, China.
Corresponding authors: Liguo Zhang, E-mail: lgzhangedu.cn; Henan Institute of Medical and Pharmaceutical Science, Zhengzhou University, No. 40 Daxue Road, Zhengzhou 450052, China. Yang Zhao, E-mail: victoria226com; Henan Institute of Medical and Pharmaceutical Science, Zhengzhou University, No. 40 Daxue Road, Zhengzhou 450052, China.