Impact Factor ISSN: 1837-9664

 Global reach, higher impact
J Cancer 2020; 11(11):3357-3368. doi:10.7150/jca.40729 This issue Cite
Research Paper
Analysis of lncRNA, miRNA and mRNA-associated ceRNA networks and identification of potential drug targets for drug-resistant non-small cell lung cancer
Xiangzhen Kong1,2* ![]() , Shousen Hu3*, Yongliang Yuan1,2, Yue Du1,2, Zijia Zhu1,2, Zhizhen Song1,2, Shanshan Lu1,2, Chang Zhao3, Dan Yan1,2
, Shousen Hu3*, Yongliang Yuan1,2, Yue Du1,2, Zijia Zhu1,2, Zhizhen Song1,2, Shanshan Lu1,2, Chang Zhao3, Dan Yan1,2
1. Department of Pharmacy, the First Affiliated Hospital of Zhengzhou University, Zhengzhou, China.
2. Henan Key Laboratory of Precision Clinical Pharmacy, Zhengzhou University, Zhengzhou, China.
3. Department of Otolaryngology Head and Neck Surgery, the First Affiliated Hospital of Zhengzhou University, Zhengzhou, China.
*These authors contributed equally to this work.
Received 2019-9-27; Accepted 2020-2-7; Published 2020-3-5
Abstract
Background: Drug resistance to chemotherapeutic drugs or targeted medicines is an obstacle encountered in the treatment of non-small-cell lung cancer (NSCLC). However, the mechanisms of competing endogenous RNA (ceRNA) on the drug resistance in NSCLC are rarely reported. In this paper, the comprehensive expression profiles of lncRNAs and mRNAs in drug-resistant NSCLC cells were obtained by RNA sequencing.
Methods: The dysregulated lncRNAs, miRNAs and mRNAs in drug-resistant NSCLC cell lines were identified by RNA-sequencing and bioinformatics methods.
Results: A total of 39 dysregulated lncRNAs and 650 dysregulated mRNAs were identified between drug-resistant NSCLC cell lines and their parental cell lines. Additionally, 33 lncRNA-miRNA-mRNA pathways in the ceRNA network in drug-resistant NSCLC were constructed through bioinformatics methods and ceRNA regulatory rules. These comprised 12 dysregulated lncRNAs, five dysregulated miRNAs, and eight dysregulated mRNAs. In addition, lncRNA ATP2B1/miR-222-5p/TAB2 and lncRNA HUWE1/miR-222-5p/TAB2 were identified as potential ceRNA networks involved in drug resistance to NSCLC.
Conclusions: The current study provides a promising therapeutic strategy against the lncRNA-miRNA-mRNA ceRNA regulatory network for NSCLC treatment and deepens our comprehension of the ceRNA regulatory mechanisms related to drug resistance to NSCLC.
Keywords: non-small cell lung cancer, competing endogenous RNA network, drug resistance, RNA sequencing
Introduction
Non-small-cell lung cancer (NSCLC) accounts for approximately 85% of lung cancer, which is one of the most common malignant cancers in the world, and is characterized by high morbidity and mortality [1]. Current effective therapies for NSCLC patients include surgical resection, chemotherapy, targeted therapy and immunotherapies [2,3]. However, despite improvements in NSCLC therapy over the last few decades, the long-term survival rate of patients with NSCLC is still 20%-35% [4]. To a certain extent, the treatment of NSCLC may fail due to resistance to chemotherapeutic drugs or targeted medicines.
Various studies have proposed that somatic activating mutations, dysregulation of drug transport, and disorders of cell apoptosis pathways or cell cycle regulation are common mechanisms of drug resistance [5,6]. However, there are almost no available methods for effectively overcoming drug resistance at present. Thus, there is an imperative need to clarify novel mechanisms of drug resistance in NSCLC. Therefore, it is necessary to explore the molecular differences between drug-resistant NSCLC cell lines and their parental cell lines to identify new potential targets for the treatment of drug resistance in NSCLC, as well as to improve the effectiveness of treatments for this disease.
The competing endogenous RNA (ceRNA) mechanism stated that the transcripts of non-coding RNAs like long non-coding RNAs (lncRNAs), can act as natural microRNAs (miRNAs) sponges through competitively binding to miRNA response elements (MREs) on target mRNAs to inhibit their functions [7]. In recent years, this ceRNA regulatory network has received considerable attentions, and many have studied the molecular mechanisms related to the occurrence and progression of tumors [8,9]. However, there are limited researches focused on the mechanisms of ceRNAs in NSCLC drug resistance.
To explore the potential mechanisms of ceRNAs in NSCLC drug resistance, we detected the expression levels of lncRNAs, miRNAs and mRNAs in the drug-resistant NSCLC cell lines (A549/DDP and HCC827/GR) and their parent cell lines (A549 and HCC827) by RNA sequencing. We then carried out a comprehensive analysis of the dysregulated lncRNAs, miRNAs, and mRNAs using bioinformatics methods. Finally, based on the bioinformatics results and the ceRNA regulatory rules, a lncRNA-miRNA-mRNA network was constructed among the dysregulated lncRNAs, miRNAs, and mRNAs. This paper might provide new insights into the mechanisms of drug resistance and might have certain clinical significance for further research in this area.
Materials and Methods
Cell lines and culture conditions
A549 cells were obtained from Shanghai Meixuan Biological science and technology LTD, and HCC827 cells were kindly provided by Stem Cell Bank, Chinese Academy of Sciences. A549 and HCC827 cells were grown in RPMI-1640 (Hyclone, MA, USA) supplemented with 10% fetal bovine serum (Gibco, NY, USA) and penicillin/streptomycin. The cisplatin-resistant A549/DDP cells and the gefitinib-resistant HCC827/GR cells were generated by gradient dose treatment for almost six months. Drugs were added to maintain resistance and were withdrawn one week before the experiment.
RNA isolation and purification
Total RNA from the cell lines was extracted by Trizol reagent (Invitrogen, CA, USA) according to the instruction. The quantity and purity of total RNA were measured by Bioanalyzer 2100 and RNA 6000 Nano LabChip Kit (Agilent, CA, USA) with a RIN number ≥8.
LncRNA and mRNA sequencing
First, ribosomal RNA was depleted from approximately 10 μg of total RNA by the Epicentre Ribo-Zero Gold Kit (Illumina, CA, USA). And then, the rRNA-depleted RNA was broken into small pieces using divalent cations under an elevated temperature and then reverse-transcribed to create the final cDNA library by the mRNA-Seq sample preparation kit (Illumina, CA, USA). Then, paired-end sequencing (300 ± 50 bp) was performed on Illumina X10 (LC Sciences, USA) according to the vendor's recommended protocol.
Transcript assembly
Adaptor contamination, low-quality bases, and undetermined bases were removed using Cutadapt, and the quality of sequencing was verified by FastQC (http://www.bioinformatics.babraham.ac.uk/projects/fastqc/). The reads of each sample were mapped to the human genome by Bowtie 2 [10] and topaht2 [11] and were constituted by StringTie [12]. All transcriptomes of samples were combined to regenerate an integrated transcriptome using Perl scripts. After the ultimate transcriptome was generated, the expression level of all transcripts was estimated by StringTie [12] and Ballgown [13].
LncRNA identification
The transcripts overlapping with known mRNAs and transcripts < 200 bp, as well as transcripts with a Coding Potential Calculator (CPC) score [14] < -1 and a Coding-Non-Coding Index (CNCI) score [15] < 0, were removed. Those that were remaining were taken as lncRNAs. The raw and processed data were transmitted to GEO with the GEO accession number GSE132418.
Differential expression analysis of lncRNAs and mRNAs
The expression values of lncRNAs and mRNAs were calculated as FPKM (fragments per kilobase per million) by StringTie [12]. The differentially expressed lncRNAs and mRNAs were selected with fold change ≥2 or ≤0.5 and P ≤0.05 using R package-Ballgown [13].
Quantitative real-time PCR
Quantitative real-time PCR (qRT-PCR) was performed on Applied Biosystems QuantStudio 5 (Thermo Fisher Scientific, USA). Total RNA was extracted from A549, A549/DDP by Trizol (Roche, CA, USA) and reversely transcribed into cDNA by First Strand cDNA Synthesis Kit (Roche, CA, USA). The 2-ΔΔCT methods were employed to analysis the relative expression levels of lncRNAs. The primer sequences were listed in Table 1.
The primers for qRT-PCR
| Name | Sequence (5'-3') |
|---|---|
| lncRNA RALGAPB (F) | TGAAGCCATTGTTGGTTGGC |
| lncRNA RALGAPB (R) | AGGGTCTTAAGGGTCTTTACCA |
| lncRNA HCG25 (F) | CAGGAAAGGAGGGTGACAGAC |
| lncRNA HCG25 (R) | GCTTTGGTAGTTCCTGCCTTCA |
| PXN-AS1 (F) | TGGCGAGCTCAGCAAACTAA |
| PXN-AS1 (R) | TTTGCGTGCTTCCTCTTTGC |
| lncRNA NT5C3A (F) | AAGGAGGCTTCACTGGGACT |
| lncRNA NT5C3A (R) | GGTCAACGTAGGCACCTCTAA |
| TAB2 (F) | CTCCTGGTGGTACAACTCGAC |
| TAB2 (R) | TGATTTGGCTGTTGAGATGAGG |
| 18S (F) | GTAACCCGTTGAACCCCATT |
| 18S (R) | CCATCCAATCGGTAGTAGCG |
| GAPDH (F) | TGTTGCCATCAATGACCCCTT |
| GAPDH (R) | CTCCACGACGTACTCAGCG |
Functional enrichment analysis of differentially expressed lncRNAs
To clarify the potential functional roles of the dysregulated lncRNAs, the cis-target genes of the dysregulated lncRNAs 100 kbp upstream and downstream of the chromosome were picked using a Python script. The neighboring genes were then performed for gene ontology (GO) analysis and Kyoto encyclopedia of genes and genomes (KEGG) enrichment analysis. Significance is expressed as a P-value < 0.05.
Construction of a lncRNA-miRNA-mRNA-related ceRNA regulatory network
First, starBase v3.0 [16] and miRcode [17] were employed to analyze the relationships between the dysregulated lncRNAs and miRNAs. starBase v3.0 is a database for studying miRNA-ncRNA, miRNA-mRNA and RNA-RNA interactions from CLIP-seq data [16]. miRcode provides miRNA target predictions including lncRNAs, based on the comprehensive GENCODE gene annotation [17]. Therefore, we employed miRcode to decipher the interactions between lncRNAs and miRNAs and between miRNAs and mRNAs. Second, miRanda [18], miRcode [17], and TargetScan [19] were employed to decode the relationships between the dysregulated miRNAs and mRNAs. miRanda is a database that can predict miRNA targets and miRNA expression [18]. TargetScan is a database that can predict miRNA targets in mammals by matching the conserved 8mer, 7mer, and 6mer sites with the seed region of miRNA [19]. Finally, the ceRNA regulatory network was constructed according to the ceRNA regulatory mechanism and the changing trends of lncRNAs, miRNAs and mRNAs, and the network was visualized by Cytoscape 3.6.1.
TCGA data analysis
The data from the lung adenocarcinoma patients were downloaded from the database of The Cancer Genome Atlas (TCGA, https://cancergenome.nih.gov/). The optimal cut-off point for the expression of all RNAs in the ceRNA regulatory network was divided into high-risk and low-risk groups using the “cutp” function from R package-survMisc. Survival analysis of all RNAs in the ceRNA network was calculated by Kaplan-Meier analysis, which was performed using R package-survival. P < 0.05 was considered statistically significant.
RNA interference experiments
A549/DDP cells were seeded in plates and transfected with 40 nM siRNAs using jetPRIME® (Polyplus-transfection SA, France). SiRNAs were purchased from Shanghai GenePharma Co., Ltd (Shanghai, China). The sense sequence of siTAB2 is 5'-GCUGGGUAUCUCAGUUUAATT-3' and the antisense sequence of siTAB2 is 5'-UUAAACUGAGAUACCCAGCTT-3'. The sense sequence of negative control (siNC) is 5'-UUCUCCGAACGUGUCACGUTT-3'and the antisense sequence of siNC is 5'-ACGUGACACGUUCGGAGAATT-3'. Cells were transfected for at least 24 h before the subsequent experiments.
Western blot analysis
A549/DDP cells were seeded in 6-well plates at a density of 300,000 cells/well and then transfected with 40 nM siNC or siTAB2 after 24h of cultivation. After 48h of transfection, the cells were lysed using RIPA lysis buffer with protease inhibitor. Total protein (20 μg) was separated on 10% SDS-PAGE, transferred to PVDF membranes (Millipore) and immunoblotted with a rabbit polyclonal antibody against TAB2 (catalog number: 14410-1-AP, Proteintech, USA) or GAPDH (catalog number: 10494-1-AP, Proteintech, USA). Bands were detected by ChemiDocTM Imaging System (Bio-Rad, USA).
Growth inhibition assay
Growth inhibition assay was assessed by measuring thiazolyl blue (MTT). A549/DDP cells were seeded in 96-well plates at a density of 4,000 cells/well and then transfected with 40 nM siNC or siTAB2 after 24h of cultivation. Different concentrations of DDP were added to the cells after 24h of transfection, and each group was set in triplicate. After 48h of treatment with DDP, 15μL 5mg/ mL MTT (sigma, USA) was added into the wells and cultured at 37 °C for 4 h. The medium was removed and 100μL DMSO was added into the wells. The plate was shocked and the absorbance was measured at 570 nm using PerkinElmer Multimode Plate Reader EnVision® (PerkinElmer, USA).
Results
Differentially expressed lncRNAs in drug-resistant NSCLC cell lines
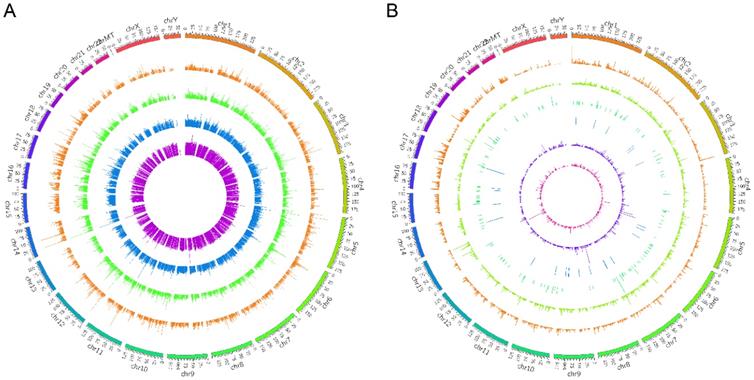
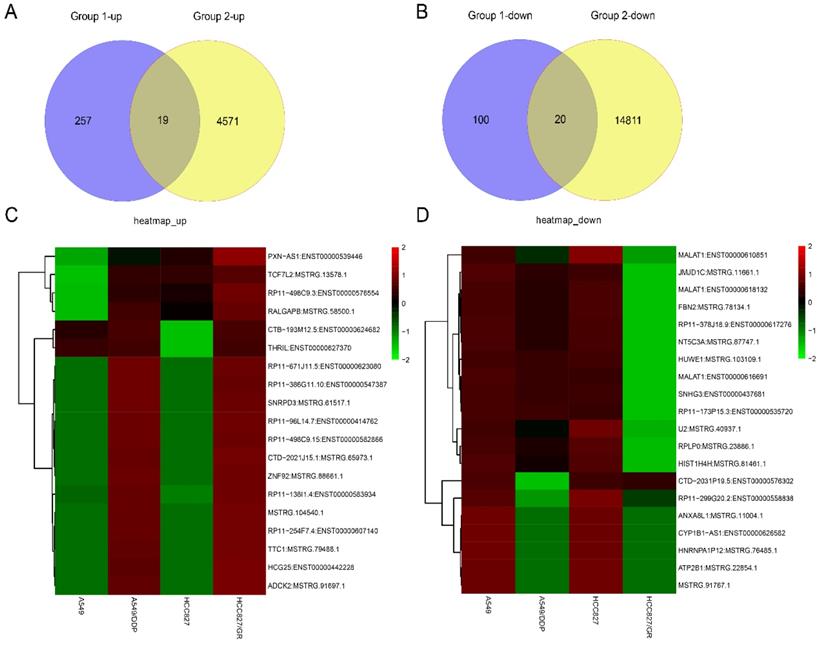
RNA sequencing was carried out in the drug-resistant NSCLC cell lines (A549/DDP and HCC827/GR) and their parent cell lines (A549 and HCC827) on an Illumina X10. The global lncRNA abundances on different chromosomes were visualized based on sample expression and class code expression by mapping all lncRNA transcripts to a human reference genome (Fig. 1A and 1B). To identify the dysregulated lncRNAs in those cells, the up- or down-regulated lncRNAs between A549 and A549/DDP cells were taken as one group ,while the up- or down-regulated lncRNAs between HCC827 and HCC827/GR cells were taken as the other group. Then, the same change trends of lncRNAs between these two groups with a fold change ≥ 2.0 or ≤ 0.5 and P ≤ 0.05 were chosen as lncRNAs candidates. Venn analysis displayed that there were 39 dysregulated lncRNAs, including 19 up-regulated lncRNAs and 20 down-regulated lncRNAs (Fig. 2A and 2B). The heat map analysis shows the expression of the dysregulated lncRNAs visually (Fig. 2C and 2D).
The density distribution of all the lncRNA transcripts on different chromosomes. The global lncRNA abundances on different chromosomes were visualized based on sample expression (A) and class code expression (B) by mapping all lncRNA transcripts to reference genome.
The expression profiles of the same change trends of lncRNAs in drug-resistant NSCLC cell lines. Venn analysis displayed the numbers of the up-regulated lncRNAs (A) and the down-regulated lncRNAs (B) between group 1(A549/DDP vs A549) and group 2 (HCC827/GR vs HCC827) with the criteria of fold change ≥ 2 or ≤ 0.5 and P ≤ 0.05. Heat map showed the expression and hierarchical clustering of the up-regulated lncRNAs (C) and the down-regulated lncRNAs (D).
Validation of lncRNA expression by qRT-PCR
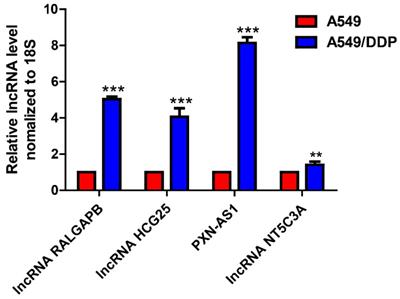
Four lncRNAs were randomly selected to verify the data of high-throughput RNA sequencing by qRT-PCR. The results showed that the change trends of three of those four lncRNAs were in accordance with the sequence data, suggesting that the sequence data were highly reliable (Fig. 3).
Validation of lncRNA expression in drug-resistant NSCLC cell lines by qRT-PCR.
Functional enrichment analysis of cis-target genes of differentially expressed lncRNAs
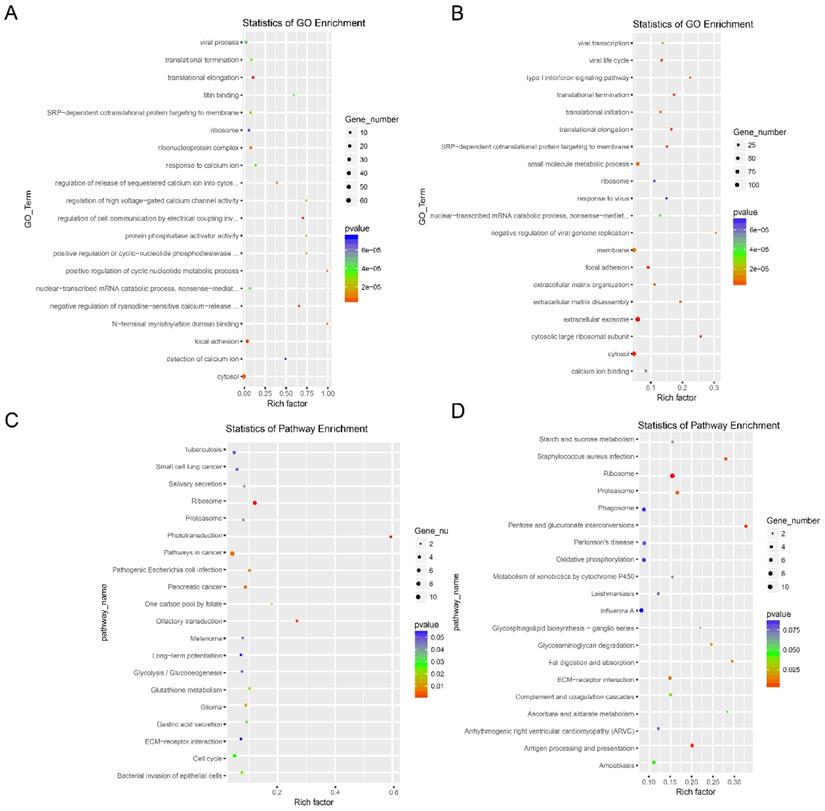
GO and KEGG pathway analysis were conducted to understand the biological significance and mechanisms of the dysregulated lncRNAs. The cis-target genes of the dysregulated lncRNAs upstream and downstream of the chromosome in the range of 100 kbp were selected for GO and KEGG pathway analyses. The main associated GO items of both the up- and down-regulated lncRNAs indicated translational termination, translational elongation, ribosome, and cytosol (Fig. 4A and 4B), suggesting that the dysregulated lncRNAs may be related to the transcriptional regulation of gene expression. All three KEGG pathway analyses of both the up- and down-regulated lncRNAs were ribosome, proteasome, and ECM-receptor interaction (Fig. 4C and 4D).
GO enrichment and KEGG pathway analysis of the dysregulated lncRNAs in drug-resistant NSCLC cell lines. GO enrichment analysis of the target genes corresponding to the up-regulated lncRNAs (A) and the down-regulated lncRNAs (B).KEGG pathway analysis of the target genes corresponding to the up-regulated lncRNAs (C) and the down-regulated lncRNAs (D).
Differentially expressed mRNAs in drug-resistant NSCLC cell lines
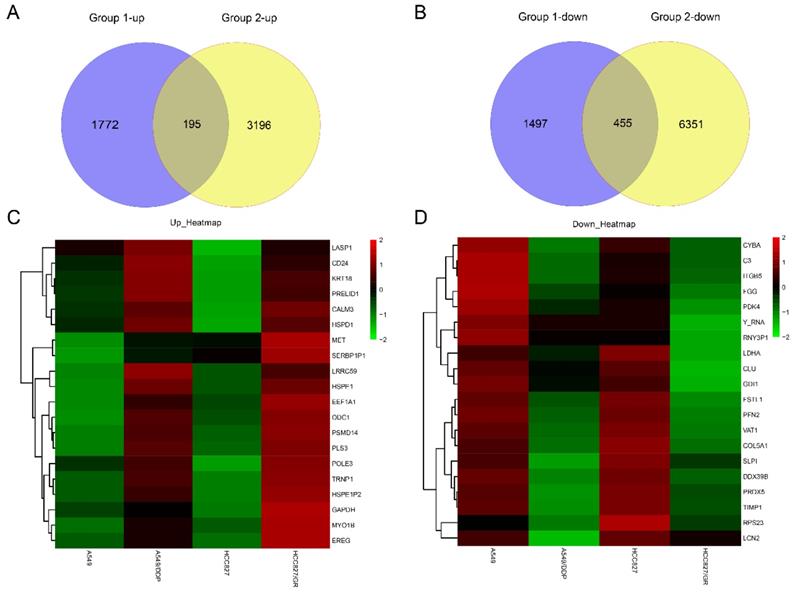
To investigate the expression levels of mRNAs in drug-resistant NSCLC cell lines, the mRNA expression levels in the drug-resistant NSCLC cell lines (A549/DDP and HCC827/GR) and their parent cell lines (A549 and HCC827) with a fold change ≥ 2.0 or ≤ 0.5 and P ≤ 0.05 were analyzed. Venn analysis displayed that there were 195 up-regulated mRNAs and 455 down-regulated mRNAs (Fig. 5A and 5B). The heat map analysis shows the expression of the first 20 up-regulated mRNAs and the first 20 down-regulated mRNAs visually (Fig. 5C and 5D).
The expression profiles of the same change trends of mRNAs in drug-resistant NSCLC cell lines. Venn analysis displayed the numbers of the up-regulated mRNAs (A) and the down-regulated mRNAs (B) between group 1(A549/DDP vs A549) and group 2 (HCC827/GR vs HCC827) with the criteria of fold change ≥ 2 or ≤0.5 and P < 0.05. Heat map showed the expression and hierarchical clustering of the first 20 up-regulated mRNAs (C) and the first 20 down-regulated mRNAs (D).
Construction of a ceRNA network in drug-resistant NSCLC cell lines based on bioinformatics prediction
To further understand the roles of the dysregulated lncRNAs, miRNAs, and mRNAs in drug-resistant NSCLC cell lines and to clarify the relationships among them, a lncRNA-miRNA-mRNA-related ceRNA regulatory network was done in drug-resistant NSCLC cell lines. The dysregulated miRNA expression levels in the drug-resistant NSCLC cell lines (A549/DDP and HCC827/GR) and their parent cell lines (A549 and HCC827) are described in our previous study [20].
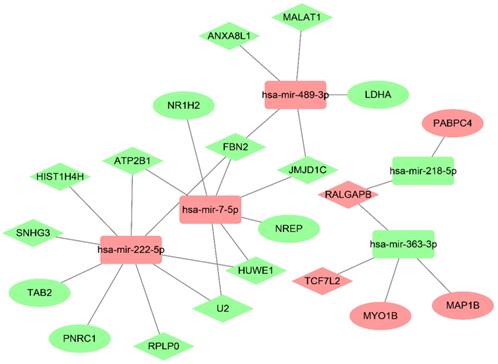
First, starBase v3.0 and miRcode were employed to analyze the relationships between the dysregulated lncRNAs and miRNAs. Second, miRanda, miRcode, and TargetScan were employed to decode the relationships between the dysregulated miRNAs and mRNAs. And the ceRNA network was constructed in drug-resistant NSCLC cell lines by incorporating 12 lncRNAs (10 up-regulated and two down-regulated), five miRNAs (two up-regulated and three down-regulated), and eight mRNAs (five up-regulated and three down-regulated), according to the ceRNA regulatory mechanism and the change trend of lncRNAs, miRNAs and mRNAs. This was visualized using Cytoscape 3.6.1 (Fig. 6). In the ceRNA network, there were 33 lncRNA-miRNA-mRNA pathways; the result is shown in Table S1.
The lncRNA-miRNA‑mRNA ceRNA network analysis in drug-resistant NSCLC cell lines. The lncRNA-miRNA‑mRNA ceRNA network analysis was constructed by Cytoscape. Green and watermelon red represented up-regulated and down-regulated lncRNAs, miRNAs or mRNAs, respectively. Diamond, square and oval represented lncRNAs, miRNAs and mRNAs, respectively.
Survival analysis of the potential lncRNAs, miRNAs and mRNAs in the ceRNA regulatory network based on TCGA data
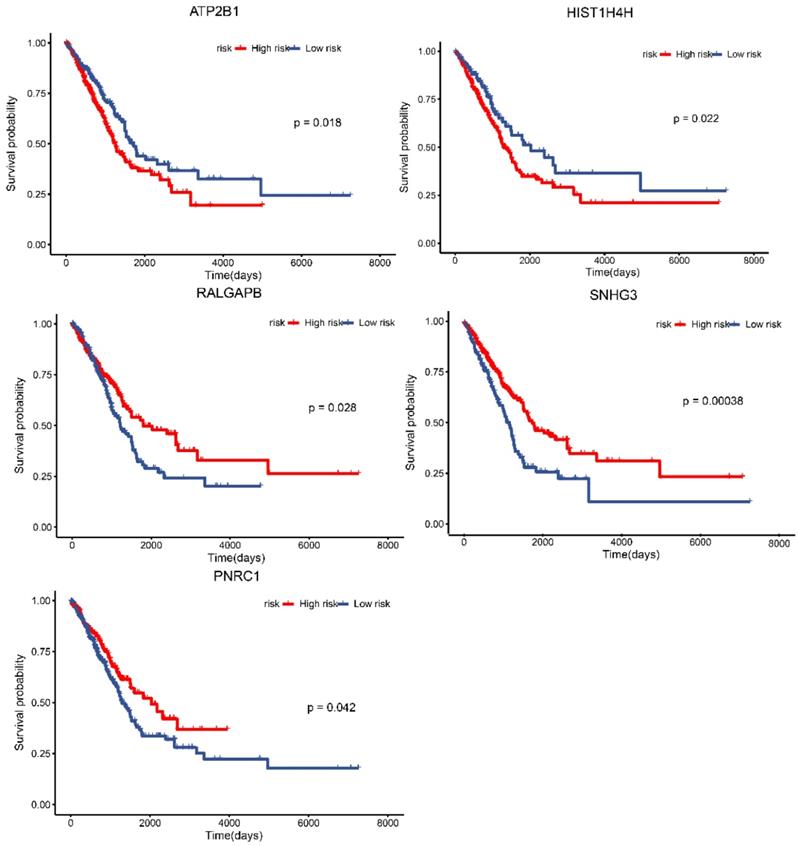
TCGA data for lung adenocarcinoma were employed to identify the prognostic characteristics of the promising lncRNAs, miRNAs, and mRNAs in the ceRNA regulatory network. As a result, four lncRNAs and one mRNA were found to be significantly related to overall survival (P < 0.05; Fig. 7). Two lncRNAs, lncRNA ATP2B1 and lncRNA HIST1H4H, were negatively correlated with overall survival. Additionally, two lncRNAs, lncRNA RALGAPB and lncRNA SNHG3, and one mRNA, PNRC1, were positively related to overall survival.
Survival analysis of lncRNAs, miRNAs and mRNAs in the ceRNA network based on TCGA database. Data from TCGA database for lung adenocarcinoma was employed to identify the prognostic characteristics of the promising lncRNAs, miRNAs and mRNAs in the ceRNA network. The results showed the survival analysis of the potential lncRNAs, miRNAs and mRNAs with P < 0.05.
Correlation analysis of the potential lncRNAs, miRNAs, and mRNAs in the ceRNA regulatory network
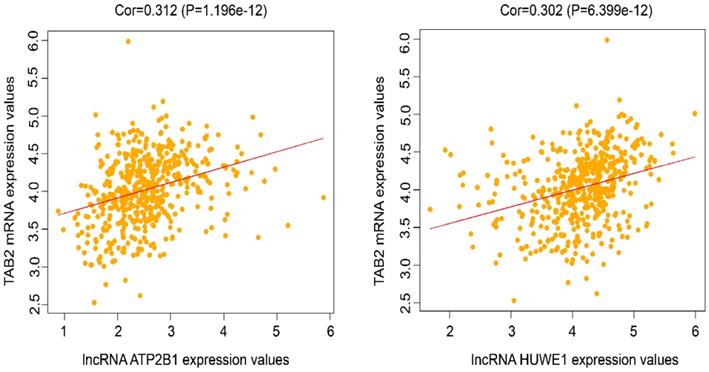
To further confirm the possible interaction of lncRNAs, miRNAs, and mRNAs in the constructed ceRNA network, correlation analysis based on TCGA data was conducted between the expression levels of 12 lncRNAs and their paired mRNAs in lung cancer. It was shown that lncRNA ATP2B1 and TAB2, and lncRNA HUWE1 and TAB2 had a direct linear correlation with the correlation coefficient ≥ 0.3 and P-value < 0.05 (Fig. 8). Combined with the results in Fig. 5, we propose that lncRNA ATP2B1/miR-222-5p/TAB2 and lncRNA HUWE1/miR-222-5p/TAB2 may be potential ceRNA regulatory networks.
Correlation analysis of the potential lncRNAs and mRNAs in the ceRNA network. Correlation analysis between the expression levels of lncRNAs and their paired mRNAs in lung cancer based on TCGA database was employed. The results showed the correlation analysis of the potential lncRNAs and mRNAs with the correlation coefficient ≥ 0.3 and P-value < 0.05.
Knocking down TAB2 enhances the sensitivity of drug-resistant NSCLC cell lines
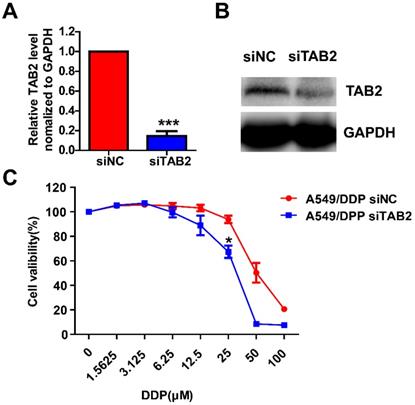
To further investigate the roles of TAB2 in the sensitivity of drug-resistant NSCLC cell lines, A549/DDP cells were then transfected with siNC or siTAB2. After 48h, the mRNA and protein levels of TAB2 were reduced as shown in Fig. 9A and 9B. Growth inhibition assay indicated that down-regulation of TAB2 significantly reduced the sensitivity of A549/DDP cells (Fig. 9C).
Knocking down TAB2 reduces the sensitivity of drug-resistant NSCLC cell lines. The mRNA and protein levels of TAB2 were detected by qRT-PCR (A) and western blot (B) after 48h of transfection with siNC or siTAB2 in A549/DDP cells. A549 / DDP cells transfected with siNC or siTAB2 were treated with DDP at different concentrations. The cell growth rate was assessed by MTT, and the OD570nm of A549/DDP cells transfected with siNC but not treated by DDP was taken as 1 (C). *P<0.05, ***P<0.001.
Discussion
Drug resistance to chemotherapeutic drugs or targeted medicines is an obstacle encountered in NSCLC treatment [21,22]. Besides mRNAs, lncRNAs and miRNAs have been reported to play an important part in the drug resistance of cancers [23,24,25]. In fact, some lncRNAs and miRNAs have been demonstrated to take part in drug resistance to chemotherapeutic drugs or targeted medicines of NSCLC, including lncRNA TUG1 related to 5-fluorouracil resistance [26], miR-15b related to sunitinib resistance [27].
Most lncRNAs and miRNAs may function as one member of the ceRNA regulatory networks. In fact, several reports have suggested that the ceRNA networks are related to the occurrence and progression of tumors, such as hepatocellular carcinoma [28], prostate cancer [29] and glioblastoma [30]. However, there have been few reports regarding the ceRNA regulatory networks and their involvement in drug resistance except for chemo-esistance to osteosarcoma [23] and cisplatin-resistance to epithelial ovarian cancer [31]. In our study, we present a comprehensive perspective on the potential function of lncRNAs and mRNAs. Based on RNA-sequencing and bioinformatics analysis, we constructed a ceRNA network that may be related to drug resistance to chemotherapeutic drugs and targeted medicines in NSCLC. The selected lncRNAs, miRNAs, and mRNAs in the networks corresponded with the ceRNA rule. There were 33 lncRNA-miRNA-mRNA pathways in the ceRNA regulatory network, includng 12 lncRNAs, five miRNAs and eight mRNAs. In addition, we conducted survival analysis and correlation analysis of the potential lncRNAs, miRNAs and mRNAs in the ceRNA regulatory network using TCGA data and found that four lncRNAs (lncRNA ATP2B1, lncRNA HIST1H4H, lncRNA RALGAPB, and lncRNA SNHG3) and one mRNA (PNRC1) were significantly related with overall survival. In addition, lncRNA ATP2B1/miR-222-5p/TAB2 and lncRNA HUWE1/miR-222-5p/TAB2 were revealed as potential ceRNA regulatory networks.
There have been a few reports suggesting that miR-222-5p and TAB2 are related to the occurrence and progression of tumors or drug resistance. MiR-222-5p has been reported to be involved in triple-negative breast cancer [32], central lymph node metastases of papillary thyroid cancer [33], ovarian cancer [34], and resistance tamoxifen treatment in breast cancer [35]. TAB2 is an activator of MAP3K7/TAK1 and is required for TLR-mediated or IL-1-induced NF-kB activation [36,37]. The NF-kB signaling pathway is a key regulator of tumor occurrence and development and can also take part in drug resistance to chemotherapy and targeted therapy [38,39]. Additionally, TAB2 has been reported to serve as a new target for tamoxifen resistance in breast cancer [40], and down-regulation of TAB2 may sensitize NSCLC cells to BMS-690514, a new pan-HER/VEGFR inhibitor [41]. In our study, we found that down-regulation of TAB2 enhanced the sensitivity of A549/DDP cells and we proposed that TAB2 might play a vital role in drug resistance to chemotherapy and targeted therapy in NSCLC. Until now, there have been no reports regarding TAB2 in NSCLC drug resistance, and further experiments are necessary to evaluate the role and mechanism of TAB2 in NSCLC drug resistance.
The mechanisms behind resistance to chemotherapeutic drugs or targeted medicines may differ greatly, but it is anticipated that some overlapping mechanisms between these two distinct types of drug resistance may exist. For example, ECM, which plays a vital role in biological processes such as cell proliferation, differentiation, and adhesion [42], can also be associated with chemotherapy resistance [43, 44] and may be related to gefitinib resistance via the ECM receptor [45]. Interestingly, we found that ECM-receptor interaction was one KEGG pathway in both the up- and down-regulated lncRNAs. This discovery further confirmed our speculation and may deepen our understanding of drug resistance.
To our knowledge, this is the first report to construct and analyse the ceRNA network of lncRNAs, miRNAs and mRNAs in NSCLC drug resistance to chemotherapeutic drugs or targeted medicines. However, there are some limitations to our study. For example, the validation of potential lncRNAs, miRNAs, and mRNAs in drug resistance of NSCLC were not performed, and the mechanism of the ceRNA network was not confirmed by luciferase reporter assay or RNA immunoprecipitation assays.
Conclusion
In conclusion, we provide here a comprehensive expression profile of lncRNAs, miRNAs, and mRNAs. We also constructed a lncRNA-miRNA-mRNA ceRNA regulatory network for drug resistance to chemotherapeutic drugs or targeted medicines in NSCLC. In addition, we found that lncRNA ATP2B1/miR-222-5p/TAB2 and lncRNA HUWE1/miR-222-5p/TAB2 are potential ceRNA regulatory networks in NSCLC drug resistance according to TCGA data and bioinformatics analysis. These results revealed that the lncRNA-miRNA-mRNA ceRNA regulatory network might play a vital role in drug resistance to NSCLC and might be a promising therapeutic strategy for further study. These results will deepen our comprehension of the ceRNA mechanisms involved in drug resistance to NSCLC.
Abbreviations
ceRNA: competing endogenous RNA; GEO: gene expression omnibus; GO: gene ontology; KEGG: kyoto encyclopedia of genes and genomics; lncRNA: long non-coding RNAs; miRNA: microRNA; MRE: miRNA-response element; NCBI: national center for biotechnology information; NSCLC: non-small cell lung cancer; qRT-PCR: quantitative real-time PCR; TCGA: the cancer genome atlas.
Supplementary Material
Supplementary table.
Acknowledgements
Author Contributions
KXZ and HSS designed the research, and wrote the paper; YYL and ZZJ analyzed data; DY, SZZ, LSS, ZC and YD performed the experiments. All authors read and approved the final manuscript.
Funding
The present study was financially supported by the National Natural Science Foundation of China (Grant No. 81600812 and 81903094), Program of Science & Technology of Henan Province (Grant No. 182102310554 and 172102310381). The funders had no role in study design, data collection, analysis, interpretation of data, or manuscript preparation.
Availability of data and materials
The raw and processed RNA-sequencing data were transmitted to the GEO database with the GEO accession number GSE132418 (https://www.ncbi.nlm.nih.gov/geo/query/acc.cgi?acc=GSE132418).
Competing Interests
The authors have declared that no competing interest exists.
References
1. Chen W, Zheng R, Baade PD. et al. Cancer statistics in China, 2015. CA: a cancer journal for clinicians. 2016;66:115-32
2. Yang Y, Li H, Hou S. et al. The noncoding RNA expression profile and the effect of lncRNA AK126698 on cisplatin resistance in non-small-cell lung cancer cell. PloS one. 2013;8:e65309
3. Brahmer J, Reckamp KL, Baas P. et al. Nivolumab versus Docetaxel in Advanced Squamous-Cell Non-Small-Cell Lung Cancer. The New England journal of medicine. 2015;373:123-35
4. Ramalingam SS, Owonikoko TK, Khuri FR. Lung cancer: New biological insights and recent therapeutic advances. CA: a cancer journal for clinicians. 2011;61:91-112
5. Rotow J, Bivona TG. Understanding and targeting resistance mechanisms in NSCLC. Nature reviews. Cancer. 2017;17:637-58
6. Cree IA, Charlton P. Molecular chess? Hallmarks of anti-cancer drug resistance. BMC cancer. 2017;17:10
7. Salmena L, Poliseno L, Tay Y. et al. A ceRNA hypothesis: the Rosetta Stone of a hidden RNA language? Cell. 2011;146:353-8
8. Sanchez-Mejias A, Tay Y. Competing endogenous RNA networks: tying the essential knots for cancer biology and therapeutics. Journal of hematology & oncology. 2015;8:30
9. Qi X, Zhang DH, Wu N. et al. ceRNA in cancer: possible functions and clinical implications. Journal of medical genetics. 2015;52:710-8
10. Langmead B, Salzberg SL. Fast gapped-read alignment with Bowtie 2. Nature methods. 2012;9:357-9
11. Kim D, Pertea G, Trapnell C. et al. TopHat2: accurate alignment of transcriptomes in the presence of insertions, deletions and gene fusions. Genome biology. 2013;14:R36
12. Pertea M, Pertea GM, Antonescu CM. et al. StringTie enables improved reconstruction of a transcriptome from RNA-seq reads. Nature biotechnology. 2015;33:290-5
13. Frazee AC, Pertea G, Jaffe AE. et al. Ballgown bridges the gap between transcriptome assembly and expression analysis. Nature biotechnology. 2015;33:243-6
14. Kong L, Zhang Y, Ye ZQ. et al. CPC: assess the protein-coding potential of transcripts using sequence features and support vector machine. Nucleic acids research. 2007;35:W345-9
15. Sun L, Luo H, Bu D. et al. Utilizing sequence intrinsic composition to classify protein-coding and long non-coding transcripts. Nucleic acids research. 2013;41:e166
16. Li JH, Liu S, Zhou H. et al. starBase v2.0: decoding miRNA-ceRNA, miRNA-ncRNA and protein-RNA interaction networks from large-scale CLIP-Seq data. Nucleic acids research. 2014;42:D92-7
17. Jeggari A, Marks DS, Larsson E. miRcode: a map of putative microRNA target sites in the long non-coding transcriptome. Bioinformatics. 2012;28:2062-3
18. Betel D, Wilson M, Gabow A. et al. The microRNA.org resource: targets and expression. Nucleic acids research. 2008;36:D149-53
19. Agarwal V, Bell GW, Nam JW. et al. Predicting effective microRNA target sites in mammalian mRNAs. eLife. 2015:4
20. Hu S, Yuan Y, Song Z. et al. Expression Profiles of microRNAs in Drug-Resistant Non-Small Cell Lung Cancer Cell Lines Using microRNA Sequencing. Cellular physiology and biochemistry: international journal of experimental cellular physiology, biochemistry, and pharmacology. 2018;51:2509-22
21. Maione P, Sacco PC, Sgambato A. et al. Overcoming resistance to targeted therapies in NSCLC: current approaches and clinical application. Therapeutic advances in medical oncology. 2015;7:263-73
22. Fennell DA, Summers Y, Cadranel J. et al. Cisplatin in the modern era: The backbone of first-line chemotherapy for non-small cell lung cancer. Cancer treatment reviews. 2016;44:42-50
23. Zhu KP, Zhang CL, Ma XL. et al. Analyzing the Interactions of mRNAs and ncRNAs to Predict Competing Endogenous RNA Networks in Osteosarcoma Chemo-Resistance. Molecular therapy: the journal of the American Society of Gene Therapy. 2019;27:518-30
24. Si W, Shen J, Zheng H. et al. The role and mechanisms of action of microRNAs in cancer drug resistance. Clinical epigenetics. 2019;11:25
25. Zang H, Peng J, Wang W. et al. Roles of microRNAs in the resistance to platinum based chemotherapy in the non-small cell lung cancer. Journal of Cancer. 2017;8:3856-61
26. Wang M, Hu H, Wang Y. et al. Long non-coding RNA TUG1 mediates 5-fluorouracil resistance by acting as a ceRNA of miR-197-3p in colorectal cancer. Journal of Cancer. 2019;10:4603-13
27. Lu L, Li Y, Wen H. et al. Overexpression of miR-15b Promotes Resistance to Sunitinib in Renal Cell Carcinoma. Journal of Cancer. 2019;10:3389-96
28. Liao X, Wang X, Huang K. et al. Integrated analysis of competing endogenous RNA network revealing potential prognostic biomarkers of hepatocellular carcinoma. Journal of Cancer. 2019;10:3267-83
29. Xu N, Wu YP, Yin HB. et al. Molecular network-based identification of competing endogenous RNAs and mRNA signatures that predict survival in prostate cancer. Journal of translational medicine. 2018;16:274
30. Yuan Y, Jiaoming L, Xiang W. et al. Analyzing the interactions of mRNAs, miRNAs, lncRNAs and circRNAs to predict competing endogenous RNA networks in glioblastoma. Journal of neuro-oncology. 2018;137:493-502
31. Zhao X, Tang DY, Zuo X. et al. Identification of lncRNA-miRNA-mRNA regulatory network associated with epithelial ovarian cancer cisplatin-resistant. Journal of cellular physiology. 2019
32. Piasecka D, Braun M, Kordek R. et al. MicroRNAs in regulation of triple-negative breast cancer progression. Journal of cancer research and clinical oncology. 2018;144:1401-11
33. Han PA, Kim HS, Cho S. et al. Association of BRAF V600E Mutation and MicroRNA Expression with Central Lymph Node Metastases in Papillary Thyroid Cancer: A Prospective Study from Four Endocrine Surgery Centers. Thyroid: official journal of the American Thyroid Association. 2016;26:532-42
34. Li Y, Liu C, Liao Y. et al. Characterizing the landscape of peritoneal exosomal microRNAs in patients with ovarian cancer by high-throughput sequencing. Oncology letters. 2019;17:539-47
35. Kim C, Go EJ, Kim A. Recurrence prediction using microRNA expression in hormone receptor positive breast cancer during tamoxifen treatment. Biomarkers: biochemical indicators of exposure, response, and susceptibility to chemicals. 2018;23:804-11
36. Shi M, Deng W, Bi E. et al. TRIM30 alpha negatively regulates TLR-mediated NF-kappa B activation by targeting TAB2 and TAB3 for degradation. Nature immunology. 2008;9:369-77
37. Zhang L, Ding X, Cui J. et al. Cysteine methylation disrupts ubiquitin-chain sensing in NF-kappaB activation. Nature. 2011;481:204-8
38. Li Q, Yang G, Feng M. et al. NF-kappaB in pancreatic cancer: Its key role in chemoresistance. Cancer letters. 2018;421:127-34
39. Darvishi B, Farahmand L, Eslami SZ. et al. NF-kappaB as the main node of resistance to receptor tyrosine kinase inhibitors in triple-negative breast cancer. Tumour biology: the journal of the International Society for Oncodevelopmental Biology and Medicine. 2017;39:1010428317706919
40. Cutrupi S, Reineri S, Panetto A. et al. Targeting of the adaptor protein Tab2 as a novel approach to revert tamoxifen resistance in breast cancer cells. Oncogene. 2012;31:4353-61
41. de La Motte Rouge T, Galluzzi L, Olaussen KA. et al. A novel epidermal growth factor receptor inhibitor promotes apoptosis in non-small cell lung cancer cells resistant to erlotinib. Cancer research. 2007;67:6253-62
42. Liu T, Zhou L, Li D. et al. Cancer-Associated Fibroblasts Build and Secure the Tumor Microenvironment. Frontiers in cell and developmental biology. 2019;7:60
43. Rintoul RC, Sethi T. Extracellular matrix regulation of drug resistance in small-cell lung cancer. Clinical science. 2002;102:417-24
44. Helleman J, Jansen MP, Burger C. et al. Integrated genomics of chemotherapy resistant ovarian cancer: a role for extracellular matrix, TGFbeta and regulating microRNAs. The international journal of biochemistry & cell biology. 2010;42:25-30
45. Ju L, Zhou C, Li W. et al. Integrin beta1 over-expression associates with resistance to tyrosine kinase inhibitor gefitinib in non-small cell lung cancer. Journal of cellular biochemistry. 2010;111:1565-74
Author contact
![]() Corresponding author: Xiangzhen Kong, Department of Pharmacy, the First Affiliated Hospital of Zhengzhou University, Henan Key Laboratory of Precision Clinical Pharmacy, No.1 Jianshe road, Zhengzhou, Henan, China 450052. Tel. +86-371-6629-5652, Email: fcckongxzedu.cn.
Corresponding author: Xiangzhen Kong, Department of Pharmacy, the First Affiliated Hospital of Zhengzhou University, Henan Key Laboratory of Precision Clinical Pharmacy, No.1 Jianshe road, Zhengzhou, Henan, China 450052. Tel. +86-371-6629-5652, Email: fcckongxzedu.cn.