Impact Factor ISSN: 1837-9664

 Global reach, higher impact
J Cancer 2018; 9(15):2723-2733. doi:10.7150/jca.26339 This issue Cite
Research Paper
Differentially expressed genes of HepG2 cells treated with gecko polypeptide mixture
Yi-Meng Duan, Ying Jin, Meng-Li Guo, Leng-Xin Duan, Jian-Gang Wang ![]()
Medical College Department of Pharmacy, Henan University of Science and Technology, Luoyang 471023, Henan Province, China
Received 2018-3-28; Accepted 2018-5-16; Published 2018-6-23
Abstract
Gecko (Gekko japonicus) extracts have been used in traditional Chinese medicine for many years. It has been proven that the gecko polypeptide mixture (GPM) extracted from gecko can inhibit the growth of multiple types of tumor cells. In order to investigate the possible anti-tumor molecular mechanisms of GPM, we used RNA-seq technology to identify the differentially expressed genes (DEGs) of human hepatocellular carcinoma (HCC) HepG2 cells treated with or without GPM. MTT assay was used to detect the viability of HepG2 cells. DAPI fluorescence staining was performed to observe morphological changes in the nuclei of HepG2 cells. Western blot analysis was applied to observe the expressions of apoptosis-related and endoplasmic reticulum stress (ERS)-related proteins in HepG2 cells. Flow cytometry assay was performed to detect the apoptosis and reactive oxygen species (ROS) in HepG2 cells. Our results showed that GPM inhibited HepG2 cells proliferation and induced the apoptosis of HepG2 cells. RNA-seq analysis suggested that the ER-nucleus signaling pathway involved in the anti-cancer molecular mechanism of GPM. Therefore, GPM may induce apoptosis in HepG2 cells via the ERs pathway.
Keywords: gecko, RNA-seq technology, hepatocellular carcinoma, reactive oxygen species, apoptosis
Introduction
Hepatocellular carcinoma (HCC) is the 6th most common cancer and the third leading cause of cancer mortality worldwide [1]. A number of epidemiological studies report that the risk factors, implicated in the onset and development of HCC, include alcohol abuse, aflatoxin contamination in food, and hepatitis B virus (HBV) or hepatitis C virus (HCV) infection. Characterized by a high incidence and a low survival rate, HCC represents a substantial health problem worldwide [2-4]. Furthermore, HCC cells are highly aggressive and typically spread to other organ, which leads to distant metastases and poor survival rates [5, 6]. Therefore, it is of utmost importance to search for novel therapeutic agents against HCC and explore the related cytotoxic molecular mechanisms.
Currently, conventional chemotherapy drugs are often associated with the development of drug resistance and serious adverse reactions. Consequently, the high efficiency and low toxicity of natural anti-tumor medicines extracted from plants and animals may be a new strategy to treat cancer [7]. Gecko extracts, has been shown to inhibit the growth of various tumor cells, such as SiHa, EC109, SMMC7721 cells [8, 9]. With the development of genomics, transcriptomics, proteomics, and metabolomics technologies, RNA-seq technology has been widely used in recent years [10]. Compared with traditional sequencing methods, RNA-seq technology has the advantages of high throughput, low cost, high sensitivity, and good repeatability [11-13], and the RNA-seq technique can accurately identify alternative splicing sites, single nucleotide polymorphisms (SNPs), and the untranslated region (UTR) [14, 15].
To reveal the molecular mechanism of GPM, we used RNA-seq technology to compare and analyze mRNA expression in HepG2 cells treated with GPM. Our study shows the systematic anti-cancer mechanisms of GPM in HepG2 cells. The gene expression profile suggests that DEGs are mainly involved in apoptotic processes and the endoplasmic reticulum (ER)-nucleus signaling pathway. Our results reveal that differentially expressed genes (DEGs) are mainly enriched in protein processing in the ER. GPM can inhibit cell proliferation and induce apoptosis in HepG2 cells via endoplasmic reticulum stress (ERS).
Materials and methods
Cell culture and drugs
Gekko japonicus was purchased from Bozhou Yonggang Medicinal Herbs Factory Co. (Anhui, China). The human HCC cell line HepG2 was obtained from the Medical Science Research Institute of Henan (Henan, China). Methylthiazolyldiphenyl-tetrazolium bromide (MTT) was purchased from Sigma (St. Louis, MΟ, USA). Dulbecco's Modified Eagle Medium (DMEM) and DAPI solution were obtained from Solarbio (Beijing, China). Also, fetal bovine serum (FBS) was purchased from Hangzhou Sijiqing Biological Engineering Materials Co. (Hangzhou, China). Animal procedures and experiments were carried out in strict accordance with the international standards of care guidelines and were approved by the Institutional Animal Care and Use Committee of the Henan University of Science and Technology.
Preparation of GPM
Gecko powder (100 g) was homogenized in 400 mL double-distilled water. Following centrifugation at 5,600g for 5 minutes, the precipitate was resuspended in 400 mL of 55% ethanol. The supernatant was then collected following centrifugation at 5,600g for 5 minutes, and evaporated under reduced pressure at 55˚C. Subsequently, the resulting yellow powder was collected after freeze‑drying the liquid residue. Gel filtration chromatography (Sephadex G-25) was used to purify the yellow powder, and ultimately, the GPM was collected.
Cell culture and morphological observation
HepG2 cells were cultured in DMEM supplemented with 10% FBS at 37˚C in a humidified 5% CO2 incubator. The culture medium was replaced every 2 days and the cells in the logarithmic growth phase were used for the following experiments. To stain the nuclei, HepG2 cells were incubated in various concentrations of GPM for 24 hours, and then stained with DAPI for 10 minutes. The cells were observed and imaged with a florescence microscope.
MTT assay
HepG2 cells were seeded in a 96-well plate at a density of 2.5 × 10⁴ cells/well. After incubation for 2, 8, and 20 hours, 20 µL of the MTT reagent (5 mg·L-1) was added per well and incubated for another 4 hours. The supernatant was removed and 200 µL of dimethyl sulfoxide (DMSO) was added. The absorbance (A) was measured with an ELX800 Universal Microplate reader at 490 nm. The cell proliferation inhibition rate (IR) was calculated as follows: IR = (1-A GPM/A control) × 100%.
Flow cytometry analysis
Targeted cells were digested with trypsin (EDTA free), and 1 × 10⁵ cells after they were rinsed twice with PBS and cenctrifuged at 2000 r·min-1 for 5 min. A volume of 500 µL Annexin V-Binding Buffer, 5 µL Annexin V-flurescein isothiocyanate (FITC), and 5µL propidium iodide were then mixed with cells successively for reaction at room temperature for 15 min in darkness. Flow cytometry was applied to detect cell apoptosis.
RNA extraction and sequencing
Cells were cultured in 10 cm plastic culture dishes and treated with GPM for 6, 12, and 24 hours. All samples were analyzed in biological triplicate. The experimental grouping of RNA-seq samples is shown in Table 1. Total RNA was isolated using TRIzolTM Reagent (Invitrogen) according to the manufacturer's instructions. RNA samples were sent to the Beijing Genomics Institution (BGI, Shenzhen, China), which performed RNA library construction and sequencing. The quality of total RNA was tested on Bioanalyzer 2100 (Agilent). The library was constructed using cDNA, which used random primers to shear and reverse transcribe the RNA. The library quality was verified by using Bioanalyzer 2100 (Aligent). Then, the library sequencing was performed by the sequencing platform BGISEQ-500 (BGI). All of the generated raw sequencing reads were filtered to remove reads with adaptors, in which unknown bases are more than reads 10%, and low quality reads. The original sequence data have been submitted to the database of the NCBI Sequence Read Archive, and the accession number is SRP110647. Bowtie2 was used to map clean reads to reference genes and HISAT was used map clean reads to reference genomes. RSEM was used to quantify the gene expression levels. The DEGs between two groups were screened by the NOIseq method. For the NOIseq method, samples were first grouped so that pairwise control-treatment groups could be compared. The provided group information is as follows. Finally, the DEGs were screened according to the following default criteria: Fold change ≥ 2 and diverge probability ≥ 0.8. Annotation analysis of Gene Ontology (GO) was performed for screened DEGs. The WEGO software was used for GO functional classification. If the corrected P value was less than 0.05, this GO item was enriched to describe the difference in the functional distribution between the compared samples. Pathway enrichment analyses of DEGs were based on KEGG database (http://www.genome.jp/kegg/pathway.html) through statistical tests to identify the differential gene involved in the cell transduction pathway and metabolic pathways. The protein-protein interaction network of DEGs was analyzed using Cytoscape (3.5.0) according to the program instructions.
Experimental grouping of RNA-seq samples.
| Sample | Name | Group |
|---|---|---|
| 1 | Con_0 h | Control |
| 2 | GPM_6 h_03 | GPM-6h (0.3 mg·mL-1) |
| 3 | GPM_12 h_01 | GPM-12h (0.3 mg·mL-1) |
| 4 | GPM_12 h_02 | GPM-12h (0.3 mg·mL-1) |
| 5 | GPM_12 h_03 | GPM-12h (0.3 mg·mL-1) |
| 6 | GPM_12 h_04 | GPM-12h (0.3 mg·mL-1) |
| 7 | GPM_24 h_03 | GPM-24h (0.3 mg·mL-1) |
Quantitative polymerase chain reaction (q-PCR) analysis
HepG2 cells were exposed to GPM for 6, 12, and 24 hours, followed by total RNA extraction. Then, RNA was reverse transcribed to cDNA using a cDNA synthesis kit (Vazyme Biotech, Nanjing, China). Quantitative polymerase chain reaction (qPCR) analysis was performed as follows: denaturation at 95°C for 5 minutes, and 40 cycles of 95°C for 10 seconds and 60°C for 30 seconds. qPCR was performed using a BioRad CFX Real-Time PCR machine (Bio-Rad, USA) with SYBR Green Master Mix (Vazyme, Biotech, Nanjing, China). The specific primer sequences using in this study are listed in Supplementary Table 3. All samples were analyzed in biological triplicate. The comparative cycle threshold method (2-ΔΔCt method) was used to analyze the expression levels of the different genes.
Determination of intracellular reactive oxygen species (ROS)
The fluorescent probe, DCFH-DA, which does not fluoresce, was used to detect intracellular ROS. After entering the cells, DCFH-DA is hydrolyzed to DCFH. Then, intracellular ROS oxidizes DCFH to produce fluorescent DCF. The intracellular ROS level was measured by detecting the fluorescent intensity of DCF. Briefly, 2 × 10⁵ HepG2 cells were plated in 6-well plates. The following day, cells were treated with different concentrations of GPM (0 mg·mL-1, 0.1 mg·mL-1, 0.2 mg·mL-1, 0.3 mg·mL-1). Then, after removing the cell medium, cells were incubated in 10 μM DCFH-DA (diluted in serum-free medium) for 20 minutes at 37°C in darkness. The cells were collected and washed with PBS after centrifugation. The DCF fluorescence was detected by a flow cytometer (BD Bioscience).
Western blotting
HepG2 cells (2.5 × 10⁵) were plated in 6-well plates and treated with different concentrations of GPM (0 mg·mL-1, 0.1 mg·mL-1, 0.2 mg·mL-1, 0.3 mg·mL-1) for 24 hours. The cells were washed with ice-cold PBS, and 60 μL of RIPA lysis buffer (Solarbio, Beijing, China) was added to all samples. The protein concentrations were detected by a BCA protein assay kit (Solarbio, Beijing, China). Then, the proteins were separated by 12% SDS-PAGE and transferred to polyvinylidene difluoride (PVDF) membranes (PALL, USA). The membranes were blocked with 5% skim milk for 2 hours at 37°C, and then incubated in primary antibodies, including anti-PERK, anti-GRP78, anti-ATF4, anti-CHOP, anti-PARP, and anti-caspase-3, overnight at 4°C. On the following day, the membranes were incubated in HRP-labeled secondary antibodies (goat anti-rabbit) at 37°C for 1 hour. All antibodies were purchased from Proteintech (Wuhan, China). The eECL Western blot kit (cwbiotech, Beijing, China) was used to detect the signals (BioRad, USA). Results from the Western blots were analyzed by Image J software.
Statistical analysis
All values were presented as mean ± standard deviation. Statistical analyses were conducted using GraphPad Prism Software. * indicates the values are significantly different than the control (*P<0.05, **P<0.01).
Results
GPM inhibits HepG2 cell proliferation and induces apoptosis
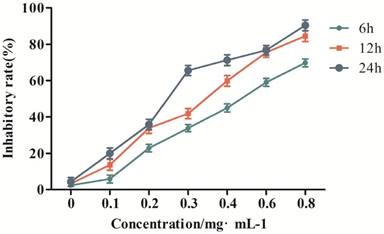
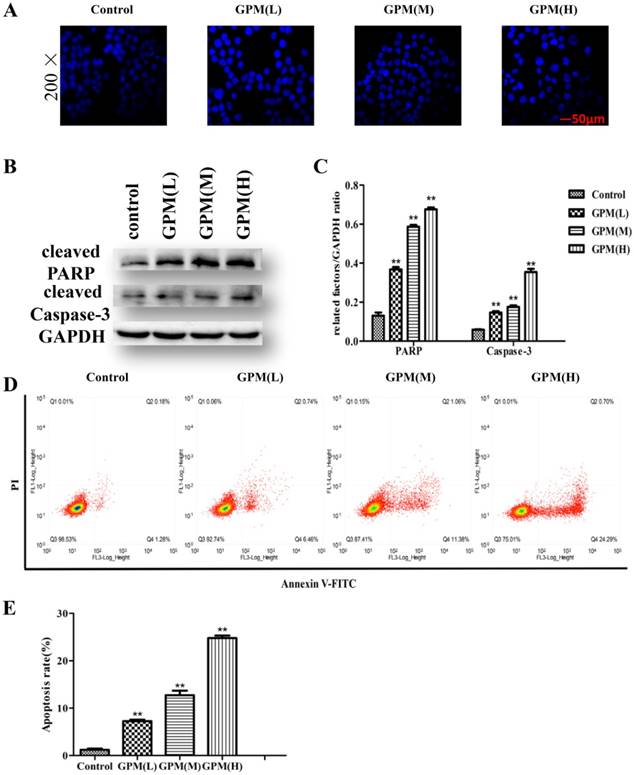
To verify the effect of GPM on the proliferation of HepG2 cells, we performed an MTT assay to measure cell viability after treating the cells with different concentrations of GPM. In this study, the results showed that GPM effectively inhibited HepG2 cell proliferation. The inhibitory rate was increased in a time- and dose-dependent manner (Figure 1). The inhibitory rate of 0.3 mg·mL-1GPM were 33.81%, 41.87% and 66.57% at 6, 12 and 24 hours respectively. IC50 values were 0.464 mg·mL-1, 0.316 mg·mL-1, 0.242 mg·mL-1 at 6, 12, and 24 hours, respectively. The typical morphological changes of apoptosis, such as chromatin condensation, nuclear fragmentation and reduced cell volume, were observed in the nuclei of HepG2 cells (Figure 2A). Apoptosis-related cleaved poly ADP-ribose polymerase (PARP) and cleaved cysteinyl aspartate specific proteinase-3 (caspase-3) protein expressions were also notably up-regulated (Figure 2B and C). Flow cytometry assay results showed that cell apoptosis rate in control group was 1.46% while the rate was 7.20%, 12.44% and 24.99%, respectively in GPM group. There is significant different between the control and different dose GPM group (Figure 2D). Altogether, these data indicate that GPM inhibits HepG2 cell growth and induces apoptosis in vitro.
The inhibitory effect of GPM on HepG2 cell proliferation.
GPM induces apoptosis in HepG2 cells. A. HepG2 cells were exposed to GPM (0.1 mg·mL-1, 0.2 mg·mL-1 and 0.4 mg·mL-1) for 24 hours. The cells were then stained with DAPI, and the morphological indicators of apoptosis in the nuclei were examined by fluorescence microscopy. Representative images of each treatment are shown. B. HepG2 cells were treated with GPM (0.1 mg·mL-1, 0.2 mg·mL-1 and 0.4 mg·mL-1) for 24 hours, followed by western blot analysis of cleaved PARP and caspase-3 expression. C. The relative ratios of PARP and caspase-3 protein expression normalized to GAPDH. D. GPM attenuates cell apoptosis. Cell apoptosis was evaluated by flow cytometry. E. The apoptosis rate of each treatment. All values are graphed as the mean ± S.D. (*P<0.05, **P<0.01 vs. control group).
Global gene expression profile of HepG2 cells treated with GPM
In this study, we sequenced 21 samples of GPM-treated HepG2 cells using RNA-seq technology to generate 23,979,455 raw sequencing reads, and 23,895,941 clean reads were obtained after filtering low quality reads. The average genome mapping ratio was 94.73 % (Supplementary Table 1). The gene expression profiles of HepG2 cells treated with GPM were clearly different from those without GPM. DEGs screening aimed to find DEGs between samples and to further analyze the functions. For example, by comparing the DEGs of the cells treated with blank control and 0.4 mg·mL-1 GPM for 12 hours, the total number of DEGs was 498, including 156 down-regulated and 342 up-regulated genes (Supplementary Table 2), as shown in the “volcano plot” of gene expression profiles (Figure 3A). The other pairwise volcano plots of all expressed genes are shown in Supplementary Figure 1. In particular, the histogram revealed significant up-regulation and down-regulation of DEGs in each pairwise group (Figure 3B). These data have shown a dose-dependent effect of GPM in HepG2 cells after 12 hours of treatment.
Global gene expression profile of HepG2 cells treated with GPM. A. Gene expression between control and GPM-treated (0.4 mg·mL-1 for 12 hours) HepG2 cells were graphed in a volcano plot for pairwise comparison. Each dot represents a DEG with the red dots indicating significant DEGs that have passed the screening threshold, and black dots as non-significant or “false” DEGs. B. The number of up- and down-regulated DEGs from each pairwise comparison of the indicated GPM treatment doses and times. C. Relative mRNA levels of representative DEGs from the control and GPM-treated samples were quantified using q-PCR. The numbers shown in parentheses indicate the fold changes (Log2) of the corresponding genes from the RNA-seq data. The relative mRNA expression of each indicated gene normalized to GAPDH expression was graphed as the mean ± S.D.
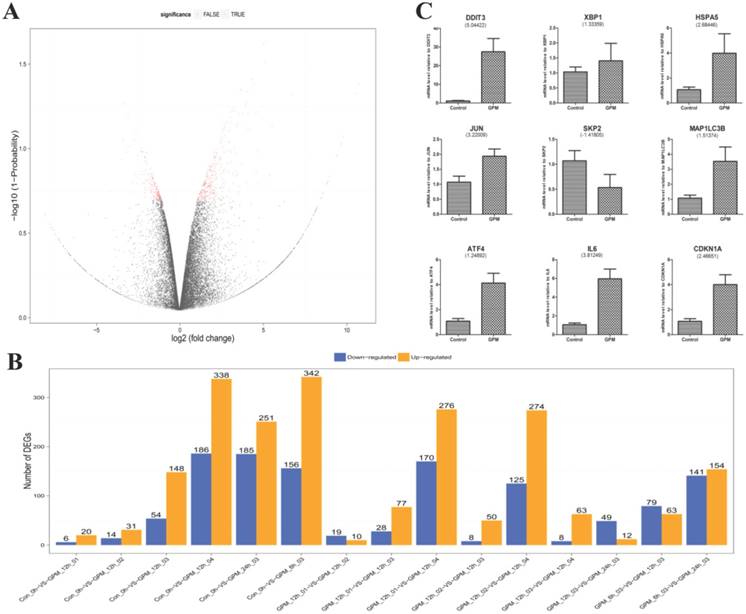
To test and verify the accuracy of the next generation sequencing results, we performed q-PCR analysis of nine selected genes (Figure 3C). The fold changes (Log2) of the DEGs are shown in parentheses under the corresponding genes from the RNA-seq data. These two gene expression analysis platforms demonstrated concordant results.
Gene Ontology analysis of DEGs
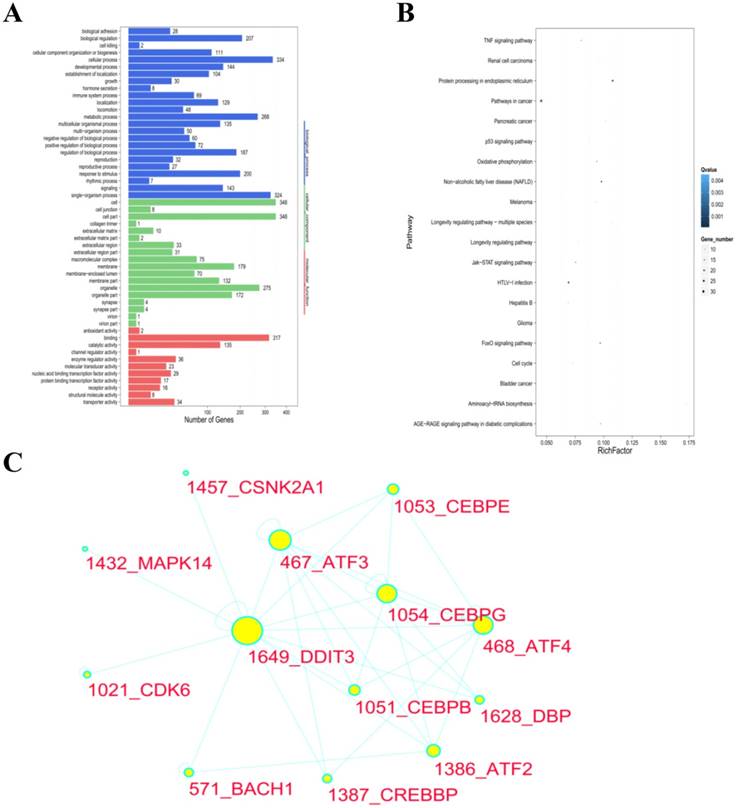
We screened the DEGs for GO enrichment analysis, which were analyzed by multiple hypotheses testing. Comparing the DEGs of the blank control cells and the GPM-treated (0.4 mg·mL-1 for 12 hours) cells, 1713 GO entries were generated after being annotated by the GO classification system. These GO entries were related to cell components (179 entries), molecular function (184 entries) and biological processes (1350 entries), respectively. The cell components were significantly enriched in the cytoplasm. The significantly enriched molecular function focused on ligase and protein binding activity. The significantly enriched biological processes included ER signaling pathways, ERS, stress intracellular responses, protein phosphorylation, amino acid activity, angiogenesis, signal transduction and programmed cell death. The same results were observed in other pairwise comparisons (Supplementary Figure 2). The GO terms list and histogram are shown in Table 2 and Figure 4A.
The top fifteen GO enrichment of the DEGs in GPM Con_0h -VS- GPM_12 h_04.
| GO ID | GO term | Category | DEGs | Number of annotated genes | Corrected P-value |
|---|---|---|---|---|---|
| GO:0006984 | ER-nucleus signaling pathway | Biological processes | 23 | 363 | 2.34E-12 |
| GO:0033554 | Cellular response to stress | Biological processes | 56 | 373 | 1.99E-07 |
| GO:0006915 | Apoptotic process | Biological processes | 50 | 373 | 5.30E-04 |
| GO:0065007 | Biological regulation | Biological processes | 207 | 373 | 1.11E-02 |
| GO:0022900 | Electron transport chain | Biological processes | 12 | 373 | 1.75E-02 |
| GO:0001525 | Angiogenesis | Biological processes | 17 | 373 | 2.35E-02 |
| GO:0007165 | Signal transduction | Biological processes | 123 | 373 | 2.49E-02 |
| GO:0012501 | Programmed cell death | Biological processes | 58 | 373 | 2.53E-02 |
| GO:0005623 | Cell | Cell components | 348 | 392 | 8.80E-04 |
| GO:0005737 | Cytoplasm | Cell components | 161 | 392 | 1.66E-03 |
| GO:0005743 | Mitochondrial inner membrane | Cell components | 11 | 392 | 3.55E-02 |
| GO:0005515 | Protein binding | Molecular function | 162 | 363 | 2.00E-04 |
| GO:0004812 | Aminoacyl-tRNA ligase activity | Molecular function | 8 | 363 | 2.26E-03 |
| GO:0003954 | NADH dehydrogenase activity | Molecular function | 7 | 363 | 7.28E-03 |
| GO:0019900 | Kinase binding | Molecular function | 23 | 363 | 2.06E-02 |
GO and KEGG functional protein-protein interaction network analysis of DEGs in cells treated with GPM. A. The GO functional classification of DEGs from pairwise comparisons of control and GPM-treated HepG2 cells are shown based on the number of genes involved in the indicated biological processes, cellular components, and molecular functions. B. Based on KEGG pathway enrichment analysis, the top enriched pathways are plotted with the size of the dots indicating the number of genes enriched in each pathway. The Rich Factor is the ratio of the number of DEGs annotated in each pathway, with the greater Rich Factor indicating greater intensiveness. The Q value is the corrected P value, with lower Q values signifying greater significance. C. The protein-protein interaction network of DEGs in HepG2 cells treated with GPM (0.3 mg·mL-1) for 24 hours is shown with DDIT3 as a major target gene. The size of the circle for each of the indicated genes represents the strength of the interaction with the other related genes.
Kyoto Encyclopedia of Genes and Genomes (KEGG) pathway enrichment analysis of DEGs
To better understand the molecular mechanisms of GPM in HepG2 cells, we performed the KEGG enrichment analysis for DEGs. By comparing the DEGs of the cells, which were treated with control and 0.4 mg·mL-1 GPM, the DEGs were enriched in 252 pathways. The significantly enriched pathways included the metabolic pathway, tumor signal pathway and protein processing in ER, which were enriched in 54, 32, 24 DEGs, respectively. The top 20 most enriched pathways are shown in a scatter plot (Figure 4B). More detailed information about the standard for ranking these pathways is included in Table 3. The majority of DEGs in the “protein processing in ER” pathway were up-regulated in GPM-treated cells. According to the results, the differential regulation of the ERS signaling pathway may be one of the molecular mechanisms of the anti-tumor activities of GPM. The same results were also reflected in other pairwise comparisons (Supplementary Figure 3).
The top ten enriched KEGG pathways of the DEGs in GPM Con_0h -VS- GPM_12 h_04.
| Pathway | Pathway ID | DEGs genes with pathway annotation (440) | All genes with pathway annotation (19407) | P-value | Q-value |
|---|---|---|---|---|---|
| Metabolic pathways | ko01100 | 54 | 440 | 6.89E-03 | 3.49E-02 |
| Pathways in cancer | ko05200 | 32 | 440 | 9.55E-05 | 2.00E-03 |
| Protein processing in endoplasmic reticulum | ko04141 | 24 | 440 | 2.22E-10 | 5.60E-08 |
| HTLV-1 infection | ko05166 | 23 | 440 | 1.79E-06 | 1.13E-04 |
| PI3K-Akt signaling pathway | ko04151 | 23 | 440 | 2.82E-03 | 1.95E-02 |
| Non-alcoholic fatty liver disease (NAFLD) | ko04932 | 20 | 440 | 3.76E-08 | 4.74E-06 |
| Focal adhesion | ko04510 | 18 | 440 | 5.37E-03 | 2.94E-02 |
| Rap1signaling pathway | ko04015 | 18 | 440 | 3.24E-02 | 1.24E-01 |
| FoxO signaling pathway | ko04068 | 17 | 440 | 4.80E-07 | 4.03E-05 |
| MAPK signaling pathway | ko04010 | 17 | 440 | 4.49E-03 | 2.69E-02 |
Protein-Protein Interaction (PPI) network of DEGs
Different proteins form complex polymers through complicated interactions to trigger biological processes. Protein-protein interaction network analysis constructs interaction networks for DEG-coded proteins. Based on the results of GO and KEGG enrichment analyses of DEGs, the involvement of ERS signaling pathway regulation was highlighted. DDIT3 is a member of the CCAAT/enhancer-binding protein (C/EBP) family of transcription factors, also known as CHOP, which induces cell apoptosis in response to ERS [16-18]. In this report, we used the DEGs of HepG2 cells treated with GPM (0.3 mg·mL-1 for 24 hours) to construct a PPI network (Figure 4C). DDIT3 was selected as a target gene to build a subnetwork, which includes 12 nodes that those nodes were considered to be associated with DDIT3 functions. The size of the circle indicates the degree of the relationship with DDIT3. For instance, ATF4 (activating transcription factor 4), as a transcription factor, increases the expression of DDIT3.
GPM induces ROS generation and activates unfolded protein response in HepG2 cells
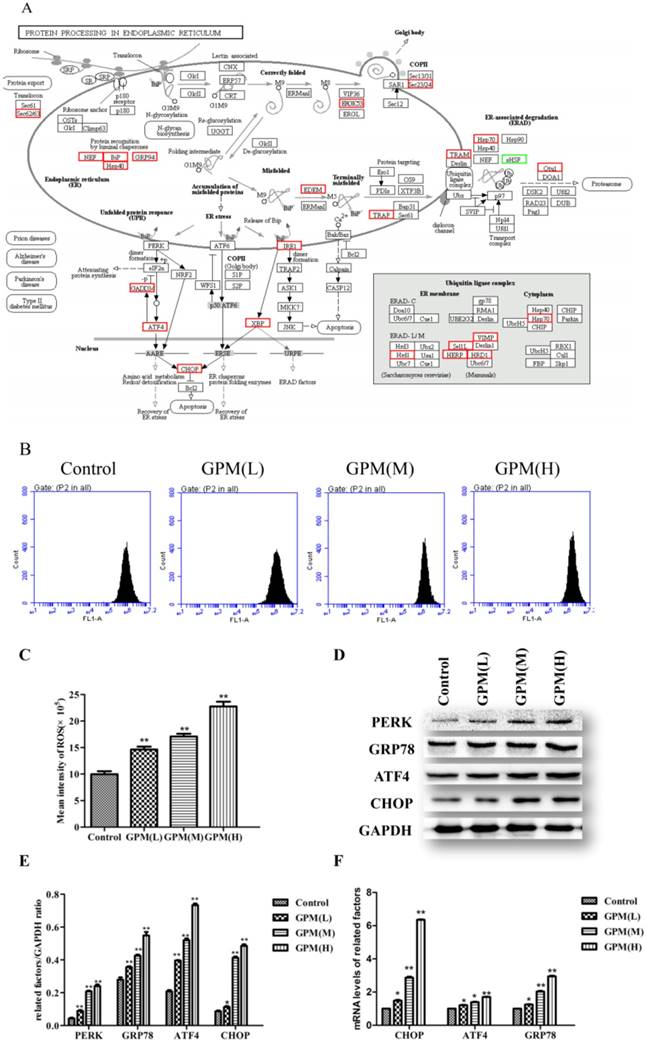
In order to test the effect of GPM on KEGG pathways at the individual gene level, we mapped DEGs in cells treated with GPM on protein processing in ER (Figure 5A). Persistent oxidative stress plays an important factor in mediating ERS and may become the inducer of ERS [19-21]. GPM attenuated the generation of ROS in HepG2 cells (Figure 5B and 5C). Herein, Western blot analysis indicated that the PERK signaling pathway of the UPR was activated and significantly up-regulated in a dose-dependent manner (Figure 5D and 5E). Consistent with our observation in the western blot results, the gene expression levels of CHOP, ATF4, and glucose-regulated protein 78 (GRP78) were up-regulated in cells treated with GPM (Figure 5F). Together, these results suggest that GPM can trigger ROS generation in HepG2 cells and activate the PERK signaling pathway.
GPM induces ROS generation and activates UPR in human HepG2 cells. A. In the KEGG pathway of protein processing in ER, the up-regulated (red boxes) and down-regulated (green boxes) genes are indicated in HepG2 cells treated with GPM (0.3 mg·mL-1) for 24 hours. Genes that are not altered by GPM treatment are marked with black borders. B. Representative flow cytometry peaks of HepG2 cells were treated with GPM (0.1, 0.2, and 0.4 mg·mL-1) for 24 hours, followed by flow cytometry analysis to detect intracellular ROS production. C. The average intensity of ROS production for each treatment. D. Western blot analysis of the indicated proteins involved in ERS are shown in control, GPM-treated (0.1, 0.2, and 0.4 mg·mL-1) HepG2 cells. E. The relative ratios of the expression of the indicated proteins normalized to GAPDH. F. Relative mRNA levels of the indicated genes from the control, GPM-treated HepG2 cells were quantified using q-PCR and normalized to GAPDH expression All values were graphed as the mean ± S.D. (*P<0.05, **P<0.01 vs. corresponding control group).
Discussion
In the past decade, many traditional Chinese medicines have been applied as anti-tumor agents, and have been characterized by low toxicity and promising therapeutic effects [7]. For instance, the gecko ethanol extract (GEE) has been proven to inhibit the growth of H22 xenograft tumors in vivo and induce apoptosis in vitro [8]. Other studies have demonstrated that GEE can inhibit SiHa cell growth, which may be through the inhibition of cell proliferation, angiogenesis and survival. Another study reported that GEE can reduce the growth of transplanted H22 hepatomas in mice, which may be related to the decreased expression of VEGFA, MMP-2, and p-Erk [9]. Overall, traditional research methods confined the mechanism of traditional Chinese medicine by one or several aspects, unable to systematic and comprehensive expression of its mechanism. Therefore, it is beneficial to study the anti-tumor mechanism effects of GPM by using system biology research methods, such as gene expression profiling. In this study, we not only characterized the potential target genes of GPM by differential gene expression, but also identified potential biological pathways targeted by GPM.
We have verified a series of genes expressions in HepG2 cells treated with GPM. We used q-PCR to validate the results of RNA-seq. As expected, the DEGs, including DDIT3, X-box binding protein 1 (XBP1), activating transcription factor 4 (ATF4), and heat shock protein family A member 5 (HSPA5), were significantly up-regulated by GPM in the cells. These genes were mapped to many signal pathways, of which the ERS signaling pathway is one of the most important signal transduction pathways in the cells. Many studies have shown that the ERS signaling pathway plays an important role in the occurrence and development of tumors [22, 23]. CHOP protein was the one of downstream Effectors of cell apoptosis [24, 25], which may be responsible for GPM to inhibit the growth of tumor cells. In this study, we also found that some of DEGs involved in cell cycle, such as cyclin dependent kinase inhibitor 1A (CDKN1A), which are significantly up-regulated and regulated by the tumor suppressor protein p53. CDKN1A not only regulates p53-dependent G1 phase cell cycle arrest in response to a variety of stressors, but also plays a regulatory role in DNA replication and DNA damage repair [26, 27]. Interestingly, we also observed that S-phase kinase-associated protein 2 (SKP2), an E3 ubiquitin-protein ligase involved in the ubiquitin-mediated proteolysis signaling pathway [28-30], was significantly up-regulated by GPM. Microtubule associated protein 1 light chain 3 beta (MAP1LC3B) is a gene involved in autophagy in cancer [31, 32].
By integrating the data of the digital gene expression spectrum, it seems that ERS is one of the main anti-tumor mechanisms of GPM in HepG2 cells. The ER is an important organelle in eukaryotic cells that can regulate intracellular protein synthesis and folding, intracellular calcium levels and oxidative stress [33, 34]. Persistent stress reactions, such as the formation of ROS, trigger ERS and initiate the UPR [35, 36]. There are three important molecular signal receptors in ER membranes: protein kinase R-like ER kinase (PERK), inosital-requiring enzyme-1 (IRE1) and activating transcription factor 6 (ATF6) [34, 37-38]. From the gene expression profile, we observed that the DEGs were mainly enriched in protein processing in ER, such as GRP78, ATF4 and CHOP. In the ERS state, the ER membrane molecular signaling sensor PERK were activated, which promoted the dissociation of GRP78 and PERK [32, 39-40]. Activated PERK increased the phosphorylation of eukaryotic initiation factor 2α (eIF2α), which up-regulated the expression of ATF4. ATF4 increased the expression of CHOP, a pro-apoptotic protein. Notably, prolonged ERS can induce apoptosis [41]. We observed that DDIT3 expression significantly changes in HepG2 cells after treatment with GPM. Moreover, GPM induced ROS generation and increased CHOP expression in HepG2 cells. Also, the expressions of PERK, ATF4 and GRP78 were also increased by GPM. The apoptosis-related proteins PARP and caspase-3 were also up-regulated by GPM.
In summary, we obtain the whole global gene expression profiles of HepG2 cells treated with or without GPM and demonstrate that GPM may inhibit proliferation and induce the apoptosis of HepG2 cells via ERS signaling pathway.
Abbreviations
HCC: human hepatocellular carcinoma;
DEGs: differentially expressed genes;
ROS: reactive oxygen species;
ERS: endoplasmic reticulum stress;
HBV: hepatitis B virus;
HCV: hepatitis C virus;
SNPs: single nucleotide polymorphisms;
UTR: untranslated region;
GO: Gene Ontology;
KEGG: Kyoto Encyclopedia of Genes and Genomes;
PPI: Protein-protein Interaction;
UPR: unfolded protein response;
caspase-3: cysteinyl aspartate specific proteinase-3;
PARP: poly ADP-ribose polymerase;
XBP1: X-box binding protein 1;
ATF4: activating transcription factor 4;
HSPA5: heat shock protein family A member 5;
ATF4: activating transcription factor 4;
CDKN1A: cyclin dependent kinase inhibitor 1A;
SKP2: S-phase kinase-associated protein 2;
MAP1LC3B: microtubule associated protein 1 light chain 3 beta;
CHOP: CCAAT/enhancer-binding protein (C/EBP) family of transcription factors;
GRP78: glucose-regulated protein 78;
PERK: protein kinase R-like ER kinase;
IRE1: inosital-requiring enzyme-1;
ATF6: activating transcription factor 6;
eIF2α: eukaryotic initiation factor 2α.
Supplementary Material
Supplementary Table 1.
Supplementary Table 2.
Supplementary Table 3.
Supplementary figures.
Acknowledgements
This study was supported by Science and Technology Key Research Fund funded projects of Henan Province, China, No. 142102310031. We thank DR. Erin Howard and Xiao-He Yang for their proofreading the article.
Competing Interests
The authors have declared that no competing interest exists.
References
1. Zheng B, Zhu YJ, Wang HY, Chen L. Gender disparity in hepatocellular carcinoma (HCC): multiple underlying mechanisms. Science China Life sciences. 2017;60:575-84
2. Niu ZS, Niu XJ, Wang WH. Genetic alterations in hepatocellular carcinoma: An update. World journal of gastroenterology. 2016;22:9069-95
3. Chauhan R, Lahiri N. Tissue- and Serum-Associated Biomarkers of Hepatocellular Carcinoma. Biomarkers in cancer. 2016;8:37-55
4. Van Hees S, Michielsen P, Vanwolleghem T. Circulating predictive and diagnostic biomarkers for hepatitis B virus-associated hepatocellular carcinoma. World journal of gastroenterology. 2016;22:8271-82
5. Inokawa Y, Inaoka K, Sonohara F, Hayashi M, Kanda M, Nomoto S. Molecular alterations in the carcinogenesis and progression of hepatocellular carcinoma: Tumor factors and background liver factors. Oncology letters. 2016;12:3662-8
6. Takami T, Yamasaki T, Saeki I, Matsumoto T, Suehiro Y, Sakaida I. Supportive therapies for prevention of hepatocellular carcinoma recurrence and preservation of liver function. World journal of gastroenterology. 2016;22:7252-63
7. Song Y, Wang JG, Li RF, Li Y, Cui ZC, Duan LX. et al. Gecko crude peptides induce apoptosis in human liver carcinoma cells in vitro and exert antitumor activity in a mouse ascites H22 xenograft model. Journal of biomedicine & biotechnology. 2012;2012:743573
8. Jin Y, Duan LX, Xu XL, Ge WJ, Li RF, Qiu XJ. et al. Mechanism of apoptosis induction in human hepatocellular carcinoma cells following treatment with a gecko peptides mixture. Biomedical reports. 2016;5:73-8
9. Liu F, Wang JG, Wang SY, Li Y, Wu YP, Xi SM. Antitumor effect and mechanism of Gecko on human esophageal carcinoma cell lines in vitro and xenografted sarcoma 180 in Kunming mice. World journal of gastroenterology. 2008;14:3990-6
10. Babenko VN, Bragin AO, Spitsina AM, Chadaeva IV, Galieva ER, Orlova GV. et al. Analysis of differential gene expression by RNA-seq data in brain areas of laboratory animals. Journal of integrative bioinformatics. 2016;13:292
11. Anjum A, Jaggi S, Varghese E, Lall S, Bhowmik A, Rai A. Identification of Differentially Expressed Genes in RNA-seq Data of Arabidopsis thaliana: A Compound Distribution Approach. Journal of computational biology: a journal of computational molecular cell biology. 2016;23:239-47
12. Lucafo M, Gerdol M, Pallavicini A, Pacor S, Zorzet S, Da Ros T. et al. Profiling the molecular mechanism of fullerene cytotoxicity on tumor cells by RNA-seq. Toxicology. 2013;314:183-92
13. Berger MF, Lawrence MS, Demichelis F, Drier Y, Cibulskis K, Sivachenko AY. et al. The genomic complexity of primary human prostate cancer. Nature. 2011;470:214-20
14. Kim D, Langmead B, Salzberg SL. HISAT: a fast spliced aligner with low memory requirements. Nature methods. 2015;12:357-60
15. Langmead B, Trapnell C, Pop M, Salzberg SL. Ultrafast and memory-efficient alignment of short DNA sequences to the human genome. Genome biology. 2009;10:R25
16. Wang CL, Liu C, Niu LL, Wang LR, Hou LH, Cao XH. Surfactin-induced apoptosis through ROS-ERS-Ca2+-ERK pathways in HepG2 cells. Cell biochemistry and biophysics. 2013;67:1433-9
17. Xian M, Cao H, Cao J, Shao X, Zhu D, Zhang N. et al. Bortezomib sensitizes human osteosarcoma cells to adriamycin-induced apoptosis through ROS-dependent activation of p-eIF2alpha/ATF4/CHOP axis. International journal of cancer. 2017;141:1029-41
18. Yi L, Zongyuan Y, Cheng G, Lingyun Z, Guilian Y, Wei G. Quercetin enhances apoptotic effect of tumor necrosis factor-related apoptosis-inducing ligand (TRAIL) in ovarian cancer cells through reactive oxygen species (ROS) mediated CCAAT enhancer-binding protein homologous protein (CHOP)-death receptor 5 pathway. Cancer science. 2014;105:520-7
19. Thakor P, Subramanian RB, Thakkar SS, Ray A, Thakkar VR. Phytol induces ROS mediated apoptosis by induction of caspase 9 and 3 through activation of TRAIL, FAS and TNF receptors and inhibits tumor progression factor Glucose 6 phosphate dehydrogenase in lung carcinoma cell line (A549). Biomed Pharmacother. 2017;92:491-500
20. Tian J, Lu Z, Wang Y, Zhang M, Wang X, Tang X. et al. Nerol triggers mitochondrial dysfunction and disruption via elevation of Ca2+ and ROS in Candida albicans. The international journal of biochemistry & cell biology. 2017;85:114-22
21. Yan B, Peng Z, Xing X, Chunling D. Glibenclamide induces apoptosis by activating reactive oxygen species dependent JNK pathway in hepatocellular carcinoma cells. Bioscience reports. 2017
22. Lim W, Yang C, Jeong M, Bazer FW, Song G. Coumestrol induces mitochondrial dysfunction by stimulating ROS production and calcium ion influx into mitochondria in human placental choriocarcinoma cells. Molecular human reproduction. 2017
23. Sano R, Reed JC. ER stress-induced cell death mechanisms. Biochimica et biophysica acta. 2013;1833:3460-70
24. Ma YM, Peng YM, Zhu QH, Gao AH, Chao B, He QJ. et al. Novel CHOP activator LGH00168 induces necroptosis in A549 human lung cancer cells via ROS-mediated ER stress and NF-kappaB inhibition. Acta pharmacologica Sinica. 2016;37:1381-90
25. Liao HY, Kao CM, Yao CL, Chiu PW, Yao CC, Chen SC. 2,4,6-Trinitrotoluene Induces Apoptosis via ROS-Regulated Mitochondrial Dysfunction and Endoplasmic Reticulum Stress in HepG2 and Hep3B Cells. Scientific reports. 2017;7:8148
26. Georgakilas AG, Martin OA, Bonner WM. p21: A Two-Faced Genome Guardian. Trends in molecular medicine. 2017;23:310-9
27. Kinnetz M, Alghamdi F, Racz M, Hu W, Shi B. The impact of p53 on the early stage replication of retrovirus. Virology journal. 2017;14:151
28. Ding L, Li R, Sun R, Zhou Y, Zhou Y, Han X. et al. S-phase kinase-associated protein 2 promotes cell growth and motility in osteosarcoma cells. Cell cycle. 2017;16:1547-55
29. Park J, Hwang I, Kim SJ, Youn SW, Hur J, Kim HS. Atorvastatin prevents endothelial dysfunction in high glucose condition through Skp2-mediated degradation of FOXO1 and ICAM-1. Biochemical and biophysical research communications. 2017
30. Bu W, Luo T. miR-1297 Promotes Cell Proliferation of Non-Small Cell Lung Cancer Cells: Involving in PTEN/Akt/Skp2 Signaling Pathway. DNA and cell biology. 2017
31. Song S, Tan J, Miao Y, Li M, Zhang Q. Crosstalk of autophagy and apoptosis: Involvement of the dual role of autophagy under ER stress. J Cell Physiol. 2017;232:2977-84
32. Song S, Tan J, Miao Y, Zhang Q. Crosstalk of ER stress-mediated autophagy and ER-phagy: Involvement of UPR and the core autophagy machinery. J Cell Physiol. 2017
33. Gyengesi E, Paxinos G, Andrews ZB. Oxidative Stress in the Hypothalamus: the Importance of Calcium Signaling and Mitochondrial ROS in Body Weight Regulation. Current neuropharmacology. 2012;10:344-53
34. Hotamisligil GS. Endoplasmic reticulum stress and the inflammatory basis of metabolic disease. Cell. 2010;140:900-17
35. Zhang X, Yu L, Xu H. Lysosome calcium in ROS regulation of autophagy. Autophagy. 2016;12:1954-5
36. Chaube R, Werstuck GH. Mitochondrial ROS versus ER ROS: Which Comes First in Myocardial Calcium Dysregulation? Frontiers in cardiovascular medicine. 2016;3:36
37. Chevet E, Hetz C, Samali A. Endoplasmic reticulum stress-activated cell reprogramming in oncogenesis. Cancer discovery. 2015;5:586-97
38. Liu MQ, Chen Z, Chen LX. Endoplasmic reticulum stress: a novel mechanism and therapeutic target for cardiovascular diseases. Acta pharmacologica Sinica. 2016;37:425-43
39. Mohamed E, Cao Y, Rodriguez PC. Endoplasmic reticulum stress regulates tumor growth and anti-tumor immunity: a promising opportunity for cancer immunotherapy. Cancer immunology, immunotherapy: CII. 2017;66:1069-78
40. Hurtley SM. Getting an UPR hand on recovERy. Science. 2016;354:1115-6
41. Yang Y, Zhang Y, Wang L, Lee S. Levistolide A Induces Apoptosis via ROS-Mediated ER Stress Pathway in Colon Cancer Cells. Cell Physiol Biochem. 2017;42:929-38
Author contact
![]() Corresponding author: Jian-Gang Wang, Professor of Medicine, Medical College, Henan University of Science & Technology, Kaiyuan Avenue 263, Luoyang 471003, Henan Province, China. ylwjgcom.
Corresponding author: Jian-Gang Wang, Professor of Medicine, Medical College, Henan University of Science & Technology, Kaiyuan Avenue 263, Luoyang 471003, Henan Province, China. ylwjgcom.