Impact Factor ISSN: 1837-9664

 Global reach, higher impact
J Cancer 2025; 16(8):2503-2515. doi:10.7150/jca.108582 This issue Cite
Research Paper
Hypoxia regulates glycolysis through the HIF-1α/BMAL1/ALDOC axis to reduce oxaliplatin sensitivity in colorectal cancer
Jialing Ran1, Feifei Li1, Lei Zhan1, Yue Jin1, Qian Dong1, Xiaoyan Li1, XiaoXi Li1, Qian Fei2, Jingdong Zhang1 ![]()
1. Cancer Hospital of China Medical University, Cancer Hospital of Dalian University of Technology, Liaoning Cancer Hospital & Institute, PR China.
2. Shengjing Hospital of China Medical University, PR China.
Received 2024-12-11; Accepted 2025-3-16; Published 2025-4-28
Abstract

Background: Oxaliplatin (L-OHP) is a first-line chemotherapy agent for advanced colorectal cancer (CRC), but the development of resistance often compromises its efficacy. Tumor hypoxia and metabolic reprogramming are known to influence chemotherapy sensitivity, yet their interrelationship remains inadequately explored.
Methods: In vitro assays were conducted using human colorectal cancer cell lines (DLD1 and LoVo) under hypoxic conditions induced by cobalt chloride (CoCl2). The expression levels of key proteins involved in the HIF-1α/BMAL1/ALDOC pathway were assessed through Western blotting and quantitative real-time PCR (qPCR). Cell viability, apoptosis, and glycolytic activity were evaluated using CCK-8 assays, flow cytometry, and lactate/ATP measurements.
Results: Hypoxia significantly enhanced glycolysis in CRC cells, decreasing sensitivity to L-OHP. The HIF-1α/BMAL1/ALDOC axis was identified as a crucial mediator in this process, with HIF-1α upregulating BMAL1, which increased ALDOC expression. This cascade promoted glycolytic activity and reduced apoptosis in hypoxic conditions. Notably, a positive correlation between HIF-1α and ALDOC expression was confirmed in clinical CRC samples.
Conclusion: The findings reveal a novel mechanism by which hypoxia diminishes L-OHP sensitivity in CRC through the HIF-1α/BMAL1/ALDOC pathway. These insights provide potential biomarkers for predicting treatment outcomes and suggest new therapeutic strategies to enhance chemosensitivity in colorectal cancer.
Keywords: hypoxia, HIF-1α, glycolysis, ALDOC, chemotherapy
Introduction
Colorectal cancer (CRC) is a common malignant tumor of the digestive system with a high incidence (1). Oxaliplatin (L-OHP) is a primary chemotherapy drug for CRC, while reduced chemosensitivity is a predominant limiting factor that impedes improved outcomes for patients with advanced CRC. Therefore, it is very important to improve the sensitivity of colorectal cancer to L-OHP treatment to prolong patients' survival.
Metabolic reprogramming within tumor cells is considered as one of the classic hallmarks of cancer [1]. The Warburg effect suggests that even in the presence of oxygen, tumor cells switch their metabolic pathway from oxidative phosphorylation to glycolysis, consuming more glucose and producing large amounts of lactate. This process guarantees the synthesis of many cellular elements, the production of energy, and the maintenance of redox homeostasis in cells, which meets the needs of rapid tumor proliferation [2].
The solid tumor mass formed by the rapid proliferation of tumor cells can directly compress the blood vessels around tumor tissue, causing insufficient oxygen supply in the central area of the tumor. Hypoxia can be found within 90% of solid tumors [3], and the hypoxic microenvironment forces cancer cells to undergo genetic and adaptive changes, which promote the malignant transformation of cancer cells [4]. Hypoxia-inducible factors (HIFs) play important roles in the above process. HIFs (including HIF-1α, HIF-2α and HIF-3α) regulates oxygen sensing of cells as well as adapts cells to hypoxic microenvironments [5]. Under normoxic conditions, HIF-1α is destabilized by regulated degradation [6]. However, under hypoxic conditions, HIF-1α forms a stable dimeric structure with HIF-1β that binds to the hypoxia response element (HRE) on DNA to regulate gene expression [7]. For example, HIF-1α can directly transcriptionally activate the expression of multiple enzymes (e.g., Aldehyde Carboxylase A, Hexokinase, Lactate Dehydrogenase, etc.) and glucose transporters (e.g., GLUT1) involved in the glycolytic pathway to take up more glucose, accelerate cellular metabolism with energy production, and promote tumor growth [8].
Previous studies have revealed the link between therapeutic resistance and hyperactive glucose metabolism in CRC cells. For example, elevated expression of glucose metabolism-related transporters and key enzymes (e.g. Glucose Transporter1, Hexokinase2) can enhance CRC cell resistance to 5-FU [9-12]. Hypoxia is directly related to the glycolysis of tumor cells, and enhanced glycolysis is related to tumors' therapeutic resistance. However, the exact roles of glycolysis regulation by HIF-1α in the therapeutic effects of L-OHP on CRC remain incompletely understood.
Cobalt chloride (CoCl2) is a well-established simulant of oxygen deprivation [13]. In normoxic conditions, HIF-1α is degraded following the catalysis by prolyl hydroxylases [14]. However, CoCl2 can stabilize HIF-1α protein levels by inhibiting prolyl hydroxylase expression as well as by activating the MAPK signaling pathways, mimicking hypoxic conditions [15]. Preliminary analysis identified potential binding sites for HIF-1α in the promoter regions of BMAL1 and ALDOC, suggesting a regulatory relationship. Furthermore, previous studies have implicated BMAL1 and ALDOC in metabolic reprogramming and tumor progression, particularly under hypoxic conditions. These observations led us to hypothesize that the HIF-1α/BMAL1/ALDOC axis might play a critical role in mediating chemoresistance through glycolytic reprogramming in colorectal cancer [16, 17]. In this study, our results suggest that the HIF-1α/BMAL1/ALDOC pathway functions to enhance anaerobic glycolysis in tumor cells, thus reducing the sensitivity of CRC to L-OHP. Our findings provide new evidence for targeting hypoxia in the clinical evaluation and treatment of colorectal cancer patients.
Material and Methods
Cell culture
Human colorectal cancer cell lines (DLD1 and LoVo), purchased from the American type culture collection (ATCC, Manassas, VA, USA), were cultured in RPMI-1640 (ScienCell) and MEM media (ScienCell) containing 10% fetal bovine serum (FBS, GIBCO) and 1% penicillin/streptomycin (GIBCO). All cell lines were cultured at 37 °C in a humidified incubator containing 5% CO2.
Western blot
A suitable density of tumor cells was harvested, and all the cells' proteins were extracted using lysis buffer (Beyotime). Protein quantification was performed using a BCA protein assay kit (Beyotime). The protein samples were separated by 10% sodium dodecyl sulfate-polyacrylamide gel electrophoresis (SDS-PAGE) and transferred onto polyvinylidene fluoride (PVDF) membranes (Millipore). Then, the PVDF membranes were blocked with 5% non-fat milk for 1 h at room temperature and incubated with primary antibodies (Table 1) overnight at 4 °C, followed by incubation with fluorescein-conjugated secondary antibodies for one h at room temperature and detected using an enhanced chemiluminescence (ECL) detection kit (Millipore, Burlington, Ma, USA).
Manufacturer information of the primary antibody for western blot
| Antibody | Manufacturer | Catalog |
|---|---|---|
| HIF-1 antibody | Becton, Dickinson and Company | 610959 |
| ALDOC antibody | Proteintech Group | 14884-1-AP |
| Bax antibody | Hangzhou HuaAn Biotechnology | EM1203 |
| Bcl-xL antibody | Hangzhou HuaAn Biotechnology | ET1603-28 |
| Bcl-2 antibody | Hangzhou HuaAn Biotechnology | ET7110-51 |
| BMAL1 antibody | Proteintech Group | 14268-1-A |
| β-actin antibody | Cell Signaling Technology | 3700S |
Quantitative real-time PCR (qPCR)
Total RNA of cells was extracted using Trizol (Takara). mRNA was reversely transcribed into complementary DNA (cDNA) using the RT-PCR Kit (Takara) according to manufacturer's instructions. cDNA was used for qPCR experiments with the SYBR Green PCR Master Mix (Takara). The PCR program was set according to the manufacturer's instructions with GAPDH mRNA as an internal control. The relative expression of the gene of interest was calculated by the 2-ΔΔCt method. Primer sequences are shown in Table 2.
qPCR primer sequences
| Gene | Forward primer | Reverse primer |
|---|---|---|
| ENO1 | 5′- GCCGTGAACGAGAAGTCCTG-3′ | 5′- ACGCCTGAAGAGACTCGGT-3′ |
| ALDOA | 5′- CAGGGACAAATGGCGAGACTA-3′ | 5′- GGGGTGTGTTCCCCAATCTT-3′ |
| ALDOC | 5′- GCCAAATTGGGGTGGAAAACA-3′ | 5′- TTCACACGGTCATCAGCACTG-3′ |
| PFKFB3 | 5′- ATTGCGGTTTTCGATGCCAC-3′ | 5′- GCCACAACTGTAGGGTCGT-3′ |
| PFKFB4 | 5′- CAACATCGTGCAAGTGAAACTG-3′ | 5′- GACTCGTAGGAGTTCTCATAGCA-3′ |
| PFK1 | 5′- AGCTGCCTACAACCTGGTGA -3′ | 5′- TCCACTCAGAACGGAAGGTGT -3′ |
| PGAM1 | 5′- GTGCAGAAGAGAGCGATCCG -3′ | 5′- CGGTTAGACCCCCATAGTGC -3′ |
| GPI | 5′- CAAGGACCGCTTCAACCACTT -3′ | 5′- CCAGGATGGGTGTGTTTGACC -3′ |
| PGK1 | 5′- GAACAAGGTTAAAGCCGAGCC -3′ | 5′- GTGGCAGATTGACTCCTACCA -3′ |
| HIF-1α | 5′- ATCCATGTGACCATGAGGAAATG-3′ | 5′- TCGGCTAGTTAGGGTACACTTC-3′ |
| BMAL1 | 5′- CATTAAGAGGTGCCACCAATCC-3′ | 5′- TCATTCTGGCTGTAGTTGAGGA-3′ |
| GAPDH | 5′- GGAGCGAGATCCCTCCAAAAT -3′ | 5′- GGCTGTTGTCATACTTCTCATGG -3′ |
Cell viability assay
According to experimental groups, CRC cells were cultured with conditioned medium containing CoCl2 or L-OHP. Cell survival was assessed using CCK-8 assay (Signatureto laboratories) according to the manufacturer's instructions. Optical density was recorded at 450 nm.
Clone formation
Cells were cultured for 2-3 weeks with regular observation. After fixation using 4% paraformaldehyde for 15-30 min, crystal violet staining (0.1%) was performed for 30 min. The colonies containing more than 10 cells were counted under a microscope, and the colony formation rate was calculated.
Apoptosis analysis
Cells were subsequently treated in groups according to the experiment and stained in the dark with 5 μL of FITC-annexin V and 5 μL PI. According to the manufacturer's instructions (BD PharmingenTM), cells were stained for 15 min and analyzed using the flowjo software (version 10.2).
Adenosine triphosphate (ATP) assay and lactate measurement
CRC cells were treated in groups according to the experiment. ATP and lactate concentrations were determined using an ATP assay kit (Promega Corporation) and a lactate assay kit (Biovision) following the manufacturer's instructions.
Transfection
The small interfering RNAs were designed (Table 3) and synthesized by Sharp Bio (Guangzhou). CRC cells were transfected with siRNA (50 nM) using Lipofectamine 3000 (Beyotime Biotechnology) for 6 h.
Target sequences of siRNA
| siRNA | Target sequence |
|---|---|
| si-ALDOC-1 | 5′- GCAGCACAGTCACTCTACA -3′ |
| si-ALDOC-2 | 5′- CCTCAAACGTTGTCAGTAT-3′ |
| si-ALDOC-3 | 5′- GAACGCTGTGCCCAATACA-3′ |
| si-BMAL1-1 | 5′- GGATGAAGCAACGAACCA-3′ |
| si-BMAL1-2 | 5′- TCACCAAGATGACATAGGA-3′ |
| si-BMAL1-3 | 5′- GTCAGAGTTTGTTTGACTA-3′ |
| siHIF-1α-1 | 5′- GGAAAGGAGAGAAAGCAATT-3′ |
| siHIF-1α-2 | 5′- AAGCAAAACUCUCAAAACCTT-3′ |
| siHIF-1α-3 | 5′- GCAAUUCUGGCUCCUACAATT-3′ |
| siNC | 5′- ACGUGACACGUUCGGAGAATT-3′ |
Immunohistochemistry (IHC)
Firstly, tissue sections were stained to detect the expression of proteins. At 4℃, the sections were combined with the antibody overnight. At 37℃, the sections were bound to the second antibody binding HRP and incubated for 30 minutes. Finally, through DAB dyeing and hematoxylin reversed dyeing (Sigma-Aldridge).
Clinical samples
33 pathological specimens of colon cancer patients were collected from January 2020 to October 2021 at the Cancer Hospital of Dalian University of Technology (Liaoning, China). The Ethics Committee of Cancer Hospital of China Medical University (20170223) approved this study, which obtained the informed consent of all patients.
Statistical analysis
All data were independently repeated for 3 times. The results were analyzed and counted by GraphPad Prism 6.0. The unpaired t-test was used to analyze the differences between groups. p < 0.05 was considered statistically significant.
Results
CoCl2-induced hypoxia reduced the sensitivity of CRC cells to L-OHP and enhanced the glycolysis of CRC cells
CoCl2 is a common simulant of oxygen deprivation. The 48-h incubation with CoCl2 induced the expression of HIF-1α protein in a dose-dependent manner (Figure 1A).
CoCl2-induced hypoxia reduces the sensitivity of CRC cells to L-OHP and enhances glycolysis. (A) Western blot analysis of HIF-1α protein expression under different concentrations of CoCl2. (B) Cell viability assay under normoxic and hypoxic conditions with varying L-OHP concentrations. IC50 values were determined using GraphPad Prism 6.0 software by fitting dose-response curves to a four-parameter logistic model. (C) Clone formation assay results under normoxic and hypoxic conditions with L-OHP treatment. (D-G) Additional assays demonstrating apoptosis, lactate production, and ATP levels. *p < 0.05; **p < 0.01 and * * * p < 0.001).
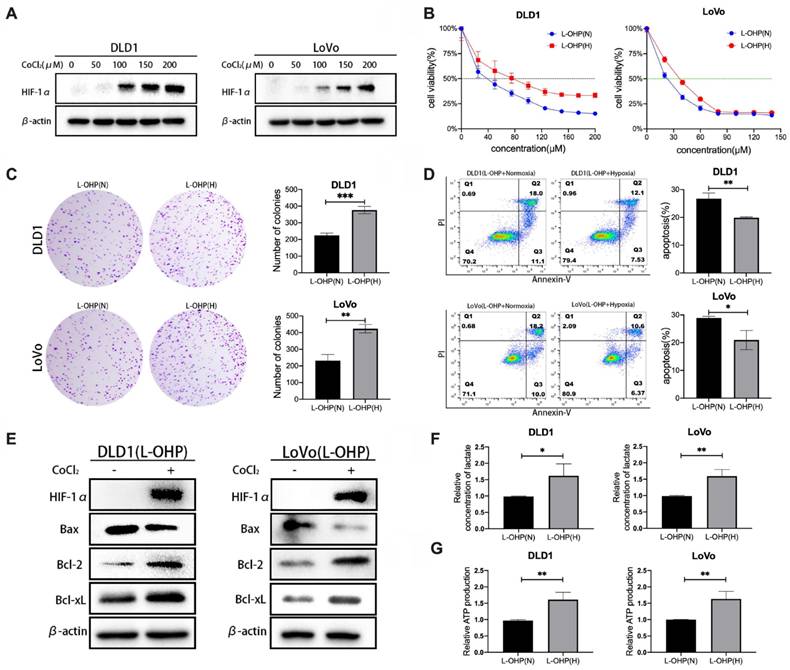
The cell viability of L-OHP-stimulated tumor cells under hypoxic and normoxic conditions was determined. As shown in Figure 1B, L-OHP inhibited the viability of DLD1 and LoVo cell lines under normoxia and hypoxia in a dose-dependent manner, and the experimental results indicated that the cell viability of hypoxic tumor cells under L-OHP stimulation was significantly higher than that of normoxia cells. The half maximal inhibitory concentration (IC50) values of L-OHP treatment for 48 h in normoxia versus hypoxia in the DLD1 cell line were 36.4 μM (95% CI: 33.54 - 39.18 μM) and 70.66 μM (95% CI: 64.27 - 77.04 μM). The IC50 of LoVo cells treated with L-OHP for 48 h in normoxia versus hypoxia were 21.16 μM (95% CI: 18.89 - 23.31 μM) and 34.47 μM (95% CI: 32.14 - 36.77 μM). Clone formation assay was used to compare the proliferative capacity of normoxic versus hypoxic CRC cells under L-OHP treatment to further assess the differences in cell proliferation. The numbers of colony formation of CRC cells under 20 μM of L-OHP treatment were much greater than that of normoxic tumor cells (Figure 1C).
As shown in Figure 1D, the apoptosis rate (calculated as cell percentages with positive annexin-V staining and negative PI staining, as well as cell populations with positive annexin-V staining and positive PI staining) of hypoxic tumor cells treated by L-OHP was significantly lower than that of normoxic cells (p < 0.01 for DLD1 and p < 0.05 for LoVo). Compared with the normoxia group, the protein expression levels of Bax were significantly downregulated and the protein expression levels of Bcl-2 and Bcl-xL were significantly upregulated in hypoxic tumor cells (Figure 1E). Taken together, these results indicated that hypoxia decreases the sensitivity of tumor cells to L-OHP.
The glycolytic capacity of normoxic and hypoxic tumor cells were examined by lactate generation and ATP generation assays. Lactate and ATP production in hypoxic cells were significantly increased (p < 0.05) in L-OHP-treated cells, which reflected the enhanced glycolytic capacity of hypoxic tumor cells (Figure 1F-1G).
CoCl2-induced hypoxia reduces L-OHP sensitivity by modulating the glycolytic capacity of CRC cells
2-DG is a glucose analog that blocks the initial phase of glycolysis, acting to inhibit glycolysis [18]. Cell viability and clone formation assays were used to determine the cell proliferation of L-OHP-treated normoxic and hypoxic tumor cells after 2-DG treatment. As shown in Figure 2A, L-OHP-treated hypoxic tumor cells showed significantly decreased cell viability after 2-DG treatment. Figure 2B also showed that hypoxic tumor cells treated by L-OHP significantly reduced the number of colonies after 2-DG treatment. It was illustrated that L-OHP-treated hypoxic tumor cells subjected to 2-DG treatment inhibited cell proliferation. The apoptosis of tumor cells was detected using flow cytometry (Figure 2C). The experimental results showed that the apoptosis ratio of cells increased after 2-DG treatment in hypoxic tumor cells treated by L-OHP. Apoptosis-related protein expression was detected using Western blot (Figure 2D). L-OHP-treated hypoxic tumor cells showed a significant increase in the expression levels of Bax and a substantial decrease in the expression of anti-apoptotic proteins after 2-DG treatment. These experiments proved that exposure of hypoxic tumor cells to L-OHP and 2-DG treatment promoted the occurrence of apoptosis and enhanced the killing effect of L-OHP on hypoxic cells.
CoCl2-induced hypoxia reduces L-OHP sensitivity by modulating the glycolytic capacity of CRC cells. (A) Cell viability assay detects the cell viability of DLD1 and LoVo cells under normoxia versus hypoxia conditions with L-OHP and 2-DG treatment. (B) Clone formation assay detects the colony numbers of DLD1 and LoVo cells under normoxia or hypoxia conditions with L-OHP and 2-DG treatment. (C) Flow cytometry detects the apoptosis of DLD1 and LoVo cells under normoxia versus hypoxia conditions with L-OHP and 2-DG treatment. (D) Western blot detects the apoptosis-related protein expression in DLD1 and LoVo cells under normoxia versus hypoxia conditions with L-OHP and 2-DG treatment. (E) Lactate measurement assay detects the lactate concentration in DLD1 and LoVo cells under normoxia versus hypoxia conditions with L-OHP and 2-DG treatment. (F) Adenosine triphosphate (ATP) assay detects the ATP production in DLD1 and LoVo cells as indicated. (*p < 0.05, * * p < 0.01, and * * * p < 0.001) (L-OHP (N) represents L-OHP-treated normoxic tumor cells and L-OHP (H) represents L-OHP-treated hypoxic tumor cells).
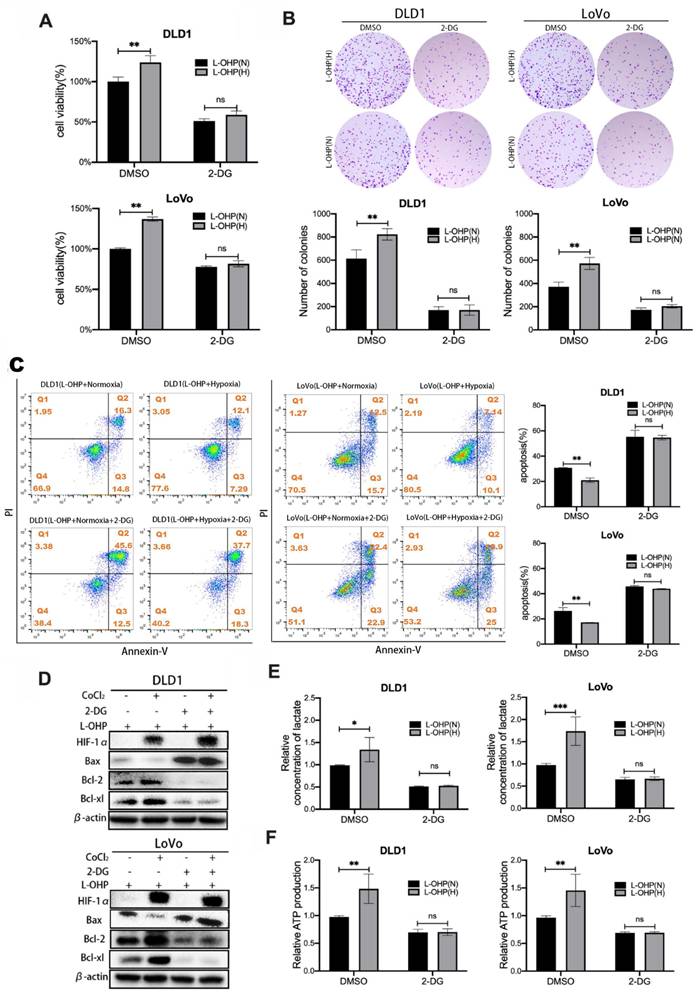
In order to explore the mechanism by which 2-DG affected cell proliferation and apoptosis, lactate and ATP production were measured by lactate measurement kit and ATP content kit in L-OHP-treated normoxic and hypoxic tumor cells after 2-DG treatment. As shown in figure 2E-F, the production of lactate and ATP were obviously decreased after 2-DG treatment in hypoxic tumor cells treated by L-OHP, and the decrease was greater than that in normoxic tumor cells treated by L-OHP. The above experiments illustrated that hypoxic tumor cells treated by L-OHP showed significantly inhibited glycolysis in tumor cells after 2-DG treatment. And the changes were consistent with the apoptosis effects observed in L-OHP-treated hypoxic tumor cells after 2-DG addition, but opposite to the proliferation changes. Therefore, hypoxia possibly decreased L-OHP sensitivity by mediating glycolysis.
Hypoxia induced by CoCl2 reduces L-OHP sensitivity of CRC cells by regulating ALDOC-mediated glycolysis
To explore the molecular mechanism of hypoxia-regulated glycolysis in tumor cells. The qPCR assays were used to screen the expression changes of key enzymes related to glycolysis in normoxic versus hypoxic tumor cells with L-OHP treatment (Figure 3A). The experimental results showed that the expression levels of ALDOC mRNA and ENO2 mRNA were significantly increased in hypoxic cells treated with L-OHP compared with normoxic cells (p < 0.001), and the expression difference of ALDOC mRNA in the hypoxia and normoxia groups was greater than that of ENO2 mRNA. The increased expression level of ALDOC protein in hypoxic cells treated with L-OHP was confirmed by Western blot (Figure 3B). The expression levels of both mRNA and protein of ALDOC were downregulated (Figure 3C-3D) after the knockdown of HIF-1α, demonstrating the regulatory roles of HIF-1 α on ALDOC expression.
Hypoxia reduces L-OHP sensitivity of CRC cells by regulating ALDOC-mediated glycolysis. (A) PCR detects the mRNA expression in DLD1 and LoVo cells under normoxia versus hypoxia with L-OHP treatment. (B) Western blot analyses of the expression of ALDOC protein in DLD1 and LoVo cells under normoxia versus hypoxia with L-OHP treatment. (C) PCR detects the ALDOC mRNA expression in DLD1 and LoVo cells under normoxia versus hypoxia after L-OHP and siHIF-1α treatment. (D) Western blot analyses of the expression of ALDOC protein of DLD1 and LoVo cells under normoxia versus hypoxia after L-OHP and siHIF-1α treatment. (E)Lactate measurement assay detects the lactate concentrations in DLD1 and LoVo cells under normoxia versus hypoxia after L-OHP and siALDOC treatment. (F) Adenosine triphosphate (ATP) assay detects the ATP production of DLD1 and LoVo cells under normoxia versus hypoxia with L-OHP and siALDOC treatment. (G) Cell viability assay detects the cell viability of DLD1 and LoVo cells under normoxia versus hypoxia with L-OHP and siALDOC treatment. (H) Clone formation assay detects the colony numbers of DLD1 and LoVo cells under normoxia versus hypoxia with L-OHP and siALDOC treatment. (I) Flow cytometry detects the apoptosis of DLD1 and LoVo cells under normoxia versus hypoxia with L-OHP and siALDOC treatment. (J) Western blot detects the apoptosis-related protein expression in DLD1 and LoVo cells under normoxia versus hypoxia with L-OHP and siALDOC treatment. (*p < 0.05, * * p < 0.01, and * * * p < 0.001) (L-OHP (N) represents L-OHP-stimulated normoxic tumor cells and L-OHP (H) represents L-OHP-stimulated hypoxic tumor cells).
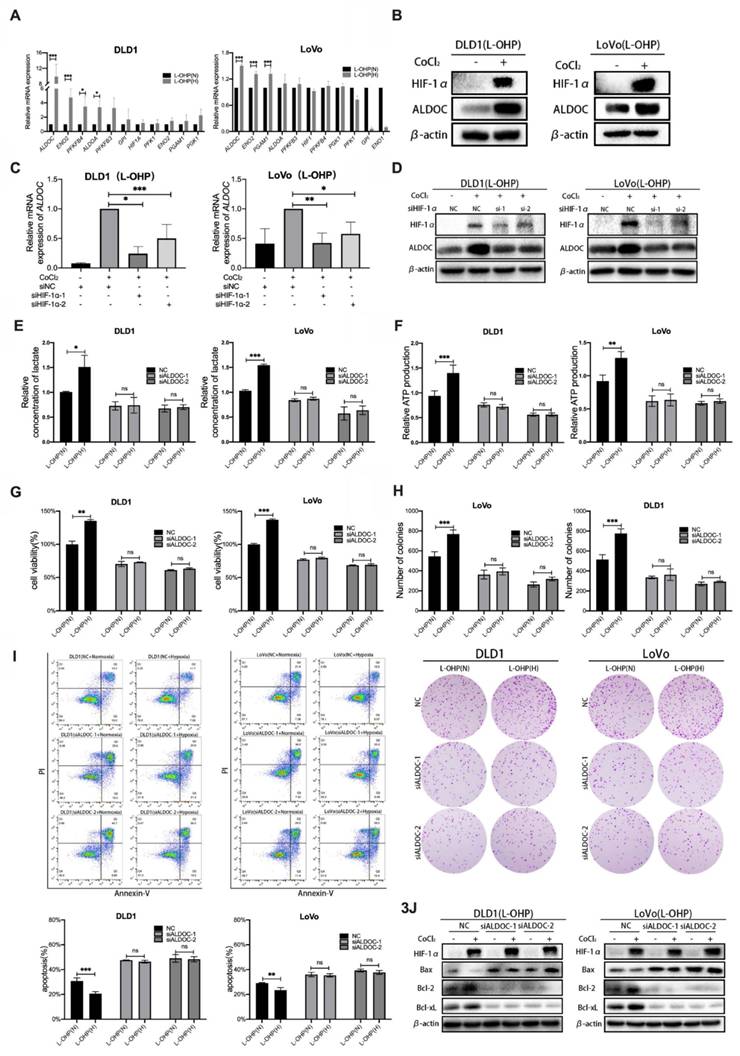
It was aimed to explore whether altering the expression levels of the glycolytic enzyme ALDOC affected glycolysis in CRC cells. The production of lactic acid and ATP after siRNA transfection in L-OHP-treated normoxic or hypoxic CRC cells was detected. Figure 3E-3F showed that the production levels of lactate and ATP were significantly decreased in hypoxic cells treated with L-OHP after ALDOC knockdown. The experimental results illustrated that hypoxic cells treated by L-OHP showed decreased glycolysis of tumor cells after ALDOC knockdown.
It was found that enhancement of glycolysis reduced the sensitivity of tumor cells to L-OHP, while hypoxia enhanced the glycolysis of tumor cells by regulating the expression of ALDOC. However, whether hypoxia decreases L-OHP sensitivity by regulating the expression of ALDOC was unclear. As shown in Figure 3G, L-OHP-treated hypoxic cells showed significantly decreased cell viability after interfering with intracellular ALDOC expression. Figure 3H showed that the numbers of colony formation were decreased considerably in hypoxic cells treated with L-OHP after siALDOC treatment, indicating that cell proliferation was attenuated in hypoxic cells treated with L-OHP after ALDOC knockdown. Flow cytometry results showed that hypoxic cells treated by L-OHP significantly increased the proportion of apoptotic cells after ALDOC knockdown (Figure 3I). Western blot results indicated that L-OHP-treated hypoxic cells exhibited upregulated expression of Bax and decreased expression of Bcl-2 versus Bcl-xL after ALDOC knockdown (Figure 3J). The above experiments illustrated that the expression levels of ALDOC in hypoxic CRC cells treated by L-OHP played an essential role in regulating the sensitivity to L-OHP.
CoCl2-induced hypoxia mediates glycolysis through the HIF-1α/BMAL1/ALDOC pathway to reduce L-OHP sensitivity in colorectal cancer
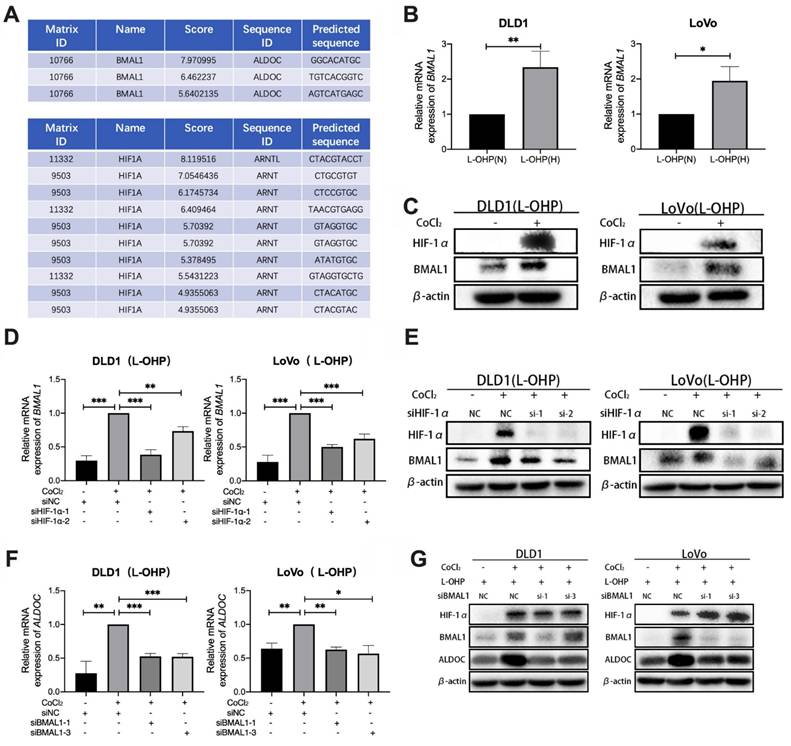
Bioinformatic analysis using the UCSC database showed the presence of binding sites for HIF-1α in the BMAL1 promoter region (Figure 4A). As shown in Figure 4B-4C, qPCR and Western blot data indicated that BMAL1 mRNA and BMAL1 protein expression were higher in hypoxic tumor cells than in normoxic cells after L-OHP treatment (p < 0.05). After treatment with siHIF-1α, L-OHP-treated hypoxic tumor cells exhibited lower BMAL1 mRNA and protein expression levels than the control group (NC) (Figure 4D-4E). These results illustrated that HIF-1α upregulated BMAL1 expression. UCSC analysis also showed binding sites for BMAL1 in the promoter region of ALDOC (Figure 4A). As shown in Figure. 4H-4I, when L-OHP-treated hypoxic tumors were transfected with siBMAL1, the intracellular expression levels of ALDOC mRNA and ALDOC protein were lower than those in the NC group, indicating that BMAL1 played a role in regulating ALDOC expression. The above results demonstrated that HIF-1α regulates ALDOC levels by controlling BMAL1 expression.
CoCl2-induced hypoxia mediates glycolysis through the HIF-1α/BMAL1/ALDOC pathway, thus reducing the sensitivity to L-OHP in colorectal cancer. (A) UCSC and Jaspar online tools predict the binding sites of HIF-1α to BMAL1 promotor and BMAL1 to ALDOC promotor. (B) PCR detects BMAL1 mRNA expression in DLD1 and LoVo cells under normoxia versus hypoxia with L-OHP treatment. (C) Western blot analyses of the expression of BMAL1 protein in DLD1 and LoVo cells under normoxia versus hypoxia with L-OHP treatment. (D) PCR detects BMAL1 mRNA expression in DLD1 and LoVo cells under normoxia versus hypoxia conditions with L-OHP and siHIF-1α treatment. (E)Western blot analyses of the expression of BMAL1 protein in DLD1 and LoVo cells under normoxia versus hypoxia with L-OHP and siHIF-1α treatment. (F) PCR detects ALDOC mRNA expression in DLD1 and LoVo cells under normoxia versus hypoxia with L-OHP and siBMAL1 treatment. (G) Western blot analyses of the expression of ALDOC protein of DLD1 and LoVo cells under normoxia versus hypoxia with L-OHP and siBMAL1 treatment. (*p < 0.05, * * p < 0.01, and * * * p < 0.001) (L-OHP (N) represents L-OHP-treated normoxic tumor cells and L-OHP (H) represents L-OHP-treated hypoxic tumor cells).
The positive correlation between HIF-1α and ALDOC expression was verified in samples of CRC patients
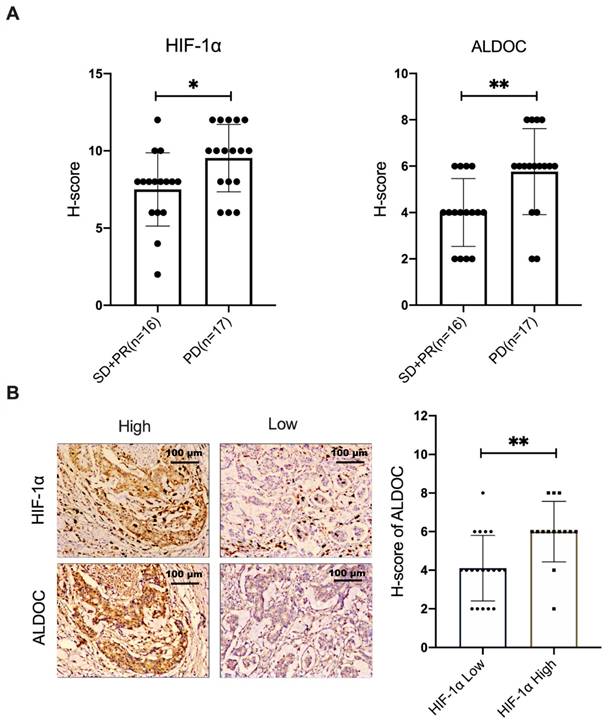
In this study, 33 samples of patients with stage III colon cancer were selected. The selection criteria samples were from the patients who had not received surgery, radiotherapy or chemotherapy before, and all the patients received XELOX chemotherapy based on L-OHP for the first time. The condition was evaluated every 2 cycles. According to Response Evaluation Criteria in Solid Tumors (RECST), samples were divided into two groups. L-OHP-sensitive group (n=16) included stable disease (SD) patient samples and partial response (PR) patient samples. The samples from patients whose response evaluation criteria were progressive disease (PD) were included in the L-OHP-insensitive group (n=17). The protein expression levels of HIF-1α and ALDOC were detected on pathological sections. The results showed that the expression of HIF-1α and ALDOC proteins in the L-OHP-insensitivity group was higher than the L-OHP-sensitivity group (Figure 5A, p < 0.05). The localization experiment of protein staining in pathological tissue sections showed that the ALDOC expression was generally high in tissues with high HIF-1α expression. Conversely, the expression of ALDOC was also at a low level (Figure 5B). It was confirmed that there was a positive correlation between HIF-1α and ALDOC (Figure 5B, p < 0.05). The above experimental results showed that HIF-1α and ALDOC were highly expressed in the tissues of patients who were not sensitive to L-OHP treatment, and there was a positive correlation between the expressions of HIF-1α and ALDOC, which indicated that ALDOC might be the downstream regulatory target of HIF-1α. HIF-1α and ALDOC were important in enhancing the malignant degree of tumor and reducing the sensitivity of L-OHP chemotherapy. The positive correlation between HIF-1α and ALDOC expression in patient samples suggests their potential as biomarkers for predicting therapeutic response to L-OHP. In the L-OHP-insensitive group, both proteins were highly expressed, indicating their association with chemoresistance. These findings underscore the clinical significance of targeting the HIF-1α/BMAL1/ALDOC axis for overcoming resistance in CRC patients.
The positive correlation between HIF-1α and ALDOC expression was verified in samples of CRC patients (A) IHC was used to detect the expression of HIF-1α and ALDOC in patients with SD or PR (n=16) and PD (n=17). (B) The correlation between HIF-1α and ALDOC expression was analyzed by IHC. (*p < 0.05, * * p < 0.01, and * * * p < 0.001).
Discussion
Glycolysis is one of the key metabolic pathways for tumor cells. It has been well documented that within many types of cancer, such as liver and gastric cancer, a hypoxic microenvironment will promote tumor proliferation, metastasis and drug resistance by increasing the glycolytic capacity of tumor cells [19-21].
The production of lactate and ATP characterizes glycolysis in cancer cells. Lactate produced by cellular metabolism can be transferred from the cell via the monocarboxylate transporters (MCT), avoiding intracellular lactate accumulation to form a strong acidic environment. Lactate can also render the extracellular microenvironment a weak, acidic state, killing adjacent normal cells and providing conditions for the spreading and metastasis of tumor cells [22]. High acidification of the tumor microenvironment has been demonstrated within melanoma to contribute to the immune escape of tumor cells [23]. The amount of ATP produced by the glycolytic process guarantees the energy supply for various physiological activities within tumor cells, improving tumors' invasion and metastasis ability [24]. This illustrates that glycolysis can promote the malignant transformation of tumors. Our results showed that ATP and lactic acid production in CRC cells induced by hypoxia increased significantly. Therefore, it is a likely important mechanism of tumor progression under hypoxic conditions.
In this study, 2-DG was used to explore the effects of inhibiting glycolysis on cell growth. Our results show that 2-DG effectively blocked lactate and ATP production in L-OHP-treated hypoxic tumor cells. L-OHP-treated hypoxic tumor cells showed suppressed cell viability and colony-forming ability after 2-DG treatment. The increased number of apoptotic cells and enhanced expression of apoptotic proteins illustrate that inhibition of glycolysis in hypoxic cells enhanced the therapeutic effects of L-OHP. Therefore, hypoxia reduced the therapeutic sensitivity of L-OHP by regulating the glycolysis of the tumor.
ALDOC is a member of the aldolase family responsible for the reversible conversion of fructose-1,6-bisphosphate to glyceraldehyde-3-phosphate and dihydroxyacetone phosphate during glycolysis. In gallbladder cancer, disrupting ALDOC protein stability leads to loss of the ability to sense glucose levels inside and outside the cell, thereby activating the AMPK pathway, enhancing tumor glycolysis, and promoting malignant proliferation [25] as well as metastasis [26] of the tumor. In breast cancer, high expression of ALDOC directly enhances glycolysis levels in tumor cells [27]. The high expression of ALDOC in ovarian and CRC also suggests poor prognosis of patients [28]. Aromatic hydrocarbon receptor nuclear transporter-like (ARNTL), also known as BMAL1, is a circadian clock-related protein. It is well documented that in hepatocellular carcinoma, a hypoxic microenvironment leads to changes in the expression of BMAL1, the core clock gene, thereby promoting tumor progression [29]. BMAL1 triggers metabolic reprogramming of cells under inflammatory stimulus conditions [30]. The possible mechanism is the interaction between BMAL1 and HIF-1α, leading to the transformation between anaerobic and aerobic glycolysis [31]. Previous results showed that knockdown of BMAL1 within the CRC cell line SW480 and SW620 resulted in a decrease in ALDOC expression [32]. Therefore, we speculated that HIF-1α might be regulatory in ALDOC expression through BMAL1.
Our transfection experiments verified the regulatory effects of HIF-1α on ALDOC. By measuring lactate and ATP production, we found that glycolysis was inhibited in hypoxic tumor cells treated by L-OHP after siALDOC knockdown, demonstrating HIF-1α exerted a regulatory effect on glycolysis via ALDOC. Proliferation and apoptosis-related experiments confirmed that hypoxic cells showed enhanced therapeutic effects of L-OHP on tumors after siALDOC treatment. Our results were also supported by the UCSC website-based analysis that predicted the transcription factor binding sites on promotor regions of BMAL1 and ALDOC. In a summary, out results concluded the important role of the HIF-1α/BMAL1/ALDOC axis in regulating L-OHP sensitivity in CRC cells.
Epidemiological data show that the mortality rate of CRC is in the third place of malignancy related death worldwide [33, 34]. Approximately 20% of patients with CRC already have comorbid metastatic lesions at initial diagnosis, and neoadjuvant therapy provides surgical opportunities for these patients [35]. Although surgery is the main method to treat this disease, about 50% patients have recurrence and metastasis after surgery [36]. After surgical resection of lesions, chemotherapy becomes an important means to prolong the survival of patients and improve the quality of life of patients. First-line chemotherapy regimens for CRC include XELOX (Oxaliplatin combined with Capecitabine) or FOLFOX (Fluorouracil, Calcium Folinate combined with Oxaliplatin) regimens. Previous studies showed that both regimens improved progression-free survival (PFS) and Overall Survival (OS) in patients with CRC. However, the efficacy was limited [37, 38]. A systematic review published in 2020 statistically reviewed published or ongoing clinical trials on L-OHP-based chemotherapy regimens and demonstrated that PFS was only 3.1-7 months [39]. The 5-year OS of metastatic CRC is approximately 10% [40]. Poor chemosensitivity is a major limiting factor that impedes improved outcomes for patients with advanced CRC. Therefore, it is very important to improve the sensitivity of colorectal cancer to L-OHP treatment to prolong the survival of patients. Our results will shed light on potential therapeutic strategies and treatment for patients who are insensitive to L-OHP. While CoCl2 is widely used as a hypoxia mimic in in vitro studies, it may not fully replicate the complexity of physiological hypoxia in tumor microenvironments. CoCl2 stabilizes HIF-1α by inhibiting prolyl hydroxylases but does not account for dynamic oxygen gradients, nutrient deprivation, or stromal interactions present in actual tumors. Future studies using three-dimensional organoid models or in vivo systems could provide more comprehensive insights into the role of hypoxia in chemoresistance.
Abbreviations
CRC: Colorectal Cancer; HIF: Hypoxia-Inducible Factor; HIF-1α: Hypoxia-Inducible Factor 1-alpha; BMAL1: Brain and Muscle Arnt-Like 1; ALDOC: Aldolase C; L-OHP: Oxaliplatin; MTT: A colorimetric assay for measuring cell viability; RT-qPCR: Reverse Transcription Quantitative Polymerase Chain Reaction; ATP: Adenosine Triphosphate; IHC: Immunohistochemistry; FBS: Fetal Bovine Serum; SDS-PAGE: Sodium Dodecyl Sulfate Polyacrylamide Gel Electrophoresis.
Acknowledgements
Funding
This research was supported by the Central Government Guides Local Science and Technology Development Fund Projects (No. 2022JH6/100100018), the Liaoning Key Laboratory of Gastrointestinal Cancer Translational Research (2021JH13/10200045), Scientific research foundation for the introduction of talents, Liaoning Cancer Hospital & Institute (No. Z1702), Study on Functional Integration of Transdermal Delivery Carrier/Controlled Release Structure of Fluorouracil (The expenses of basic scientific research in central universities, LD202107), the National Natural Science Foundation of China (No.82002568), Science and Technology Planning Project of Liaoning Province of China (No. 2023-BS-043), Beijing Xisike Clinical Oncology Research Foundation (Y-tongshu2021/ms-0270), the Natural Science Foundation of Liaoning Province, Cross-disciplinary Medical-Engineering Collaboration Foundation (2021-YGJC-19) and Natural Science Foundation of Liaoning Province (2023-MS-058).
Author contributions
Jialing Ran, Feifei Li and Lei Zhan wrote the original draft and did the methodology. Yue Jin and Qian Dong did the investigation. Xiaoyan Li and Xiaoxi Li did the statically analysis. Qian Fei edited the manuscript. Jingdong Zhang supervised the study.
Data sharing statement
The datasets used and/or analyzed during the current study are available from the corresponding author on reasonable request.
Competing Interests
The authors have declared that no competing interest exists.
References
1. Hanahan D, Weinberg RA. Hallmarks of cancer: the next generation. Cell. 2011;144:646-74
2. Racker E. Bioenergetics and the problem of tumor growth. American scientist. 1972;60:56-63
3. Shirai Y, Chow CC, Kambe G, Suwa T, Kobayashi M, Takahashi I. et al. An overview of the recent development of anticancer agents targeting the HIF-1 transcription factor. Cancers. 2021;13:2813
4. Fang J, Gillies R, Gatenby R. Adaptation to hypoxia and acidosis in carcinogenesis and tumor progression. Semin Cancer Biol. 2008;18:330-7
5. Guzy RD, Hoyos B, Robin E, Chen H, Liu L, Mansfield KD. et al. Mitochondrial complex III is required for hypoxia-induced ROS production and cellular oxygen sensing. Cell metabolism. 2005;1:401-8
6. Ke Q, Costa M. Hypoxia-inducible factor-1 (HIF-1). Molecular pharmacology. 2006;70:1469-80
7. Saito S, Lin YC, Tsai MH, Lin CS, Murayama Y, Sato R, Yokoyama KK. Emerging roles of hypoxia-inducible factors and reactive oxygen species in cancer and pluripotent stem cells. The Kaohsiung journal of medical sciences. 2015;31:279-86
8. Xu C, Gu L, Kuerbanjiang M, Wen S, Xu Q, Xue H. Thrombospondin 2/Toll-Like Receptor 4 Axis Contributes to HIF-1α-Derived Glycolysis in Colorectal Cancer. Front Oncol. 2020;10:557730
9. Wang T, Ning K, Lu T, Hua D. Elevated expression of TrpC5 and GLUT1 is associated with chemoresistance in colorectal cancer. Oncol Rep. 2017;37:1059-65
10. Shi T, Ma Y, Cao L, Zhan S, Xu Y, Fu F. et al. B7-H3 promotes aerobic glycolysis and chemoresistance in colorectal cancer cells by regulating HK2. Cell Death Dis. 2019;10:308
11. Wang X, Zhang H, Yang H, Bai M, Ning T, Deng T. et al. Exosome-delivered circRNA promotes glycolysis to induce chemoresistance through the miR-122-PKM2 axis in colorectal cancer. Mol Oncol. 2020;14:539-55
12. Taniguchi K, Sakai M, Sugito N, Kuranaga Y, Kumazaki M, Shinohara H. et al. PKM1 is involved in resistance to anti-cancer drugs. Biochem Biophys Res Commun. 2016;473:174-80
13. Chen R, Xu J, She Y, Jiang T, Zhou S, Shi H, Li C. Necrostatin-1 protects C2C12 myotubes from CoCl2-induced hypoxia. Int J Mol Med. 2018;41:2565-72
14. Ivan M, Kondo K, Yang H, Kim W, Valiando J, Ohh M. et al. HIFalpha targeted for VHL-mediated destruction by proline hydroxylation: implications for O2 sensing. Science. 2001;292:464-8
15. Chen J, Zhan Y, Yang C, Tzeng S. Oxidative stress-induced attenuation of thrombospondin-1 expression in primary rat astrocytes. J Cell Biochem. 2011;112:59-70
16. De Vitis C, Battaglia AM, Pallocca M, Santamaria G, Mimmi MC, Sacco A. et al. ALDOC-and ENO2-driven glucose metabolism sustains 3D tumor spheroids growth regardless of nutrient environmental conditions: a multi-omics analysis. Journal of Experimental & Clinical Cancer Research. 2023;42:69
17. Tang Y, Li Y, Zhao C, Liu L, He Q, Li Y. et al. Effects of biological clock gene BMAL1 and hypoxia-inducible factor HIF-1α on proliferation, migration and radiotherapy sensitivity of nasopharyngeal carcinoma cells HONE1. Holistic Integrative Oncology. 2023;2:26
18. Luo G, Wang X, Cui Y, Cao Y, Zhao Z, Zhang J. Metabolic reprogramming mediates hippocampal microglial M1 polarization in response to surgical trauma causing perioperative neurocognitive disorders. J Neuroinflammation. 2021;18:267
19. Zhang X, Li Y, Ma Y, Yang L, Wang T, Meng X. et al. Yes-associated protein (YAP) binds to HIF-1α and sustains HIF-1α protein stability to promote hepatocellular carcinoma cell glycolysis under hypoxic stress. J Exp Clin Cancer Res. 2018;37:216
20. Wang Y, Yu G, Liu Y, Xie L, Ge J, Zhao G, Lin J. Hypoxia-induced PTTG3P contributes to colorectal cancer glycolysis and M2 phenotype of macrophage. Bioscience reports. 2021;41:BSR20210764
21. Cao X, Zhu Z, Cao Y, Hu J, Min MJ. CD73 is a hypoxia-responsive gene and promotes the Warburg effect of human gastric cancer cells dependent on its enzyme activity. J Cancer. 2021;12:6372-82
22. Benjamin D, Robay D, Hindupur S, Pohlmann J, Colombi M, El-Shemerly M. et al. Dual Inhibition of the Lactate Transporters MCT1 and MCT4 Is Synthetic Lethal with Metformin due to NAD+ Depletion in Cancer Cells. Cell Rep. 2018;25:3047-58.e4
23. Bohn T, Rapp S, Luther N, Klein M, Bruehl T, Kojima N. et al. Tumor immunoevasion via acidosis-dependent induction of regulatory tumor-associated macrophages. Nat Immunol. 2018;19:1319-29
24. Gu Q, He Y, Ji J, Yao Y, Shen W, Luo J. et al. Hypoxia-inducible factor 1α (HIF-1α) and reactive oxygen species (ROS) mediates radiation-induced invasiveness through the SDF-1α/CXCR4 pathway in non-small cell lung carcinoma cells. Oncotarget. 2015;6:10893-907
25. Fan K, Wang J, Sun W, Shen S, Ni X, Gong Z. et al. MUC16 C-terminal binding with ALDOC disrupts the ability of ALDOC to sense glucose and promotes gallbladder carcinoma growth. Exp Cell Res. 2020;394:112118
26. Izraely S, Ben-Menachem S, Sagi-Assif O, Meshel T, Malka S, Telerman A. et al. The melanoma brain metastatic microenvironment: aldolase C partakes in shaping the malignant phenotype of melanoma cells - a case of inter-tumor heterogeneity. Mol Oncol. 2021;15:1376-90
27. Reinsborough C, Ipas H, Abell N, Gouws E, Williams J, Mercado M. et al. BCDIN3D RNA methyltransferase stimulates Aldolase C expression and glycolysis through let-7 microRNA in breast cancer cells. Oncogene. 2021;40:2395-406
28. Maruyama R, Nagaoka Y, Ishikawa A, Akabane S, Fujiki Y, Taniyama D. et al. Overexpression of aldolase, fructose-bisphosphate C and its association with spheroid formation in colorectal cancer. Pathology International. 2022;72:176-86
29. Yu C, Yang S, Fang X, Jiang J, Sun C, Huang T. Hypoxia disrupts the expression levels of circadian rhythm genes in hepatocellular carcinoma. Mol Med Rep. 2015;11:4002-8
30. Alexander RK, Liou Y-H, Knudsen NH, Starost KA, Xu C, Hyde AL. et al. Bmal1 integrates mitochondrial metabolism and macrophage activation. Elife. 2020;9:e54090
31. Peek C, Levine D, Cedernaes J, Taguchi A, Kobayashi Y, Tsai S. et al. Circadian Clock Interaction with HIF1α Mediates Oxygenic Metabolism and Anaerobic Glycolysis in Skeletal Muscle. Cell Metab. 2017;25:86-92
32. Fuhr L, El-Athman R, Scrima R, Cela O, Carbone A, Knoop H. et al. The Circadian Clock Regulates Metabolic Phenotype Rewiring Via HKDC1 and Modulates Tumor Progression and Drug Response in Colorectal Cancer. EBioMedicine. 2018;33:105-21
33. Mattiuzzi C, Lippi G. Cancer statistics: a comparison between World Health Organization (WHO) and Global Burden of Disease (GBD). Eur J Public Health. 2020;30:1026-7
34. Petimar J, Smith-Warner SA, Rosner B, Chan AT, Giovannucci EL, Tabung FK. Adherence to the World Cancer Research Fund/American Institute for Cancer Research 2018 Recommendations for Cancer Prevention and Risk of Colorectal Cancer. Cancer Epidemiol Biomarkers Prev. 2019; 28: 1469-79. Recommendations for Cancer Prevention and Risk of Colorectal Cancer. 2019;28:1469-79
35. Mody K, Baldeo C, Bekaii-Saab T. Antiangiogenic Therapy in Colorectal Cancer. Cancer J. 2018;24:165-70
36. Zare-Bandamiri M, Fararouei M, Zohourinia S, Daneshi N, Dianatinasab M. Risk Factors Predicting Colorectal Cancer Recurrence Following Initial Treatment: A 5-year Cohort Study. Asian Pacific journal of cancer prevention: APJCP. 2017;18:2465-70
37. Hebbar M, Chibaudel B, André T, Mineur L, Smith D, Louvet C. et al. FOLFOX4 versus sequential dose-dense FOLFOX7 followed by FOLFIRI in patients with resectable metastatic colorectal cancer (MIROX): a pragmatic approach to chemotherapy timing with perioperative or postoperative chemotherapy from an open-label, randomized phase III trial. Ann Oncol. 2015;26:340-7
38. Lee J, Kim H, Jung I, Shin S, Beom S, Chang J. et al. Upfront radical surgery with total mesorectal excision followed by adjuvant FOLFOX chemotherapy for locally advanced rectal cancer (TME-FOLFOX): an open-label, multicenter, phase II randomized controlled trial. Trials. 2020;21:320
39. Mauri G, Gori V, Bonazzina E, Amatu A, Tosi F, Bencardino K. et al. Oxaliplatin retreatment in metastatic colorectal cancer: Systematic review and future research opportunities. Cancer Treat Rev. 2020;91:102112
40. Riihimäki M, Hemminki A, Sundquist J, Hemminki K. Patterns of metastasis in colon and rectal cancer. Sci Rep. 2016;6:29765
Author contact
![]() Corresponding author: Jingdong Zhang, Cancer Hospital of China Medical University, Cancer Hospital of Dalian University of Technology, Liaoning Cancer Hospital & Institute, No.44 Xiaoheyan Road, Dadong District, Shenyang 110042, Liaoning Province, PR China. jdzhangcom, 86-13804027878.
Corresponding author: Jingdong Zhang, Cancer Hospital of China Medical University, Cancer Hospital of Dalian University of Technology, Liaoning Cancer Hospital & Institute, No.44 Xiaoheyan Road, Dadong District, Shenyang 110042, Liaoning Province, PR China. jdzhangcom, 86-13804027878.