Impact Factor ISSN: 1837-9664

 Global reach, higher impact
J Cancer 2024; 15(11):3370-3380. doi:10.7150/jca.92389 This issue Cite
Research Paper
Nomograms for Predicting Risk and Survival of Esophageal Cancer Lung Metastases: a SEER Analysis
Wenhui He1,2*, Youzhen Yu1,2*, Ziting Yan2*, Na Luo1,2, Wenwen Yang1,3, Fanfan Li1,2, Hongying Jin1,2, Yimei Zhang1,2, Xiaoli Ma1,4, Minjie Ma1,4 ![]()
1. Department of Thoracic Surgery, the First Hospital of Lanzhou University, Lanzhou 730000, Gansu Province, China.
2. School of Nursing, Gansu University of Traditional Chinese Medicine, Lanzhou730000, Gansu Province, China.
3. The First Clinical Medical College, Lanzhou University, Lanzhou 730000, Gansu Province, China.
4. Gansu Province International Cooperation Base for Research and Application of Key technology of Thoracic Surgery, The First Hospital of Lanzhou University, Lanzhou, 730000, Gansu Province, China.
*These authors contributed equally to this work.
Received 2023-11-19; Accepted 2024-4-7; Published 2024-4-23
Abstract

Background: The overall survival rate is notably low for esophageal cancer patients with lung metastases (LM), presenting significant challenges in their treatment.
Methods: Through the Surveillance, Epidemiology, and End Results (SEER) program, individuals diagnosed with esophageal cancer between 2010 and 2015 were enrolled. Based on whether esophageal cancer metastasized to the lungs, we used propensity score matching (PSM) to balance correlated variables. Propensity score matching was a critical step in our study that helped to minimize the impact of possible confounders on the study results. We balanced variables related to lung metastases using the PSM method to ensure more accurate comparisons between the study and control groups. Specifically, we performed PSM in the following steps. First, we performed a univariate logistic regression analysis to screen for variables associated with lung metastasis. For each patient, we calculated their propensity scores using a logistic regression model, taking into account several factors, including gender, T-stage, N-stage, surgical history, radiotherapy history, chemotherapy history, and bone/brain/liver metastases. We used a 1:1 matching ratio based on the propensity score to ensure more balanced baseline characteristics between the study and control groups after matching. After matching, we validated the balance of baseline characteristics to ensure that the effect of confounders was minimized. We used logistic regression to identify risk variables for LM, while Cox regression was used to find independent prognostic factors. We then created nomograms and assessed their accuracy using the calibration curve, receiver operating curves (ROC), and C index.
Results: In the post-PSM cohort, individuals diagnosed with LM experienced a median overall survival (OS) of 5.0 months (95% confidence interval [CI] 4.3-5.7), which was significantly lower than those without LM (P<0.001). LM has been associated to sex, T stage, N stage, surgery, radiation, chemotherapy, and bone/brain/liver metastases. LM survival was affected by radiation, chemotherapy, and bone/liver metastases. The nomograms' predictive power was proved using the ROC curve, C-index, and validation curve.
Conclusion: Patients with LM have a worse chance of surviving esophageal cancer. The nomograms can effectively predict the risk and prognosis of lung metastases from esophageal cancer.
Keywords: SEER, esophageal cancer, lung metastasis, nomogram, Cox regression, logistic regression
Introduction
As of 2020, esophageal cancer holds the 10th position globally, reporting 604,100 new cases and ranking 6th for new fatalities with 544,076 deaths [1]. The primary histopathological variants of esophageal carcinoma include squamous cell carcinoma and adenocarcinoma, with squamous cell carcinoma having the highest incidence in Eastern and South-East Asia and adenocarcinoma having the highest incidence in Western and Northern Europe, Oceania, and Northern America [2]. Esophageal cancer, particularly adenocarcinoma, has become more common in Western countries in recent decades [3, 4]. Esophageal cancer spreads quickly after it has developed. More than half of esophageal cancers had unresectable tumors or metastases at the time of diagnosis [5]. Patients with metastatic esophageal cancer have a very low 5-year survival rate, with only approximately 5% surviving five years [6, 7]. CT and PET/CT are two typical approaches for detecting distant lung metastases in esophageal cancer [8-10]. The high cost and invasiveness of these tests, on the other hand, raise the financial burden on patients and the risk of iatrogenic damage. As a result, identifying and assessing risk factors is important for improving the effectiveness of lung metastasis screening in patients with esophageal cancer.
The lung, second only to the liver and higher than the bone and brain, is one of the most common distant metastatic sites of esophageal cancer [11-13]. Some publications about esophageal cancer distant metastasis have previously been published [14, 15]. Xin Tang et al. [14] developed a nomogram for predicting cancer-specific survival of metastatic esophageal cancer. Shizhao Cheng et al. [15] created a nomogram to make a prediction on the risk and prognosis of esophageal cancer brain metastases. Jida Guo et al. [16] looked at esophageal cancer lung metastasis, but they didn't create a nomogram, which limited their findings. As a result, developing models to predict the prognosis and risk of esophageal cancer lung metastasis is critical. We developed two nomograms to predict the survival time of lung metastases and the risk of esophageal cancer lung metastases using the SEER data from 2010 to 2015.
Methods
Patients
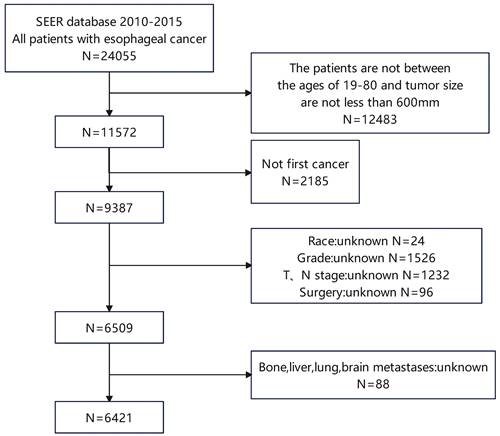
The retrospective study drew its data from the SEER database 18 Regs custom dataset spanning the years 1975 to 2016. Between 2010 and 2015, we screened 6421 patients with esophageal cancer, including 400 patients with LM (Figure 1). Patients who are enrolled must meet the following requirements: (1) Between the ages of 19 and 80; (2) with a tumor size of less than 600mm. The following is a summary of the exclusion criteria: (1) Not first cancer (2) Patients with stage T0 esophageal cancer (3) Patients with insufficient information (4) Individuals detected through post-mortem examinations. The SEER database is used to extract race, gender, year of diagnosis, primary site, T stage, N stage, radiation history, chemotherapy history, surgical history, tumor size, histological type, age, and bone/brain/liver/lung metastases, as well as other follow-up information. This study evaluates the survival time as the duration from the date of diagnosis to the date of either all-cause death or the last follow-up, commonly known as OS. The AJCC 7th edition was used for TNM staging. Because the SEER database is an open database, no institutional review board permission was required for this study.
Patient screening flowchart. This figure contains how we screened esophageal cancer patients from the SEER database.
Statistical analysis and optimal cutoffs
We used Fisher's exact test or chi-square to compare differences in categorical variables. We incorporated the factors of P<0.05 in univariate logistic regression into multivariate regression and created a nomogram for predicting the risk of LM. By year of diagnosis, we divide 400 patients with LM into training (2012-2015, n=268) and internal validation (2010-2011, n=132) groups. We included the factor of P<0.10 in univariate cox regression into multivariate regression. We created a prognostic chart to forecast LM survival, and employed C-index, ROC curves, and calibration curves to confirm its accuracy. The Kaplan-Meier curve was used to assess the variance in survival duration between patients with LM and those without LM. To find the best cutoffs for tumor size and age, we used the x-tile v3.6.1 (Yale University) program [17]. To balance differences in other characteristics between LM and non-LM patients, a 1:1 PSM was done in SPSS v26.0 (SPSS Inc). Statistical analyses were conducted utilizing GraphPad Prism v8.0.2 (GraphPad Software, Inc.), SPSS v26.0 (SPSS Inc.), and R software v4.1.3 (https://www.r-project.org/). A significance level of P < 0.05 was considered to indicate statistical significance.
Results
Features of esophageal cancer patients
In this retrospective investigation, we included all 6421 patients diagnosed with esophageal cancer between 2010 and 2015, with 6.2% (n=400) having lung metastases, 9.7% (n=620) having liver metastases, 5.2% (n=336) having bone metastases, 1.3% (n=86) having brain metastases, 82.1% (n=5275) were male, 84.2% (n=5408) were white, 66.4% (n=4268) were in the lower third of the esophagus, 62.4% (n=4012) were adenocarcinoma, 42.9% (n=2756) underwent surgery, 67.8% (n=4358) received radiation therapy, and 75.2% (n=4834) received chemotherapy. T3 (n=2 992, 46.5%) and N1 (n=2866, 44.6%) were the most prevalent T and N phases, respectively. In both the pre-PSM and post-PSM cohorts, we scrutinized the characteristics of the patients, as indicated in Table 1, and found no statistically significant differences in most variables in the post-PSM cohort. As a result, PSM reduces the interference of other elements.
Characteristics of patients before and after PSM based on whether or LM
| The pre-PSM cohort | The post-PSM cohort | ||||||||||
|---|---|---|---|---|---|---|---|---|---|---|---|
| Lung metastasis | Non-lung metastasis | Lung metastasis | Non-lung metastasis | ||||||||
| N | % | N | % | P | N | % | N | % | P | ||
| n=400 | n=6021 | n=393 | n=393 | ||||||||
| Age | 23-66 | 240 | 60.00 | 3632 | 60.32 | 0.927 | 235 | 59.80 | 243 | 61.83 | 0.076 |
| 67-72 | 84 | 21.00 | 1290 | 21.43 | 84 | 21.37 | 61 | 15.52 | |||
| 73-80 | 76 | 19.00 | 1099 | 18.25 | 74 | 18.83 | 89 | 22.65 | |||
| Race | White | 307 | 76.75 | 5101 | 84.72 | <0.001 | 305 | 77.61 | 305 | 77.61 | 0.034 |
| Black | 63 | 15.75 | 580 | 9.63 | 60 | 15.27 | 43 | 10.94 | |||
| Other | 30 | 7.50 | 340 | 5.65 | 28 | 7.12 | 45 | 11.45 | |||
| Gender | Female | 52 | 13.00 | 1094 | 18.17 | 0.008 | 50 | 12.72 | 49 | 12.47 | 1 |
| Male | 348 | 87.00 | 4927 | 81.83 | 343 | 87.28 | 344 | 87.53 | |||
| Primary Site | Upper third | 19 | 4.75 | 281 | 4.67 | 0.005 | 19 | 4.83 | 27 | 6.87 | 0.297 |
| Middle third | 69 | 17.25 | 884 | 14.68 | 68 | 17.30 | 56 | 14.25 | |||
| Lower third | 236 | 59.00 | 4032 | 66.97 | 232 | 59.03 | 246 | 62.60 | |||
| Other | 76 | 19.00 | 824 | 13.69 | 74 | 18.83 | 64 | 16.28 | |||
| Grade | Grade I | 11 | 2.75 | 441 | 7.32 | <0.001 | 11 | 2.80 | 13 | 3.31 | 0.918 |
| Grade II | 159 | 39.75 | 2638 | 43.81 | 158 | 40.20 | 151 | 38.42 | |||
| Grade III | 227 | 56.75 | 2845 | 47.25 | 221 | 56.23 | 225 | 57.25 | |||
| Grade IV | 3 | 0.75 | 97 | 1.61 | 3 | 0.76 | 4 | 1.02 | |||
| Histologic | Squamous cell carcinoma | 147 | 36.75 | 1764 | 29.30 | 0.005 | 142 | 36.13 | 138 | 35.11 | 0.792 |
| Adenocarcinoma | 221 | 55.25 | 3791 | 62.96 | 219 | 55.73 | 227 | 57.76 | |||
| Other | 32 | 8.00 | 466 | 7.74 | 32 | 8.14 | 28 | 7.12 | |||
| T stage | T1 | 145 | 36.25 | 1572 | 26.11 | <0.001 | 143 | 36.39 | 106 | 26.97 | <0.001 |
| T2 | 13 | 3.25 | 816 | 13.55 | 13 | 3.31 | 40 | 10.18 | |||
| T3 | 102 | 25.50 | 2890 | 48.00 | 100 | 25.45 | 152 | 38.68 | |||
| T4 | 140 | 35.00 | 743 | 12.34 | 137 | 34.86 | 95 | 24.17 | |||
| N stage | N0 | 95 | 23.75 | 2314 | 38.43 | <0.001 | 94 | 23.92 | 102 | 25.95 | 0.024 |
| N1 | 239 | 59.75 | 2627 | 43.63 | 235 | 59.80 | 199 | 50.64 | |||
| N2 | 36 | 9.00 | 808 | 13.42 | 35 | 8.91 | 58 | 14.76 | |||
| N3 | 30 | 7.50 | 272 | 4.52 | 29 | 7.38 | 34 | 8.65 | |||
| Surgery | No | 388 | 97.00 | 3277 | 54.43 | <0.001 | 381 | 96.95 | 382 | 97.20 | 1 |
| Yes | 12 | 3.00 | 2744 | 45.57 | 12 | 3.05 | 11 | 2.80 | |||
| Radiation | No | 214 | 53.50 | 1849 | 30.71 | <0.001 | 210 | 53.44 | 212 | 53.94 | 0.943 |
| Yes | 186 | 46.50 | 4172 | 69.29 | 183 | 46.56 | 181 | 46.06 | |||
| Chemotherapy | No | 148 | 37.00 | 1439 | 23.90 | <0.001 | 142 | 36.13 | 123 | 31.30 | 0.174 |
| Yes | 252 | 63.00 | 4582 | 76.10 | 251 | 63.87 | 270 | 68.70 | |||
| Bone metastasis | No | 304 | 76.00 | 5781 | 96.01 | <0.001 | 303 | 77.10 | 306 | 77.86 | 0.864 |
| Yes | 96 | 24.00 | 240 | 3.99 | 90 | 22.90 | 87 | 22.14 | |||
| Brain metastasis | No | 375 | 93.75 | 5960 | 98.99 | <0.001 | 371 | 94.40 | 373 | 94.91 | 0.874 |
| Yes | 25 | 6.25 | 61 | 1.01 | 22 | 5.60 | 20 | 5.09 | |||
| Liver metastasis | No | 235 | 58.75 | 5566 | 92.44 | <0.001 | 234 | 59.54 | 240 | 61.07 | 0.716 |
| Yes | 165 | 41.25 | 455 | 7.56 | 159 | 40.46 | 153 | 38.93 | |||
| Tumor size | 1--25 | 38 | 9.50 | 1360 | 22.59 | <0.001 | 38 | 9.67 | 34 | 8.65 | 0.877 |
| 26-63 | 200 | 50.00 | 3153 | 52.37 | 197 | 50.13 | 201 | 51.15 | |||
| 64-560 | 162 | 40.50 | 1508 | 25.05 | 158 | 40.20 | 158 | 40.20 | |||
We used the x-tile v3.6.1 (Yale University) to determine the optimal cutoffs for tumor size and age. PSM: propensity score matching
Survival analysis of esophageal cancer lung metastases
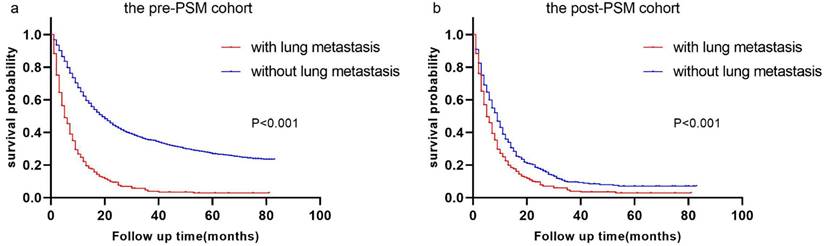
Before and after PSM, the cohorts had median follow-up times of 15.0 months (IQR 7.0-30.0 months) and 6 months (IQR 2.0-13.0 months), respectively. The differences in these characteristics were essentially balanced (P > 0.05) when 393 esophageal cancer patients with LM were matched with 393 esophageal cancer patients without LM. During the pre- and post-PSM cohorts' follow-up periods, 4308 (67.0%) and 721 (91.7%) cases died, respectively. Esophageal cancer patients with LM and those without LM had a median OS of 5.0 (95 % CI: 4.3-5.7) months and 18.0 (95 % CI: 17.1-18.9) months, respectively, in the pre-PSM cohort (Figure 2 a). Patients with esophageal cancer LM and those without lung metastases had median OS of 5.0 (95%CI: 4.3-5.7) months and 8.0 (95%CI: 6.8-9.2) months, respectively, in the post-PSM cohort, and they were statistically significantly different (Figure 2 b).
Kaplan-Meier curves of the pre- and post-PSM cohorts. Kaplan‒Meier curves of (a) the pre-PSM cohort and (b) the post-PSM cohort.
The diagnosis possibility of LM in esophageal cancer patients
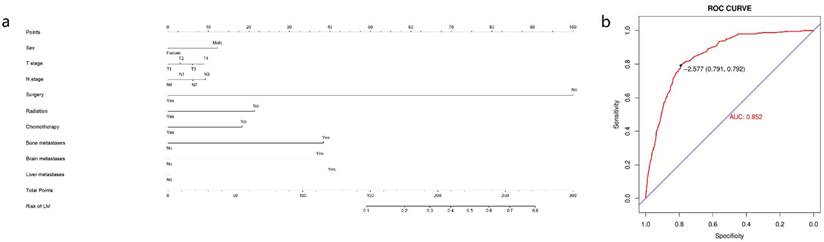
Race, T stage, N stage, sex, primary site, grade, surgery history, histologic type, radiation history, chemotherapy history, tumor size, and bone/brain/liver metastases were all included in multivariate analysis using univariate logistic regression. P values for sex, T stage, N stage, surgical history, radiation history, chemotherapy history, and bone/brain/liver metastases remained less than 0.05 in multivariate logistic regression. Refer to Table 2 for more information. We developed a nomogram based on the foregoing findings that can reliably predict the diagnostic likelihood of LM in patients with esophageal cancer (Figure 3 a). The nomogram's C-index is 0.852, and the ROC curve is given in Figure 3 b, indicating that the model has strong predictive power.
Univariate and multivariate logistic regression for analyzing associated factors for developing LM
| Univariate | Multivariate | ||||
|---|---|---|---|---|---|
| HR (95% CI) | P | HR (95% CI) | P | ||
| Age | 23-66 | 1 | |||
| 67-72 | 0.985 (0.763-1.274) | 0.911 | |||
| 73-80 | 1.047 (0.802-1.366) | 0.738 | |||
| Race | White | 1 | 1 | ||
| Black | 1.805 (1.358-2.398) | <0.001 | 1.209 (0.854-1.710) | 0.284 | |
| Other | 1.466 (0.992-2.167) | 0.055 | 1.240 (0.794-1.937) | 0.345 | |
| Sex | Female | 1 | 1 | ||
| Male | 1.486 (1.103-2.003) | 0.009 | 1.492 (1.074-2.073) | 0.017 | |
| Primary Site | Upper third | 1 | 1 | ||
| Middle third | 1.154 (0.683-1.952) | 0.592 | 1.411 (0.804-2.476) | 0.231 | |
| Lower third | 0.866 (0.534-1.403) | 0.588 | 1.270 (0.730-2.211) | 0.398 | |
| Other | 1.364 (0.810-2.296) | 0.242 | 1.395 (0.792-2.456) | 0.249 | |
| Grade | Well differentiated; Grade I | 1 | 1 | ||
| Moderately differentiated; Grade II | 2.416 (1.301-4.489) | 0.005 | 1.836 (0.950-3.549) | 0.071 | |
| Poorly differentiated; Grade III | 3.199 (1.732-5.907) | <0.001 | 1.836 (0.953-3.539) | 0.069 | |
| Undifferentiated; anaplastic; Grade IV | 1.240 (0.339-4.529) | 0.745 | 0.649 (0.163-2.590) | 0.541 | |
| Histologic | Squamous cell carcinoma | 1 | 1 | ||
| Adenocarcinoma | 0.700 (0.564-0.868) | 0.001 | 0.777 (0.569-1.061) | 0.113 | |
| Other | 0.824 (0.555-1.224) | 0.338 | 0.669 (0.414-1.081) | 0.101 | |
| T stage | T1 | 1 | 1 | ||
| T2 | 0.173 (0.097-0.307) | <0.001 | 0.279 (0.153-0.507) | <0.001 | |
| T3 | 0.383 (0.295-0.497) | <0.001 | 0.576 (0.426-0.779) | <0.001 | |
| T4 | 2.043 (1.594-2.618) | <0.001 | 1.209 (0.911-1.604) | 0.189 | |
| N stage | N0 | 1 | 1 | ||
| N1 | 2.216 (1.736-2.829) | <0.001 | 1.634 (1.241-2.151) | <0.001 | |
| N2 | 1.085 (0.733-1.606) | 0.682 | 1.062 (0.688-1.639) | 0.786 | |
| N3 | 2.687 (1.749-4.127) | <0.001 | 1.807 (1.098-2.975) | 0.020 | |
| Surgery | No | 1 | 1 | ||
| Yes | 0.037 (0.021-0.066) | <0.001 | 0.083 (0.045-0.151) | <0.001 | |
| Radiation | No | 1 | 1 | ||
| Yes | 0.385 (0.314-0.472) | <0.001 | 0.621 (0.482-0.801) | <0.001 | |
| Chemotherapy | No | 1 | 1 | ||
| Yes | 0.535 (0.433-0.661) | <0.001 | 0.641 (0.496-0.828) | 0.001 | |
| Bone metastasis | No | 1 | 1 | ||
| Yes | 7.607 (5.846-9.898) | <0.001 | 2.806 (2.093-3.762) | <0.001 | |
| Liver metastasis | No | 1 | 1 | ||
| Yes | 8.589 (6.887-10.711) | <0.001 | 3.085 (2.378-4.002) | <0.001 | |
| Brain metastasis | No | 1 | 1 | ||
| Yes | 6.514 (4.043-10.495) | <0.001 | 2.602 (1.499-4.516) | 0.001 | |
| Tumor size | 1-25 | 1 | 1 | ||
| 26-63 | 2.270 (1.596-3.230) | <0.001 | 1.260 (0.853-1.862) | 0.246 | |
| 64-560 | 3.845 (2.680-5.515) | <0.001 | 1.455 (0.971-2.180) | 0.069 | |
HR: hazard ratio; CI: confidence interval
Nomogram for predicting the diagnosis possibility of LM in esophageal cancer patients. Nomogram for predicting the diagnosis possibility of LM in esophageal cancer patients (a) and ROC curve of this nomogram (b).
Independent prognostic factors in esophageal cancer LM patients
The clinical characteristics of the cohort for building the nomogram and the cohort for validating the nomogram were shown in Table 3. Fisher's exact test or Chi-square revealed that most variables across the two cohorts were very similar (P≥0.05). Race, T stage, grade, histological type, radiation, surgery, chemotherapy, and bone/brain/liver metastases were all included in the multivariate analysis in the training cohort, with P<0.10 in univariate cox regression. (see Table 4) In esophageal cancer patients with lung metastases, multivariate analysis revealed that radiation, chemotherapy, and bone/liver metastases were independent predictive variables for OS (P<0.05) (see Table 4).
Statistical characteristics of patients with esophageal cancer lung metastases
| Training cohort (N=268) | Validation cohort (N=132) | |||||
|---|---|---|---|---|---|---|
| n | % | n | % | P | ||
| Age | 23-66 | 161 | 60.07 | 79 | 59.85 | 0.827 |
| 67-72 | 58 | 21.64 | 26 | 19.70 | ||
| 73-80 | 49 | 18.28 | 27 | 20.45 | ||
| Race | White | 204 | 76.12 | 103 | 78.03 | 0.872 |
| Black | 44 | 16.42 | 19 | 14.39 | ||
| Other | 20 | 7.46 | 10 | 7.58 | ||
| Sex | Female | 31 | 11.57 | 21 | 15.91 | 0.268 |
| Male | 237 | 88.43 | 111 | 84.09 | ||
| Primary Site | Upper third | 14 | 5.22 | 5 | 3.79 | 0.172 |
| Middle third | 47 | 17.54 | 22 | 16.67 | ||
| Lower third | 149 | 55.60 | 87 | 65.91 | ||
| Other | 58 | 21.64 | 18 | 13.64 | ||
| Grade | Well differentiated; Grade I | 5 | 1.87 | 6 | 4.55 | 0.443 |
| Moderately differentiated; Grade II | 105 | 39.18 | 54 | 40.91 | ||
| Poorly differentiated; Grade III | 156 | 58.21 | 71 | 53.79 | ||
| Undifferentiated; grade iv | 2 | 0.75 | 1 | 0.76 | ||
| Histologic | Squamous cell carcinoma | 98 | 36.57 | 49 | 37.12 | 0.086 |
| Adenocarcinoma | 143 | 53.36 | 78 | 59.09 | ||
| Other | 27 | 10.07 | 5 | 3.79 | ||
| T stage | T1 | 99 | 36.94 | 46 | 34.85 | 0.097 |
| T2 | 8 | 2.99 | 5 | 3.79 | ||
| T3 | 59 | 22.01 | 43 | 32.58 | ||
| T4 | 102 | 38.06 | 38 | 28.79 | ||
| N stage | N0 | 60 | 22.39 | 35 | 26.52 | 0.731 |
| N1 | 161 | 60.07 | 78 | 59.09 | ||
| N2 | 25 | 9.33 | 11 | 8.33 | ||
| N3 | 22 | 8.21 | 8 | 6.06 | ||
| Surgery | No | 259 | 96.64 | 129 | 97.73 | 0.758 |
| Yes | 9 | 3.36 | 3 | 2.27 | ||
| Radiation | No | 156 | 58.21 | 58 | 43.94 | 0.008 |
| Yes | 112 | 41.79 | 74 | 56.06 | ||
| Chemotherapy | No | 105 | 39.18 | 43 | 32.58 | 0.226 |
| Yes | 163 | 60.82 | 89 | 67.42 | ||
| Bone metastasis | No | 202 | 75.37 | 102 | 77.27 | 0.710 |
| Yes | 66 | 24.63 | 30 | 22.73 | ||
| Liver metastasis | No | 150 | 55.97 | 85 | 64.39 | 0.130 |
| Yes | 118 | 44.03 | 47 | 35.61 | ||
| Brain metastasis | No | 250 | 93.28 | 125 | 94.70 | 0.665 |
| Yes | 18 | 6.72 | 7 | 5.30 | ||
| Tumor size | 1-25 | 24 | 8.96 | 14 | 10.61 | 0.855 |
| 26-63 | 134 | 50.00 | 66 | 50.00 | ||
| 64-560 | 110 | 41.04 | 52 | 39.39 | ||
We divided 400 patients with LM into training (2012-2015, n=268) and internal validation (2010-2011, n=132) cohorts by year of diagnosis. No statistically significant differences were found for most variables.
Univariate and multivariate Cox proportional hazards regression analysis in esophageal cancer patients with lung metastasis
| OS | |||||
|---|---|---|---|---|---|
| Univariate | Multivariate | ||||
| HR (95% CI) | P | HR (95% CI) | P | ||
| Age | 23-66 | 1 | |||
| 67-72 | 0.868(0.635-1.186) | 0.374 | |||
| 73-80 | 1.319(0.950-1.832) | 0.098 | |||
| Race | White | 1 | 1 | ||
| Black | 1.479(1.051-2.082) | 0.025 | 1.490 (0.995-2.232) | 0.053 | |
| Other | 1.064(0.656-1.727) | 0.801 | 1.057 (0.614-1.820) | 0.840 | |
| Sex | Female | 1 | |||
| Male | 0.856(0.586-1.248) | 0.418 | |||
| Primary Site | Upper third | 1 | |||
| Middle third | 1.186(0.623-2.259) | 0.604 | |||
| Lower third | 1.471(0.813-2.660) | 0.202 | |||
| Other | 1.223(0.652-2.292) | 0.530 | |||
| Grade | Well differentiated; Grade I | 1 | 1 | ||
| Moderately differentiated; Grade II | 0.388(0.156-0.963) | 0.041 | 0.931 (0.360-2.406) | 0.882 | |
| Poorly differentiated; Grade III | 0.518(0.211-1.271) | 0.151 | 1.017 (0.399-2.593) | 0.972 | |
| Undifferentiated; grade iv | 2.735(0.525-14.251) | 0.232 | 5.032 (0.877-28.887) | 0.070 | |
| Histologic | Squamous cell carcinoma | 1 | 1 | ||
| Adenocarcinoma | 0.925(0.707-1.211) | 0.573 | 1.070 (0.767-1.494) | 0.690 | |
| Other | 1.542(0.994-2.391) | 0.053 | 1.499 (0.907-2.476) | 0.114 | |
| T stage | T1 | 1 | 1 | ||
| T2 | 0.543(0.237-1.242) | 0.148 | 0.792 (0.342-1.835) | 0.586 | |
| T3 | 0.669(0.476-0.940) | 0.021 | 0.929 (0.646-1.334) | 0.689 | |
| T4 | 1.056(0.795-1.403) | 0.707 | 1.195 (0.887-1.610) | 0.242 | |
| N stage | N0 | 1 | |||
| N1 | 0.692(0.510-0.940) | 0.018 | |||
| N2 | 0.909(0.561-1.472) | 0.698 | |||
| N3 | 0.801(0.481-1.333) | 0.393 | |||
| Surgery | No | 1 | 1 | ||
| Yes | 0.426(0.199-0.908) | 0.027 | 0.775 (0.351-1.708) | 0.527 | |
| Radiation | No | 1 | 1 | ||
| Yes | 0.745(0.578-0.959) | 0.022 | 0.750 (0.565-0.997) | 0.048 | |
| Chemotherapy | No | 1 | 1 | ||
| Yes | 0.255(0.192-0.339) | <0.001 | 0.278 (0.206-0.376) | <0.001 | |
| Bone metastasis | No | 1 | 1 | ||
| Yes | 1.327(0.996-1.768) | 0.053 | 1.449(1.072-1.960) | 0.016 | |
| Liver metastasis | No | 1 | 1 | ||
| Yes | 1.587(1.235-2.041) | <0.001 | 1.429(1.092-1.869) | 0.009 | |
| Brain metastasis | No | 1 | 1 | ||
| Yes | 1.626(1.003-2.634) | 0.049 | 1.579(0.931-2.677) | 0.090 | |
| Tumor size | 1-25 | 1 | |||
| 26-63 | 0.858(0.549-1.343) | 0.503 | |||
| 64-560 | 1.141(0.723-1.799) | 0.571 | |||
We included factors with P<0.10 in univariate cox regression into the multivariate analysis.
Construction of a prognostic nomogram and validation
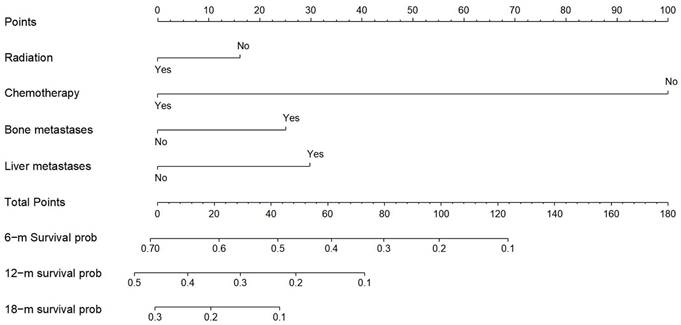
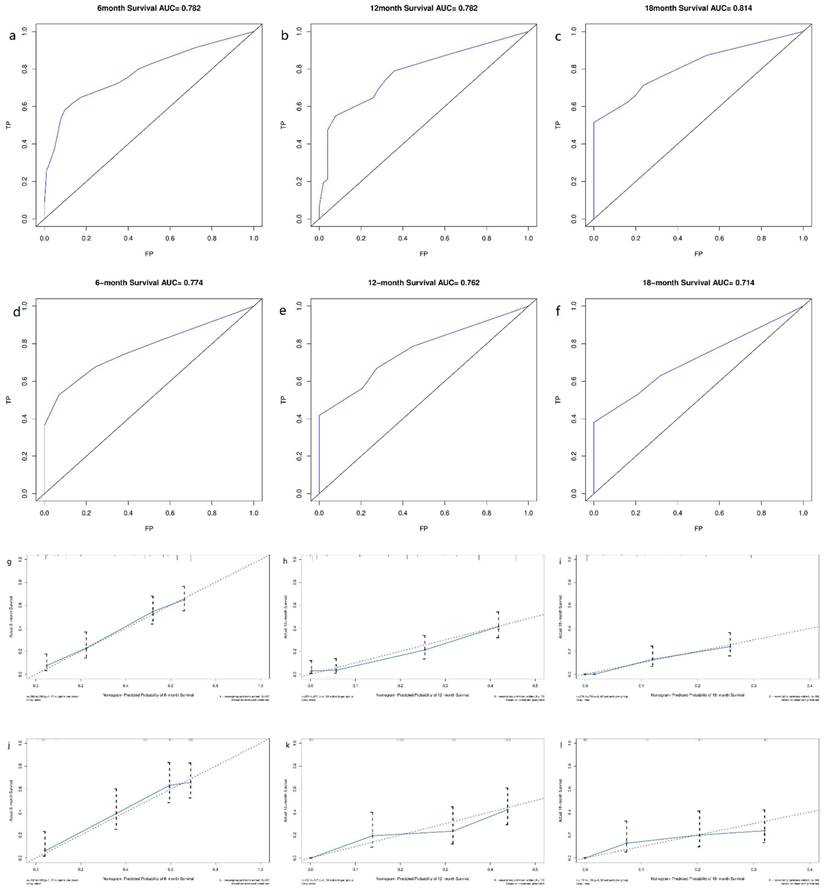
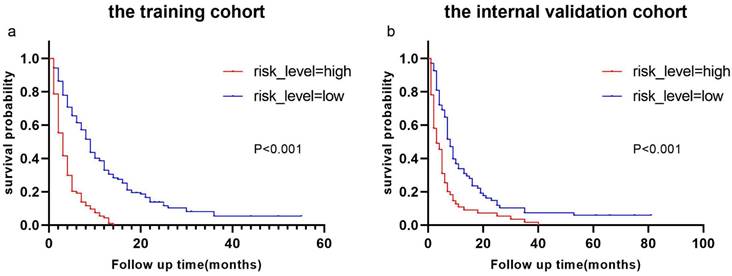
Derived from the results of multivariate Cox regression analysis, we created a nomogram that can forecast the prognosis of esophageal cancer lung metastases (Figure 4). The AUC of 6-, 12-, and 18-month OS in the training cohort were 0.782, 0.782, and 0.814, respectively (Figures 5 a-c). They are 0.774, 0.762, and 0.714 in the internal validation cohort, respectively (Figures 5 d-f). The training and validation cohorts had C-indices of 0.7226 (95 % CI: 0.6893-0.7558) and 0.7228 (95 % CI: 0.6737-0.7719), respectively. The C indices are greater than 0.7, indicating that this prediction model is accurate. Both the training cohort (Figures 5 g-i) and the validation cohort (Figures 5 j-l) calibration curves demonstrated a good correlation between actual and projected survival. The training and internal validation Kaplan-Meier curves Patients in different risk classes exhibited statistically significant differences in survival time, as revealed by the analysis (Figures 6 a, b).
Nomogram for predicting the overall survival of patients with esophageal cancer lung metastases. Nomogram for predicting the overall survival of patients with esophageal cancer lung metastases. From this nomogram, the overall probability of survival at 6 months, 12 months, and 18 months can be determined.
ROC curves and calibration curves of the nomogram. ROC curves of the nomogram to predict 6-, 12- and 18-month OS in the training cohort (a-c) and the internal validation cohort (d-f). Calibration curves of 6-, 12- and 18-month OS for esophageal cancer lung metastases patients in the training cohort (g-i) and the internal validation cohort (j-l). The closer the dashed line and the blue solid line are, the more accurate the model is. FP: false positive rate; TP: true positive rate.
Kaplan-Meier curves of OS for patients with different risks of esophageal cancer lung metastases in low-risk and high-risk cohorts. Kaplan-Meier curves of OS for patients with different risks of esophageal cancer lung metastases in the training cohort (a) and the internal validation cohort (b).
Discussion
The lung is one of the most common metastatic sites for esophageal cancer [11, 12, 18] and in our study, 6.2% (n=400) of esophageal cancer patients developed lung metastasis, which was second only to liver metastasis. Esophageal cancer lung metastasis has a very poor prognosis. Despite the fact that 63.0% (n=252) of esophageal cancer patients with lung metastases in this study received chemotherapy and 46.5 % (n=186) received radiotherapy, individuals with lung metastases from esophageal cancer exhibited a median survival time of merely 5 months, demonstrating the importance of early detection and treatment in improving patients' quality of life. Several nomogram models have previously been constructed to predict distant metastasis and survival of esophageal cancer patients with LM [14, 15, 19], and a population-based study analyzed factors influencing the diagnosis and survival of esophageal cancer patients with LM [16]. The primary purpose of this research is to create a nomogram model that can predict the diagnosis and survival of esophageal cancer lung metastases.
We established two nomograms based on the SEER database using logistic regression analysis and cox regression analysis, and then tested their predictive potential using the ROC curve, C-index, calibration curve, and Kaplan-Meier curve. The AUC value and C index are both greater than 0.7, indicating that the model can predict well [20]. The calibration curves clearly indicated that the projected survival was very consistent with the actual survival, and all AUC values and C-indices in this investigation were more than 0.7, indicating good predictive power. The findings revealed that the nomograms we produced are capable of accurately predicting the survival time of esophageal cancer lung metastases as well as the frequency of esophageal cancer lung metastases. As a result, our research has significant implications for clinical decision-making.
Age, T stage, pathological type, chemotherapy, radiation, and extrapulmonary metastatic site were identified to be independent predictive variables for esophageal cancer lung metastasis in a recent study by Jida Guo et al. [16]. This is roughly in line with our findings. Despite several limitations, such as the lack of further nomogram building, this is the first study on early detection and prognostic variables for esophageal cancer lung metastasis. As a result, we conducted this investigation based on their findings. Surgery, bone/brain/liver metastases, radiation, and chemotherapy were revealed to be the critical factors impacting whether esophageal cancer develops lung metastases, with surgery being the most important factor affecting the occurrence of lung metastases in esophageal cancer. However, because surgery alone has a high recurrence rate, chemotherapy or chemoradiotherapy is typically used as an adjuvant to surgery [21], which is consistent with the findings of this study. Chemotherapy, liver metastases, bone metastases, and radiation were also discovered to be the critical factors affecting the prognosis of esophageal cancer lung metastases. Previous research has also identified chemotherapy as a crucial determinant impacting the prognosis of distant metastasis in esophageal cancer [14], and some clinical studies have also found that palliative chemotherapy can improve esophageal cancer patients' survival time and quality of life [22, 23]. The current treatment approaches for patients with esophageal cancer distant metastases include primarily radiotherapy, chemotherapy, or chemoradiotherapy [24], which is compatible with our findings.
Radiotherapy, chemotherapy, bone metastases and liver metastases were found to be independent prognostic variables for esophageal cancer lung metastases in multivariate cox regression analysis. Surprisingly, brain metastasis (P=0.09) and surgery (P=0.527) were not found to be independent predictive variables for esophageal cancer lung metastases. This finding could be related to selection bias, as well as a low rate of brain metastases (6.7%, n=18) and surgery (3.3%, n=9). Despite this, the nomogram produced in this study demonstrated good predictive ability in both the training and validation cohorts, allowing clinicians to make better clinical decisions and allocate medical resources more efficiently.
Few studies have employed PSM in the previous decade to indicate differences in survival between esophageal cancer patients with LM and those without LM, based on the information we have. PSM, a commonly used statistical analysis method, can reduce confounding bias caused by variable correlation and eliminate the potential influence of other variables [25]. We used PSM to balance other variables for patients with and without lung metastases and discovered that the median survival time of the control group was strikingly reduced after PSM (18 vs 8 months). Patients with esophageal cancer lung metastases remained shorter than those without lung metastases in the post-PSM cohort (Figure 2). The median OS for esophageal cancer patients with lung metastases is only 5 months, demonstrating the importance of this research.
However, there are several limitations to this research. For starters, it's due to the SEER database itself. Despite the large number of cases in the SEER database, it does not cover the whole American population. Selection bias is unavoidable in the data screening process due to inadequate information in specific areas, such as whether there is liver, lung, bone, or brain metastases. We are unable to undertake a more in-depth analysis since the SEER database lacks information on the progression of esophageal cancer lung metastases, as well as the size and location of metastases. Second, we are unable to do external validation of these two nomograms based on our current data. Third, prospective studies and randomized controlled trials should be used to confirm the nomograms we created.
Conclusion
The survival time of esophageal cancer patients with lung metastasis was found to be significantly shorter than that of those without lung metastasis, as demonstrated both before and after propensity score matching. Additionally, our study revealed that the risk of esophageal cancer lung metastases can be accurately predicted using a nomogram incorporating various clinical variables. Looking forward, the implications of our findings extend to the clinical setting, particularly in assisting clinicians in making informed treatment decisions for esophageal cancer patients. The predictive model developed in this study serves as a valuable tool in clinical decision-making by providing decision support for treatment planning. Based on the model's results, clinicians can more accurately assess whether patients require surgery, radiotherapy, chemotherapy, or combined therapies, and determine the priority and duration of each treatment modality.
In addition, personalized treatment plans derived from predictive models can provide patients with tailored treatments. For high-risk patients, more aggressive treatment strategies can be chosen, while low-risk patients can benefit from a more conservative treatment approach. This personalized approach not only maximizes treatment efficacy, but also minimizes unwanted side effects and ultimately improves patients' quality of life. Our study highlights the importance of integrating predictive models into clinical practice to optimize treatment decisions for patients with esophageal cancer. Using these models, clinicians can provide more precise and personalized treatment, thereby improving patient outcomes and advancing the field of oncology.
Despite the progress made in this study in exploring predictive models for esophageal cancer lung metastasis, there are still some limitations to consider. First, limitations of the SEER database include incomplete coverage and possible selection bias in data screening. Second, the lack of external validation makes the generalization ability of the two proposed nomograms has not been verified. In addition, further in-depth analyses are limited by the lack of detailed information on tumor metastatic progression in the data. Future prospective studies and randomized controlled trials will be necessary to verify the validity of the model. Nonetheless, this study remains important for clinical decision-making and patient management and provides a useful reference direction for future research.
Acknowledgements
The authors would like to thank the participants of this study for their great contribution to this paper. Special thanks to Director Ma Minjie Ma Xiaoli, Head Nurse for her guidance and help in my study. We thank the Department of Thoracic Surgery of the First Hospital of Lanzhou University for providing resources and platforms.
Funding
Supported by Natural Science Foundation of Gansu Province (23JRRA1597), Natural Science Foundation of Gansu Province (21JR1RA118) and Gansu Provincial Youth Science and Technology Fund (21JR1RA107, 18JR3RA305).
Data acquisition
The datasets used and/or analysed during the current study available from the corresponding author on reasonable request.
Author contributions
Wenhui He, Minjie Ma, and Xiaoli Ma made significant contributions to the conception and design; Wenhui He, Youzhen Yu, Ziting Yan, Na Luo, Wenwen Yang, Flip Li, Hongying Jin, and Yimei Zhang made significant contributions to data collection, analysis, and interpretation. All authors made significant contributions to the drafting, revision and final approval of the manuscript for publication. All authors agree to take responsibility for all aspects of the work and to ensure its accuracy and completeness.
Competing Interests
The authors have declared that no competing interest exists.
References
1. Sung H, Ferlay J, Siegel RL, Laversanne M, Soerjomataram I, Jemal A. et al. Global Cancer Statistics 2020: GLOBOCAN Estimates of Incidence and Mortality Worldwide for 36 Cancers in 185 Countries. CA A Cancer J Clinicians. 2021;71:209-49
2. Arnold M, Soerjomataram I, Ferlay J, Forman D. Global incidence of oesophageal cancer by histological subtype in 2012. Gut. 2015;64:381-7
3. Coleman HG, Xie S-H, Lagergren J. The Epidemiology of Esophageal Adenocarcinoma. Gastroenterology. 2018;154:390-405
4. Rubenstein JH, Shaheen NJ. Epidemiology, Diagnosis, and Management of Esophageal Adenocarcinoma. Gastroenterology. 2015;149:302-317.e1
5. Enzinger PC, Mayer RJ. Esophageal Cancer. N Engl J Med. 2003;349:2241-52
6. Tanaka T, Fujita H, Matono S, Nagano T, Nishimura K, Murata K. et al. Outcomes of multimodality therapy for stage IVB esophageal cancer with distant organ metastasis (M1-Org): Esophageal cancer with organ metastasis. Diseases of the Esophagus. 2010;23:646-51
7. Wu S-G, Xie W-H, Zhang Z-Q, Sun J-Y, Li F-Y, Lin H-X. et al. Surgery Combined with Radiotherapy Improved Survival in Metastatic Esophageal Cancer in a Surveillance Epidemiology and End Results Population-based Study. Sci Rep. 2016;6:28280
8. Bar-Shalom R, Guralnik L, Tsalic M, Leiderman M, Frenkel A, Gaitini D. et al. The additional value of PET/CT over PET in FDG imaging of oesophageal cancer. Eur J Nucl Med Mol Imaging. 2005;32:918-24
9. Miyazaki T, Sohda M, Higuchi T, Tanaka N, Suzuki S, Sakai M. et al. Effectiveness of FDG-PET in screening of synchronous cancer of other organs in patients with esophageal cancer. Anticancer Res. 2014;34:283-7
10. Blom RLGM, Schreurs WMJ, Belgers HJ, Oostenbrug LE, Vliegen RFA, Sosef MN. The value of post-neoadjuvant therapy PET-CT in the detection of interval metastases in esophageal carcinoma. European Journal of Surgical Oncology (EJSO). 2011;37:774-8
11. Mariette C, Balon J, Piessen G, Fabre S, Van Seuningen I, Triboulet J. Pattern of recurrence following complete resection of esophageal carcinoma and factors predictive of recurrent disease. Cancer. 2003;97:1616-23
12. D'Journo XB. Clinical implication of the innovations of the 8th edition of the TNM classification for esophageal and esophago-gastric cancer. J Thorac Dis. 2018;10:S2671-81
13. Ai D, Zhu H, Ren W, Chen Y, Liu Q, Deng J. et al. Patterns of distant organ metastases in esophageal cancer: a population-based study. J Thorac Dis. 2017;9:3023-30
14. Tang X, Zhou X, Li Y, Tian X, Wang Y, Huang M. et al. A Novel Nomogram and Risk Classification System Predicting the Cancer-Specific Survival of Patients with Initially Diagnosed Metastatic Esophageal Cancer: A SEER-Based Study. Ann Surg Oncol. 2019;26:321-8
15. Cheng S, Yang L, Dai X, Wang J, Han X. The risk and prognostic factors for brain metastases in esophageal cancer patients: an analysis of the SEER database. BMC Cancer. 2021;21:1057
16. Guo J, Zhang S, Li H, Hassan MOO, Lu T, Zhao J. et al. Lung Metastases in Newly Diagnosed Esophageal Cancer: A Population-Based Study. Front Oncol. 2021;11:603953
17. Camp RL, Dolled-Filhart M, Rimm DL. X-tile: a new bio-informatics tool for biomarker assessment and outcome-based cut-point optimization. Clin Cancer Res. 2004;10:7252-9
18. Madani A, Spicer J, Alcindor T, David M, Vanhuyse M, Asselah J. et al. Clinical Significance of Incidental Pulmonary Nodules in Esophageal Cancer Patients. Journal of Gastrointestinal Surgery. 2014;18:226-33
19. Liu M, Wang C, Gao L, Lv C, Cai X. A nomogram to predict long-time survival for patients with M1 diseases of esophageal cancer. J Cancer. 2018;9:3986-90
20. Nie Z, Zhao P, Shang Y, Sun B. Nomograms to predict the prognosis in locally advanced oral squamous cell carcinoma after curative resection. BMC Cancer. 2021;21:372
21. Smyth EC, Lagergren J, Fitzgerald RC, Lordick F, Shah MA, Lagergren P. et al. Oesophageal cancer. Nat Rev Dis Primers. 2017;3:17048
22. Albertsson M, Johansson B, Friesland S, Kadar L, Letocha H, Frykholm G. et al. Phase II studies on docetaxel alone every third week, or weekly in combination with gemcitabine in patients with primary locally advanced, metastatic, or recurrent esophageal cancer. Med Oncol. 2007;24:407-12
23. Al-Batran S, Ajani JA. Impact of chemotherapy on quality of life in patients with metastatic esophagogastric cancer. Cancer. 2010;116:2511-8
24. Lordick F, Mariette C, Haustermans K, Obermannová R, Arnold D. Oesophageal cancer: ESMO Clinical Practice Guidelines for diagnosis, treatment and follow-up. Annals of Oncology. 2016;27:50-7
25. Abe M, Furuichi Y, Takeuchi H, Yoshimasu Y, Itoi T. Prognostic and recurrence factors after endoscopic injection sclerotherapy for esophageal varices. Digestive Endoscopy. 2022;34:367-78
Author contact
![]() Corresponding author: Minjie Ma, PhD, Professor, Department of Thoracic Surgery, The First Hospital of Lanzhou University, Donggang West Road, Chengguan District, Lanzhou, Gansu 730000, People's Republic of China. Email: maminjie24com.
Corresponding author: Minjie Ma, PhD, Professor, Department of Thoracic Surgery, The First Hospital of Lanzhou University, Donggang West Road, Chengguan District, Lanzhou, Gansu 730000, People's Republic of China. Email: maminjie24com.