Impact Factor ISSN: 1837-9664

 Global reach, higher impact
J Cancer 2023; 14(18):3457-3476. doi:10.7150/jca.87223 This issue Cite
Research Paper
Identification of A Novel Gene Signature Combining Ferroptosis- and Immunity-Related Genes for Prognostic Prediction, Immunotherapy and Potential Therapeutic Targets in Gastric Cancer
Liwei Wang1,2#, Zhuozhuo Li1,2#, Zi Li1,2, Yuanyuan Ren1,2, Lu Qian1,3, Yi Yu2, Wenzhen Shi1,4 ![]() , Yuyan Xiong1,2
, Yuyan Xiong1,2 ![]()
1. Xi'an Key Laboratory of Cardiovascular and Cerebrovascular Diseases, Xi'an No.3 Hospital, the Affiliated Hospital of Northwest University, Xi'an, Shaanxi, P.R. China.
2. Key Laboratory of Resource Biology and Biotechnology in Western China, Ministry of Education, School of Medicine, Northwest University, Xi'an, Shaanxi, P.R. China.
3. Department of Endocrinology, Xi'an No.3 Hospital, the Affiliated Hospital of Northwest University, Xi'an, Shaanxi, P.R. China.
4. Medical Research Center, Xi'an No.3 Hospital, the Affiliated Hospital of Northwest University, Xi'an, Shaanxi, P.R. China.
#These authors contributed equally: Liwei Wang, Zhuozhuo Li.
Received 2023-6-16; Accepted 2023-9-17; Published 2023-10-16
Abstract

Gastric cancer (GC) is one of the most prevalent cancers worldwide. Ferroptosis and the immune status of tumor tissue play vital roles in the initiation and progression of GC. However, the role and functional mechanisms of ferroptosis- and immunity-related genes (FIRGs) in GC pathogenesis and their correlations with GC prognosis have not been elucidated. We aim to establish a prognostic prediction model based on the FIRGs signature for GC patients. Differentially expressed genes were screened from the Cancer Genome Atlas (TCGA) GC cohorts. The least absolute shrinkage and selection operator (LASSO) regression was performed to establish a FIRGs-based risk model. This gene signature with 7 FIRGs was identified as an independent prognostic factor. A nomogram incorporating clinical parameters and the FIRG signature was constructed to individualize outcome predictions. Finally, we provided in vivo and in vitro evidence to verify the reliability of FIRG signature for GC prognosis, and validate the expression and function of FIRGs contributing to the development and progression of GC. Herein, our work represents great therapeutic and prognostic potentials for GC.
Keywords: Gastric cancer, ferroptosis, immunity, prognosis, risk model
Introduction
Gastric cancer (GC) is one of the most common cancers worldwide with a poor prognosis [1, 2]. Around 1.1 million new cases and 769,000 deaths of GC were estimated by the World Health Organization (WHO) in 2020. Traditional prognostic approaches, such as histopathological diagnosis and tumor staging systems, cannot accurately predict the prognosis of GC patients. We still need to explore alternative approaches to predict the prognosis of patients with GC, and guide clinical management for GC treatment. Thus, developing a method for accurately stratifying risk and new biomarkers for GC patients is essential.
Ferroptosis, a newly discovered iron-dependent form of programmed but non-apoptotic cell death, is caused by excessive iron accumulation, lipid peroxidation, and the destruction of intracellular redox balance [3]. More recently, a growing body of research has demonstrated that ferroptosis plays a critical role in a wide range of illnesses, particularly cancer [4, 5]. Ferroptosis as a vital feature of tumor biology may offer novel strategies for cancer diagnosis and therapy [6]. Moreover, ferroptosis is acknowledged as a type of immunogenic cell death (ICD), suggesting that it may cause an innate or adaptive immunological response [7]. Recently, researchers revealed the direct crosstalk between the immune system and ferroptosis [7]. Clinically, ferroptosis is considered to be a promising target for cancer immunotherapy. Wang et al. reported that immunotherapy-activated CD8+ T cells increase tumor cell lipid peroxidation and sensitize tumors to ferroptosis [8]. Recently, it has been revealed that anti-PD-1/PD-L1 therapy resistance is attributed to the suppression of innate immunity and tumoral ferroptosis [9]. Therefore, investigating the roles of ferroptosis- and immunity-related genes (FIRGs) in GC may open up an avenue for the discovery of novel therapeutic strategies of GC resistance.
In this study, we identified prognosis-related ferroptosis and immune genes from the Cancer Genome Atlas (TCGA) stomach adenocarcinoma (STAD) cohorts, one of the most common histological subtypes of primary GC. A FIRG signature was established, and its prognostic value was validated in GC patients. We also constructed a nomogram based on the integration of the FIRG signature to predict individual overall survival (OS). Furthermore, we analyzed and discussed the immune status of subgroups with different scores identified by this model. Herein, this study suggests that the FIRG is a reliable gene signature for predicting prognosis in patients with GC and may benefit the understanding of GC pathogenesis and the exploration of novel targets for GC therapy.
Materials and methods
Acquisition of related genes
Ferroptosis-related and immunity-related genes were collected from the GeneCards (https://www.genecards.org/) database [10], which provides comprehensive information on human genes. The term “ferroptosis” was used as the keyword for the search, and genes with relevance scores >1 were taken. In the same way, immunity-related genes were acquired.
Collection of datasets
The RNA-seq data and clinical characteristics of the TCGA STAD cohorts were obtained from the TCGA website (https://portal.gdc.cancer.gov/) for training. The large-scale genome sequencing was performed before treatment in those patients, as TCGA focuses on untreated primary cancers [11]. Participants without detailed expression and clinical data or with 0-day follow-up duration were excluded [12]. According to these criteria, 348 STAD and 32 normal samples were obtained and selected for the training cohorts. For the validation datasets, we downloaded the expression matrices and platforms of the GSE84437 (GPL6947), GSE62254 (GPL570), and GSE15459 (GPL570) from the GEO website (https://www.ncbi.nlm.nih.gov/geo/). Log2 transformation and normalization were employed for the expression profiles. The average expression level was retained for duplicate genes. The ComBat function of the sva package (https://bioconductor.org/packages/release/bioc/html/sva.html) in R software 4.2.1 (https://www.r-project.org/) was applied to remove the batch effects. The detailed clinic parameters were listed in Supplementary Table 1.
Differential expression analysis
Differential expression analysis of genes between TCGA STAD and normal stomach tissue was conducted by the edgeR package (https://bioconductor.org/packages/release/bioc/html/edgeR.html) and visualized as volcano plots. P value (p) <0.05 and |fold change (FC)|>1 would be considered statistically significant for identifying differentially expressed genes (DEGs) [13]. The intersection of the DEGs, ferroptosis-related genes, and immune-related genes, as visualized in a Venn diagram, were selected for further analysis.
Construction and validation of the prognostic gene signature
Univariate Cox proportional hazards regression analysis was performed on each FIRG to screen genes significantly associated with OS in the TCGA training set [14, 15]. Next, the LASSO Cox regression method was applied to those identified genes via the R software package glmnet [16, 17]. Based on the optimal lambda value, the candidate genes were selected to construct the model and a risk formula. A prognostic risk score was calculated for each patient using the following equation: risk score = expression level of gene1*y1 + expression level of gene2*y2 + ... + expression level of genex*yx, where y represents the corresponding regression coefficient. The median risk score was considered the cutoff value to categorize TCGA STAD patients into high-risk and low-risk groups. The same formula and cutoff value were applied to three GEO validation datasets for the evaluation of model effectiveness.
Univariate and multivariate Cox proportional hazards regression analyses were performed to test whether the FIRG-based prognostic model was an independent prognostic factor when combined with clinical variables. A Kaplan-Meier (K-M) survival curve was constructed, and the log-rank test was used to assess the survival differences between groups. The sensitivity and specificity of the prognostic performance were examined by ROC curve analysis and visualized via the R package survivalROC [18]. The AUC values indicated discrimination.
Construction and validation of the nomogram
A prognostic nomogram was established to evaluate the survival probability for STAD patients in 1, 3, or 5 years via the rms R package. Age, gender, pathological stage, pathological T stage, pathological N stage, pathological M stage, and risk score were independent parameters. The C-index and calibration curves were used to calculate the discrimination and calibration between the nomogram-predicted value and the true survival.
Gene set enrichment analysis (GSEA)
GSEA was performed using the R package clusterProfiler to determine the related pathways and molecular mechanisms of the high-risk and low-risk groups in the TCGA STAD cohorts [19]. The whole genome of RNA-seq data in TCGA STAD cohorts was gene list and the high-risk and low-risk groups were used as the phenotype labels. The metric for ranking genes parameter was Signal2Noise. The reference gene set was “c2.cp.kegg.v7.5.1.entrez.gmt.” Significant pathway enrichment was identified by the normalized enrichment score (|NES|>1), p<0.05, and false discovery rate (FDR) <0.25 [20].
Functional enrichment analysis
Gene functional analysis is crucial in converting molecular results from high-throughput technologies into biological significance [21, 22]. The clusterProfiler package in R software was used to perform statistical analysis and to visualize the functional profiles of the FIRGs, including Gene Ontology (GO) and Kyoto Encyclopedia of Genes and Genomes (KEGG) pathway enrichment analysis [19]. Adjusted p-value (adj. P) <0.05 was considered the cutoff value for significance.
Assessment of immune cell infiltration and immune microenvironment
ESTIMATE is a method that determines the fractions of stromal and immune cells based on gene expression signatures in tumor samples. It was applied to evaluate the tumor microenvironment (TME) of each patient with STAD, along with stromal score (substrate cells in the tumor tissue), immune score (extent of immune cell infiltration), ESTIMATE score (the summation of stromal and immune scores from individual cases), and tumor purity by the estimate R package [23]. CIBERSORT is an analysis tool to estimate the abundances of member cell types in a mixed cell population based on the expression profiles. This deconvolution algorithm was used to calculate the proportion of 22 immune cells in each patient with STAD [24]. The sum of the 22 immune cell type fractions in each sample was 1. By applying the single-sample gene set enrichment analysis (ssGSEA) method from the R package GSVA [25], we calculated the extent of infiltration of 28 immune cell types according to the expression levels of genes in 28 published gene sets for immune cells [26].
Cell culture
Human gastric cancer cell lines, MGC803 cells and MKN45 cells, were bought from Procell (Wuhan, China), and were cultured in DMEM medium (DMEM; Sigma, USA) supplemented with 10% fetal bovine serum (Gemini, USA), 100 µg/mL streptomycin, and 100 U/mL penicillin at 37 oC in a humidified atmosphere containing 5% CO2. The cell lines used in the study were authenticated by short tandem repeat DNA profiling.
Production and transmission of lentiviruses
To produce lentivirus particles, HEK293T cells were transfected with the empty vector pLKO.1 with targeted shRNA sequences for SPARC, NOX4, GPX3 knockdown, or pLKO.1 with helper plasmid pMD 2.G. GP-Transfer-Mate was utilized as a transfection reagent for low-scale preps at a ratio of 4:3 GP-Transfer-Mate/DNA. Additionally, the ratio of the lentiviral backbone constructs pSPAX2 and pMD2.G was 4:3:1. To eliminate the cells, the viral supernatant was collected 24 and 48 hours after transfection, spun at 1500 rpm for 5 minutes, flash frozen, and stored at 80°C. The MGC803 cells and MKN45 cells were transduced with lentivirus when they were about 80% confluent. MGC803 cells and MKN45 cells were placed in 1.5 ml of media with 250 μL of lentivirus for 24 hours.
Cell proliferation
The experiment was conducted according to the Cell Counting Kit-8 Reagent Kit (Beyotime). Usually, 100 µl of 2000 cells per well for cell proliferation assays and 100 µl of 5000 cells per well for cytotoxicity assays. Add 10 µl of CCK-8 solution per well. Cell proliferation was examined after keeping the cells in a 5% CO2/37°C humidified incubator for 24 h, 48 h, 72 h, and 96 h. The absorbance at 450 nm was measured using a microplate reader.
Transwell assay
For the cell migration assay, the chambers were not coated. The chambers were coated with Matrigel (BD Biosciences) for the cell invasion assay. First, 20,000 cells in 100 μL of medium without serum were added to the upper chamber, while medium containing serum but no cells were added to the lower chamber. The cells were incubated at 37°C for 24 hours. Cells that did not cross the membrane were gently removed with cotton balls, and those that crossed the membrane were fixed with 4% paraformaldehyde and stained with crystal violet for 15 minutes. Under a microscope, stained cells were counted in five randomly selected areas, and the mean value was calculated.
Wound healing migration assay
Cells were cultured in 6-well culture dishes in a complete medium. When the cells reach 70% to 90% confluence, the wound is scraped along the length of the culture dish with a pipette tip (200 μl). Cells were photographed through a microscope, and the size of the wound was measured (s0). After changing the medium to serum-free medium, the cells were cultured in the incubator for 24 h. After 24 h, the size of the wound (s24) was measured and compared with s0.
Statistical analysis
DEGs were screened using the Wilcoxon test. Univariate Cox analysis was performed to screen relevant genes with prognostic values. K-M survival curves were generated and compared between the two groups using the log-rank test. All statistical analyses were performed using R version 4.2.1 (https://www.r-project.org/) and its adequate packages. Statistical significance was set at p < 0.05.
Results
Identification of differentially expressed FIRGs and functional analysis
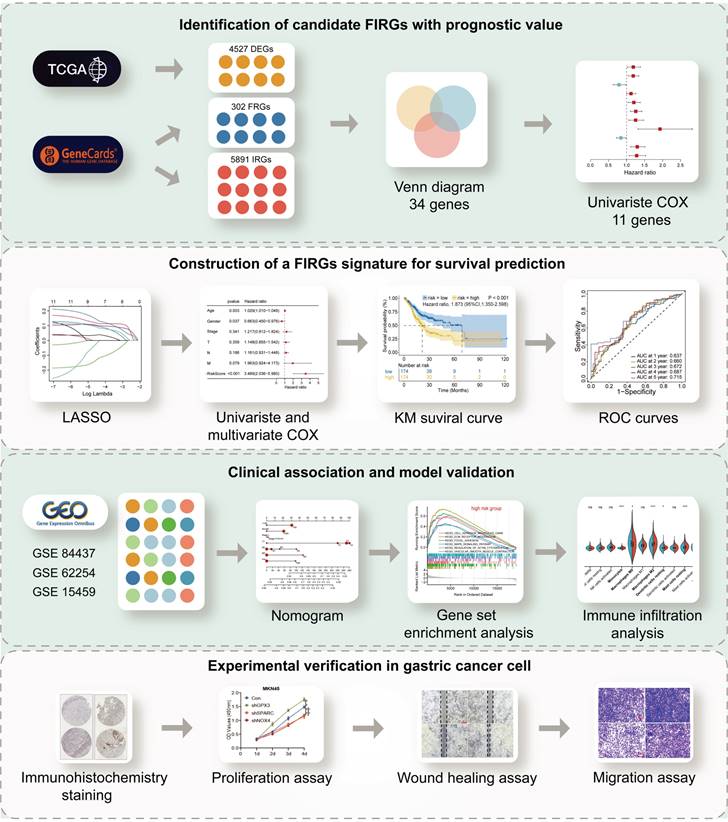
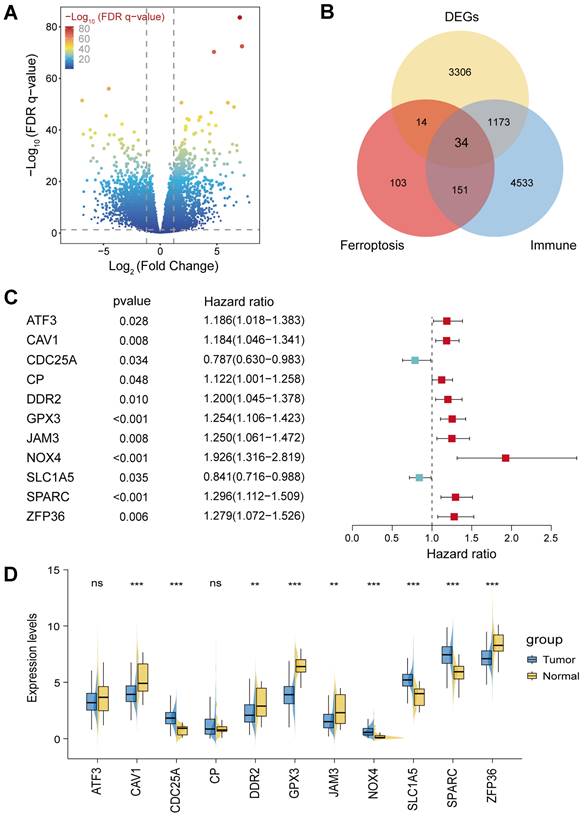
The flowchart of this study was illustrated in Figure 1. STAD cohort data consisting of 348 STAD patients with detailed clinic parameters were retrieved from TCGA (Supplementary Table 1). The K-M survival curves and log-rank test for clinicopathological parameters, including overall stage, tumor (T), node (N), and metastasis (M) were shown in Figure S1A-D. 4527 STAD differentially expressed genes (DEGs) were identified in the TCGA cohorts, of which 2192 genes were upregulated, and 2335 genes were downregulated, as shown in the volcano plot (Figure 2A). To identify the gene set involved in the process of ferroptosis and immune response in Homo sapiens, a total of 302 ferroptosis-related and 5891 immune-related genes with a relevance score of >1, were screened from the GeneCards. The intersection of STAD DEGs, ferroptosis-related genes, and immune-related genes, containing 34 differentially expressed FIRGs, was visualized in a Venn diagram (Figure 2B). These 34 FIRGs were subjected to functional analysis, including GO and KEGG analysis. The KEGG pathway analysis demonstrated that the FIRGs were mainly enriched in signaling pathways of neurodegeneration-multiple diseases, ferroptosis, and advanced glycation end product (AGE)-receptor for AGE (RAGE) signaling pathway in diabetic complications (Figure S2A). As revealed by Gene Ontology, these FIRGs were mainly enriched in the biological processes (BPs) of tissue remodeling, regulation of extracellular matrix disassembly, and tissue homeostasis (Figure S2B), in the cellular component categories (CCs) of early endosome, focal adhesion, and cell-substrate junction (Figure S2C), and in the molecular functions (MFs) of RNA polymerase II-specific DNA-binding transcription factor binding, chaperone binding, and copper ion binding (Figure S2D). The univariate Cox regression analysis was performed to evaluate the prognosis significance of these FIRGs, which indicated that 11 FIRGs were remarkably associated with OS (Figure 2C). Among them, CDC25A and SLC1A5 displayed protective effects against STAD, while the rest genes (ATF3, CAV1, CP, DDR2, GPX3, JAM3, ZFP36, NOX4, and SPARC) were prognostic risk genes for STAD. Furthermore, we analyzed the expression levels of these genes in normal subjects and STAD patients. As shown in Figure 2D, significant downregulation of ATF3, CAV1, DDR2, GPX3, JAM3 and ZFP36, and prominent upregulation of CDC25A, NOX4, SLC1A5, and SPARC were observed in STAD patients.
The flow chart summarizes the scheme performed to construct prognostic gene signatures of stomach adenocarcinoma (STAD)
Identification of differentially expressed ferroptosis- and immunity-related genes (FIRGs) and selection of the FIRGs associated with the survival of TCGA STAD patients. (A and B) Volcano plot (A) of the 4527 DEGs and Venn diagram (B) of the 34 differentially expressed FIRGs in the STAD cohorts of the TCGA database. (C) Forest plot of the univariate Cox regression analysis with the FIRGs. (D) Expression levels of survival-related genes in tumor and normal tissues. For all, ns: not significant, *p<0.05, **p<0.01 and ***p<0.001.
Construction and validation of the FIRGs prognostic risk evaluation model in the TCGA training and GEO cohorts
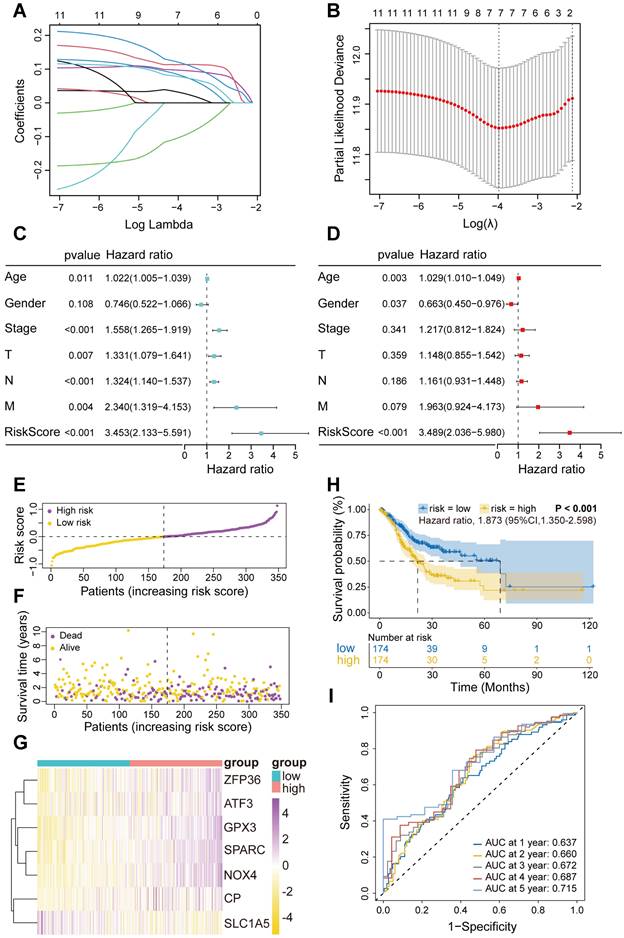
Next, these 11 FIRGs were subjected to LASSO Cox regression analysis to construct a prognostic risk evaluation model in the TCGA training cohort. Coefficients of independent variables in LASSO regression were shown in Figure 3A. Based on the optimal log value of lambda (λ=7), 7 genes (SPARC, NOX4, SLC1A5, GPX3, CP, ZFP36, and ATF3) were identified (Figure 3B). The features of these 7 FIRGs, including biological processes, functions, and corresponding coefficients are described in Supplementary Table 2. GO analysis indicated that they were involved in glucose/energy metabolism (SLC1A5, CP, ATF3), extracellular matrix binding (SPARC), nucleotide binding (NOX4), RNA binding (ZFP36), and transcription factor binding (GPX3), respectively (Supplementary Table 2). Next, based on their mRNA expression levels and the coefficients from LASSO Cox regression analysis, each STAD patient in the TCGA database was assigned a risk score using the following formula: Risk Score = SPARC*0.119965 + NOX4*0.113284 + SLC1A5*(-0.102689) + GPX3*0.096876 + CP*0.083136 + ZFP36*0.077765 + ATF3*0.031323. To evaluate the independent predictive potential of the risk score, we performed univariate and multivariate Cox regression analysis. Univariate Cox regression analysis revealed that the risk score (p<0.001, hazard ratio [HR]=3.453, 95% confidence interval [CI]=2.133-5.591) and clinicopathological parameters, including age (p=0.011, HR=1.022, 95% CI=1.005-1.039), T stage (p=0.007, HR=1.331, 95% CI=1.079-1.641), N stage (p<0.001, HR=1.324, 95% CI=1.140-1.537), M stage (p=0.004, HR=2.340, 95% CI=1.319-4.153), and overall stage (p<0.001, HR=1.558, 95% CI=1.265-1.919), were significantly associated with OS in the TCGA STAD cohorts (Figure 3C). Furthermore, multivariate Cox regression analysis confirmed that the risk score (p<0.001, HR=3.489, 95% CI=2.036-5.980) and age were reliable independent prognostic factors (p<0.05) for predicting the OS of STAD patients in the TCGA database (Figure 3D). According to the median value of risk scores, we subsequently evaluated the prognostic value of this 7-FIRG model. Then, the TCGA training cohort patients were divided into low-risk (174 patients) and high-risk (174 patients) groups. Consistently, high-risk patients showed higher risk scores (Figure 3E) and shorter survival time (Figure 3F), as compared to low-risk individuals. The gene-expression profiles of the prognostic risk genes showed that ZFP36, ATF3, GPX3, SPARC, NOX4, and CP were highly expressed in the high-risk group (Figure 3G). In comparison with the high-risk group, K-M survival analysis revealed a higher survival probability in the low-risk group (p<0.001, HR=1.873, 95% CI=1.350-2.598) (Figure 3H). The receiver operating characteristic (ROC) analysis demonstrated that the area under the ROC curve (AUC) values for the survival probability at 1, 2, 3, 4, and 5 years were 0.637, 0.660, 0.672, 0.687, and 0.715, respectively (Figure 3I). Furthermore, this model was also validated in three different GEO cohorts (GSE84437, GSE62254 and GSE15459), which showed consistent results with the TCGA cohort (Figure S3A-O).
Construction and validation of the FIRGs prognostic risk evaluation model in the TCGA training cohort and the evaluation of its independent prognostic value. (A) LASSO coefficient profiles of the 11 survival-related genes. (B) Cross-validation for tuning parameter (lambda) screening in the LASSO regression model. (C and D) Forest plots of the (C) univariate and (D) multivariate Cox regression analysis in TCGA STAD cohorts. (E and F) The distributions of the risk score, survival time, and status of patients in TCGA STAD training cohorts. (G) Heatmap of the gene-expression profiles of the FIRGs signatures in TCGA STAD training cohorts. (H) Kaplan-Meier curves of the gene signature in TCGA STAD training cohorts. (I) The time-dependent ROC curves of the prognostic gene signature in TCGA STAD training cohorts.
Several prognostic models aimed at predicting survival in STAD patients have been reported in previous studies [27-31]. We compared the predictive performance of the 7-FIRG model obtained in this study with five reported models [27-31]. To ensure uniformity, gene expression levels involved in each model were extracted from the original matrix of the TCGA STAD dataset. Risk scores for STAD patients were calculated based on the corresponding coefficients for each model. Subsequently, we performed a comparative analysis of the ROC curves, our model based on 7 FIRGs exhibited the optimal AUC value (AUC=0.656) when compared to the other models (Figure S4A). Also, decision curve analyses demonstrated that our model achieved greater net benefits for OS probabilities (Figure S4B). Together, these results demonstrate that the risk model based on these 7 FIRGs presents a reliable accuracy for predicting the OS of GC patients.
Construction and validation of the nomogram for OS prediction
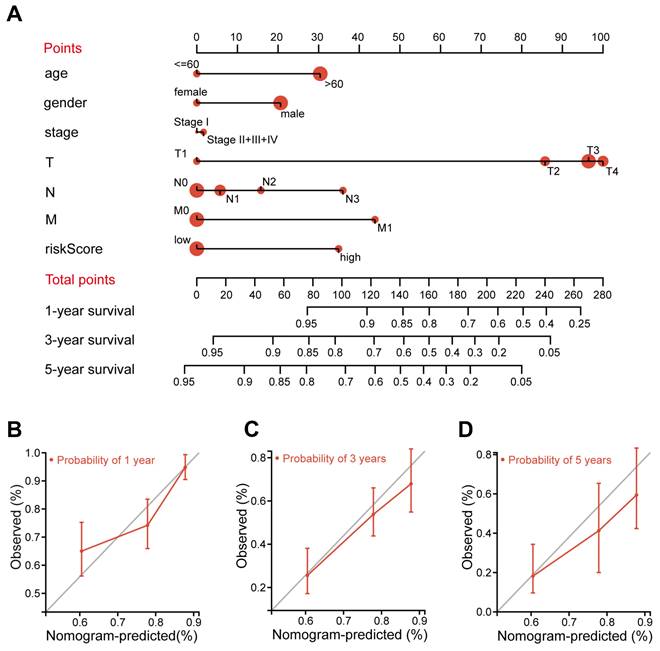
A nomogram is an efficient tool that integrates multiple risk factors for predicting the OS of cancer patients. Here, we established a nomogram for the prediction of 1-year, 3-year, and 5-year OS in the TCGA STAD cohorts (Figure 4A). Seven independent risk factors, including age, gender, stage, T stage, N stage, M stage and the FIRG signature, were included in this model (Figure 4A). The total points of risk factors indicate their corresponding contribution to the survival probability. The concordance index of our nomogram was 0.682 (p<0.0001, 95% CI=0.636-0.729). We observed that the nomogram-predicted OS matched with the actual observed OS at 1-year, 3-year, and 5-year, as shown by the calibration curves (Figure 4B-D), suggesting that this nomograph is accurate and reliable for the prediction of the OS of STAD patients.
Construction and validation of the nomogram for OS prediction in the TCGA training cohort. (A) The nomogram was constructed based on seven independent prognostic factors. (B, C, and D) The calibration plots for the internal validation of the nomogram predicting 1-year (B), 3-year (C), and 5-year (D) OS. The x-axis represents the nomogram predicted survival and the y-axis represents the actual survival.
Exploration of molecular functions and signaling pathways related to FIRGs by GSEA, GO, and KEGG analyses
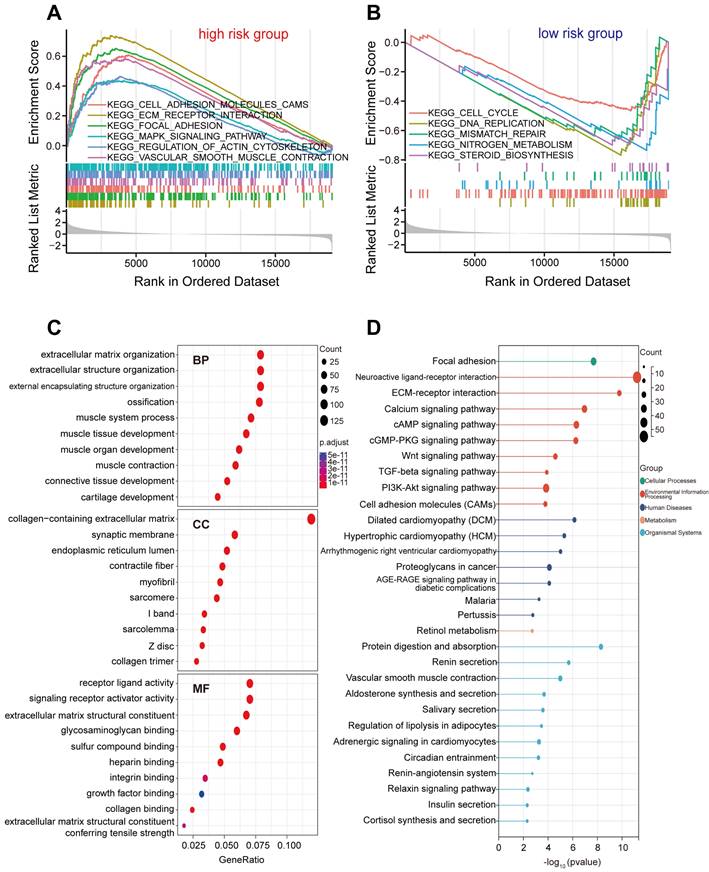
To explore the underlying differences in biological functions related to FIRGs between the high-risk and low-risk groups, GSEA was performed. The details of GSEA results are listed in Supplementary Table 3. Further analysis showed that a total of 36 pathways were significantly enriched in the high-risk group, parts of which were selected and represented, including extracellular matrix (ECM)-receptor interaction (normalized enrichment score [NES]=2.34, p<0.001), focal adhesion (NES=2.20, p<0.001), cell adhesion molecules (CAMs) (NES=2.00, p<0.001), vascular smooth muscle contraction (VSMC) (NES=1.89, p<0.001), regulation of actin cytoskeleton (NES=1.57, p<0.001), mitogen-activated protein kinase (MAPK) signaling pathway (NES=1.49, p<0.001) (Figure 5A). In contrast, 21 pathways were significantly enriched in the low-risk group such as DNA replication (NES=-2.83, p<0.001), nitrogen metabolism (NES=-2.46, p<0.001), cell cycle (NES=-2.20, p<0.001), mismatch repair (NES=-2.18 p<0.001), steroid biosynthesis (NES=-2.15, p<0.001) (Figure 5B). Next, we investigated the differences in biological processes and pathways between the two risk groups based on the FIRG signature. DEGs between the high-risk group and the low-risk group were determined by the cut-off of log2|FC|>1 and FDR<0.05. Then, the annotation GO enrichment analysis and KEGG pathway analysis were performed (p<0.05). The GO enrichment analysis obtained 959 BPs, 134 CCs, and 108 MFs (Supplementary Table 4). The top 10 enriched BPs, CCs, and MFs such as extracellular matrix organization (BPs), collagen-containing extracellular matrix (CCs), and receptor ligand activity (MFs) were presented in Figure 5C. The KEGG pathway analysis obtained 61 enriched pathways (Supplementary Table 5), showing that the DEGs were significantly enriched in the signaling pathways of neuroactive ligand-receptor interaction, ECM-receptor interaction, calcium signaling, cyclic adenosine 3', 5'-monophosphate (cAMP), cyclic guanosine 3', 5'-monophosphate (cGMP)-protein kinase G (cGMP-PKG), transforming growth factor (TGF)-beta (TGF-β), phosphatidylinositol-3-kinase (PI3K)-Akt, and CAMs (Figure 5D).
Biological function and pathway enrichment analysis of high-risk group and low-risk group based on the FIRGs signature. (A) GSEA of the significantly enriched KEGG terms in the high-risk group. (B) GSEA of the significantly enriched KEGG terms in the low-risk group. (C) Go analysis of the DEGs of the two groups. (D) KEGG pathway analysis of the DEGs of the two groups.
Analysis of immune status for STAD patients combined with the prognostic signature
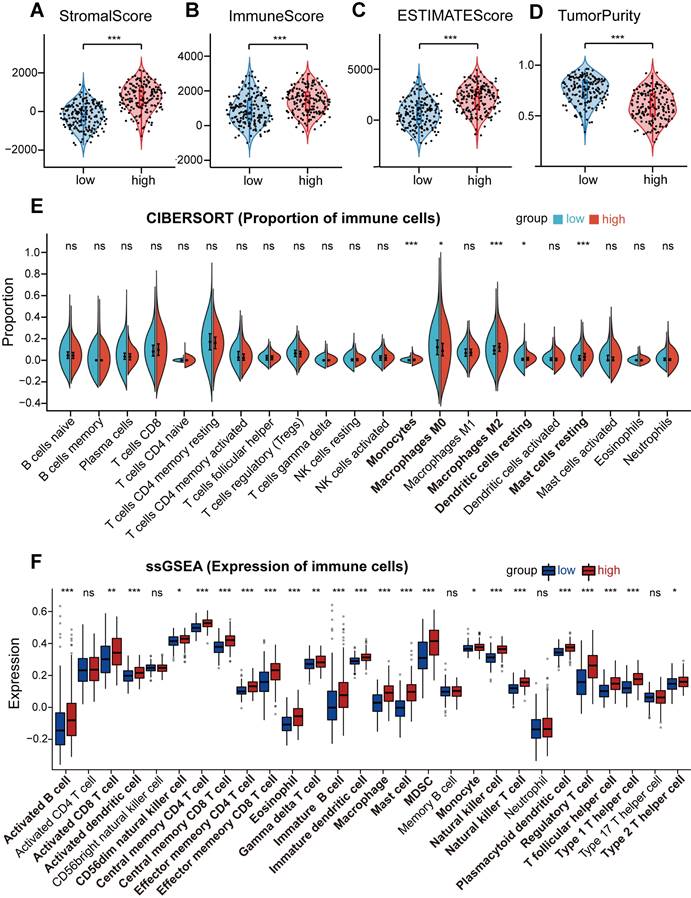
To investigate the relationship between the risk level in STAD patients and immune cell infiltration, ESTIMATE, CIBERSORT, and ssGSEA analysis were employed in low-risk and high-risk groups. ESTIMATE analysis found that the stromal score, immune score, and estimate score were markedly elevated in the high-risk group (Figures 6A-C), while the tumor purity was remarkably decreased (p<0.001) (Figure 6D). Furthermore, we evaluated the proportion of 22 immune cells in the low-risk and high-risk groups using CIBERSORT analysis, which showed a significant increase in infiltration levels of monocytes (p<0.001), macrophages M2 (p<0.001), resting dendritic cells (p<0.05) as well as resting mast cells (p<0.001) in the high-risk group (Figure 6E), suggesting that risk score was positively correlated with the infiltration levels of monocytes, macrophages M2, resting dendritic cells, and resting mast cells in the high-risk group. In addition, ssGSEA analysis demonstrated that the gene expression levels of 23 immune cell subtypes were significantly upregulated in the high-risk group as compared to the low-risk group (Figure 6F). These results indicate that the high-risk group tends to have a stronger immune infiltration than the low-risk group. Next, to figure out whether immune checkpoints were altered between high-risk and low-risk groups, the expression levels of 33 immune checkpoint molecules were investigated. We found that ADORA2A, BTLA, CD200, CD200R1, CD274, CD276, CD28, CD40, CD44, CD48, CD80, CD86, CTLA4, HAVCR2, IDO1, KIR3DL1, LAG3, LAIR1, NRP1, PDCD1, PDCD1LG2, TIGIT, TNFRSF18, TNFSF14, TNFSF18, and TNFSF4 were significantly elevated in high-risk groups, while LGALS3, PVR, and TNFRSF25 were remarkably decreased in high-risk group (Figure S5A-T and S6A-M).
Analysis of immune status for STAD patients combined with the prognostic signature. (A, B, C, and D) Comparison of the stromal score (A), immune score (B), ESTIMATE score (C), and tumor purity (D) between the high-risk group and the low-risk group in TCGA STAD cohorts. (E and F) The boxplots for the comparison of the proportion of the 22 immune cells (E) and the expression of the 28 immune cells (F) between the high-risk and low-risk groups. For all, ns: no significant, *p<0.05, **p<0.01, and ***p<0.001.
Mutations of the prognostic FIRGs in cancer and predictions of the transcription factors (TFs) for the gene signature
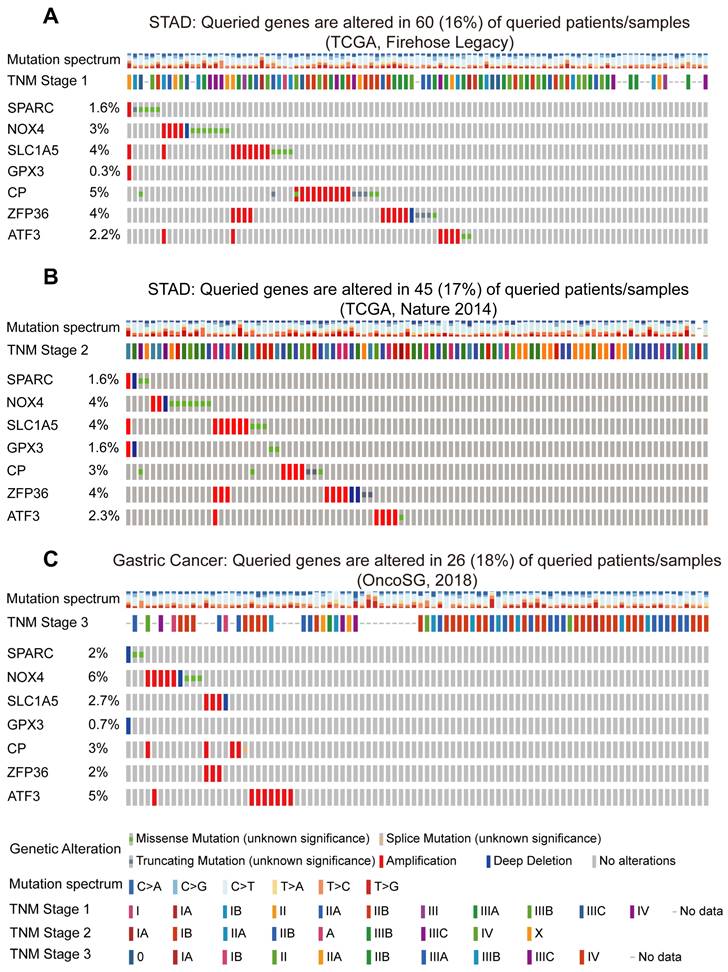
To further validate the strong correlation between the prognostic FIRGs and STAD in diverse cohorts, we examined the genetic alterations of STAD patients in the cBioPortal Cancer Genomics (https://www.cbioportal.org/) database. The Firehose Legacy dataset showed that SPARC, NOX4, SLC1A5, GPX3, CP, ZFP36 and ATF3 are mutated in 60 (16%) of the 369 queried patients (Figure 7A). In the dataset of Nature 2014 for STAD, including 258 patients, FIRGs were altered in 45 (17%) patients (Figure 7B). Consistently, in the OncoSG dataset, 26 (18%) of the 147 queried patients displayed mutations of FIRGs (Figure 7C). Moreover, we also investigated the genetic alterations of these prognostic genes in other four different cancer types, including lung adenocarcinoma (LUAD), liver hepatocellular carcinoma (LIHC), breast invasive carcinoma (BRCA), cervical squamous cell carcinoma and endocervical adenocarcinoma (CESC). Intriguingly, frequent mutations were also observed in LUAD (16%), LIHC (13%), BRCA (15%) patients and CESC (18%) patients in the TCGA cohort (Figure S7A-D). These results demonstrate that the mutations of these FIRGs were strongly associated with the initiation and development of cancer. Additionally, we predicted the transcription factors (TFs) of these FIRGs signatures via the ChEA3 website (https://maayanlab.cloud/chea3/). The top 15 TFs were listed in Supplementary Table 6, of which cysteine and serine-rich nuclear protein 1 (CSRNP1), FosB proto-oncogene, AP-1 transcription factor subunit (FOSB), atonal BHLH transcription factor 8 (ATOH8), fos proto-oncogene, and AP-1 transcription factor subunit (FOS) presented the significant potential as TFs to modulate FIRGs expression. The protein-protein interaction (PPI) network was also constructed by STRING (https://cn.string-db.org/), demonstrating that there are 22 nodes and 40 edges in the PPI network of FIRGs and TFs (Figure S8A-C).
Mutations of the prognostic FIRGs in multiple groups of gastric cancer. Genetic alteration of 7 FIRGs in the Gastric Cancer cohorts (TCGA, Firehose Legacy) (A), (TCGA, Nature 2014) (B), (OncoSG, 2018) (C).
In vivo validation of prognostic genes expression in gastric cancer
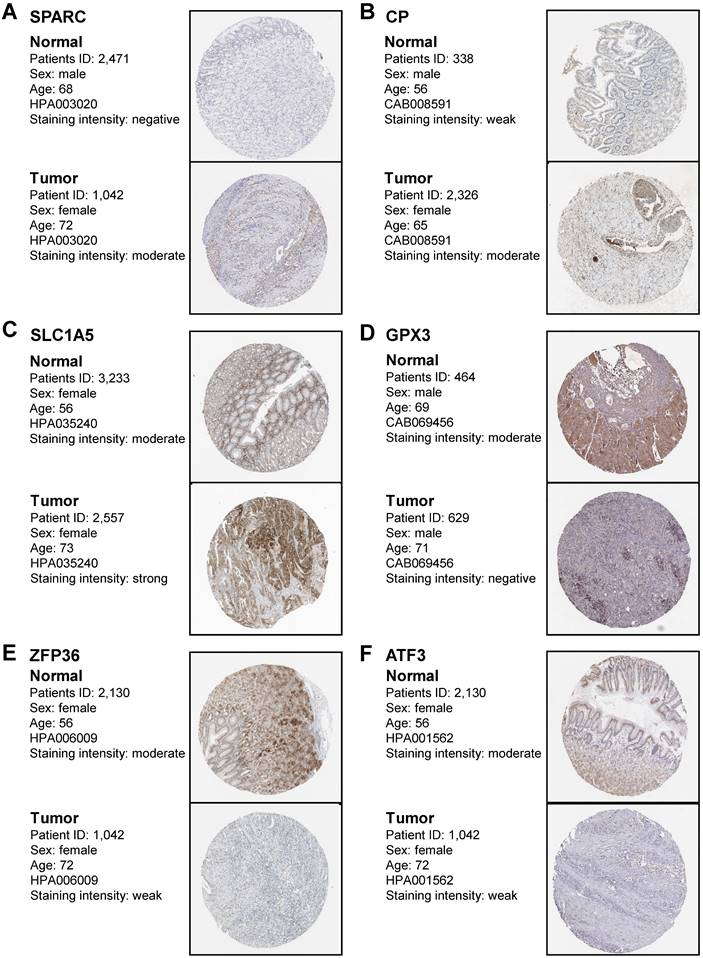
To confirm that the protein expression levels of FIRGs are closely correlated with STAD occurrence, we performed the immunohistochemical analysis in healthy normal individuals and STAD patients. In accordance with the transcriptional levels, immunohistochemistry (IHC) staining obtained from the Human Protein Atlas (HPA) database indicated that the protein expression levels of SPARC, CP, and SLC1A5 were increased, while GPX3, ZFP36 and ATF3 were reduced in gastric tissue as compared to normal group (Figure 8A-F). These results further provided in vivo evidence to validate the reliability of the FIRGs signatures for the prediction of STAD.
Immunohistochemistry staining of the prognostic genes in gastric cancer biopsies. Immunohistochemistry images were obtained from the HPA. The representative IHC image of SPARC protein (A), CP protein (B), SLC1A5 protein (C), GPX3 protein (D), ZFP36 protein (E), and ATF3 protein (F) in normal tissues and gastric cancer tissues. The expression frequency and extent of proteins were defined by staining intensity based on the quantification of the percentage of positively stained cells (none cell indicated as “negative”; <25% positive cells indicated as “weak”; 25%-75% positive cells indicated as “moderate”; >75% positive cells indicated as “strong”).
In vitro validation of the identified prognostic genes in gastric cancer cells
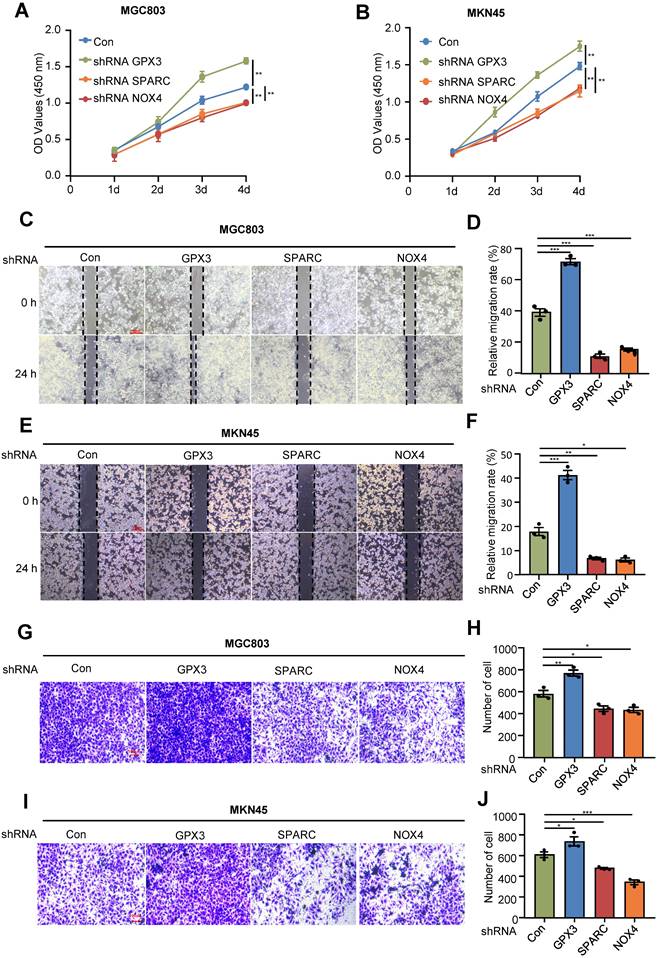
Next, to further validate the roles of FIRGs in the development of gastric cancer, we silenced GPX3, SPARC and NOX4 in gastric cancer cell lines MGC803 and MKN45 to examine the effects on the cell viability, proliferation and migration/invasion. CCK8 and cell wound healing assays showed that GPX3 knockdown significantly enhanced the cell viability and proliferation, while SPARC and NOX4 depletion promoted cell death and reduced cell proliferation capability in MGC803 and MKN45 cell lines (Figure 9A-F). Furthermore, the transwell assay demonstrated that silencing GPX3 markedly induced cell migration/invasion, while SPARC and NOX4 knockdown suppressed the capability of cell migration/invasion in MGC803 and MKN45 cells (Figure 9G-J). These in vitro results confirmed that GPX3 served as a protective gene, and SPARC and NOX4 functioned as risk genes for the progression of STAD, which is in line with the in vivo findings and prognostic risk evaluation.
Analysis of the effects of the prognostic genes in gastric cancer cell lines. Human gastric cancer cell lines, MGC803 and MKN45 cells were transduced with pLKO.1-TRC shRNA as control (Con) or pLKO.1-GPX3, pLKO.1-SPARC, pLKO.1-NOX4 shRNA to silence GPX3, SPARC, NOX4. Proliferation assay (CCK-8) in MGC803 (A) and MKN45 cells (B). Wound healing assay in MGC803 (C) and MKN45 cells (E). (D)(F) Quantification of the signals in (C)(E). Migration assay in MGC803 (G) and MKN45 cells (I). (H)(J) Quantification of the signals in (G)(I). For all, *p<0.05, **p<0.01, ***p<0.001, Student's t-test. The error bars represent the mean ± SD.
Discussion
With the development of bioinformatics and next-generation sequencing technology, numerous aberrantly expressed oncogenes have been identified and could be employed as prognostic signatures in GC [32-35]. Gene signatures based on oncogenes and cell processes, including cell death, metabolism, and immune response, present a variety of advantages in the prognosis prediction of various cancers [36]. Ferroptosis, as a newly discovered cell death type, has been demonstrated to have great potential for overcoming the drug resistance mechanism of traditional cancer treatment [37, 38]. Indeed, ferroptosis plays a pivotal role in tumor suppression via the inhibition of cell proliferation and migration in STAD cells [37, 39]. The immune microenvironment is closely related to the development and progression of STAD [40]. Immunotherapy is a novel treatment for STAD that can re-activate the human cellular immune response against tumors and has achieved multiple satisfactory results [41, 42]. To our knowledge, the prognostic gene signatures based on FIRGs have not yet been investigated in STAD. The bioinformatics analysis of ferroptosis-related genes (FRGs) in the prognosis of GC has been previously investigated [12, 27, 30, 43, 44], whereas our analysis and model with different approaches based on FIRGs present novel findings.
We also performed somatic mutation and transcription factors prediction to validate the reliability of FIRGs signature for the prediction of GC. Additionally, the expression levels of FIRGs were verified by IHC from the HPA database and the roles of FIRGs in the development of GC were further validated by in vitro experiments. In this study, we identified 34 FIRGs in the TCGA STAD training cohorts, 7 of which were significantly associated with the survival probability of STAD patients via Cox univariate analysis and LASSO regression analysis. A new nomogram that integrates multiple risk factors for predicting the OS of STAD patients stratified clinical outcomes in the TCGA cohorts. Immune status analysis indicates that the high-risk STAD group exhibits a stronger immune infiltration than the low-risk group. In this study, we provided in vivo and in vitro evidence to validate the reliability of the FIRG signature for the prediction of STAD. Taken together, this study suggests that the FIRG signature turned out to be a convincible biomarker for prognosis and might be used in the future for survival risk stratification and personalized management in STAD.
Here, 7 FIRGs, including SPARC, NOX4, SLC1A5, GPX3, CP, ZFP36, and ATF3, were identified to construct a prognostic risk evaluation model via the LASSO Cox regression analysis, which demonstrates a novel gene signature as compared to previous studies [12, 27, 30, 43, 44]. Based on the mRNA expression levels of FIRGs and the coefficients of LASSO Cox regression analysis, the risk score for each STAD patient was calculated. Subsequently, we established an evaluation model to validate the prognostic value of these FIRGs. Intriguingly, in the TCGA cohort, high-risk patients showed higher risk scores and shorter survival days as compared to low-risk individuals. K-M survival analysis indicated a higher survival probability and longer survival days in the low-risk group in comparison with the high-risk group. Furthermore, this model showed consistent results with the TCGA cohort in three independent GEO cohorts. Moreover, the genetic alterations of FIRGs in STAD patients from the Firehose Legacy dataset, Nature 2014 dataset, and OncoSG dataset further validate the strong correlation between the prognostic FIRGs and STAD occurrence in diverse cohorts. In addition, a nomogram that integrates age, gender, stage, T stage, N stage, M stage and the FIRG signature for the prediction of 1-year, 3-year and 5-year OS in the TCGA STAD cohorts was also established. The calibration curves of the nomogram showed the predicted OS kept in line with the actual observed OS at 1-year, 3-year, and 5-year, suggesting that this nomograph is accurate and reliable for the prediction of the OS of STAD patients. These results demonstrate that the risk model based on these 7 FIRGs presents a reliable accuracy for predicting the OS of GC patients. Consistently, Song et al. demonstrated that a risk model based on ferroptosis-related genes (FRGs) was also able to accurately predict the prognosis in GC [43]. A ceRNA network based on FRGs in the prognostic model also showed excellent potential in predicting GC prognosis [29]. The identification of the FIRG signature shows clinical implications, as it is significantly related to the outcomes of STAD patients. Gene-targeted therapy is a novel treatment that is effective in some gastric cancer patients with gene mutations. Compared to traditional treatments, patients at high risk might benefit from innovative therapies, such as DNA- and RNA-based therapeutics, whereas those with low-risk gene signatures could temporarily postpone undergoing those methods. The prognostic model may help with patient categorization, enable specific treatment strategies for STAD patients in clinical settings, and eventually be beneficial in lowering mortality.
To elucidate the potential mechanism of FIRGs modulating the pathogenesis of GC, the biological functions and signaling pathways of FIRGs were performed in the high-risk and low-risk groups. GSEA and GO enrichment analysis demonstrated that the FIRGs were involved in the mediation of ECM, CAMs, actin cytoskeleton, and MAPK in the high-risk group. Whereas, in the low-risk group, FIRGs modulated the cell cycle, DNA replication, mismatch repair, nitrogen metabolism, and steroid biosynthesis. These results suggest that FIRGs exert different functions in the normal and neoplastic gastric tissues. KEGG enrichment analysis showed that DEGs were mainly enriched in the signaling pathways of ECM-receptor interaction, calcium signaling, CAMs, cGMP-PKG, TGF-β, and PI3K-Akt. ECM, a dynamic and organized tissue structure, has been revealed to be an accomplice in promoting the development and progression of GC via the regulation of ferroptosis [45, 46]. CAMs also have been implicated in the development and progression of GC [47]. It's well-accepted that cell adhesion molecules, including receptors of the immunoglobulin superfamily and integrins, trigger tumor growth and metastases via mediating the immune cell-mediated inflammation, immune cell infiltration, immune responses as well as tumor immune microenvironment [48]. Actin cytoskeleton also contributes to the development and metastasis of GC through actin cytoskeleton dynamic rearrangement [49]. Studies of actin-related primary immunodeficiencies have revealed that the actin cytoskeleton plays a crucial role in the regulation of immune system function, including immune cells proliferation, differentiation, recruitment, migration, intracellular signaling transduction, and activation of both innate and adaptive immune responses [50]. However, whether cell adhesion molecules and actin cytoskeleton contribute to GC development still requires further investigation. Concerning MAPK, a large body of studies has demonstrated that it is involved in GC proliferation, invasion, migration, and metastasis by mediating ferroptosis processes and the immune system through the complex signaling pathways [51-53]. Also, cGMP-PKG, TGF-β and PI3K-Akt have been implicated with the modulation of ferroptosis and immunity, which contributes to the development of GC [54-57]. Mechanistically, these results disclose that FIRGs may contribute to the pathogenesis of GC by regulating ferroptosis and the immune system through enriched pathways. Additionally, we predicted the TFs of the FIRG signature via the ChEA3, and found that CSRNP1, FOSB, ATOH8 and FOS were TF candidates to modulate FIRGs expression. The PPI network was also constructed by STRING, demonstrating that there are 22 edges and 40 nodes in the PPI network of FIRGs and TFs.
Immunotherapy is revolutionizing cancer therapy, and emerging evidence has clarified that targeting our immune system presents great efficacy for protecting against cancer [58]. The TME comprises various types of cells, such as immune cells, fibroblasts, myofibroblasts, neuroendocrine cells, and stromal cells [59]. Immune cells infiltrating into TME to interact with other immune cells remarkably contribute to the development, progression and malignancy of GC [60]. To explore the roles of immune cell infiltration and ferroptosis in GC, ESTIMATE, CIBERSORT, and ssGSEA analysis were employed in low-risk and high-risk groups. Compared with the low-risk group, GC patients in the high-risk group had higher ESTIMATE score, stromal score and immune score, while the tumor purity was significantly reduced. The increase of infiltrated immune cells accompanies stroma activation, which could prevent the entry of T cells from the tumor parenchyma to the peritumoral stroma [61], thereby causing a poor prognosis in the high-risk group [62]. Furthermore, we found a significant increase in infiltration levels of monocytes, macrophages M2, resting dendritic cells as well as resting mast cells in the high-risk group evaluated by CIBERSORT analysis. Tumor-associated macrophages of the M2 phenotype have been found to promote tumor proliferation and metastasis and to be associated with a poor prognosis in GC patients [63, 64]. Besides, ssGSEA analysis demonstrated that the gene expression levels of immune cells were significantly upregulated in the high-risk group as compared to the low-risk group. These results prompt us to speculate that the elevated infiltrated immune cells in TEM accelerate the GC progression, in turn causing the poor prognosis in the high-risk group. As abnormal TME induces immunosuppression to compromise cancer immunotherapy, identifying the immune cells in the TME may be beneficial to predict immunotherapy responses and improve antitumor activity [65]. The immune checkpoints expressed on tumor cells protect cancer cells from damage by local immune responses [66]. In GC, it is still unclear how many immune checkpoints are expressed and whether they are useful for predicting the prognosis of GC patients. In comparison with previous investigations [12, 27, 30, 43, 44], for the first time, we found that the expression levels of 26 immune checkpoint molecules (ADORA2A, BTLA, CD200, CD200R1, CD274, CD276, CD28, CD40, CD44, CD48, CD80, CD86, CTLA4, HAVCR2, IDO1, KIR3DL1, LAG3, LAIR1, NRP1, PDCD1, PDCD1LG2, TIGIT, TNFRSF18, TNFSF14, TNFSF18, and TNFSF4) were significantly elevated in the high-risk groups. Among them, the roles of CD274, CD276, CD28, CD44, CD48, CD86, HAVCR2, KIR3DL1, LAIR1, TNFSF14, and TNFSF4 in modulating GC have not been elucidated, which still awaits further intensive investigations.
Finally, our experimental work revealed that the silence of SPARC and NOX4 inhibited GC migration and proliferation, whereas silencing GPX3 promoted GC migration and proliferation, which is in accordance with the previous studies. For instance, a higher expression level of the SPARC mRNA was observed in cancer tissue as compared to adjacent normal mucosa [67]. The 3- and 5-year survival of patients with lower expression of SPARC was significantly better than those with a higher expression [67, 68]. Therefore, SPARC is associated with GC progression and poor survival of patients, which could be useful markers to predict tumor progression [69]. Whereas, the role of SPARC in the regulation of ferroptosis still remains elusive. Nicotinamide adenine dinucleotide phosphate (NADPH) oxidase 4 (NOX4), a subunit of the NOX complex, has been demonstrated to drive reactive oxygen species generation, in turn contributing to cell proliferation and apoptosis of gastric cancer cells via activation of the GLI1 pathway [70]. A study showed that NOX4 expression strongly correlated with tumor size, lymphatic metastasis, vascular invasion and a poor prognosis in GC patients, and suppressed cancer-associated fibroblasts-mediated immunotherapy [71]. In Alzheimer's disease, NOX4 promotes the ferroptosis of astrocytes by oxidative stress-induced lipid peroxidation via the impairment of mitochondrial metabolism [72]. SLC1A5, a suppressor gene against ferroptosis, was found to be upregulated in GC cell lines [73]. Knockdown of SLC1A5 in GCs suppressed cell proliferation, invasion as well as migration partly through the inactivated mTOR/p-70S6K1 signaling pathway in vitro [74]. CP can induce human GC apoptosis via activation of the ERK1/2 signaling pathway [75]. Furthermore, the inhibition of CP loop can promote ferroptosis and radiosensitivity by disrupting Cu-Fe homeostasis, demonstrating that CP may be a new target and treatment strategy for overcoming tumor radioresistance [76]. GPX3 has been reported to inhibit GC migration and invasion by targeting NFкB/Wnt5a/JNK signaling [77]. Accordingly, GPX3 is required for the tumor-polarized immunosuppressive function of AT2 cells [78]. ATF3, a common stress sensor, can inhibit GC proliferation, colony formation, cell migration and invasion and tumorigenesis in a mouse xenograft model [79]. Moreover, ATF3 can sensitize GC cells to cisplatin by induction of ferroptosis via blocking Nrf2/Keap1/xCT signaling, supporting a promising therapeutic approach for overcoming chemoresistance in GC [80]. The gene ZFP36 also shows tumor-specific functions, but its biological roles in GC remain largely unknown. A study reported that ZFP36 is correlated with the impairment of erastin- or sorafenib-induced HSC ferroptosis [81]. Moreover, ZFP36 RBPs play a critical role in restraining T cell expansion and effector functions, and suggest ZFP36 inhibition as a strategy to enhance immune-based therapies [82]. Taken together, these results strongly support the notion that the identified FIRGs can predict the development and progression of GC.
Conclusion
In summary, we identified a reliable prognostic FIRG signature based on the analysis of ferroptosis- and immunity-related genes in different training cohorts. The risk model based on FIRGs is reliable and accurate in predicting the prognosis of GC. This study may provide new insights into the molecular mechanism of how ferroptosis and immunity contribute to the pathogenesis and prognosis of GC, and may uncover novel prognostic strategies and therapeutical targets for GC therapy.
Abbreviations
GC: Gastric cancer; FIRGs: ferroptosis- and immunity-related genes; STAD: stomach adenocarcinoma; TCGA: The Cancer Genome Atlas; LASSO: least absolute shrinkage and selection operator; ICD: immunogenic cell death; OS: overall survival; GO: Gene Ontology; KEGG: Kyoto Encyclopedia of Genes and Genomes; TME: tumor microenvironment; ssGSEA: single-sample gene set enrichment analysis; K-M: Kaplan-Meier; DEGs: differentially expressed genes; AGE: advanced glycation end product; RAGE: receptor for AGE; BPs: biological processes; CCs: component categories; MFs: molecular functions; ROC: receiver operating characteristic; AUC: area under the ROC curve; ECM: extracellular matrix; CAMs: cell adhesion molecules; VSMC: vascular smooth muscle contraction; MAPK: mitogen-activated protein kinase; cAMP: cyclic adenosine 3', 5'-monophosphate; cGMP: cyclic guanosine 3', 5' -monophosphate; cGMP-PKG: cGMP-protein kinase G; TGF-β: transforming growth factor-beta; PI3K: phosphatidylinositol-3-kinase; CAMs: cell adhesion molecules; LUAD: lung adenocarcinoma; LIHC: liver hepatocellular carcinoma; BRCA: breast invasive carcinoma; CESC: endocervical adenocarcinoma; TFs: transcription factors; CSRNP1: cysteine and serine-rich nuclear protein 1; IHC: immunohistochemistry; HPA: Human Protein Atlas; FRGs: ferroptosis-related genes.
Supplementary Material
Supplementary figures and tables.
Acknowledgements
Funding
This manuscript was funded by the National Natural Science Foundation of China (grant no. 82103589 and 82104155), Natural Science Foundation of Shaanxi Province (grant no. 2023-JC-YB-705), Key Research and Development Program of Shaanxi (grant no. 2020ZDLSF04-03 and 2021SF-096), Xi'an Science and Technology Planning Project (grant no. 21YXYY0038).
Author Contributions
Liwei Wang wrote the first version of the article, acquired data, analyzed the data and plotted the pictures; Zhuozhuo Li contributed to the investigation and study design; Zi Li and Yuanyuan Ren conducted the experiments and data analysis; Lu Qian and Yi Yu contributed to Writing-review & editing; Wenzhen Shi and Yuyan Xiong contributed to conceptualization, study design, methodology, and manuscript writing. All authors reviewed the manuscript.
Competing Interests
The authors have declared that no competing interest exists.
References
1. Joshi SS, Badgwell BD. Current treatment and recent progress in gastric cancer. Ca-Cancer J Clin. 2021;71:264-79
2. Lin Y, Zheng Y, Wang HL, Wu J. Global Patterns and Trends in Gastric Cancer Incidence Rates (1988-2012) and Predictions to 2030. Gastroenterology. 2021;161:116-27 e8
3. Angeli JPF, Krysko DV, Conrad M. Ferroptosis at the crossroads of cancer-acquired drug resistance and immune evasion. Nat Rev Cancer. 2019;19:405-14
4. Hassannia B, Vandenabeele P, Vanden Berghe T. Targeting Ferroptosis to Iron Out Cancer. Cancer Cell. 2019;35:830-49
5. Jiang L, Kon N, Li TY, Wang SJ, Su T, Hibshoosh H. et al. Ferroptosis as a p53-mediated activity during tumour suppression. Nature. 2015;520:57-62
6. Mou YH, Wang J, Wu JC, He D, Zhang CF, Duan CJ. et al. Ferroptosis, a new form of cell death: opportunities and challenges in cancer. J Hematol Oncol. 2019;12:34
7. Galluzzi L, Vitale I, Warren S, Adjemian S, Agostinis P, Martinez AB. et al. Consensus guidelines for the definition, detection and interpretation of immunogenic cell death. J Immunother Cancer. 2020;8:e000337
8. Wang W, Green M, Choi JE, Gijon M, Kennedy PD, Johnson JK. et al. CD8(+) T cells regulate tumour ferroptosis during cancer immunotherapy. Nature. 2019;569:270-4
9. Jiang Z, Lim SO, Yan M, Hsu JL, Yao J, Wei Y. et al. TYRO3 induces anti-PD-1/PD-L1 therapy resistance by limiting innate immunity and tumoral ferroptosis. J Clin Invest. 2021;131:e139434
10. Stelzer G, Rosen N, Plaschkes I, Zimmerman S, Twik M, Fishilevich S. et al. The GeneCards Suite: From Gene Data Mining to Disease Genome Sequence Analyses. Curr Protoc Bioinformatics. 2016;54:1 30 1-1 3
11. Liu JF, Lichtenberg T, Hoadley KA, Poisson LM, Lazar AJ, Cherniack AD. et al. An Integrated TCGA Pan-Cancer Clinical Data Resource to Drive High-Quality Survival Outcome Analytics. Cell. 2018;173:400-16
12. Jiang X, Yan Q, Xie L, Xu S, Jiang K, Huang J. et al. Construction and Validation of a Ferroptosis-Related Prognostic Model for Gastric Cancer. J Oncol. 2021;2021:6635526
13. Robinson MD, McCarthy DJ, Smyth GK. edgeR: a Bioconductor package for differential expression analysis of digital gene expression data. Bioinformatics. 2010;26:139-40
14. Linden A, Yarnold PR. Modeling time-to-event (survival) data using classification tree analysis. J Eval Clin Pract. 2017;23:1299-308
15. Nagashima K, Sato Y. Information criteria for Firth's penalized partial likelihood approach in Cox regression models. Stat Med. 2017;36:3422-36
16. Engebretsen S, Bohlin J. Statistical predictions with glmnet. Clin Epigenetics. 2019;11:123
17. Tibshirani R. The lasso method for variable selection in the Cox model. Stat Med. 1997;16:385-95
18. Heagerty PJ, Lumley T, Pepe MS. Time-dependent ROC curves for censored survival data and a diagnostic marker. Biometrics. 2000;56:337-44
19. Yu GC, Wang LG, Han YY, He QY. clusterProfiler: an R Package for Comparing Biological Themes Among Gene Clusters. Omics. 2012;16:284-7
20. Subramanian A, Tamayo P, Mootha VK, Mukherjee S, Ebert BL, Gillette MA. et al. Gene set enrichment analysis: A knowledge-based approach for interpreting genome-wide expression profiles. P Natl Acad Sci USA. 2005;102:15545-50
21. Kanehisa M, Furumichi M, Tanabe M, Sato Y, Morishima K. KEGG: new perspectives on genomes, pathways, diseases and drugs. Nucleic Acids Res. 2017;45:D353-D61
22. The Gene Ontology C. The Gene Ontology Resource: 20 years and still GOing strong. Nucleic Acids Res. 2019;47:D330-D8
23. Yoshihara K, Shahmoradgoli M, Martinez E, Vegesna R, Kim H, Torres-Garcia W. et al. Inferring tumour purity and stromal and immune cell admixture from expression data. Nat Commun. 2013;4:2612
24. Newman AM, Liu CL, Green MR, Gentles AJ, Feng W, Xu Y. et al. Robust enumeration of cell subsets from tissue expression profiles. Nat Methods. 2015;12:453-7
25. Hanzelmann S, Castelo R, Guinney J. GSVA: gene set variation analysis for microarray and RNA-seq data. BMC Bioinformatics. 2013;14:7
26. Bindea G, Mlecnik B, Tosolini M, Kirilovsky A, Waldner M, Obenauf AC. et al. Spatiotemporal dynamics of intratumoral immune cells reveal the immune landscape in human cancer. Immunity. 2013;39:782-95
27. Deng H, Lin Y, Gan F, Li B, Mou Z, Qin X. et al. Prognostic Model and Immune Infiltration of Ferroptosis Subcluster-Related Modular Genes in Gastric Cancer. J Oncol. 2022;2022:5813522
28. Liu G, Ma JY, Hu G, Jin H. Identification and validation of a novel ferroptosis-related gene model for predicting the prognosis of gastric cancer patients. PLoS One. 2021;16:e0254368
29. Liu SJ, Yang YB, Zhou JX, Lin YJ, Pan YL, Pan JH. A Novel Ferroptosis-Related Gene Risk Signature for Predicting Prognosis and Immunotherapy Response in Gastric Cancer. Dis Markers. 2021;2021:2385406
30. Shao Y, Jia H, Li S, Huang L, Aikemu B, Yang G. et al. Comprehensive Analysis of Ferroptosis-Related Markers for the Clinical and Biological Value in Gastric Cancer. Oxid Med Cell Longev. 2021;2021:7007933
31. Wang F, Chen C, Chen WP, Li ZL, Cheng H. Development and Validation of a Novel Ferroptosis-Related Gene Signature for Predicting Prognosis and the Immune Microenvironment in Gastric Cancer. Biomed Res Int. 2021;2021:6014202
32. Huang YX, Zhang J, Hou LD, Wang G, Liu H, Zhang R. et al. LncRNA AK023391 promotes tumorigenesis and invasion of gastric cancer through activation of the PI3K/Akt signaling pathway. J Exp Clin Canc Res. 2020;39:155
33. Wang LQ, Xu W, Mei Y, Wang XF, Liu WT, Zhu ZG. et al. CHRDL2 promotes cell proliferation by activating the YAP/TAZ signaling pathway in gastric cancer. Free Radical Bio Med. 2022;193:158-70
34. Wu XY, Tao P, Zhou Q, Li J, Yu ZJ, Wang XF. et al. IL-6 secreted by cancer-associated fibroblasts promotes epithelial-mesenchymal transition and metastasis of gastric cancer via JAK2/STAT3 signaling pathway. Oncotarget. 2017;8:20741-50
35. Yan C, Yang HJ, Su P, Li X, Li ZB, Wang DH. et al. OTUB1 suppresses Hippo signaling via modulating YAP protein in gastric cancer. Oncogene. 2022;41:5186-98
36. He L, Chen J, Xu F, Li J, Li J. Prognostic Implication of a Metabolism-Associated Gene Signature in Lung Adenocarcinoma. Mol Ther Oncolytics. 2020;19:265-77
37. Lei G, Zhuang L, Gan BY. Targeting ferroptosis as a vulnerability in cancer. Nat Rev Cancer. 2022;22:381-96
38. Xu T, Ding W, Ji XY, Ao X, Liu Y, Yu WP. et al. Molecular mechanisms of ferroptosis and its role in cancer therapy. J Cell Mol Med. 2019;23:4900-12
39. Wang Y, Zheng LX, Shang WJ, Yang ZC, Li TY, Liu F. et al. Wnt/beta-catenin signaling confers ferroptosis resistance by targeting GPX4 in gastric cancer. Cell Death Differ. 2022;29:2190-202
40. Lin J, Wu CL, Ma DH, Hu QT. Identification of P2RY13 as an immune-related prognostic biomarker in lung adenocarcinoma: A public database-based retrospective study. Peerj. 2021;9:11319
41. Fuchs CS, Doi T, Jang RW, Muro K, Satoh T, Machado M. et al. Safety and Efficacy of Pembrolizumab Monotherapy in Patients With Previously Treated Advanced Gastric and Gastroesophageal Junction Cancer: Phase 2 Clinical KEYNOTE-059 Trial. JAMA Oncol. 2018;4:e180013
42. Muro K, Chung HC, Shankaran V, Geva R, Catenacci D, Gupta S. et al. Pembrolizumab for patients with PD-L1-positive advanced gastric cancer (KEYNOTE-012): a multicentre, open-label, phase 1b trial. Lancet Oncol. 2016;17:717-26
43. Song S, Shu P. Expression of ferroptosis-related gene correlates with immune microenvironment and predicts prognosis in gastric cancer. Sci Rep. 2022;12:8785
44. Yao F, Zhan Y, Pu Z, Lu Y, Chen J, Deng J. et al. LncRNAs Target Ferroptosis-Related Genes and Impair Activation of CD4(+) T Cell in Gastric Cancer. Front Cell Dev Biol. 2021;9:797339
45. Liu B, Li X, Wang D, Yu Y, Lu D, Chen L. et al. CEMIP promotes extracellular matrix-detached prostate cancer cell survival by inhibiting ferroptosis. Cancer Sci. 2022;113:2056-70
46. Moreira AM, Pereira J, Melo S, Fernandes MS, Carneiro P, Seruca R. et al. The Extracellular Matrix: An Accomplice in Gastric Cancer Development and Progression. Cells-Basel. 2020;9:394
47. Wang YY, Li L, Zhao ZS, Wang YX, Ye ZY, Tao HQ. L1 and epithelial cell adhesion molecules associated with gastric cancer progression and prognosis in examination of specimens from 601 patients. J Exp Clin Cancer Res. 2013;32:66
48. Harjunpaa H, Asens ML, Guenther C, Fagerholm SC. Cell Adhesion Molecules and Their Roles and Regulation in the Immune and Tumor Microenvironment. Frontiers in Immunology. 2019;10:1078
49. Teng YS, Chen WY, Yan ZB, Lv YP, Liu YG, Mao FY. et al. L-Plastin Promotes Gastric Cancer Growth and Metastasis in a Helicobacter pylori cagA-ERK-SP1-Dependent Manner. Mol Cancer Res. 2021;19:968-78
50. Moulding DA, Record J, Malinova D, Thrasher AJ. Actin cytoskeletal defects in immunodeficiency. Immunol Rev. 2013;256:282-99
51. Magnelli L, Schiavone N, Staderini F, Biagioni A, Papucci L. MAP Kinases Pathways in Gastric Cancer. International Journal of Molecular Sciences. 2020;21:2873
52. Ye Q, Zeng CM, Luo C, Wu Y. Ferrostatin-1 mitigates cognitive impairment of epileptic rats by inhibiting P38 MAPK activation. Epilepsy Behav. 2020;103:106670
53. Dong C, Davis RJ, Flavell RA. MAP kinases in the immune response. Annu Rev Immunol. 2002;20:55-72
54. Wu Y, Chen YC, Qu R, Lan T, Sang JR. Type II cGMP-dependent protein kinase inhibits EGF-triggered signal transduction of the MAPK/ERK-mediated pathway in gastric cancer cells. Oncology Reports. 2012;27:553-8
55. Kim D, Kim WD, Kim SK, Moon DH, Lee SJ. TGF-beta 1-mediated repression of SLC7A11 drives vulnerability to GPX4 inhibition in hepatocellular carcinoma cells. Cell Death Dis. 2020;11:406
56. Xu LY, Chen JM, Jia LT, Chen X, Moumin FA, Cai JT. SLC1A3 promotes gastric cancer progression via the PI3K/AKT signalling pathway. J Cell Mol Med. 2020;24:14392-404
57. Yi JM, Zhu JJ, Wu J, Thompson CB, Jiang XJ. Oncogenic activation of PI3K-AKT-mTOR signaling suppresses ferroptosis via SREBP-mediated lipogenesis. P Natl Acad Sci USA. 2020;117:31189-97
58. Hiam-Galvez KJ, Allen BM, Spitzer MH. Systemic immunity in cancer. Nat Rev Cancer. 2021;21:345-59
59. Wang MN, Zhao JZ, Zhang LS, Wei F, Lian Y, Wu YF. et al. Role of tumor microenvironment in tumorigenesis. J Cancer. 2017;8:761-73
60. Kohli K, Pillarisetty VG, Kim TS. Key chemokines direct migration of immune cells in solid tumors. Cancer Gene Ther. 2022;29:10-21
61. Salmon H, Franciszkiewicz K, Damotte D, Dieu-Nosjean MC, Validire P, Trautmann A. et al. Matrix architecture defines the preferential localization and migration of T cells into the stroma of human lung tumors. J Clin Invest. 2012;122:899-910
62. Song SY, Shu P. Expression of ferroptosis-related gene correlates with immune microenvironment and predicts prognosis in gastric cancer. Sci Rep-Uk. 2022;12:8785
63. Yamaguchi T, Fushida S, Yamamoto Y, Tsukada T, Kinoshita J, Oyama K. et al. Tumor-associated macrophages of the M2 phenotype contribute to progression in gastric cancer with peritoneal dissemination. Gastric Cancer. 2016;19:1052-65
64. Chen YL, Zhang SY, Wang QZ, Zhang XB. Tumor-recruited M2 macrophages promote gastric and breast cancer metastasis via M2 macrophage-secreted CHI3L1 protein. J Hematol Oncol. 2017;10:36
65. Datta M, Coussens LM, Nishikawa H, Hodi FS, Jain RK. Reprogramming the Tumor Microenvironment to Improve Immunotherapy: Emerging Strategies and Combination Therapies. Am Soc Clin Oncol Educ Book. 2019;39:165-74
66. Wang JB, Li P, Liu XL, Zheng QL, Ma YB, Zhao YJ. et al. An immune checkpoint score system for prognostic evaluation and adjuvant chemotherapy selection in gastric cancer. Nat Commun. 2020;11:6352
67. Sato T, Oshima T, Yamamoto N, Yamada T, Hasegawa S, Yukawa N. et al. Clinical significance of SPARC gene expression in patients with gastric cancer. J Surg Oncol. 2013;108:364-8
68. Wang CS, Lin KH, Chen SL, Chan YF, Hsueh S. Overexpression of SPARC gene in human gastric carcinoma and its clinic-pathologic significance. Br J Cancer. 2004;91:1924-30
69. Zhao ZS, Wang YY, Chu YQ, Ye ZY, Tao HQ. SPARC is associated with gastric cancer progression and poor survival of patients. Clin Cancer Res. 2010;16:260-8
70. Tang CT, Lin XL, Wu S, Liang Q, Yang L, Gao YJ. et al. NOX4-driven ROS formation regulates proliferation and apoptosis of gastric cancer cells through the GLI1 pathway. Cell Signal. 2018;46:52-63
71. Ford K, Hanley CJ, Mellone M, Szyndralewiez C, Heitz F, Wiesel P. et al. NOX4 Inhibition Potentiates Immunotherapy by Overcoming Cancer-Associated Fibroblast-Mediated CD8 T-cell Exclusion from Tumors. Cancer Res. 2020;80:1846-60
72. Park MW, Cha HW, Kim J, Kim JH, Yang H, Yoon S. et al. NOX4 promotes ferroptosis of astrocytes by oxidative stress-induced lipid peroxidation via the impairment of mitochondrial metabolism in Alzheimer?s diseases. Redox Biol. 2021;41:101947
73. Zhu DD, Wu SF, Li YF, Zhang Y, Chen JR, Ma JH. et al. Ferroptosis-related gene SLC1A5 is a novel prognostic biomarker and correlates with immune infiltrates in stomach adenocarcinoma. Cancer Cell Int. 2022;22:124
74. Chen M, Lu J, Wang L, Zou XP. Effects of Targeting Slc1a5 on Inhibiting Gastric Cancer Growth and Tumor Development in Vitro and in Vivo. Gastroenterology. 2018;154:S650-S1
75. Wang HJ, Liu Y, Fan LQ, Han CL, Jiang Y, Cheng SJ. et al. A new bisphosphonate derivative, CP, induces gastric cancer cell apoptosis via activation of the ERK1/2 signaling pathway. Acta Pharmacol Sin. 2013;34:1535-44
76. Yang M, Wu X, Hu J, Wang Y, Wang Y, Zhang L. et al. COMMD10 inhibits HIF1alpha/CP loop to enhance ferroptosis and radiosensitivity by disrupting Cu-Fe balance in hepatocellular carcinoma. J Hepatol. 2022;76:1138-50
77. Cai M, Sikong Y, Wang Q, Zhu S, Pang F, Cui X. Gpx3 prevents migration and invasion in gastric cancer by targeting NFsmall ka, CyrillicB/Wnt5a/JNK signaling. Int J Clin Exp Pathol. 2019;12:1194-203
78. Wang Z, Zhu J, Liu Y, Wang Z, Cao X, Gu Y. Tumor-polarized GPX3(+) AT2 lung epithelial cells promote premetastatic niche formation. Proc Natl Acad Sci U S A. 2022;119:e2201899119
79. Huang CQ, Chen RL, Zheng FJ, Tang YR, Wang XK, Chen ZC. et al. Inhibitory role of ATF3 in gastric cancer progression through regulating cell EMT and stemness. Cancer Cell Int. 2021;21:127
80. Fu DZ, Wang CX, Yu L, Yu R. Induction of ferroptosis by ATF3 elevation alleviates cisplatin resistance in gastric cancer by restraining Nrf2/Keap1/xCT signaling. Cell Mol Biol Lett. 2021;26:127
81. Zhang ZL, Guo M, Li YJ, Shen M, Kong DS, Shao JJ. et al. RNA-binding protein ZFP36/TTP protects against ferroptosis by regulating autophagy signaling pathway in hepatic stellate cells. Autophagy. 2020;16:1482-505
82. Moore MJ, Blachere NE, Fak JJ, Park CY, Sawicka K, Parveen S. et al. ZFP36 RNA-binding proteins restrain T cell activation and anti-viral immunity. Elife. 2018;7:e33057
Author contact
![]() Corresponding authors: Wenzhen Shi, Ph.D; Medical Research Center, Xi'an No.3 Hospital, the affiliated Hospital of Northwest University, Xi'an 710069, Shaanxi, P.R. China; E-mail: shiwenzhen736com or Yuyan Xiong, Ph.D; Key Laboratory of Resource Biology and Biotechnology in Western China, Ministry of Education, School of Medicine, Northwest University, Xi'an, Shaanxi, China; E-mail: yuyan.xiongedu.cn.
Corresponding authors: Wenzhen Shi, Ph.D; Medical Research Center, Xi'an No.3 Hospital, the affiliated Hospital of Northwest University, Xi'an 710069, Shaanxi, P.R. China; E-mail: shiwenzhen736com or Yuyan Xiong, Ph.D; Key Laboratory of Resource Biology and Biotechnology in Western China, Ministry of Education, School of Medicine, Northwest University, Xi'an, Shaanxi, China; E-mail: yuyan.xiongedu.cn.