Impact Factor ISSN: 1837-9664

 Global reach, higher impact
J Cancer 2022; 13(2):496-507. doi:10.7150/jca.65646 This issue Cite
Research Paper
Identifies Immune Feature Genes for Prediction of Chemotherapy Benefit in Cancer
Yuquan Bai*, Chuan Li*, Liang Xia, Fanyi Gan, Zhen Zeng, Chuanfen Zhang, Yulan Deng, Yuyang Xu, Chengwu Liu, Senyi Deng ![]() , Lunxu Liu
, Lunxu Liu ![]()
Department of Thoracic Surgery and Institute of Thoracic Oncology, West China Hospital, Sichuan University. Chengdu, 610041.
*These authors have contributed equally to this work
Received 2021-8-2; Accepted 2021-11-24; Published 2022-1-1
Abstract

Chemotherapy is still the most fundamental treatment for advanced cancers so far. Previous studies have indicated that immune cell infiltration (ICI) index could serve as a biomarker to predict chemotherapy benefit in breast cancer and colorectal cancer. However, due to different responses of tumor infiltrating immune cells (TIICs) to chemotherapy, the prediction efficiency of ICI index is not fully confirmed by now. In our study, we first extended this conclusion in 7 cancers that high ICI index could certainly indicate chemotherapy benefit (P<0.05). But we also found the fraction of different TIICs and the interaction of TIICs were varies greatly from cancer to cancer. Therefore, we executed correlation and causal network analysis to identify chemotherapy associated immune feature genes, and fortunately identified six co-owned immune feature genes (CD48, GPR65, C3AR1, CD2, CD3E and ARHGAP9) in 10 cancers (BLCA, BRCA, COAD, LUAD, LUSC, OV, PAAD, SKCM, STAD and UCEC). Base on this, we developed a chemotherapy benefit prediction model within six co-owned immune feature genes through random forest classifying (AUC =0.83) in cancers mentioned above, and validated its efficiency in external datasets. In short, our work offers a novel model with a shrinking panel which has the potential to guide optimal chemotherapy in cancer.
Keywords: Chemotherapy benefit, Immune cell infiltration, Network analysis, prediction model
Introduction
With progressing of medical technology, the clinical treatment for cancer has developed into a combination of surgery, chemotherapy, radiotherapy, targeted therapy, and immune therapy [1]. Chemotherapy is still the most fundamental treatment for advanced cancers, especially in the situations of no surgery chance or no sensitive mutation for targeted therapy [2]. It is suggested that the implement of chemotherapy could significantly delay disease progression in a variety of cancers, such as lung cancer, liver cancer and colorectal cancer [3-5]. However, studies also indicate that even for these chemotherapy sensitive cancers, the response of chemotherapy in patients present greater heterogeneity [6]. Therefore, identify effective biomarkers which can indicate chemotherapy benefit and give patients optimized treatment has been one of the long-lived issues in clinical cancer care.
The infiltrations of immune cell and their interactions with cancer cells have formed a unique tumor immune microenvironment (TIME) [7]. In TIME, the functions of tumor infiltrating immune cells (TIICs) in cancer evolution are totally different, due to its cell type, density and distribution [8, 9]. It has been confirmed that TIICs are widely involved in each step of cancer progression [10], including immune escape, metastasis, drug responses and the prognosis of cancer patients [11, 12]. The close correlation between immune cell infiltration and chemotherapy outcome has been reported in cancers, including breast cancer and colorectal cancer [13, 14], which suggested that immune cell infiltration (ICI) index could serve as a biomarker to predict chemotherapy benefit. In addition, studies have reported that in non-small-cell lung cancer, chemotherapy can promote anti-cancer immunity by recruiting T and B cells into TIME and change the phenotype of cytotoxic CD8+ T cells and CD8+/CD4+ memory T cells [15]. In triple-negative breast cancer (TNBC) and HER2-positive breast cancer, high levels of ICI in patients indicate a higher complete response rate after neoadjuvant chemotherapy [16, 17]. In bladder cancer, patients with more infiltration of these five immune cells (Mast cell, Macrophage, Treg, NK cell and CTLs) has been confirmed could earn better prognosis after chemotherapy [18]. However, limited by several studies on the correlation between ICI and chemotherapy outcome and different responses of TIICs to chemotherapy, the prediction efficiency of ICI index is not fully confirmed so far.
In this study, we tried to isolate chemotherapy associated immune feature genes in multiple cancers to construct a new chemotherapy benefit prediction model. Firstly, by download the transcriptome data of cancers from TCGA database, we performed ESTIMATE analyzing and demonstrated that ICI index could indicate chemotherapy benefit in multiple cancers, but the composition and interaction of TIICs were diverse among different caners. Next, we employed correlation and causal gene expression network analysis to identify chemotherapy associated immune feature genes and fortunately got six co-owned immune feature genes. Finally, we developed a chemotherapy benefit prediction model through random forest classifying and validated its efficiency in external datasets. In short, our work offers a novel model with a shrinking panel which has the potential to guide optimal chemotherapy in multiple cancers.
Materials and Method
Data and sample collection
Transcriptome data and clinical information data of 33 cancers were downloaded from the TCGA (https://portal.gdc.cancer.gov/) databases. The cancer paraffin-embedded specimens of 52 NSCLC patients were obtained from the Department of Pathology, West China Hospital, Sichuan University, these patients had received neoadjuvant chemotherapy before surgery between January 2016 and August 2020. According to Response Evaluation Criteria in Solid Tumors (RECIST), 7 patients were defined as complete response (CR), 23 patients were defined as partial response (PR) and 22 patients were defined as progressive disease (PD) [19].
Cancer purity estimation
The ESTIMATE algorithm is used to calculate the immune-stromal component ratio in each cancer sample, and displays with three scores: ImmuneScore, StromalScore and ESTIMATEScore [20]. In this study, we use ESTIMATE to measure the immune infiltration levels in mutliple cancers. According to the ImmuneScore, all cancer patients can be divided into two groups.
Survival analysis
The R packages “survival” and “survminer” were used for survival analysis. The survival curves were estimated by using the Kaplan-Meier method, and the log-rank test was used to analyze differences in survival time.
Evaluation of specific immune cell infiltration
CIBERSORT was used to evaluate the fraction of specific cell types based on transcriptome data of different cancers [21]. Monte Carlo sampling was used to derive the P value in CIBERSORT for the deconvolution of each sample. Cancer samples which P value <0.05 were selected for further analysis.
Immunohistochemistry
Sections were dewaxed and hydrated, then treated with 10 mM citrate buffer (pH 6.0) for 5 min for antigen repair. After being treated with 3% hydrogen peroxide for 10 min to inactivate endogenous enzymes, sections were blocked in 5% BSA for 20 min and then incubated with primary antibody: CCR2 (Abgent Cat# abs128841, Absin) and UCHL1 (Abgent Cat# 66230-1-lg, Proteintech). Sections were incubated with primary antibody at 4°C overnight. After washing in PBS, sections were incubated with secondary antibodies at room temperature for 30 min. After washing in PBS, sections were treated with streptavidin-biotin complex at room temperature for 20 min. After washing in PBS, the sections were visualized with (3, 30-diaminobenzidine, DAB) DAB. Nucleus was stained with hematoxylin. After dehydration, transparentization and fixation were performed and observed with a light microscope.
Immunohistochemical evaluation
The grading of positive immunohistochemical reactions is based on the combination of staining intensity and the percentage of positive cells. Five images were randomly obtained for each specimen after ×400 magnification. We try to avoid marginal areas to prevent marginal effects from affecting evaluation. Count all cells and the number of positive cells with a micro-measuring grid, and calculate the average proportion of positive cells. First, score according to the intensity of dyeing: 0 if colorless, 1 if light yellow, 2 if light brown, and 3 if dark brown. Then calculate the percentage of positive cells in each specimen and score it (0 = 0%, 1 = 0% ~ 10%, 2 = 10% ~ 50%, 3 = 50% ~ 75%, 4 = >75 %). Finally, multiply the ratio score by the dyeing intensity score to get the final semi-quantitative score, which is divided into 4 levels: -(0,1,2), +(3,4), ++(6,8), +++ (9,12). Tumors with a final score of more than 3 are considered positive by immunohistochemistry. In terms of protein expression, -~+ means low expression, and ++~+++ means high expression.
Correlation and causal network analysis
In this study, “edgeR” R package [22] was used to gain differential immune feature genes between ICI high and low chemotherapy group in multiple cancers, the analysis criteria was performed according to the P <0.05 and | log2 fold change (FC) | >2. The R package 'STRINGdb' was used to calculate the correlation between these differential immune feature genes [23]. By setting the combined score >0.9, gene-pair with correlation relationship were obtained (Table S3). Among them, top 60 chemotherapy associated immune feature genes were determined for following causal network analysis (Table S4).
The Bayesian causal network with a directed acyclic graph could exhibit the dependent and independent relationships between selected variables, and conditional probability distribution was employed to describe the dependence of variables. We used the “bnlearn” R package to construct the Bayesian causal network among determined chemotherapy associated immune feature genes mentioned above [24]. Next, we drew the Bayesian causal network of gene pairs within weight >0.5 (Table S5) by Cytoscape (3.7.2) [25]. Finally, we selected the top 20 in-degree and top 20 out-degree genes as the hub nodes of each cancer (Table 1) and identified six co-owned immune feature genes in these cancers.
Hub genes of in-degree and out-degree of 10 cancers
| BLCA | CD48, GPR65, P2RY10, CD74, C1QB, CCR4, ITK, SPI1, TYROBP, C3AR1, CD2, CD3D, CD3E, FCER1G, GZMA, LCP2, PIK3CG, SH2D1A, CASR, CXCL12, CXCR3, ARTP, DOK2, P2, DOCK, OK CCR8, CD8A, CXCL1, CXCL9, ICAM3, C3, CCL5, CCR2, CD3G, FPR1, FPR2, HLA-DRB1 |
|---|---|
| BRCA | DOCK2, ITK, PTPRC, CD3G, PIK3CG, CXCR3, CCL21, C3AR1, CCR8, ICAM3, SST, LCP2, CCR4, CD3D, CXCR5, CXCL10, CXCL9, GZMA, ARHGAP9, CD3E, SPI1, G CCL, DOK2, P2, RY13 C1QA, CCR1, CCR5, C1QB, CD48, FPR2, CD2, CXCL11, FCER1G, HLA-DRB1, TYROBP |
| COAD | DOCK2, PIK3CG, PTPRC, CCR2, C1QA, CD48, C3AR1, LCP2, RGS18, GPR65, SLA, CCR1, CD3D, CNR1, P2RY10, CCL5, CCR7, CD2, CXCR1, FCER1G, FPR1, CXACR5, SHROBP, SHROBP, CCR8, ITK, CXCL10, DOK2, TRAT1, C1QB, CCL21, CD3E, CXCL9, GZMA, ARHGAP9 |
| LUAD | SPI1, C3AR1, CD48, ICAM3, PTPRC, C1QB, FPR2, TYROBP, DOCK2, GPR65, SLA, C1QA, CD2, CD3E, C1QC, CD74, DRD2, SH2D1A, TAGAP, ARHGAP9, GZCRMA, ITXK, CXCR5, ITXCL10, PIK3CG LCP2, P2RY13, DOK2, CXCL9, IL12RB1, CXCR3, FPR1, ADCY8, CCL21, CCL5, CD8A |
| LUSC | DOCK2, CD74, CD3E, CD48, CXCR3, PTPRC, RGS18, P2RY10, CCR5, GPR65, LCP2, PIK3CG, SPI1, CCR2, CD2, CD3D, CXCL11, DOK2, FPR2, GZMA, C5AR1, CCR8, IL12RB1, C1, CXCL9, FCER1G, C1QC, CCR1, SH2D1A, CCR4, ITK, P2RY13, TYROBP, ARHGAP9 |
| OV | LCP2, CCR1, CCR5, CD3E, CXCR3, RGS1, C3AR1, CD48, CXCL11, ARHGAP9, CCL5, CD2, FCER1G, PTPRC, IL12RB1, SH2D1A, FPR1, TYROBP, C1QA, C1QC, FPR3, GPR65, P2RY13, ITK, SPI1, CCR4, CXCL9, DOCK2, TAGAP, CD3G, CD74, CCL13, CCL19 |
| PAAD | LCP2, CCR1, CCR5, CD3E, CXCR3, RGS1, C3AR1, CD48, CXCL11, ARHGAP9, CCL5, CD2, FCER1G, PTPRC, IL12RB1, SH2D1A, FPR1, TYROBP, C1QA, C1QC, FPR3, GPR65, P2RY13, ITK, SPI1, CCR4, CXCL9, DOCK2, TAGAP, CD3G, CD74, CCL13, CCL19 |
| SKCM | CCR7, CD3G, TRAT1, C3AR1, CCL5, LCK, LPAR5, CD3E, CD2, CXCL9, GZMA, P2RY10, PTPRC, BDKRB1, C1QA, C3, CCR1, CCR5, FCER1G, SPI1, ARHGCRAP9, DPR2, C1Q ICAM3, SH2D1A, CCL21, GPR65, TYROBP, P2RY13, CD48, CD8A, HLA-DRB1 |
| STAD | CD48, CD3D, P2RY10, CCR7, CCR5, CD2, FPR2, RGS18, SST, TYROBP, CCR4, CXCL9, CXCR2, P2RY13, C3AR1, CASR, CXCL10, SPI1, CCR1, CD8A, PIK3CG, IL12 G1, CD3G, CXCR5, FCER1G, LCP2, C1QA, CD3E, CCL21, CCR2, DOCK2, DOK2, GPR65, PTPRC, SH2D1A, ARHGAP9 |
| UCEC | SH2D1A, IL12RB1, CD2, TRAT1, CCL19, CXCR3, CXCR5, C1QA, CCR7, GPR65, C1QB, CCL5, CCR5, CD3D, CD3E, KNG1, LCP2, RGS18, CCL21, CCR2, CXCL9, FCER1, DOCK2, RGS1, CD48, SLA, SPI1, TAGAP, C3AR1, CD8A, ICAM3, ARHGAP9, CCL13 |
Model construction and validation
Based on expression of the six co-owned immune feature genes as characteristic, we constructed a random forest classifier model, 70% of the total patients were selected as train set and the rest patients were selected as test set. We drew the learning curve of n_estimators and adjusted the parameters (max_depth, max_features, min_samples_leaf, min_samples_split) through grid search to get the best combination of each parameter. The feature importance of this model was viewed by feature_importances [26]. GSE25055 dataset (breast cancer, n=310) and GSE14814 dataset (non-small cell lung cancer, n=131) were used in external validation. The ROC curve showed the predictive performance of the model in the test and validation sets.
Functional analysis
We calculated the semantic similarity between chemotherapy associated six co-owned immune feature genes in molecular function and cellular component based on the “GOSemSim” R package, and then calculated the geometric mean to obtain the similarity score of each gene. The most significantly enriched Gene Ontology (GO) terms and Kyoto Encyclopedia of Genes and Genomes (KEGG) for feature genes were identified using DAVID (https://david.ncifcrf.gov/).
Results
ICI index indicates chemotherapy benefit in multiple cancers
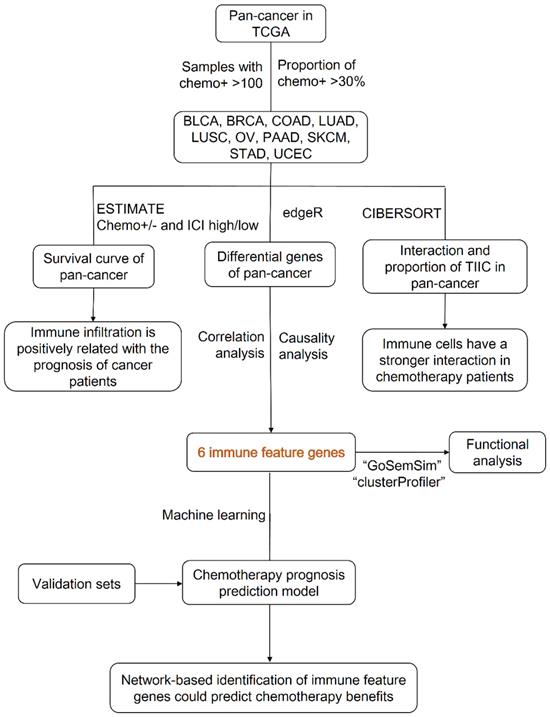
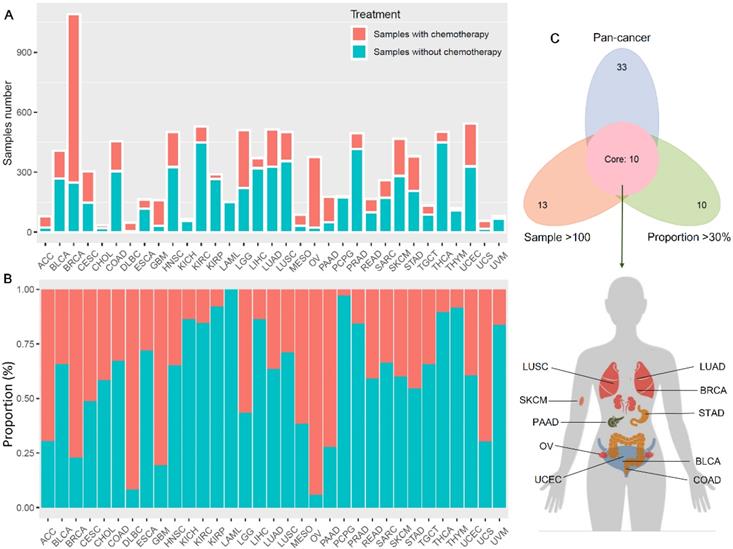
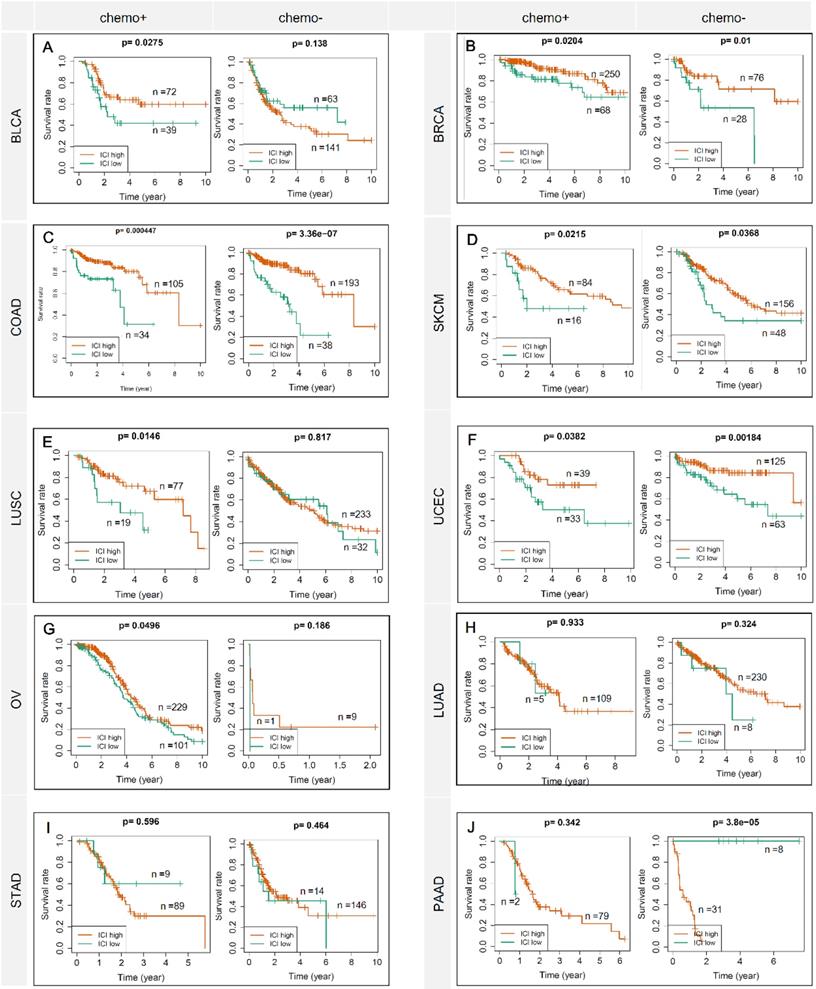
Figure 1 showed the flow chart of data screening and analysis process. We first exclude the influence of radiotherapy on the prognosis of cancer patients (Table S1). Then among the remaining patients of pan-cancer, in order to ensure enough chemotherapy patients for study, we selected cancers which has chemotherapy patients >100 and chemotherapy patients >30% of total patients, including bladder urothelial carcinoma (BLCA), breast invasive carcinoma (BRCA), colon adenocarcinoma (COAD), lung adenocarcinoma (LUAD), lung squamous cell carcinoma (LUSC), ovarian cancer (OV), pancreatic adenocarcinoma (PAAD), skin cutaneous melanoma (SKCM), stomach adenocarcinoma (STAD) and endometrial carcinoma (UCEC) (Figure 2A-C). And the detailed clinic parameters of enrolled patients of 10 cancers were shown in Table S1. In our study, we divided patients into four groups according to the ICI index (high or low) and with or without chemotherapy (chemo+/-) (Table S2). We found that in 7 cancers of BLCA (P =0.0275), BRCA (P =0.0204), COAD (P <0.001), LUSC (P =0.0146), OV (P =0.0496), SKCM (P =0.0215) and UCEC (P =0.0382), high ICI index indicated good chemotherapy benefit (Figure 3A-G). And in 4 cancers of BRCA (P =0.01), COAD (P <0.001), SKCM (P =0.0368) and UCEC (P =0.00184), ICI index was also positively related with the prognosis of non-chemotherapy patients (Figure 3B-D, F). These results suggested that ICI index could indicate the outcome of cancer patients, especially in chemotherapy patients.
Data screening and analysis process.
Chemotherapy information of cancer patients in TCGA. (A) Number of chemotherapy and non-chemotherapy patients in different cancers. (B) Percentage of chemotherapy and non-chemotherapy patients in the total patients in different cancers. (C) We screened cancers with a proportion of chemotherapy patients >30% and number of chemotherapy patients >100 for subsequent analysis.
ICI index indicates chemotherapy benefit in multiple cancers. Each row represents a type of cancer. Each column represents a different grouping. A Kaplan-Meier Plotter was used to show the survival prediction ability of ICI index in multiple cancers (BLCA, BRCA, COAD, SKCM, LUSC, UCEC, OV, LUAD, STAD and PAAD). chemo+: chemotherapy patients; chemo-: non-chemotherapy patients.
The components and interaction of TIICs are diverse among different cancers
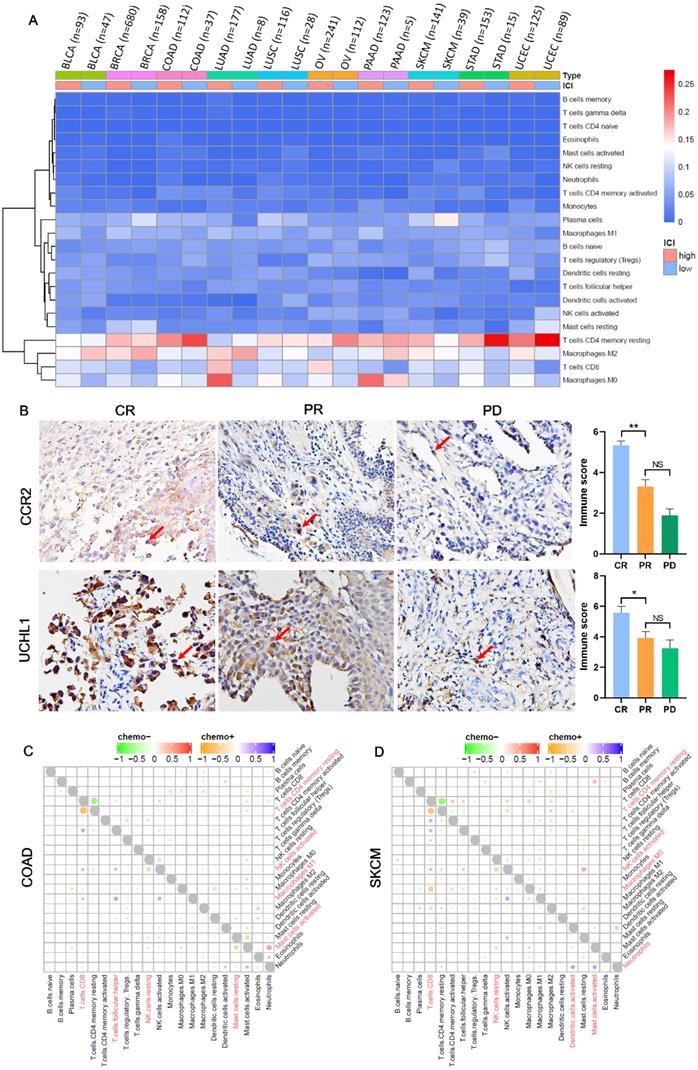
Immune infiltrations are determined by the type and fraction of TIICs in TIME, and play an important role in inhibiting or promoting cancer growth [27]. Figure 4A showed the components of TIICs in multiple cancers. We could see that the fraction of CD8+ T cells and macrophages M0 was high in chemotherapy patients with high ICI index, while the fraction of CD4+ memory resting T cells and macrophages M2 was low in chemotherapy patients with low ICI index. And based on the immunohistochemistry, we also found that compared with PR group, CR group has more infiltrations of macrophages M0 (marker gene: CCR2) and CD8+ T cells (marker gene: UCHL1) (Figure 4B; PCCR2 =0.035, PUCHL1 =0.006), which was consistent with the result of heat map. At the same time, we analyzed the interaction among TIICs in chemotherapy and non-chemotherapy patients. We found that in chemotherapy patients of COAD, SKCM, BLCA, LUSC, UCEC, LUAD and STAD, both CD8+ T cells and CD4+ memory resting T cells showed a strong negative correlation (Figure 4C, D; Figure S1A, C, D, F and G). And, in COAD, SKCM, BLCA, BRCA, UCEC, OV, LUAD and PAAD, compared with non-chemotherapy patients, the interaction between TIICs in chemotherapy patients was more abundant (Figure 4C, D; Figure S1A, B, D-F and H).
The composition and interaction of TIICs are diversity among different cancers. (A) Heat map showed the composition of TIICs in chemotherapy patients among cancer. (B) The expressions of Macrophage M0 (marker gene: CCR2) and CD8+ T cells (marker gene: UCHL1) in the preoperative puncture samples of NSCLC chemotherapy and the corresponding histogram of immunostaining score. CR: complete response; PR: partial response; PD: progressive disease. (C, D) The interaction between TIICs in chemotherapy and non-chemotherapy patients of COAD and SKCM.
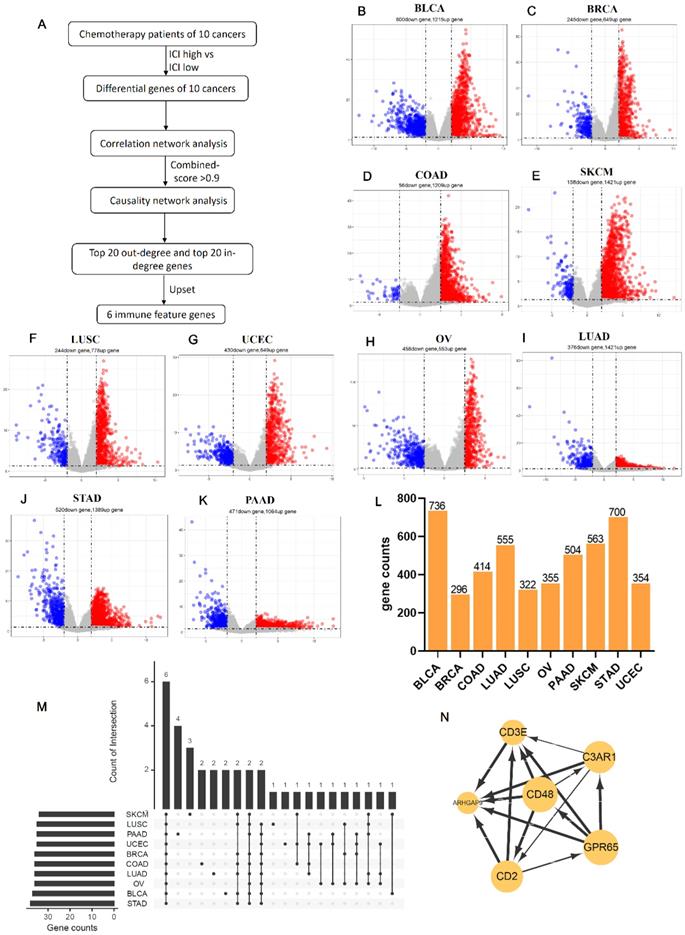
Identifies six co-owned chemotherapy associated immune feature genes through correlation and causal network analysis
Due to the prediction efficiency of ICI index is not fully confirmed so far, we analyzed which genes were related with chemotherapy benefit based on the transcriptome data (Figure 5A). In order to make the ICI group more credible, according to the value of ICI index, we selected the front 2/3 chemotherapy patients of high ICI group and the latter 2/3 chemotherapy patients of low ICI group to analyze differential immune feature genes (Figure 5B- K). Then, we calculated the correlation among these genes, and retained genes with combined score >0.9 (Figure 5L). Next, we selected top 60 immune feature genes based on the degree to execute the Bayesian causal network analysis, and drew these networks with weight >0.5 (Figure S2A-J). Finally, we extracted the top 20 in-degree and top 20 out-degree genes as the hub nodes of each cancer (Table 1) and identified six co-owned immune feature genes (CD48, GPR65, C3AR1, CD2, CD3E and ARHGAP9) in these cancers (Figure 5M). These genes were closely interacted in overall chemotherapy patients (Figure 5N).
Identifies six co-owned chemotherapy associated immune feature genes through correlation and causal network analysis. (A) The flow chart showed how we determined chemotherapy associated immune feature genes by correlation and causal network analysis. (B-K) The volcano showed differential immune feature genes of 10 cancers. Blue indicates down-regulated genes, and red indicates up-regulated genes. (L) The histogram showed the number of genes screened by the combined score >0.9 after correlation network analysis of differential immune feature genes. (M) Upset displayed top 20 out-degree and top 20 in-degree genes obtained after causal network analysis. (N) The network relationship of chemotherapy associated immune feature genes in all chemotherapy patients.
Construct a prediction model of chemotherapy benefit
Based on the expression of six co-owned immune feature genes in chemotherapy patients, a regression model was first constructed with multivariate cox (Figure S3A), and these patients were divided into three groups (high, medium, and low) according to the value of risk score (Figure 6A). Then, we selected the high and low groups to construct the random forest classifier model. By drawing the learning curve of n_estimators (Figure 6B) and performing grid search, we finally got the combination of each parameter of this model as RandomForestClassifier(n_estimators=11, max_depth=19, max_features=2, min_samples_leaf=1, min_samples_split=2). The weight of six immune feature genes was: 0.14771103, 0.19725147, 0.2050475, 0.15374589, 0.13619434 and 0.1600497, and the AUC was 0.83 (Figure 6C). Then, we extracted 30% of the total patients to verify the stability of this model and the AUC of 10 cancers all above 0.67 (Figure S3B-K). In addition, compared AUC of ICI index, we found that this model has higher AUC values in predicting the chemotherapy benefit (Table S6). Finally, we used two GEO datasets to validate the accuracy of this model, and we found that the AUC of GSE25055 and GSE14814 were 0.82 and 0.59, respectively (Figure 6D; Figure S3L). In general, this model has good efficacy in predicting the benefit of chemotherapy.
Construction of a chemotherapy benefit prediction model and potential function analysis of immune feature genes. (A) Based on six immune feature genes to construct a multivariate cox model, chemotherapy patients were divided into three groups according to the risk score. (B) The learning curve of n_estimators from 0 to 200. (C) ROC curve of this model in the test set. (D) ROC curve of this model in validation sets of GSE25055. (E) Boxplots show the functional similarity of six immune feature genes. The line in the box represents the average value of functional similarity. Proteins with high average functional similarity (cut-off >0.6) are considered interacting proteins. The dashed line indicates the cut-off value. (F, G) Display of biological functions and signal pathways enriched by immune feature genes.
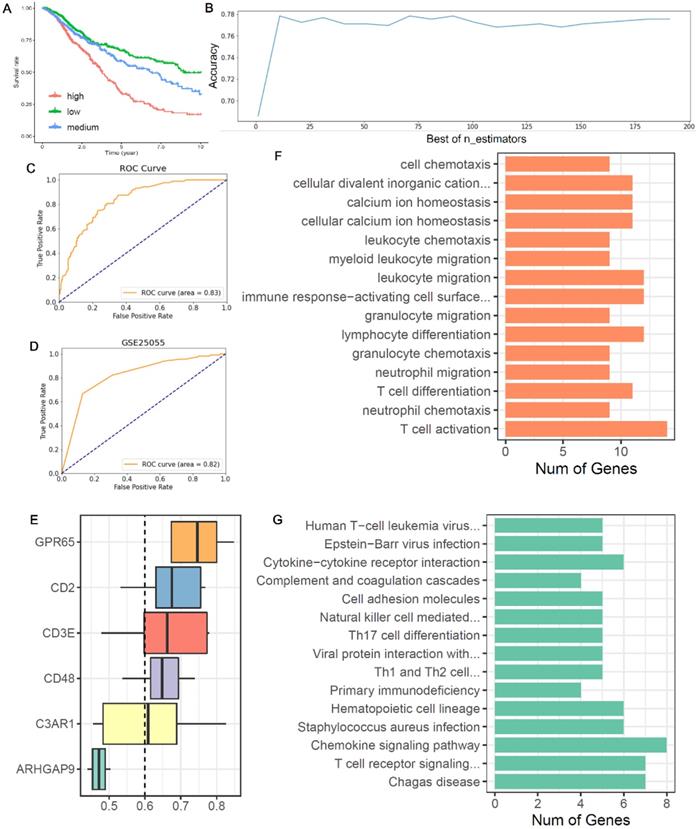
Potential functions of six co-owned immune feature genes
From the boxplot, we could see that there were five genes (CD48, GPR65, C3AR1, CD2 and CD3E) above the cutoff value, indicating that these genes performed similar biological functions (Figure 6E). Next, we analyzed the biological functions of these immune feature genes. We found that these genes were mainly enriched in the “leukocyte chemotaxis”, “myeloid leukocyte migration”, “lymphocyte differentiation”, “T cell differentiation” and “T cell activation” (Figure 6F). And KEGG pathway analysis found that these genes were mainly enriched in “cytokine-cytokine receptor interaction”, “Th17 cell differentiation”, “chemokine signaling pathway” and “T cell receptor signaling pathway” (Figure 6G).
Discussion
Compared with other cancer treatments, chemotherapy has the advantages of non-invasive and good compliance in patients [28], but also brings great harm to the patient's body [29, 30]. It is still inconclusive in clinical for which population of cancer patients could benefit from chemotherapy certainly. How to divide patients into benefit subset or non-benefit subset remains the wildly discussed issue in clinical treatment of cancer nowadays [31]. Whether patients could benefit from chemotherapy or not, partly depend on the unique cancer immune microenvironment of themselves [32, 33], ICI index which arisen from ESTIMATE analyzing of cancer transcriptome data could serve as a biomarker for chemotherapy benefit prediction [13, 14]. As considering the variety of immune infiltration cells and their differential responses to chemotherapy, the efficiency of ICI index in prediction of chemotherapy benefit remains to be discussed in depth. In our work, we extended the conclusion in BLCA, BRCA, COAD, SKCM, LUSC, UCEC and OV, that high ICI index could instruct chemotherapy benefit in 932 patients based on TCGA datasets (P <0.05). And we found that the components of TIICs in the high/low ICI index group of chemotherapy patients and their interaction in with/without chemotherapy patients were diverse among different cancers. It offered the evidence that ICI index was not exactly right for the benefit prediction of chemotherapy in cancer patients, since ICI index only reflected the whole immune cell infiltration state.
Recently, studies also suggested that specific TIIC not total TIICs could indicate the therapeutic benefit of chemotherapy [34]. In our study, we found that the interaction among TIICs was more frequent in patients within chemotherapy as contrasted to patients without chemotherapy (Figure 4C, D; Figure S1A-H). While tight interaction between CD8+ T cells and CD4+ memory resting T cells after chemotherapy often indicated the extending survival in patients (Figure 4A). These findings bring us the new vision, that is, it may be possible to establish a new benefit prediction method for cancer chemotherapy through isolating chemotherapy associated immune features.
Network analysis is different from conventional difference analysis, which could help us to detect key node factors related to event occurrence from omics data. In this study, by performing correlation and causal network analysis on the cancer transcriptome data, we isolated 40 chemotherapy associated immune feature genes of each cancer (BLCA, BRCA, COAD, SKCM, LUSC, UCEC and OV), and identified six co-owned immune feature genes: CD48, GPR65, C3AR1, CD2, CD3E and ARHGAP9. These genes were mainly enriched in the processing of “leukocyte chemotaxis”, “myeloid leukocyte migration”, “lymphocyte differentiation”, “T cell differentiation” and “T cell activation”. This is corresponding to the existed opinion that lymphocyte activation after chemotherapy indicates good drug response and survival benefit in patients [35].
In construction of the chemotherapy benefit prediction model within the selected six co-owned immune feature genes, we employed random forest classifying method to correct the weight of each feature genes. Total 973 cancer patients were included in model training, and 293 cancer patients were included in model testing, the AUC is 0.83, which exhibited better performance than ICI index in the prediction of chemotherapy benefit in cancer patients (Table S6). The performance efficiency of our model was finally validated with two external datasets GSE25055 (breast cancer, n=310) and GSE14814 (non-small cell lung cancer, n=131). All of this guarantee our model can be used for effective prediction of chemotherapy benefit in multiple cancers.
Conclusions
In this study, we confirmed that high ICI index was related with chemotherapy benefit in multiple cancers and exhibited that TIICs were diverse among different cancers as responding to chemotherapy. By executing correlation and causal network analysis on cancer transcriptome data, we isolated several chemotherapies associated immune feature genes which included six co-owned immune feature genes. A chemotherapy benefit prediction model was constructed within these six co-owned immune feature genes and its efficiency was validated in external datasets. In short, this work offers a novel model with a shrinking panel which has the potential to guide optimal chemotherapy in cancer.
Supplementary Material
Supplementary table 1: Clinic parameters of enrolled patients of 10 cancers.
Supplementary table 2: Grouping of cancer patients.
Supplementary table 3: Correlation network of pan-cancer.
Supplementary table 4: Degree of correlation network in pan-cancer.
Supplementary table 5: Causal network gene pairs with weight 0.5 of 10 cancers.
Supplementary table 6: Value of AUC between ICI and 6 genes model.
Acknowledgements
Ethical approval statement
All experimental procedures used in this study were performed in accordance with the approved guidelines of the ethical board of West China Hospital of Sichuan University.
Funding
This work was supported by the 1.3.5 Project for Disciplines of Excellence, West China Hospital, Sichuan University (ZYGD18021 to Lunxu Liu, ZYJC18009 to Jiandong Mei), Key Science and Technology Program of Sichuan Province, China (2021YFS0024 to Lunxu Liu), Science and Technology Plan Project (No.2018JY0596 to Lin Ma) Sichuan Province, China.
Data Availability Statement
The datasets analyzed during this current study are available in TCGA (http://cancergenome.nih.gov/) and GEO (https://www.ncbi.nlm.nih.gov/geo, GSE25055 and GSE14814) data bases. The data are also available from the corresponding author (senyi_deng@scu.edu.cn) on reasonable request.
Competing Interests
The authors have declared that no competing interest exists.
References
1. Lane David. Designer combination therapy for cancer. Nature Biotechnology. 2006;24:163-4
2. Dickens E, Ahmed S. Principles of cancer treatment by chemotherapy. Surgery. 2018;36:134-8
3. Burdett S, Pignon JP, Tierney J, Tribodet H, Liang Y. Adjuvant chemotherapy for resected early-stage non-small cell lung cancer. Cochrane Database of Systematic Reviews. 2015;3:CD011430
4. Zhao J, Mierlo KV, Gómez-Ramírez J, Kim H, Pilgrim C, Pessaux P. et al. Systematic review of the influence of chemotherapy-associated liver injury on outcome after partial hepatectomy for colorectal liver metastases. British Journal of Surgery. 2017
5. Gustavsson B, Carlsson GR, Machover D, Petrelli N, Roth A, Schmoll HJ. et al. A Review of the Evolution of Systemic Chemotherapy in the Management of Colorectal Cancer. Clinical Colorectal Cancer. 2015;14:1-10
6. Hurria A, Mohile S, Gajra A, Klepin H, Muss H, Chapman A. et al. Validation of a Prediction Tool for Chemotherapy Toxicity in Older Adults With Cancer. Journal of Clinical Oncology Official Journal of the American Society of Clinical Oncology. 2016: 2366.
7. Binnewies M, Roberts EW, Kersten K, Chan V, Fearon DF, Merad M. et al. Understanding the tumor immune microenvironment (TIME) for effective therapy. Nature Medicine. 2018
8. Jochems C, Schlom J. Tumor-infiltrating immune cells and prognosis: the potential link between conventional cancer therapy and immunity. Experimental Biology & Medicine. 2011;236:567
9. Fridman WH, Galon J, Pagès F, Tartour E, Kroemer G. Prognostic and Predictive Impact of Intra- and Peritumoral Immune Infiltrates. Cancer Research. 2011;71:5601
10. Zamarron BF, Chen WJ. Dual Roles of Immune Cells and Their Factors in Cancer Development and Progression. International Journal of Biological Sciences. 2011;7:651-8
11. Bird Lucy. Tumour immunology: Metastasis in action. Nature Reviews Immunology. 2016
12. Erdag G, Schaefer JT, Smolkin ME, Deacon DH, Shea SM, Dengel LT. et al. Immunotype and immunohistologic characteristics of tumor-infiltrating immune cells are associated with clinical outcome in metastatic melanoma. Cancer Research. 2012;72:1070-80
13. König L, Mairinger FD, Hoffmann O, Bittner AK, Schmid KW, Kimmig R. et al. Dissimilar patterns of tumor-infiltrating immune cells at the invasive tumor front and tumor center are associated with response to neoadjuvant chemotherapy in primary breast cancer. BMC Cancer. 2019 19
14. Halama N, Michel S, Kloor M, Zoernig I, Pommerencke T, Doeberitz M. et al. The localization and density of immune cells in primary tumors of human metastatic colorectal cancer shows an association with response to chemotherapy. Cancer Immunity A Journal of the Academy of Cancer Immunology. 2009;9:1
15. Gaudreau PO, Negrao MV, Mitchell KG, Reuben A, Gibbons DL. Neoadjuvant Chemotherapy Increases Cytotoxic T Cell, Tissue Resident Memory T Cell, and B Cell Infiltration in Resectable NSCLC. Journal of Thoracic Oncology. 2020
16. Interaction between Molecular Subtypes and Stromal Immune Infiltration before and after Treatment in Breast Cancer Patients Treated with Neoadjuvant Chemotherapy. Clinical cancer research: an official journal of the American Association for Cancer Research. 2019; 25: 6731-41.
17. García-Martínez E, Gil G, Benito A, González-Billalabeitia E, Conesa M, García T. et al. Tumor-infiltrating immune cell profiles and their change after neoadjuvant chemotherapy predict response and prognosis of breast cancer. Breast Cancer Research. 2014;16:488
18. Zhu Y, Fu H, Liu Z, Ye D, Zhang J. Stromal immunotype predict survival and benefit from adjuvant chemotherapy in patients with muscle invasive bladder cancer. European Urology Supplements. 2018;17:e1338-e40
19. Schwartz LH, Litière S, Vries ED, Ford R, Seymour L. RECIST 1.1—Update and clarification: From the RECIST committee. European journal of cancer (Oxford, England: 1990). 2016;62:132-7
20. Yoshihara K, Shahmoradgoli M, Martínez E, Vegesna R, Kim H, Torres-Garcia W. et al. Inferring tumour purity and stromal and immune cell admixture from expression data. Nature Communications. 2013 4
21. Gentles AJ, Newman AM, Liu CL, Bratman SV, Feng W, Kim D. et al. The prognostic landscape of genes and infiltrating immune cells across human cancers. Nature Medicine.
22. Smyth GK. edgeR: a Bioconductor package for differential expression analysis of digital gene expression data. Bioinformatics. 2010;26:139
23. Damian S, Gable AL, David L, Alexander J, Stefan W, Jaime HC. et al. STRING v11: protein-protein association networks with increased coverage, supporting functional discovery in genome-wide experimental datasets. Nucleic acids research. 2018: D607.
24. Scutari M. Learning Bayesian Networks with the bnlearn R Package. Journal of Statistical Software. 2010 35
25. Shannon P. Cytoscape: A Software Environment for Integrated Models of Biomolecular Interaction Networks. Genome Research. 2003;13:2498-504
26. Pedregosa F, Varoquaux G, Gramfort A, Michel V, Thirion B, Grisel O. et al. Scikit-learn: Machine Learning in Python. Journal of Machine Learning Research. 2011;12:2825-2830
27. Fridman W, Galon J, Dieunosjean M, Cremer I, Fisson S, Damotte D. et al. Immune infiltration in human cancer: prognostic significance and disease control. current topics in microbiology & immunology. 2011;344:1
28. Donovan LE, Lassman AB. Chemotherapy Treatment and Trials in Low-Grade Gliomas. Neurosurgery Clinics of North America. 2019;30:103-9
29. Thavendiranathan P, Poulin F, Lim KD, Plana JC, Woo A, Marwick TH. Use of myocardial strain imaging by echocardiography for the early detection of cardiotoxicity in patients during and after cancer chemotherapy: a systematic review. Journal of the American College of Cardiology. 2014;63:2751-68
30. Hutchinson AD, Hosking JR, Kichenadasse G, Mattiske JK, Wilson C. Objective and subjective cognitive impairment following chemotherapy for cancer: A systematic review. Cancer Treatment Reviews. 2012;38:926-34
31. Orlando PA, Gatenby RA, Brown JS. Cancer treatment as a game: integrating evolutionary game theory into the optimal control of chemotherapy. Physical Biology. 2012;9:065007
32. Tellez-Gabriel M, Heymann MF, Heymann D. Circulating Tumor Cells as a Tool for Assessing Tumor Heterogeneity. Theranostics. 2019 9
33. Kuliczkowski K, Podolak-Dawidziak M. Immunological aspects of cancer chemotherapy. Nature Reviews Immunology. 2009;8:59-37
34. Tvde A, Hgvdb A, Nmh A, Ej B, Slm C, Sd D. et al. Priming the tumor immune microenvironment with chemo(radio)therapy: A systematic review across tumor types. Biochimica et Biophysica Acta (BBA) - Reviews on Cancer. 1874.
35. Cho IR, Park JC, Chan HP, Jo JH, Yong CL. Pre-treatment neutrophil to lymphocyte ratio as a prognostic marker to predict chemotherapeutic response and survival outcomes in metastatic advanced gastric cancer. Gastric Cancer Official Journal of the International Gastric Cancer Association & the Japanese Gastric Cancer Association. 2014;17:703-10
Author contact
![]() Corresponding authors: Senyi Deng, M.D., Ph.D. Email: senyi_dengedu.cn. Lunxu Liu, M.D., Ph.D., FRCS. Email: lunxu_liucom.
Corresponding authors: Senyi Deng, M.D., Ph.D. Email: senyi_dengedu.cn. Lunxu Liu, M.D., Ph.D., FRCS. Email: lunxu_liucom.