Impact Factor ISSN: 1837-9664

 Global reach, higher impact
J Cancer 2021; 12(14):4229-4239. doi:10.7150/jca.50472 This issue Cite
Research Paper
High Expression of RhoBTB3 Predicts Favorable Chemothrapy Outcomes in non-M3 Acute Myeloid Leukemia
Shuang-Hui Yang*, Wei Liu*, Jie Peng, Ya-Jing Xu, Yan-Feng Liu, Yan Li, Min-Yuan Peng, Zhao Ou-Yang, Cong Chen, En-Yi Liu ![]()
Department of Hematology, XiangYa Hospital, Central South University, XiangYa Road No.87, Changsha 410008, China.
*co-first authors.
Received 2020-7-8; Accepted 2021-4-25; Published 2021-5-17
Abstract

Background: The expression patterns and prognostic significance of the Rho family GTPases in acute myeloid leukemia have not been systematically studied yet.
Methods: In our study, we analyzed the expression patterns of 21 Rho family GTPases gene members in AML patients based on GEPIA database. 10 gene members with significant differential expression in AML tissue and healthy tissue were selected for subsequent research. Survival curve analysis in TCGA and GEO dataset preliminary showed that RhoBTB3 is related with the prognosis of non-M3 AML patients. The differential expression of RhoBTB3 on AML bone marrow and normal bone marrow was verified by RT-qPCR. We performed Kaplan-Meier survival analysis and Multivariate Cox analysis to assess the prognostic value of RhoBTB3 in non-M3 AML patients with different treatment regimens. Gene functional enrichment analysis of RhoBTB3 was performed using GO, KEGG and PPI network.
Results: The AML patients from TCGA database were partitioned into 2 groups based on different treatment regimens: chemotherapy group and allo-HSCT group. In chemotherapy group, patients with higher expression level of RhoBTB3 showed relatively longer OS and EFS, multivariate Cox analysis revealed high RhoBTB3 mRNA expression as an independent favorable prognostic factor. However, in allo-HSCT group, no significant difference of OS and EFS were found between RhoBTB3 high and low subgroups. Meanwhile, allo-HSCT could circumvent the unfavorable prognosis that was associated with downregulation of RhoBTB3. Functional enrichment analysis showed the association of RhoBTB3 expression with several fundamental physiological components and pathways, including extracellular matrix components, extracellular structure organization, and cytokine-cytokine receptor interaction.
Conclusions: Our study identified RhoBTB3 as a prognostic marker and may aid in the selection of the appropriate treatment options between chemotherapy and allo-HCST in non-M3 AML patients. Further researches are necessary to clarify the involvement of RhoBTB3 in the pathogenesis of AML.
Keywords: Rho family GTPases, RhoBTB3, acute myeloid leukemia, prognostic value, TCGA
Introduction
Acute myeloid leukemia (AML) is among the most common haematopoietic malignancies. Nowadays, fusion gene expression, gene mutation status, karyotype, and molecular classification may provide information on prognosis and therapeutic outcomes [1]. However, there are still many patients who cannot be classified by common indicators. We need to explore more indicators to further distinguish patients with good and poor prognosis and provide personalized treatment. The AML patients typically undergo chemotherapy, demethylation therapy, and transplantation therapy. The application of various new drugs tries to improve the prognosis of patients [2]. At the same time, people are also looking for new therapeutic targets.
The Rho family GTPases is found in nearly all eukaryotes. They are part of the Ras superfamily which is divided into two types, typical and atypical, on the basis of their regulation mode. The Rho family GTPases includes 21 members which are grouped into eight subfamilies. RhoA, RhoB, and RhoC are assigned to the Rho subfamily. Rac1, Rac2, Rac3, and RhoG are assigned to the Rac subfamily. Cdc42, RhoJ, and RhoQ are members of the Cdc42 subfamily. RhoD and RhoF are members of the RhoD/RhoF subfamily. Rnd1, Rnd2, and Rnd3 are members of the Rnd subfamily. RhoH is the only member of the RhoH subfamily. RhoU and RhoV are members of the RhoU/RhoV subfamily. RhoBTB1, RhoBTB2, and RhoBTB3 are members of the RhoBTB subfamily. They participate in various kinds of cellular processes, including proliferation, cell cycle regulation, cytoskeletal regulation, polarity as well as migration, and gene expression regulation [3-5]. The family genes participate in the pathological process of many diseases [6-9]. Furthermore, the Rho family GTPases has attracted increasing interest in research on its potential role in cancer development. For instance, RhoA is highly expressed in multiple myeloma and plays an critica role in chemotaxis and adhesion [10]. RhoA frequently mutated in EB-virus positive diffuse large B-cell lymphoma [11]. Research shows that in renal cell carcinoma, RhoB may serve a tumor suppressor gene. Overexpression of RhoB inhibited tumor cell proliferation and also facilitated their apoptosis [12]. RhoC is associated with angiogenesis and matrix remodeling of liver cancer cells [13]. In lung cancer, RhoC participated in the course of epithelial-mesenchymal transition induced by TGF-β1 in cancer cells [14]. In breast cancer, overexpression of Rac1 is related to multidrug resistance [15]. Previous studies have unveiled that the Rho family GTPases could be a potential target in cancer treatment. However, the Rho family GTPases have not been systematically studied in AML. Therefore, in our study, we determined the expression of Rho family GTPases members in some public databases to determine their clinical value and potential therapeutic value in AML.
Materials and Methods
Database Analysis
GEPIA (gepia.cancer-pku.cn) is a database for gene expression profiling and interactive analyses in cancer tissue and healthy tissue [16]. The differential expression of Rho family GTPases gene members in AML bone marrow samples (from TCGA data) and healthy donor bone marrow samples (from GTEx data) was compared in GEPIA. TCGA (cancergenome.nih.gov) is a database that contains sequencing data from patients of 33 different tumor types [17]. We used TCGAbiolinks to download AML mRNA data [18]. Since compared with other subtypes of AML, the M3 subtype AML has its own biological characteristics and favorable outcomes, this study only included non-M3 AML patients. The cBioPortal (www.cbioportal.org) is a website that integrates data from TCGA, CCLE, and several independent large-scale tumor research projects [19]. The gene expression and clinical information of non-M3 AML were used for further analysis of the Rho GTPases genes. The GEO database (www.ncbi.nlm.nih.gov/geo) is a database funded and maintained by the National Center for Biotechnology Information. The gene expression profile dataset from GSE71014 was based on an Illumina chip and included 104 samples of AML patients.
DEGs and PPI analysis
To identify the genes related with RhoBTB3, we further analyzed differentially expressed genes (DEGs) between the RhoBTB3 high and low group according to the median expression level among non-M3 AML cases in TCGA. The edgeR package analyzed DEGs associated with RhoBTB3. For DEGs significance, P< 0.05 and fold change>2 (| log2FC |> 1) were recognized as the cut-off criteria.
The volcano plot was drawn with the ggplot2 package. The heat map was drawn with the pheatmap package. The ClusterProfiler R package was for identifying GO and KEGG enrichment [20]. We also applied STRING to develop the PPI network [21]. The protein interaction was visualized using cytoscape software. P < 0.05 was considered to be of significance.
Statistical analysis
The association between gene expression and clinicopathological characters was tested using the Mann-Whitney test, Fisher's exact test or χ2 test. The univariate Cox regression analyses were used for evaluating associations of the variables with OS and EFS. The variables included RhoBTB3 expression level, age, gender, WBC count, and RUNX1, TP53, ASXL1, NPM1, FLT3-ITD, biCEBPA mutation statuses. The multivariate Cox regression analyses were performed to analyse independent prognostic factors for patient survival. In multivariate Cox regression model, above variables were assessed by stepwise analysis (backward:LR). The data was analysed using SPSS 25.0 software (IBM, NY, USA). GraphPad Prism 8 software (GraphPad, San Diego, USA) was used to generate and analyze survival curves (log-rank test). P<0.05 was considered to be of significance throughout.
Bone marrow samples and Quantitative real-time PCR
For further verification, bone marrow samples from 16 diagnosed non-M3 AML patients were collected, and 16 bone marrow samples from nonhematological malignancies conditions such as healthy donors for hematopoietic stem cell transplantation, iron deficiency anemia, megaloblastic anemia, or idiopathic thrombocytopenic purpura were collected as comparison. This study was authorized by Medical Ethics Committee of Xiangya hospital, Central South University. All patients signed informed consents. Total RNA of samples was isolated using TRIzol reagent (Invitrogen) and then reversely transcribed using reverse transcription kit (TaKaRa). Primers for real-time PCR were from Sangon Biotech. The sequences of primer were as follows: RhoBTB3 forward 5'-CCGAGATGTACCAAGTGTCCAG-3', RhoBTB3 reverse 5'-GCCAGGTTGAAAGGCAATCAGAG-3', Actin forward 5'-CCATCATGAAGTGTGACG-3', Actin reverse 5'-GCCGATCCACACGGAGTA-3'.
Results
Rho family GTPases genes are differentially expressed in AML bone marrow and normal bone marrow
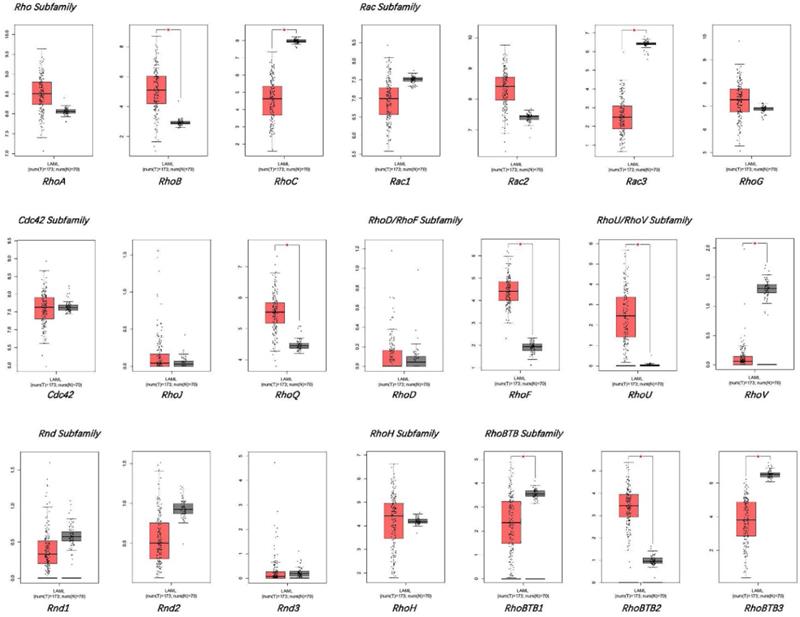
GEPIA database was used for comparing the mRNA levels of the Rho family GTPases genes between bone marrow samples of AML patients and healthy donors (Figure 1). The results displayed that the mRNA expression levels of Rac3, RhoBTB1, RhoBTB3, RhoC, and RhoV significantly decreased in AML bone marrow, while the mRNA expression levels of RhoB, RhoBTB2, RhoF, RhoQ, and RhoU significantly increased in AML bone marrow compared to healthy samples (P < 0.05). The expression level of other genes in the Rho family GTPases was not significantly different between the AML bone marrow tissues and the corresponding healthy tissues in the GEPIA database. These findings suggest that the significant differential expressed genes may be associated with AML tumorigenesis and progression.
The expression of Rho family GTPases gene members in AML and healthy controls.
RhoBTB3 may be a potential biomarker for AML prognosis
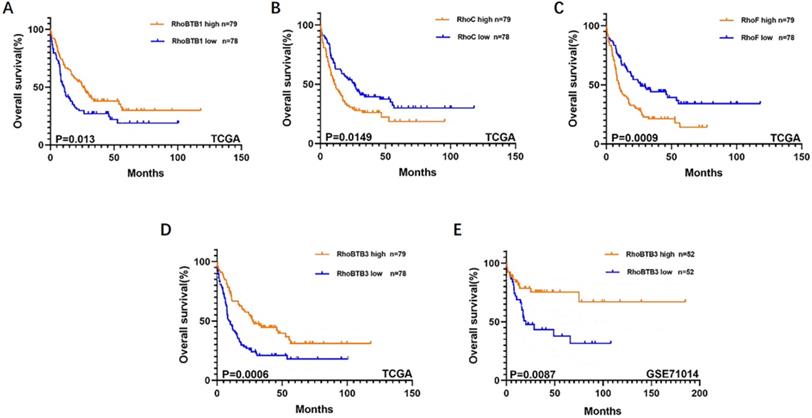
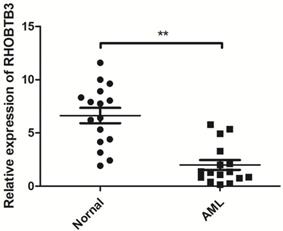
To further explore the role of the Rho family GTPases gene members in the survival of non-M3 AML patients, we selected the aforementioned Rho family GTPases genes with significant differential expression in AML tissue and healthy tissue for subsequent research. Using TCGA data, we performed survival curve analysis of the differentially expressed Rho family GTPases genes such as Rac3, RhoBTB1, RhoBTB3, RhoC, RhoV, RhoB, RhoBTB2, RhoF, RhoQ, and RhoU in non-M3 AML patients. The patients were grouped into gene expression high group and gene expression low group based on the median expression values of the above genes. The overall survival (OS) of patients with non-M3 AML was associated with the mRNA expression levels of RhoBTB1, RhoBTB3, RhoC, and RhoF, as indicated by the survival curve (log‑rank test, P<0.05) (Figure 2A-D). The patients with non-M3 AML with increased RhoBTB1 and RhoBTB3 mRNA expression levels or decreased RhoC and RhoF mRNA expression levels were predicted to have favorable OS. A similar prognostic impact of RhoBTB3 expression was also present in patients with non-M3 AML in another independent cohort GSE71014 (Figure 2E). Therefore, relatively high expression of RhoBTB3 may represent a favorable prognostic factor for non-M3 AML. Thus, we focused on RhoBTB3 gene expression in subsequent analyses and further verified that RhoBTB3 is differentially expressed in AML and contrast group using qRT-PCR (Figure 3).
Kaplan-Meier survival analysis on relationship between different genes and OS of non-M3 AML patients. RhoBTB1 (A), RhoC (B), RhoF (C), and RhoBTB3 (D) expression levels were significantly associated with OS in the TCGA. RhoBTB3 (E) expression levels was significantly associated with OS in the GSE71014.
The expression of RhoBTB3 mRNA in AML and controls.
Associations of RhoBTB3 level with clinical and molecular features
The non-M3 AML patients from TCGA dataset were separated into chemotherapy group and allo-HSCT group based on treatment regimens. The patients in each group were further subgrouped according to median expression levels of RhoBTB3. The associations between RhoBTB3 expression levels and clinical characteristics as well as molecular features in both groups are shown in Table 1. In chemotherapy group, high RhoBTB3 subgroup had more favorable karyotype and more female than low RhoBTB3 subgroup. Two subgroups of patients with chemotherapy revealed different distribution characteristics of the FAB subtype. In allo-HSCT group, high RhoBTB3 subgroup had younger patients than low RhoBTB3 group. But the patient was divided into different age groups based on 60 years old, no difference was found in the subgroups with RhoBTB3 expression level.
Comparison of clinicopathological parameters with RhoBTB3 expression in patients (n=157)
| Variables | Chemotherapy group | Allo-HSCT group | ||||
|---|---|---|---|---|---|---|
| High RhoBTB3 (n=46) | Low RhoBTB3 (n=45) | P | High RhoBTB3 (n=33) | Low RhoBTB3 (n=33) | P | |
| Age/years, median (range) | 65 (22-76) | 66 (25-88) | 0.406 | 49 (18-65) | 55 (21-72) | 0.030 |
| Age group/n (%) | 0.717 | 0.097 | ||||
| <60 years | 17 (36.96) | 15 (33.33) | 27 (81.82) | 21 (63.64) | ||
| ≥60 years | 29 (63.04) | 30 (66.67) | 6 (18.18) | 12 (36.36) | ||
| Gender/n (%) | 0.046 | 0.319 | ||||
| Female | 27 (58.70) | 17 (37.78) | 12 (36.36) | 16 (48.48) | ||
| Male | 19 (41.30) | 28 (62.22) | 21 (63.64) | 17 (51.52) | ||
| WBC (×109/L)/median (range) | 13.7 (1.7-297.4) | 16 (0.7-137.2) | 0.738 | 32.4 (0.6-223.8) | 29.7 (0.8-118.8) | 0.423 |
| BM blast /(%), median (range) | 69.5 (30-99) | 75 (32-98) | 0.433 | 70 (30-100) | 72 (39-97) | 0.677 |
| PB blast/(%), median (range) | 47 (0-98) | 13 (0-87) | 0.012 | 62 (0-96) | 45 (0-87) | 0.076 |
| FAB subtype/n (%) | 0.043 | 0.109 | ||||
| M0 | 1 (2.17) | 6 (13.33) | 2 (6.06) | 7 (21.21) | ||
| M1 | 15 (32.61) | 6 (13.33) | 13 (39.39) | 10 (30.30) | ||
| M2 | 14 (30.43) | 8 (17.78) | 11 (33.33) | 5 (15.15) | ||
| M4 | 10 (21.74) | 12 (26.67) | 5 (15.15) | 7 (21.21) | ||
| M5 | 4 (8.70) | 11 (24.44) | 0 (0.00) | 3 (9.09) | ||
| M6 | 0 (0.00) | 1 (2.22) | 1 (3.03) | 0 (0.00) | ||
| M7 | 1 (2.17) | 1 (2.22) | 0 (0.00) | 1 (3.03) | ||
| NC | 1 (2.17) | 0 (0.00) | 1 (3.03) | 0 (0.00) | ||
| RUNX1/n (%) | 0.440 | 0.720 | ||||
| Widtype | 43 (93.48) | 40 (88.89) | 29 (87.88) | 28 (84.85) | ||
| Mutation | 3 (6.52) | 5 (11.11) | 4 (12.12) | 5 (15.15) | ||
| TP53/n (%) | 0.316 | 0.555 | ||||
| Widtype | 42 (91.30) | 38 (84.44) | 32 (96.97) | 31 (93.94) | ||
| Mutation | 4 (8.70) | 7 (15.56) | 1 (3.03) | 2 (6.06) | ||
| ASXL1/n (%) | 0.570 | 1.000 | ||||
| Widtype | 44 (95.65) | 44 (97.78) | 32 (96.97) | 32 (96.97) | ||
| Mutation | 2 (4.35) | 1 (2.22) | 1 (3.03) | 1 (3.03) | ||
| NPM1/n (%) | 0.100 | 0.057 | ||||
| Widtype | 35 (76.09) | 27 (60.00) | 27 (81.82) | 20 (60.61) | ||
| Mutation | 11 (23.91) | 18 (40.00) | 6 (18.18) | 13 (39.39) | ||
| FLT3-ITD/n (%) | 0.146 | 0.085 | ||||
| Absence | 37 (80.43) | 41 (91.11) | 28 (84.85) | 22 (66.67) | ||
| Presence | 9 (19.57) | 4 (8.89) | 5 (15.15) | 11 (33.33) | ||
| biCEBPA/n (%) | 0.157 | 0.076 | ||||
| Absence | 44 (95.65) | 45 (100.00) | 30 (90.91) | 33 (100.00) | ||
| Presence | 2 (4.35) | 0 (0.00) | 3 (9.09) | 0 (0.00) | ||
| Karyotype/n (%) | 0.007 | 0.244 | ||||
| Favorable | 8 (17.39) | 0 (0.00) | 4 (12.12) | 1 (3.03) | ||
| Intermediate | 31 (67.39) | 32 (71.11) | 23 (69.70) | 22 (66.67) | ||
| Adverse | 7 (15.22) | 13 (28.89) | 6 (18.18) | 10 (30.30) | ||
Abbreviations: WBC: white blood cell; PB: peripheral blood; BM: bone marrow; FAB: French American British.
Prognostic value of RhoBTB3 expression in non-M3 AML
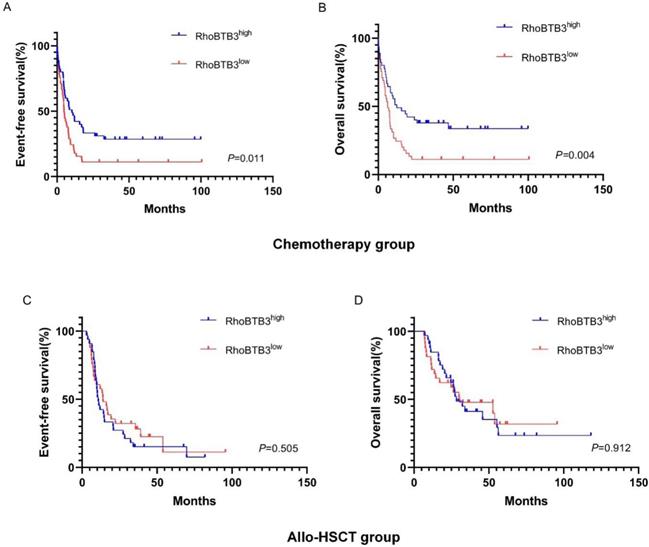
In chemotherapy group, high RhoBTB3 subgroup showed better EFS and OS (both P<0.05) than low RhoBTB3 subgourp (Figure 4A-4B). However, RhoBTB3 expression were not associated with EFS and OS in allo-HCST patients (Figure 4C-4D). The findings indicated that high RhoBTB3 might be a beneficial factor in non-M3 AML patientis that administered chemotherapy treatment.
Kaplan-Meier survival analysis of EFS and OS between chemotherapy group and allo-HSCT groups. (A, B) In chemotherapy group (n=91), high RhoBTB3 subgroup had longer EFS and OS than low subgroup. (C, D) In allo-HSCT group (n=66), no significant difference for EFS and OS were found in high and low RhoBTB3 subgroup analysis.
In chemotherapy group, results from multivariate Cox analysis revealed that WBC ≥100×109/L, age ≥60 years, and mutation in TP53 were unfavorable prognostic factors for both EFS and OS (P<0.05, Table 2), while high RhoBTB3 expression was determined as an independent favorable prognositc factor for both EFS and OS (P<0.05, Table 2). In addition, ASXL1 mutation turned out an independent poor prognostic factor for OS only (P<0.05, Table 2).
Univariate and Multivariate analyses in patients (n=91) with chemotherapy
| EFS | OS | |||
|---|---|---|---|---|
| HR (95%CI) | P-value | HR (95%CI) | P-value | |
| Univariate analysis | ||||
| RhoBTB3 (High vs Low) | 0.569 (0.356-0.909) | 0.018 | 0.518 (0.320-0.838) | 0.007 |
| age (≥60 vs <60) | 3.375 (1.937-5.879) | <0.001 | 3.156 (1.792-5.560) | <0.001 |
| Gender (Male vs Female) | 1.036 (0.655-1.640) | 0.879 | 1.168 (0.730-1.868) | 0.518 |
| WBC (≥100 vs <100×109) | 1.247 (0.620-2.508) | 0.537 | 1.328 (0.658-2.681) | 0.428 |
| RUNX1 mutation(Yes vs No) | 1.539 (0.736-3.221) | 0.252 | 1.673 (0.798-3.508) | 0.173 |
| TP53 mutation (Yes vs No) | 3.217 (1.645-6.292) | 0.001 | 3.136 (1.608-6.115) | 0.001 |
| ASXL1 mutation (Yes vs No) | 1.840 (0.573-5.912) | 0.306 | 1.857 (0.579-5.956) | 0.298 |
| NPM1 mutation (Yes vs No) | 1.211 (0.742-1.975) | 0.443 | 1.046 (0.631-1.733) | 0.861 |
| FLT3-ITD mutation (Yes vs No) | 1.057 (0.556-2.008) | 0.866 | 0.832 (0.413-1.676) | 0.606 |
| biCEBPA mutation (Yes vs No) | 0.388 (0.054-2.798) | 0.348 | 0.427 (0.059-3.080) | 0.399 |
| Multivariate analysis | ||||
| RhoBTB3 (High vs Low) | 0.576 (0.359-0.922) | 0.022 | 0.501 (0.307-0.818) | 0.006 |
| age (≥60 vs <60) | 3.607 (1.973-6.595) | <0.001 | 3.352 (1.817-6.187) | <0.001 |
| WBC (≥100 vs <100×109) | 2.361 (1.112-5.011) | 0.025 | 2.495 (1.171-5.320) | 0.018 |
| TP53 mutation (Yes vs No) | 2.341 (1.173-4.670) | 0.016 | 2.503 (1.247-5.026) | 0.010 |
| ASXL1 mutation (Yes vs No) | - | - | 3.343 (1.004-11.134) | 0.049 |
In allo-HSCT group, results from multivariate Cox analysis demonstrated that FLT3-ITD was independently associated with worse EFS (P<0.05, Table 3). TP53 mutation and FLT3-ITD were independently associated with worse OS (P<0.05, Table 3).
Univariate and Multivariate analyses in patients (n=66) with Allo-HSCT
| EFS | OS | |||
|---|---|---|---|---|
| HR (95%CI) | P-value | HR (95%CI) | P-value | |
| Univariate analysis | ||||
| RhoBTB3 (High vs Low) | 1.200 (0.701-2.055) | 0.506 | 1.036 (0.552-1.946) | 0.912 |
| age (≥60 vs <60) | 0.845 (0.459-1.556) | 0.588 | 1.195 (0.579-2.468) | 0.629 |
| Gender (Male vs Female) | 0.954 (0.550-1.657) | 0.869 | 0.805 (0.427-1.516) | 0.502 |
| WBC (≥100 vs <100×109) | 1.537 (0.602-3.924) | 0.369 | 2.212 (0.756-6.470) | 0.147 |
| RUNX1 mutation (Yes vs No) | 0.762 (0.325-1.787) | 0.532 | 1.256 (0.485-3.249) | 0.639 |
| TP53 mutation (Yes vs No) | 1.650 (0.509-5.346) | 0.404 | 4.559 (1.319-15.755) | 0.016 |
| ASXL1 mutation (Yes vs No) | 0.679 (0.164-2.803) | 0.593 | 0.518 (0.071-3.789) | 0.517 |
| NPM1 mutation (Yes vs No) | 0.863 (0.475-1.567) | 0.628 | 0.904 (0.450-1.816) | 0.776 |
| FLT3-ITD mutation (Yes vs No) | 1.934 (1.041-3.591) | 0.037 | 2.029 (0.969-4.247) | 0.061 |
| biCEBPA mutation (Yes vs No) | 0.617 (0.150-2.546) | 0.504 | 0.712 (0.169-2.989) | 0.642 |
| Multivariate analysis | ||||
| TP53 mutation (Yes vs No) | - | - | 5.732 (1.611-20.398) | 0.007 |
| FLT3-ITD mutation (Yes vs No) | 1.934 (1.041-3.591) | 0.037 | 2.288 (1.076-4.866) | 0.031 |
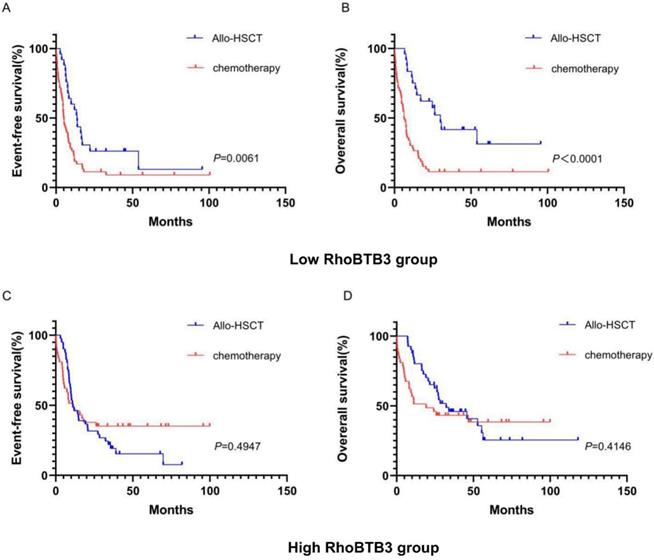
To explore whether the allo-HSCT treatment could overcome the poorer prognosis caused by down-regulation of RhoBTB3 expression, patients with non-M3 AML in the TCGA database were delivered into two groups (high RhoBTB3, n =79, low RhoBTB3, n =78) according to the median values of RhoBTB3 expression. In the low RhoBTB3 expression group, patients who received allo-HSCT treatment had significantly longer EFS (P<0.05, Figure 5A) and OS (P<0.05, Figure 5B) than the patients with just chemotherapy treatment only. However, we found no differences in EFS and OS between the allo-HSCT subgroup and the chemotherapy subgroup in the high RhoBTB3 expression group (Figure 5C and Figure 5D). We speculate allo-HSCT may overcome the adverse prognostic effects that are related to downregulated RhoBTB3 expression in AML.
Kaplan-Meier survival analysis of EFS and OS in low RhoBTB3 group and high RhoBTB3 group. (A, B) In low RhoBTB3 group, patients receiving allo-HSCT (n=53) showed significantly better EFS and OS than who received chemotherapy (n=25). (C, D) In high RhoBTB3 group, no significant difference of EFS and OS were found between patients receiving allo-HSCT (n=41) and chemotherapy (n=38).
GO terms and KEGG pathway enrichment analysis of DEGs between RhoBTB3 high versus RhoBTB3 low samples
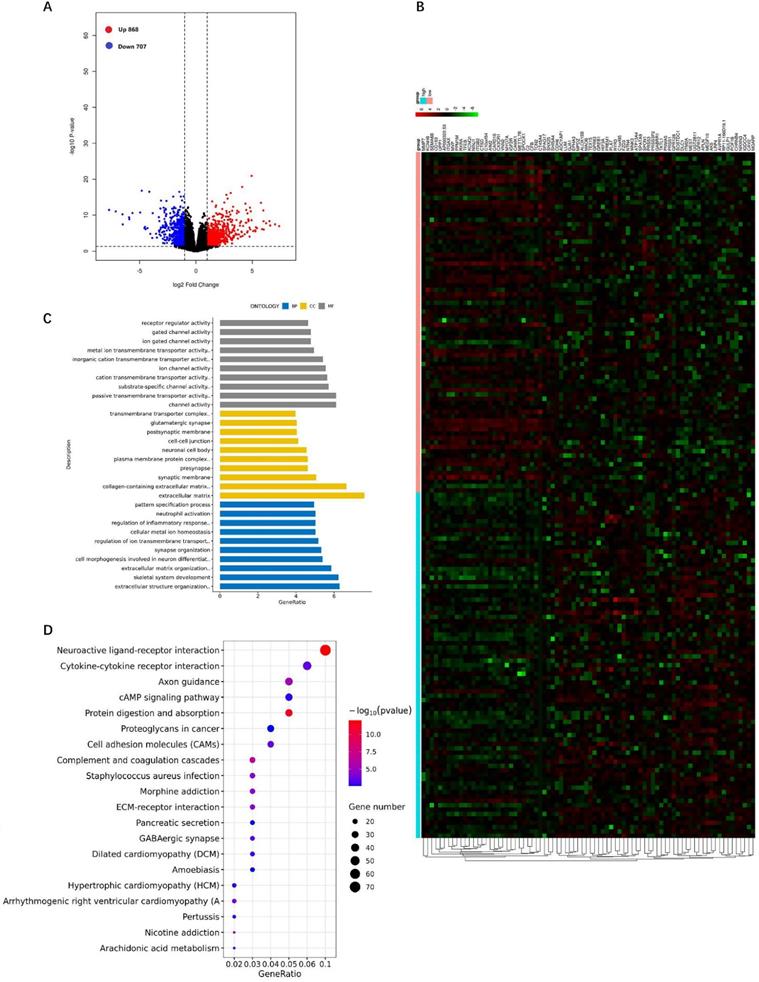
We analyzed the DEGs of the RhoBTB3 high group versus the RhoBTB3 low group among non-M3 AML cases in TCGA. The results revealed that the expression level of RhoBTB3 was positively associated with 868 up-regulated genes and 707 down-regulated genes (P< 0.05 and | log2FC |> 1, Figure 6A). The heatmap showed the top 40 upregulated and 40 downregulated genes (Figure 6B). We analyzed DEGs using enriched GO terms and KEGG pathways. In the GO analysis, most DEGs among the molecular function terms were enriched in passive transmembrane transporter activity (GO: 0022803) and channel activity (GO: 0015267) (Figure 6C). Among the cellular component terms in the GO analysis, most DEGs were enriched in the extracellular matrix (GO: 0031012) as well as collagen-containing extracellular matrix (GO: 0062023) (Figure 6C). Among the terms of biological process in the GO analysis, most DEGs were enriched in skeletal system development (GO: 0001501) and extracellular structure organization (GO: 0043062) (Figure 6C). In the KEGG analysis results, neuroactive ligand-receptor interaction (hsa04080) and cytokine-cytokine receptor interaction (hsa04060), as well as protein digestion and absorption (hsa04974) were the most enriched pathways (Figure 6D).
DEGs between the RhoBTB3 high versus RhoBTB3 low groups and GO and KEGG analysis. (A) Volcano plot of DEGs of the RhoBTB3 high group versus the RhoBTB3 low group. Red dots: up-regulated genes; Blue dots: down-regulated genes; Black dots: genes with no significant changes. (B) Heatmap of the top 40 up-regulated genes and the top 40 down-regulated genes. Red: high expression; Black: intermediate expression; Green: low expression. (C) GO analysis of DEGs. (D) KEGG pathway analysis of DEGs.
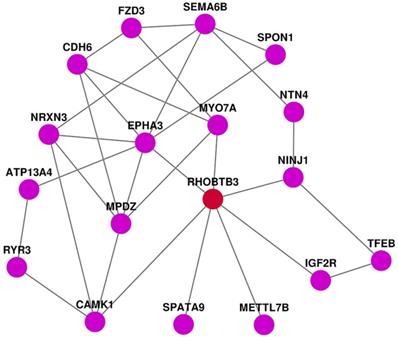
PPI analysis of DEGs
We applied STRING to develop the protein-protein interaction (PPI) network by using the top 40 up-regulated genes, the top 40 down-regulated genes, and RhoBTB3. In this PPI network we have found seven genes that are directly correlated with RhoBTB3. EphA3 and SPATA9 have positive expression correlation with RhoBTB3, while MYO7A, Ninj1, IGF2R, METTL7B, and CAMK1 present negatively relationship with RhoBTB3.
Discussion
Rho family GTPases members play roles in cell proliferation and motility, cytoskeletal regulation, cell polarity establishment, and transcriptional regulation [3-5]. Some studies have found that this gene family is also important in tumorigenesis and development [22]. They can be involved in promoting tumors as well as suppressing tumors [23]. So far, the associations among overall survival, clinical characteristics, and Rho family GTPases expression in AML remain unknown. Our study showed that compared with normal bone marrow samples, the mRNA expression of RhoB, RhoBTB2, RhoF, RhoQ, and RhoU was significantly increased in AML bone marrow samples, while the mRNA expression levels of Rac3, RhoBTB1, RhoBTB3, RhoC, and RhoV was decreased in AML bone marrow. According to current studies, RhoC promotes the process of progression of some cancers, including ovarian cancer as well as head and neck cancer [24, 25]. Rac3-KO mice presented higher survival rates in CML and ALL, suggesting a potential oncogenic role in cancer [26, 27]. RhoB is often downregulated in malignancies like lung cancer and gastric cancer by suppressing the process of proliferation, migration, as well as invasion of tumor cells [28-30]. RhoBTB1 and RhoBTB2 are reduced in some tumors and known as tumor suppressors for their involvement in the cell cycle and apoptosis [31, 32]. The expression level of RhoBTB3 is significantly lower in tumor tissues of breast, kidney, lung, uterus and ovary than that in normal tissues according to a cancer profiling array [33]. Further experiments will be needed to verify the particular functional significance of these family genes in AML.
PPI network analysis.
Among above genes with significantly different expression between AML bone marrow and healthy bone marrow, we found that RhoBTB3 was associated with OS in TCGA non-M3 AML patients by survival curve analysis. The prognostic value of RhoBTB3 was verified in another dataset GSE71014. Then we verified the differential expression of RhoBTB3 on AML bone marrow and nonleukemia/non-tumor bone marrow by RT-qPCR. Similar to our findings, human renal carcinomas express a low level of RhoBTB3, and RhoBTB3 deficiency can significantly enhance the Warburg effect as well as accelerate xenograft growth [34]. RhoBTB3 is also a Golgi-associated protein that is critical in keeping structure of Golgi and homeostasis of cells. The deficiency of RhoBTB3 could result in accumulation of cellular substrates which is important for cell degradation, causing an instability of cellular homeostasis, thus ultimately leading to cancers [35]. The correlation between RhoBTB3 and cell cycle regulation has been reported recently [36]. The mechanism that RhoBTB3 could suppress the development of cancer might be associated its role as the adaptor protein of Cullin3-dependent RING-E3 ubiquitin ligase complex [36]. Cullin3 is a kind of scaffolding protein that specifically recognize and mediate ubiquitination of the substrate through combination with adaptor protein with a BTB domain-bearing protein [37]. Studies by Lu et al. have revealed that RhoBTB3 could target Cyclin E and mediate its ubiquitination via Cullin3-dependent RING-E3 ubiquitin ligase complex, thus preventing cells from transition from phase S to G2 phase. Downregulation of RhoBTB3 could lead to fragmentation Golgi fragmentation and increased levels of Cyclin E which can regulates cell cycle [36]. Previous studies have found increased expression level of Cyclin E in AML, which promote the development of AML [38]. Studies by Huang et al showed that Notopterol could induce G0/G1 arrest as well as apoptosis of human AML HL-60 cells through regulation of CDK2 and Cyclin E expression [39]. Above all, decreased expression level of RhoBTB3 in AML could result in reduced uquibitination of Cyclin E, enhanced expression of Cyclin E as well as progression of the development of AML. In Cox analysis, we found that higher expression of RhoBTB3 was independently associated with favorable prognosis of AML patients who received chemotherapy, and the allo-HSCT treatment may overcome unfavorable prognosis of AML patients with low RhoBTB3 expression. The subgroup of low RhoBTB3 expression that receiving allo-HSCT therapy had significantly longer EFS and OS than chemotherapy subgroup. However, in patients with high RhoBTB3 expression no superiorities of the allo-HSCT group was found compared with chemotherapy. The above results remind us that AML patients with low RhoBTB3 expression may be strongly recommended for early allo-HSCT. However, allo-HSCT may be limited in improving survival in AML patients with high expression of RhoBTB3. Studying the relationship between RhoBTB3 and the pathogenesis and prognosis of AML will help us choose more appropriate treatment options for heterogeneous AML patients. Additionally, the prognosis of patients with TP53 mutations is poor whether they undergo chemotherapy or allo-HSCT, which is in line with previous studies, people try to use demethylation therapy and immunomodulatory therapeutic to improve the prognosis of this type of AML patients [40].
We further analyzed DEGs related to RhoBTB3. We found that 868 up-regulated genes and 707 down-regulated genes were closely related with the expression of RhoBTB3. GO analysis showed that passive transmembrane transporter activity, channel activity, extracellular matrix collagen-containing extracellular matrix, skeletal system development, and extracellular structure organization were markedly enriched among DEGs associated with RhoBTB3 expression. KEGG pathways were mainly enriched in neuroactive ligand-receptor interactions, cytokine-cytokine receptor interactions, protein digestion and absorption, axon guidance, and cAMP signaling pathways. The heatmap showed the top 40 up-regulated genes as well as top 40 down-regulated genes that were positively associated with high RhoBTB3 expression. Among them, we have found 7 genes that are directly correlated with RhoBTB3 expression in PPI network. EphA3 and SPATA9 have positive expression correlation with RhoBTB3, and MYO7A, Ninj1, IGF2R, METTL7B, and CAMK1 present negatively relationship with RhoBTB3. EphA3 and SPATA9 were lower in some tumors tissue and served as tumor‑suppressors [41]. Many studies have confirmed that MYO7A, Ninj1, IGF2R, METTL7B, and CAMK1 increased expression is related to tumors [42-45]. However, the correlation of these genes with RhoBTB3 has not been verified in molecular biology experiment. We need more in-depth exploration in the future.
Conclusions
Our study analyzed the expression patterns and prognostic significance of Rho family GTPases genes in AML. RhoBTB3 is significantly downregulated in AML bone marrow compared to healthy controls. The expression of RhoBTB3 level may help us identify heterogeneous AML patients with different prognosis and choose treatment options suitable for AML patients such as chemotherapy or allo-HSCT. The function of RhoBTB3 in AML is worthy of further study.
Acknowledgements
This study was authorized by the Medical Ethics Committee of the Xiangya hospital, Central South University. Informed consent was signed by all the participants.
Funding
This study was supported by The National Natural Science Foundation of China (NSFC Grant No. 81974002 and No. 81600135) and Chen Xiao Ping Foundation for the development of science and technology (No. CXPJJH12000009-102).
Availability of data
The datasets analyzed during this study can be accessed from TCGA and GEO.
Authors' contributions
Designed the study, EYL. Collected the data, JP, YFL, and YL. Check the data, YJX, MYP, ZOY, and CC. analyzed the data, SHY, WL, and EYL. Drafted the manuscript, SHY, WL and EYL. Project supported by YJX and YFL. All authors have approved the final manuscript.
Competing Interests
The authors have declared that no competing interest exists.
References
1. Moarii M, Papaemmanuil E. Classification and risk assessment in AML: integrating cytogenetics and molecular profiling. Hematology Am Soc Hematol Educ Program. 2017;2017:37-44
2. Ferrara F. Venetoclax plus hypomethylating agents or low-dose cytarabine in acute myeloid leukemia: all that glitters is gold? Blood Cancer J. 2020;10:10
3. Chircop M. Rho GTPases as regulators of mitosis and cytokinesis in mammalian cells. Small GTPases. 2014;5:e29770
4. Heasman SJ, Ridley AJ. Mammalian Rho GTPases: new insights into their functions from in vivo studies. Nat Rev Mol Cell Biol. 2008;9:690-701
5. Mack NA, Georgiou M. The interdependence of the Rho GTPases and apicobasal cell polarity. Small GTPases. 2014;5:1-16
6. Deng Z, Jia Y, Liu H, He M, Yang Y, Xiao W. et al. RhoA/ROCK pathway: implication in osteoarthritis and therapeutic targets. Am J Transl Res. 2019;11:5324-5331
7. He F, Yin F, Omran A, Yang LF, Xiang QL, Peng J. PKC and RhoA signals cross-talk in Escherichia coli endotoxin induced alterations in brain endothelial permeability. Biochem Biophys Res Commun. 2012;425:182-188
8. Pan Y, Wang N, Xia P, Wang E, Guo Q, Ye Z. Inhibition of Rac1 ameliorates neuronal oxidative stress damage via reducing Bcl-2/Rac1 complex formation in mitochondria through PI3K/Akt/mTOR pathway. Exp Neurol. 2018;300:149-166
9. Peng J, He F, Zhang C, Deng X, Yin F. Protein kinase C-alpha signals P115RhoGEF phosphorylation and RhoA activation in TNF-alpha-induced mouse brain microvascular endothelial cell barrier dysfunction. J Neuroinflammation. 2011;8:28
10. Azab AK, Azab F, Blotta S, Pitsillides CM, Thompson B, Runnels JM. et al. RhoA and Rac1 GTPases play major and differential roles in stromal cell-derived factor-1-induced cell adhesion and chemotaxis in multiple myeloma. Blood. 2009;114:619-629
11. Zhou Y, Xu Z, Lin W, Duan Y, Lu C, Liu W. et al. Comprehensive Genomic Profiling of EBV-Positive Diffuse Large B-cell Lymphoma and the Expression and Clinicopathological Correlations of Some Related Genes. Front Oncol. 2019;9:683
12. Chen W, Niu S, Ma X, Zhang P, Gao Y, Fan Y. et al. RhoB Acts as a Tumor Suppressor That Inhibits Malignancy of Clear Cell Renal Cell Carcinoma. PLoS One. 2016;11:e0157599
13. Tao YM, Huang JL, Zeng S, Zhang S, Fan XG, Wang ZM. et al. BTB/POZ domain-containing protein 7: epithelial-mesenchymal transition promoter and prognostic biomarker of hepatocellular carcinoma. Hepatology. 2013;57:2326-2337
14. Lu X, Guo H, Chen X, Xiao J, Zou Y, Wang W. et al. Effect of RhoC on the epithelial-mesenchymal transition process induced by TGF-beta1 in lung adenocarcinoma cells. Oncol Rep. 2016;36:3105-3112
15. Li Q, Qin T, Bi Z, Hong H, Ding L, Chen J. et al. Rac1 activates non-oxidative pentose phosphate pathway to induce chemoresistance of breast cancer. Nat Commun. 2020;11:1456
16. Tang Z, Li C, Kang B, Gao G, Li C, Zhang Z. GEPIA: a web server for cancer and normal gene expression profiling and interactive analyses. Nucleic Acids Res. 2017;45:W98-W102
17. Cancer Genome Atlas Research N, Weinstein JN, Collisson EA, Mills GB, Shaw KR, Ozenberger BA. et al. The Cancer Genome Atlas Pan-Cancer analysis project. Nat Genet. 2013;45:1113-1120
18. Colaprico A, Silva TC, Olsen C, Garofano L, Cava C, Garolini D. et al. TCGAbiolinks: an R/Bioconductor package for integrative analysis of TCGA data. Nucleic Acids Res. 2016;44:e71
19. Cerami E, Gao J, Dogrusoz U, Gross BE, Sumer SO, Aksoy BA. et al. The cBio cancer genomics portal: an open platform for exploring multidimensional cancer genomics data. Cancer Discov. 2012;2:401-404
20. Yu G, Wang LG, Han Y, He QY. clusterProfiler: an R package for comparing biological themes among gene clusters. Omics. 2012;16:284-287
21. Szklarczyk D, Gable AL, Lyon D, Junge A, Wyder S, Huerta-Cepas J. et al. STRING v11: protein-protein association networks with increased coverage, supporting functional discovery in genome-wide experimental datasets. Nucleic Acids Res. 2019;47:D607-D613
22. Ueyama T. Rho-Family Small GTPases: From Highly Polarized Sensory Neurons to Cancer Cells. Cells. 2019;8:92
23. Bustelo XR. RHO GTPases in cancer: known facts, open questions, and therapeutic challenges. Biochem Soc T. 2018;46:741-760
24. Horiuchi A, Imai T, Wang C, Ohira S, Feng Y, Nikaido T. et al. Up-regulation of small GTPases, RhoA and RhoC, is associated with tumor progression in ovarian carcinoma. Lab Invest. 2003;83:861-870
25. Islam M, Lin G, Brenner JC, Pan Q, Merajver SD, Hou Y. et al. RhoC expression and head and neck cancer metastasis. Mol Cancer Res. 2009;7:1771-1780
26. Cho YJ, Zhang B, Kaartinen V, Haataja L, de Curtis I, Groffen J. et al. Generation of rac3 null mutant mice: role of Rac3 in Bcr/Abl-caused lymphoblastic leukemia. Mol Cell Biol. 2005;25:5777-5785
27. Thomas EK, Cancelas JA, Chae HD, Cox AD, Keller PJ, Perrotti D. et al. Rac guanosine triphosphatases represent integrating molecular therapeutic targets for BCR-ABL-induced myeloproliferative disease. Cancer Cell. 2007;12:467-478
28. Huang M, Prendergast GC. RhoB in cancer suppression. Histol Histopathol. 2006;21:213-218
29. Mazieres J, Antonia T, Daste G, Muro-Cacho C, Berchery D, Tillement V. et al. Loss of RhoB expression in human lung cancer progression. Clin Cancer Res. 2004;10:2742-2750
30. Vega FM, Ridley AJ. Rho GTPases in cancer cell biology. FEBS Lett. 2008;582:2093-2101
31. Freeman SN, Ma Y, Cress WD. RhoBTB2 (DBC2) is a mitotic E2F1 target gene with a novel role in apoptosis. J Biol Chem. 2008;283:2353-2362
32. Xu RS, Wu XD, Zhang SQ, Li CF, Yang L, Li DD. et al. The tumor suppressor gene RhoBTB1 is a novel target of miR-31 in human colon cancer. Int J Oncol. 2013;42:676-682
33. Berthold J, Schenkova K, Ramos S, Miura Y, Furukawa M, Aspenstrom P. et al. Characterization of RhoBTB-dependent Cul3 ubiquitin ligase complexes-evidence for an autoregulatory mechanism. Exp Cell Res. 2008;314:3453-3465
34. Zhang CS, Liu Q, Li M, Lin SY, Peng Y, Wu D. et al. RHOBTB3 promotes proteasomal degradation of HIFalpha through facilitating hydroxylation and suppresses the Warburg effect. Cell Res. 2015;25:1025-1042
35. Long M, Simpson JC. Rho GTPases operating at the Golgi complex: Implications for membrane traffic and cancer biology. Tissue Cell. 2017;49:163-169
36. Lu A, Pfeffer SR. Golgi-associated RhoBTB3 targets cyclin E for ubiquitylation and promotes cell cycle progression. J Cell Biol. 2013;203:233-250
37. Petroski MD, Deshaies RJ. Function and regulation of cullin-RING ubiquitin ligases. Nat Rev Mol Cell Biol. 2005;6:9-20
38. Iida H, Towatari M, Tanimoto M, Morishita Y, Kodera Y, Saito H. Overexpression of cyclin E in acute myelogenous leukemia. Blood. 1997;90:3707-3713
39. Huang Q, Wang L, Ran Q, Wang J, Wang C, He H. et al. Notopterol-induced apoptosis and differentiation in human acute myeloid leukemia HL-60 cells. Drug Des Devel Ther. 2019;13:1927-1940
40. Hunter AM, Sallman DA. Current status and new treatment approaches in TP53 mutated AML. Best Pract Res Clin Haematol. 2019;32:134-144
41. Chen X, Lu B, Ma Q, Ji CD, Li JZ. EphA3 inhibits migration and invasion of esophageal cancer cells by activating the mesenchymalepithelial transition process. Int J Oncol. 2019;54:722-732
42. Liu D, Li W, Zhong F, Yin J, Zhou W, Li S. et al. METTL7B Is Required for Cancer Cell Proliferation and Tumorigenesis in Non-Small Cell Lung Cancer. Front Pharmacol. 2020;11:178
43. Kang JH, Woo JK, Jang YS, Oh SH. Radiation Potentiates Monocyte Infiltration into Tumors by Ninjurin1 Expression in Endothelial Cells. Cells. 2020 9
44. Takeda T, Komatsu M, Chiwaki F, Komatsuzaki R, Nakamura K, Tsuji K. et al. Upregulation of IGF2R evades lysosomal dysfunction-induced apoptosis of cervical cancer cells via transport of cathepsins. Cell Death Dis. 2019;10:876
45. Akizuki K, Kinumi T, Ono A, Senga Y, Osawa J, Shigeri Y. et al. Autoactivation of C-terminally truncated Ca(2+)/calmodulin-dependent protein kinase (CaMK) Idelta via CaMK kinase-independent autophosphorylation. Arch Biochem Biophys. 2019;668:29-38
Author contact
![]() Corresponding author: En-Yi Liu, E-mail: liuenyiedu.cn.
Corresponding author: En-Yi Liu, E-mail: liuenyiedu.cn.