Impact Factor ISSN: 1837-9664

 Global reach, higher impact
J Cancer 2021; 12(13):4086-4098. doi:10.7150/jca.57808 This issue Cite
Research Paper
The prognostic and diagnostic value of tissue inhibitor of metalloproteinases gene family and potential function in gastric cancer
Zhao Li*, Qinwen Jing*, Liucheng Wu, Jiansi Chen, Mingwei Huang, Yuzhou Qin ![]() , Tingan Wang
, Tingan Wang ![]()
Department of Gastrointestinal Surgery, Guangxi Medical University Cancer Hospital, Guangxi Clinical Research Center for Colorectal Cancer, Nanning 530021, Guangxi Zhuang Autonomous Region, China.
* These authors contributed equally to this study.
Received 2021-1-4; Accepted 2021-4-23; Published 2021-5-13
Abstract

Background: Tissue inhibitor of metalloproteinases (TIMP) gene family, including TIMP1, TIMP2, TIMP3 and TIMP4, was found to be correlated with serval cancers. Still the diagnostic and prognostic study of it in gastric cancer (GC) have few reports.
Methods and materials: In this study, the gene expression and clinical data were acquired from the Cancer Gene Atlas (TCGA), function enrichment was used by several databases for verifying known function. Operating characteristic (ROC) curves with area under the curve (AUC) used to assess diagnostic value. Survival analysis and joint-effects survival analysis was performed by the Kaplan-Meier curve. The results were adjusted by cox-regression model. Nomogram is used to directly predict the survival rate for individual GC patient. The potential mechanism for diagnostic and prognostic value was assessed by gene set enrichment analysis (GSEA). Further functions of gene were verified by cell proliferation, migration and invasion assays in human gastric cancer cell line.
Results: TIMP1 was expressed in GC tissue was higher than normal gastric tissue. TIMP3 and TIMP4 have expressed in normal gastric tissue were higher than GC tissue. TIMP1, TIMP3 and TIMP4 have potential diagnostic value (AUC=0.842, 0.729, 0.786 respectively; all P<0.01). Low expression of TIMP2 and TIMP3 associated with favorable overall survival (all P<0.05). TIMP2 and TIMP3, which had significantly affection of prognosis were found having some function such as tRNA processing, cell cycle pathway ncRNA processing. The silencing of TIMP3 could inhibit the migration and invasion of gastric cancer cell.
Conclusion: We analyzed the TIMP gene family in GC, and the prognostic and diagnostic value. TIMP1 and TIMP2 could be used as diagnostic biomarkers in GC. TIMP2 and TIMP3 could be used as potential biomarkers for GC's prognosis.
Keywords: gastric cancer, TIMP, prognosis, diagnosis, biomarker.
Introduction
Gastric cancer (GC) is the most common cancer type around world. In the United States, the estimated new GC cases are 27600, and the estimated death cases of GC is 11010 in 2020[1]. The Surveillance, Epidemiology and End Results Program (SEER, https://seer.cancer.gov, accessed in 1st July) indicates that GC takes 1.5% of all new cancer cases, and 5-year relative survival rate is only 32.0%. There are many biomarkers former researcher has been found, could be used for predicting the prognosis and diagnosis for GC [2]. However there still don't have a golden biomarker standard for diagnosis and prognosis for GC patients, the most sensitive and widely used measure is pathological diagnosis.
Tissue inhibitor of metalloproteinases (TIMP) gene family, having four sub-members TIMP1, TIMP2, TIMP3 and TIMP4 has essential functions in the inhibition of matrix metalloproteinases (MMPs) and cell signaling such as cell death, proliferation and angiogenesis [3]. Besides, those 4 genes were found to be correlated with many different types of cancer's occurrence [4, 5]. The diagnostic and prognostic value and potential mechanism of individual TIMPs were illustrated in various cancer types such as TIMP1 in gastric cancer for prediction [6], TIMP1 and TIMP2 in colon cancer for prognosis [7, 8] and TIMP4 in astrocytoma for diagnosis [9].
Since there are many studies about individual one of the TIMPs, there has no systematically research about prognostic and diagnostic value for whole TIMP family at mRNA level. The present study made a compensate, by the reliable open access data obtained from the Cancer Gene Atlas (TCGA), compared the differences expression level of every gene, and made survival and functional analysis to predict the potential mechanism could influence the diagnosis and prognosis.
Methods and materials
Date preparation
The expression of TIMP gene family, including TIMP1, TIMP2, TIMP3 and TIMP4, and clinical information were acquired from TCGA (http://tcga-data.nci.nih.gov/tcga, accessed July 1st 2020). We downloaded the clinical information of 415 gastric cancer patients from UCSC Xena (http://xena.ucsc.edu/, accessed July 1st 2020), including age, gender, tumor stage, survival time and survival status. There were total of 351 cases were included for follow-up survival analysis after excluding the cases with missing medical data and 0-day survival time. For diagnostic analysis, 32 normal tissue and 375 cancer tissue expression level cases were included.
Gene expression level and correlation analysis
The boxplots of TIMP genes were used to illustrate the expression level between gastric paracancerous tissue and GC. Both TCGA data we acquired and Metabolic gEne RApid Visualizer (MERAV, http://merav.wi.mit.edu/, accessed July 2nd 2020) [10] were used to perform boxplots.
Pearson correlation coefficient was used explain the correlation between TIMP genes in mRNA expression level, P<0.05 was considered statically significant. Those boxplots were generated by GraphPad Prism 8 software (GraphPad Software, La Jolla, CA, USA).
Gene functional assessment
Gene ontology (GO) categories including biological process (BP), molecular function (MF), cellular component (CC) and Kyoto Encyclopedia of Genes and Genomes (KEGG) pathway were enriched by Database for Annotation, Visualization and Integrated Discovery v8.0 (DAVID, https://david.ncifcrf.gov/, accessed July 3rd 2020) [11, 12]. The DAVID results with P<0.05 and FDR<0.25 were considered statistically significant.
Gene co-expression and protein-protein network
Gene co-expression network was used to illustrate the co-expression and pathway connect in TIMP genes and potentially realted genes. GeneMANIA application (http://genemania.org/, accessed by July 4th, 2020) [13] in Cytoscape software was used to generate and analyze this network [13, 14].
Protein-protein interaction network for co-expression of TIMP and potential genes were assessed and generated by STRING v11.0 (https://string-db.org/) [15].
Diagnostic value analysis
The diagnostic value of TIMP genes were assessed by receiver operating characteristic (ROC) curves. An area under the curve (AUC)>0.700 with P<0.05 was considered having diagnostic value and statistically significant. The ROC curves were generated by GraphPad Prism 8 software (GraphPad Software, La Jolla, CA, USA).
Survival and Joint-effects survival analysis for prognosis
The expression of each gene was divided into low expression and low expression groups; age was divided into <65 and ≥65 groups; sex was divided into male and female groups; tumor stage was firstly divided into early stage (the combination of stage I, II) and advanced stage (the combination of stage III and IV) groups, secondly divided into 4 groups by each tumor stage. Median survival time (MST), overall survival (OS) and the Kaplan-Meier estimator with the log-rank test were used to assess patients' survival.
Uni-variate survival analysis with cox-regression model was used to adjust the genes' crude survival results by clinical information with statistically survival significant.
The joint-effects analysis used regrouped patients by adjusted genes. This result also adjusted by clinical characters. The log-rank P<0.05 was considered statistically significant. The K-M survival curves were generated by GraphPad Prism 8 software (GraphPad Software, La Jolla, CA, USA).
Nomogram for prognosis prediction
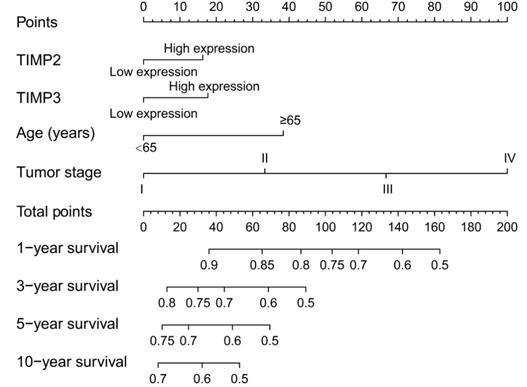
A nomogram used to predict the survival of individual patient directly, including the element of age, TIMP2, TIMP3, and tumor stage. Every factor could be calculating the contribution points at the first line, and the total contribution points could reflect the time-related prognosis. The figure was generated by R version 3.6.1
Gene function prediction by GSEA
Gene set enrichment analysis (GSEA) was used to predict the gene function compared with the hole expression matrix and low, high expression phenotype. The potential function of GO item including BP, MF and CC (c5.all.v7.1.symbols.gmt) and potential KEGG pathway (c2.kegg.v7.1.symbols.gmt) were also enriched and predicted. The results with P<0.05 and FDR<0.25 was considered statistically significant.
Cell culture, siRNA reagents and antibodies
Human gastric cancer cell line, AGS, was obtained from Cell Bank of Chinese Academy of Sciences and was used for functional experiments. AGS cell was cultured in the Dulbecco's Modified Eagle's Medium (DMEM, Gibco, 8118131) with 10% fetal bovine serum (Gibco, 42F7180K), cultured in incubator under the circumstance of 5% CO2 and 37℃. siRNA was used for transfection of TIMP3 were from Hippo Biotecnology Company (Huzhou, Zhejiang Provence, China). Liposome bodies were purchased from Invitrogen (lipo2000). Antibodies for western blot were against TIMP3 (PROTEINTECH, 10858-1-AP).
Cell transfection
Cells were divided into 4 groups for transfection: negative control (siTIMP3-NC), siTIMP3-1, siTIMP3-2 and siTIMP3-3. 75pmol plasmid and 10μL lipo2000 were cultured in 125μL medium without serum separately, after 5 minutes, two components were mixed. 4 groups were cultured for 6 hours, then washed by sterile phosphate buffered saline and cultured in the medium without serum for 48 hours in 6-well plate for observing and selecting the best transfection results. Total RNA was extracted for validating gene expression level after transfection.
Cell proliferation, invasion and migration assay
Cell proliferation was performed by Cell Counting Kit-8 (CCK-8). After 48 hours' transfection, the siTIMP3-NC and siTIMP3-1 were transplanted to 96-well plate at 3000 cells per well. Add 1/10 unites of CCK-8 in each well and cultured under the circumstance of 5% CO2 and 37℃ for 2 hours in the time of culturing for 0 hour, 24 hours, 48 hours and 72 hours respectively. After that, the optical density was measured at 450nm wavelength.
Plate clone formation assay was also used for proliferation tests. After transfection for 48 hours, resuspended cells were transplanted to 6-well plate at 500 cells per well and 2mL medium were added in the wells respectively at the same time. After cultured under the circumstance at 37℃ and 5% CO2 for 12 days, the cells were washed, fixed and dried for observation.
Transwell assays and Wound healing assay were used to observe cell invasion and migration ability.
Results
Gene function and correlated assessment
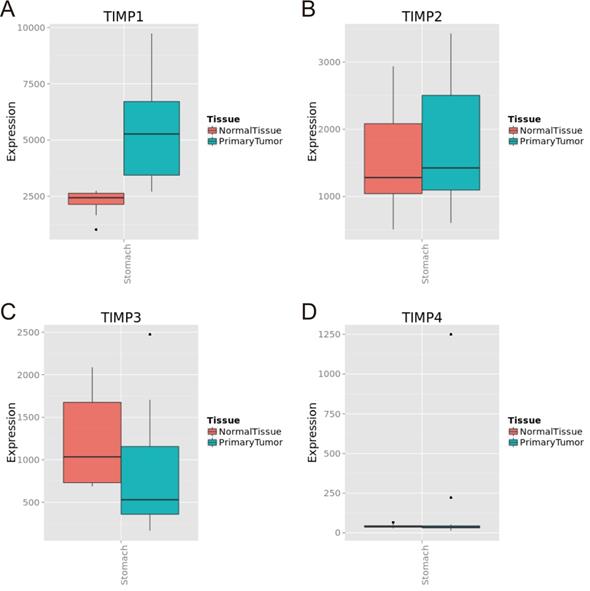
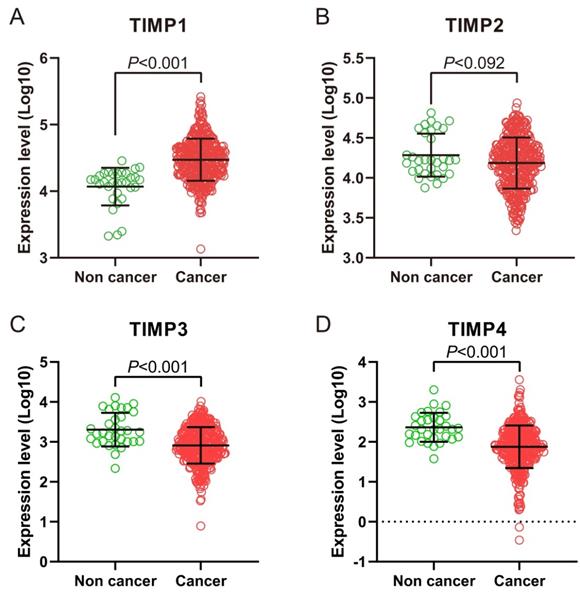
We found TIMP1 was expressed in GC tissue was higher than normal gastric tissue (Figure 1A and 2B), TIMP3 and TIMP4 were expressed in normal gastric tissue were higher than GC tissue (Figure 1C, 1D, 2C and 2D). As for TIMP2, there were no significance between two type tissues (P>0.05, Figure 2B).
TIMP gene expression level in normal gastric tissue and tumor tissue in MERAV database. (A) TIMP1, (B) TIMP2, (C) TIMP3, (D) TIMP4.
TIMP gene expression level in normal gastric tissue and tumor tissue in TCGA database. (A) TIMP1, (B) TIMP2, (C) TIMP3, (D) TIMP4.
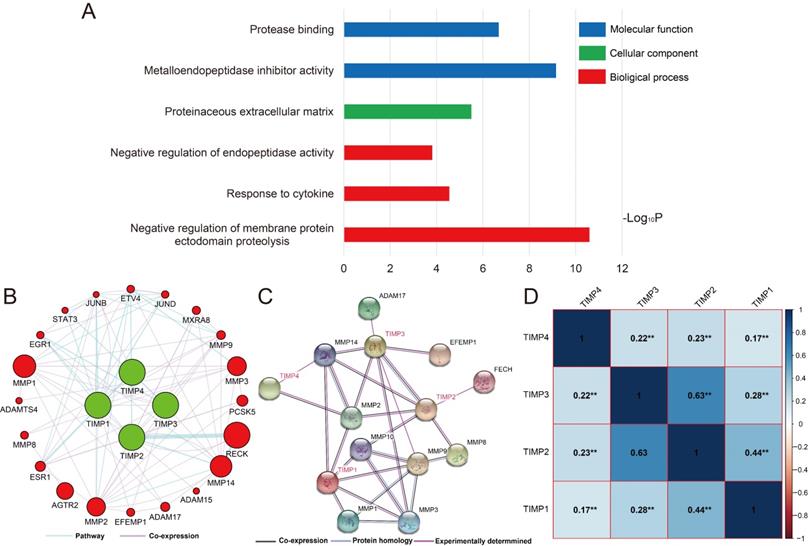
By gene function enrichment analysis, we verified and confirmed TIMP gene family were associated with protease binding, metallopeptidase inhibitor activity, proteinaceous extracellular matrix, negative regulation of endopeptidase activity, response to cytokine and negative regulation of membrane protein ectodomain proteolysis (Figure 3A, Supplementary Table 1). TIMP genes also have connections with STAT3, MMP3, MMP8, MMP14 and other genes at pathway and co-expression level (Figure 3B and 3C). In the family, except there was no correlation significance between TIMP2 and TIMP3, the rest of the combination correlated more or less (Figure 3D).
Functions and correlation of TIMP genes. (A) GO enrichment analysis by DAVID, (B) co-expression and pathway network, (C) protein-protein interaction network, (D) correlation analysis, **, P<0.001.
Diagnostic value
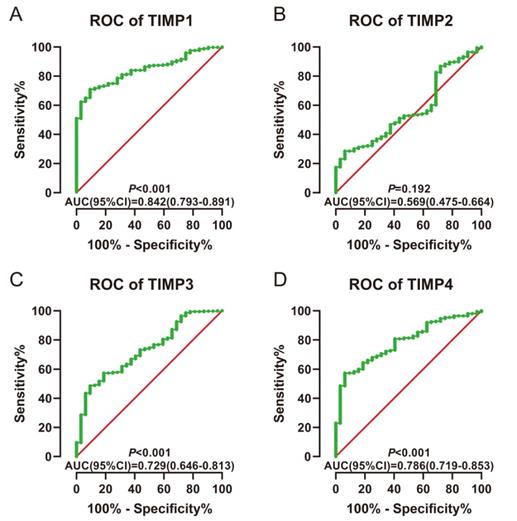
The AUC was larger than 0.70 could be thought having a diagnostic value in ROC curves. TIMP1, TIMP3 and TIMP4 have diagnostic value (AUC=0.842, 0.729, 0.786; all P<0.001) (Figure 4A, 4C and 4D).
ROC for diagnosis. (A) TIMP1, (B) TIMP2, (C) TIMP3, (D) TIMP4.
Prognostic value
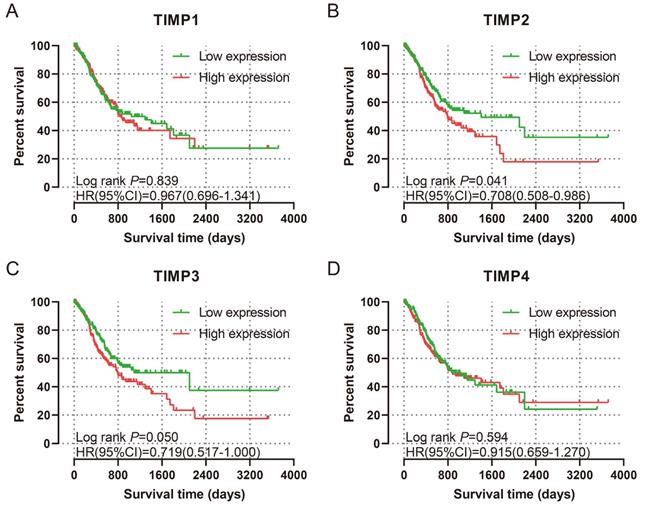
The baseline data and analysis results were shown in Table 1. Only age and tumor stage are the factors that could influence the prognosis. A for uni-variate survival analysis for genes, the expression level of TIMP2 and TIMP3 have prognosis value. Low expression of TIMP2 and TIMP3 associated with favourable OS (all P<0.05) (Figure 5B and 5C). Multi-variate survival analysis was performed by adjusting age and tumor stage. The results revealed that low expression of TIMP2 and TIMP3 associated with favorable MST (all P<0.05) (Table 2), which correspond with uni-variate survival analysis.
Clinical data characteristic of 351 GC patients in TCGA.
| Items | Cases (Total n=351) | No. of events (%) | MST (days) | Crude P | Crude HR (95%CI) |
|---|---|---|---|---|---|
| Age | |||||
| ≥65 | 148 | 50 (33.8%) | 1811 | 0.018 | Ref. |
| <65 | 203 | 94 (46.3%) | 799 | 0.660 (0.468-0.931) | |
| Sex | |||||
| Male | 226 | 100 (45.2%) | 869 | 0.186 | Ref. |
| Female | 125 | 44 (35.2%) | 1043 | 0.787 (0.552-1.122) | |
| Tumor stage | |||||
| I | 47 | 11 (23.4%) | 2197 | <0.001 | 0.260 (0.126-0.537) |
| II | 109 | 34 (31.2%) | 1686 | 0.424 (0.247-0.728) | |
| III | 147 | 69 (46.9%) | 779 | 0.643 (0.397-1.042) | |
| IV | 35 | 22 (62.9%) | 476 | Ref. | |
| missing | 13 | ||||
| Tumor stage* | |||||
| Early stage | 156 | 45 (28.8%) | 1811 | <0.001 | 0.523 (0.366-0.747) |
| Advanced stage | 182 | 91 (50.0%) | 669 | Ref. | |
| missing | 13 |
Abbreviations: TNM stage, Tumor, node and metastasis stage; MST, Median survival time; Ref, Reference; HR, Hazard ratio; 95% CI, 95% Confidence interval.
Note: *, early stage was combined by stage I and II, advanced stage was combined by stage III and IV.
K-M plots for prognosis. (A) TIMP1, (B) TIMP2, (C) TIMP3, (D) TIMP4.
Univariate and multivariate survival analysis of TIMP gene family.
| Items | Cases (Total n=351) | No. of events (%) | MST (days) | Crude P | Crude HR (95%CI) | Adjusted P | Adjusted HR (95%CI) |
|---|---|---|---|---|---|---|---|
| TIMP1 | |||||||
| Low | 175 | 71 (40.6%) | 1043 | 0.839 | 0.967 (0.696-1.341) | 0.816 | 0.960 (0.684-1.348) |
| High | 176 | 73 (41.5%) | 832 | Ref. | Ref. | ||
| TIMP2 | |||||||
| Low | 175 | 62 (35.4%) | 1407 | 0.041 | 0.708 (0.508-0.986) | 0.031 | 0.685 (0.486-0.966) |
| High | 176 | 82 (46.6%) | 794 | Ref. | Ref. | ||
| TIMP3 | |||||||
| Low | 175 | 63 (34.0%) | 1095 | 0.049 | 0.680 (0.484-0.955) | 0.026 | 0.680 (0.484-0.955) |
| High | 176 | 81 (46.0%) | 794 | Ref. | Ref. | ||
| TIMP4 | |||||||
| Low | 175 | 67 (38.3%) | 874 | 0.594 | 0.915 (0.659-1.270) | 0.876 | 0.974 (0.694-1.356) |
| High | 176 | 77 (33.7%) | 881 | Ref. | Ref. |
Abbreviations: MST, Median survival time; Ref, Reference; HR, Hazard ratio; 95% CI, 95% Confidence interval;
Notes: Adjusted P, Adjustment by age and tumor stage; Bold number, statistically significance.
Nomogram
The contribution points of high expression of TIMP2 and TIMP3 are approximately the same, the points between 10 and 20. Contribution points of tumor stage are high, raising by the advancing tumor stage. In the nomogram, an individual patient with high total contribution points may have a worse survival rate (Figure 6).
Nomogram for the predication of individual survival rate.
Joint-effects survival analysis
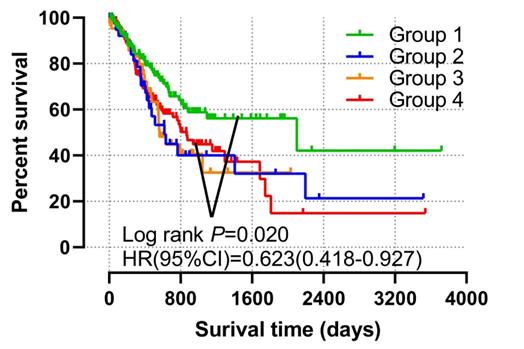
The patients were regrouped into 4 by the different combination of TIMP2 and TIMP3 expression level (Table 3). The grouping information was showen in Table 4. We found that all low expression of TIMP2 and TIMP3 have favorable OS and MST (Group1), compared with all high expression (Group 4) (P<0.05 Figure 6, Table 4).
Grouping information of Joint-effect analysis.
| Group | Gene expression level | |
|---|---|---|
| TIMP2 | TIMP3 | |
| 1 | Low expression | Low expression |
| 2 | Low expression | High expression |
| 3 | High expression | Low expression |
| 4 | High expression | High expression |
Joint-effects analysis of the combination of TIMP2 and TIMP3.
| Group | Cases (Total n=351) | No. of events (%) | MST (days) | Crude P | Crude HR (95%CI) | Adjusted P | Adjusted HR (95%CI) |
|---|---|---|---|---|---|---|---|
| Group1 | 132 | 41 (31.1%) | 2100 | 0.002 | 0.623 (0.418-0.927) | 0.020 | 0.612 (0.405-0.925) |
| Group2 | 43 | 21 (48.8%) | 618 | 0.720 | 1.096 (0.664-1.810) | 0.432 | 1.227 (0.737-2.042) |
| Group3 | 43 | 22 (31.2%) | 562 | 0.688 | 1.113 (0.682-1.814) | 0.688 | 1.109 (0.699-1.841) |
| Group4 | 133 | 60 (45.1%) | 869 | Ref. | Ref. | Ref. | Ref. |
Abbreviations: MST, Median survival time; Ref, Reference; HR, Hazard ratio; 95% CI, 95% Confidence interval.
Notes: Adjusted P, Adjustment by age and tumor stage.
Potential gene function prediction
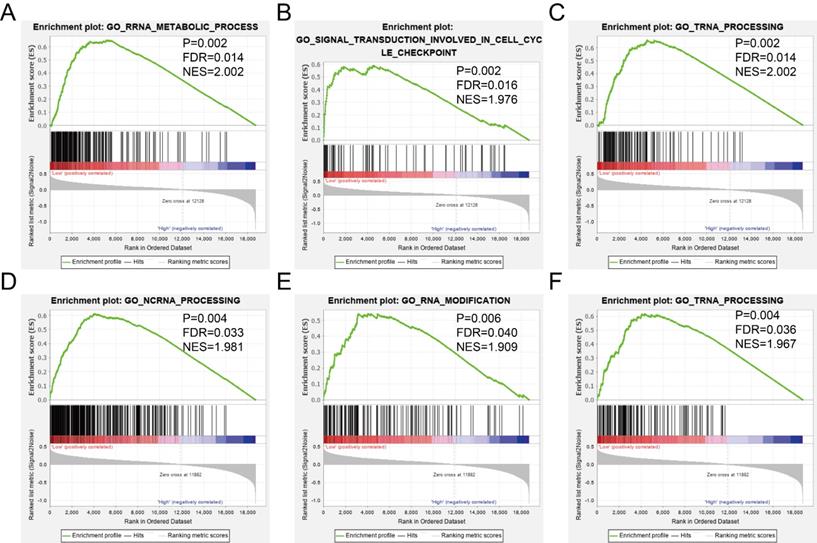
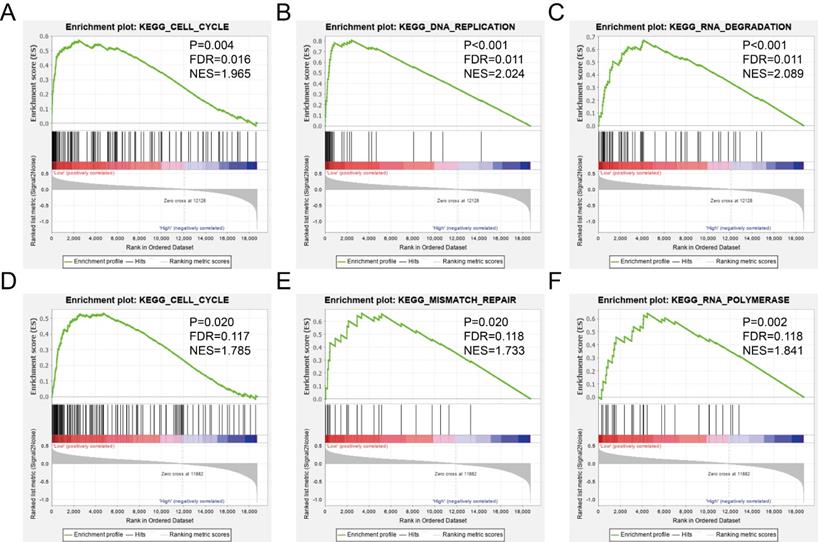
The GSEA was used to predict potential gene function and associated KEGG pathway. TIMP2 was found to be associated with RNA metabolic process (Figure 8A), signal transduction involved in cell cycle checkpoint (Figure 8B), tRNA processing (Figure 8C), cell cycle pathway (Figure 9A), DNA replication pathway (Figure 9B) and RNA degradation (Figure 9C). TIMP3 was found to be associated with ncRNA processing (Figure 8D), RNA modification (Figure 8E), tRNA processing (Figure 8F), cell cycle pathway (Figure 9D), mismatch repair (Figure 9E) and RNA polymerase (Figure 9F). The rest of the enrichment result was shown in Supplementary Table 2 and Supplementary Table 3.
Joint-effects analysis combined by the expression level of TIMP2 and TIMP3.
GSEA results of GO enrichment analysis. (A-C) the results for TIMP2, (D-F) the results for TIMP3.
GSEA results of KEGG enrichment analysis. (A-C) the results for TIMP2, (D-F) the results for TIMP3.
Identification of silencing by siRNA, RT-PCR and Western Blot results
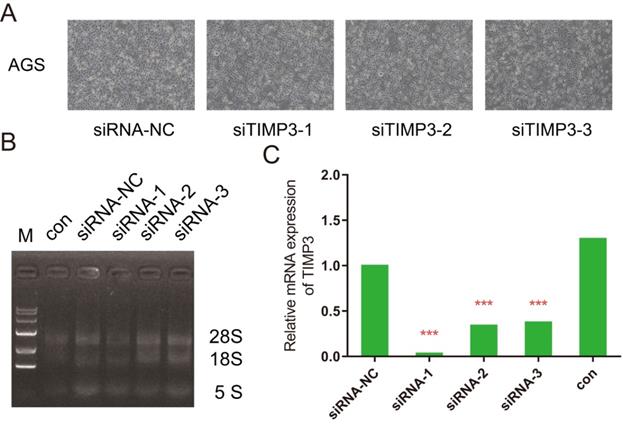
Four groups of AGS cells after transfection were showed in Figure 10A. RNA electrophoresis pattern was showed in Figure 10B and 10C. The expression levels of TIMP3 in the siRNA-1, siRNA-2, and siRNA-3 groups were significantly down-regulated compared with NC group, moreover the result of siRNA-1 group was the best (0.062), meanwhile the siRNA-2 (0.499) and siRNA-3 (0.495) groups were down-regulated at almost the same level in AGS cell.
Observing the transfection results for silencing of TIMP3. (A) AGS cells for independent groups under microscopes, (B) RT-PCR photograph results, (C) relative mRNA expression of TIMP3 by RT-PCR.
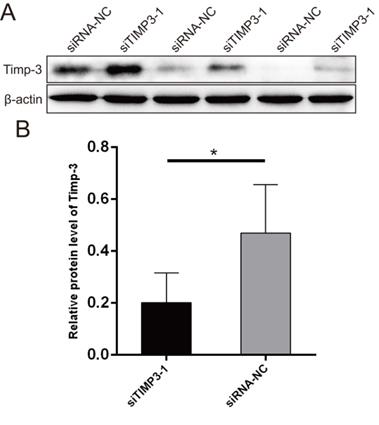
The WB results showed that the Timp-3 protein expression level in the siTIMP3-1 group was significantly lower than that in the siRNA-NC group after transfection (Figure 11).
Western blots for validating the silencing of TIMP3. (A) WB photograph results, (B) relative mRNA expression of TIMP3 by WB.
Cell proliferation, invasion, migration and clone assays
The results of CCK8 at each time point after transfection showed that compared with the siRNA-NC group, the proliferation ability of AGS cells in the siTIMP3-1 group had no significant change (Figure 12A).
Cell proliferation and migration assays for TIMP3. (A) proliferation assays, (B) Transwell assays, (C) the analysis of Transwell results, **, P<0.05.
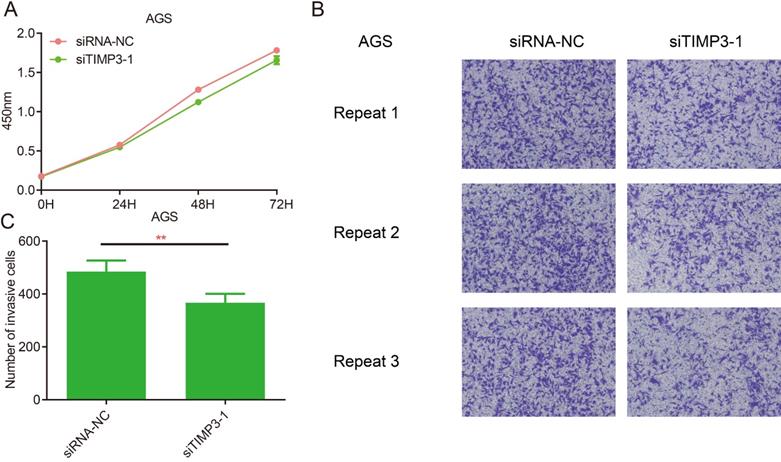
The results of the invasion assays showed that after transfection, compared with the siRNA-NC group, the migration ability of AGS cells in the siTIMP3-1 group was significantly weakened (Figure 12B and 12C).
The wound healing assays results of independent repeated experiments showed that after transfection, the migration rate of AGS cells in the siTIMP3-1 group was lower than that in the siRNA-NC group, and the difference was significant at 48 hours (Figure 13A and 13C).
Cell migration and clone assays. (A) Cell migration assay for negative control group and silencing TIMP3 group in 0h, 24h and 28h, (B) cell clone assays for NC group and silencing TIMP3 group, (C) the compare of healing rate of migration assays, *, P<0.0025, ****, P<0.0001, (D) the compare of number of clones between NC group and silencing TIMP3 group.
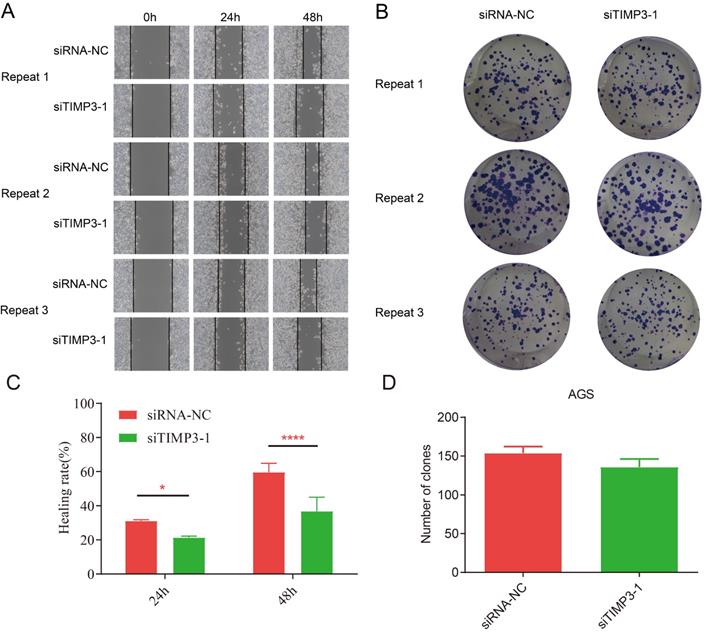
The results of the cell clone assays showed that after transfection, compared with the siRNA-NC group, the number of AGS cell clone formation in the siTIMP3-1 group was slightly reduced, but there was no significant difference (Figure 13B and 13D).
Discussion
TIMP genes belong to tissue inhibitor of metallopeptidases (TIMP) gene family. There are total of 4 genes in this family, including TIMP1, TIMP2, TIMP3 and TIMP4 [16]. The most known function of TIMPs was regulating the balance of metabolism extracellular matrix [17, 18]. We found TIMP2 and TIMP3 have a correlation with matrix metalloproteinases (MMPs). Also, TIMPs were the natural inhibitors and regulators of MMPs and acted as critical rules in cancer [17, 19]. Until now, the report of diagnostic and prognostic value is few.
However, TIMPs was found to be associated with serval cancers. In human colon cancer, overexpressed of TIMP1 associated with worse OS. Knockdown TIMP1 could inhibit the proliferation of colon cancer cell line by regulating FAK-PI3K/AKT and MAPK pathway, however we have not found the relationship between TIMP1 expression and patients' outcomes.
As for TIMP2, the former researcher found that high expression of TIMP2 was associated worse prognosis of GC patients [20], which corresponding with our research, but the diagnostic value was not illustrated. Likewise, in ovarian cancer, depressing TIMP2 by EZH2 genes, aggressive behaviors like invasion and migration could be repressed [21]. But in different human cancers, hepatocellular carcinoma, for instance, TIMP2 was usually down-regulated, and associated with worse prognosis and more aggressive tumor behavior [22]. This phenomenon could not only explain by the function of oncogene and tumor suppressor gene, and this may cause by the changed circumstance, the function of the gene expression level was changed in different cancer type.
TIMP3 was reported down-regulated in GC tissue [23], unfortunately, there were few reports about the prognosis value and diagnosis value in GC. Most research about TIMP3 in GC, focusing on methylation [23, 24]. In mRNA expression research, contradict with it in other cancers [25], we found over-expressed TIMP3 associated with worse OS, which means this phenomenon may cause by accelerating the aggressive behavior. In breast cancer mice model, deficient of Timp3 could resist developing of breast cancer by inhibiting tumor cell's growth [26].
To explore the potential mechanism of TIMP2 and TIMP3 in GC prognosis, we used the GSEA to analysis. All those two genes involved in the cell cycle process and pathway, which is a critical role in cell proliferation, and effects the occurrence of cancer [27]. It has been confirmed that TIMP2 could inhibit the cell cycle process at G1 phase, by binding α3β1 integrin [28].TIMPs was also involved in ncRNA processing. It was reported that TIMP2 was the direct target of miR-93 with a negative relationship in GC, contradicts with our prediction, the down-regulated of TIMP2 associated with worse GC cell behavior [29]. This former research found the gene function could not cooperate with the clinical outcome neither our study nor other studies [20], this may because TIMP2 was not only the target by ncRNA, the function of TIMP2 was overlapped by different genes which have not been found. TIMP3 also involved in DUMT3B/TIMP3/STAT1/FOXO1 pathway in breast cancer, regulated by miR-29c, knocking down of miR-29c could increase TIMP3 protein level but decrease the methylation of TIMP3, which promoted cell migration, invasion and proliferation [30]. We could infer that a high level of TIMP3 in breast cancer could inhibit the aggressive behavior. But in prostate cancer, TIMP3 involved in ncRNA process accelerating the aggressive behavior [31, 32]. We found that silencing TIMP3 could significantly inhibit the migration and invasion of AGS cells, but it was no use for cell proliferation and clone.
The function of diagnosis and prognosis for TIMP2 and TIMP3 could be affected by serval aspects including their function, ncRNA process, gene-gene correlation, but those two gene expression levels are confirmed in GC, and have a statistically significant difference. Those could be used as biomarkers, but the potential function still needs to study by some methods, including building a ceRNA regulation network, and further basic research.
Although significant results have been found, there are still some shortages in this study. First, the clinical information is not enough to include all potential high-risk factors, including alcohol history and the treatment statue such as the history of radiotherapy, chemotherapy and surgery. Second, there only one database and our research center also do not have enough cases, lacking of the independent cohort to validate the results. Third, the potential function predicted by GSEA need a basic experiment to verify.
Conclusion
This present research is compensation of former study, we combined TIMP2 and TIMP3 then made a survival analysis, and found all low expression of those two genes patients have favorable prognosis, and the diagnostic value is significant. TIMP1 and TIMP2 could be used as diagnostic biomarkers. TIMP2 and TIMP3 could be used as potential biomarkers for GC's prognosis. The nomogram was built to assess survival rate for individual GC patients more directly. The silencing of TIMP3 could inhibit the migration and invasion of gastric cancer cell. The GSEA results could instruct the future basis experiment to verify those results.
Supplementary Material
Supplementary table 1.
Supplementary table 2.
Supplementary table 3.
Acknowledgements
The authors thank the open-access of TCGA database.
Funding
The study was supported by National Natural Science Foundation of GuangXi (No. 2019GXNSFBA185041) and National Natural Science Foundation of China (No. 81760521).
Competing Interests
The authors have declared that no competing interest exists.
References
1. Siegel RL, Miller KD, Jemal A. Cancer statistics, 2020. CA Cancer J Clin. 2020;70:7-30
2. Matsuoka T, Yashiro M. Biomarkers of gastric cancer: Current topics and future perspective. World J Gastroenterol. 2018;24:2818-32
3. Chirco R, Liu XW, Jung KK, Kim HR. Novel functions of TIMPs in cell signaling. Cancer Metastasis Rev. 2006;25:99-113
4. Jackson HW, Defamie V, Waterhouse P, Khokha R. TIMPs: versatile extracellular regulators in cancer. Nat Rev Cancer. 2017;17:38-53
5. Jiang Y, Goldberg ID, Shi YE. Complex roles of tissue inhibitors of metalloproteinases in cancer. Oncogene. 2002;21:2245-52
6. Laitinen A, Hagstrom J, Mustonen H, Kokkola A, Tervahartiala T, Sorsa T. et al. Serum MMP-8 and TIMP-1 as prognostic biomarkers in gastric cancer. Tumour Biol. 2018;40:1010428318799266
7. Bockelman C, Beilmann-Lehtonen I, Kaprio T, Koskensalo S, Tervahartiala T, Mustonen H. et al. Serum MMP-8 and TIMP-1 predict prognosis in colorectal cancer. BMC Cancer. 2018;18:679
8. Wang W, Li D, Xiang L, Lv M, Tao L, Ni T. et al. TIMP-2 inhibits metastasis and predicts prognosis of colorectal cancer via regulating MMP-9. Cell Adh Migr. 2019;13:273-84
9. Rorive S, Lopez XM, Maris C, Trepant AL, Sauvage S, Sadeghi N. et al. TIMP-4 and CD63: new prognostic biomarkers in human astrocytomas. Mod Pathol. 2010;23:1418-28
10. Shaul YD, Yuan B, Thiru P, Nutter-Upham A, McCallum S, Lanzkron C. et al. MERAV: a tool for comparing gene expression across human tissues and cell types. Nucleic Acids Res. 2016;44:D560-6
11. Huang da W, Sherman BT, Lempicki RA. Bioinformatics enrichment tools: paths toward the comprehensive functional analysis of large gene lists. Nucleic Acids Res. 2009;37:1-13
12. Huang da W, Sherman BT, Lempicki RA. Systematic and integrative analysis of large gene lists using DAVID bioinformatics resources. Nat Protoc. 2009;4:44-57
13. Warde-Farley D, Donaldson SL, Comes O, Zuberi K, Badrawi R, Chao P. et al. The GeneMANIA prediction server: biological network integration for gene prioritization and predicting gene function. Nucleic Acids Res. 2010;38:W214-20
14. Shannon P, Markiel A, Ozier O, Baliga NS, Wang JT, Ramage D. et al. Cytoscape: a software environment for integrated models of biomolecular interaction networks. Genome Res. 2003;13:2498-504
15. von Mering C, Jensen LJ, Snel B, Hooper SD, Krupp M, Foglierini M. et al. STRING: known and predicted protein-protein associations, integrated and transferred across organisms. Nucleic Acids Res. 2005;33:D433-7
16. Brew K, Dinakarpandian D, Nagase H. Tissue inhibitors of metalloproteinases: evolution, structure and function. Biochim Biophys Acta. 2000;1477:267-83
17. Gomez DE, Alonso DF, Yoshiji H, Thorgeirsson UP. Tissue inhibitors of metalloproteinases: structure, regulation and biological functions. Eur J Cell Biol. 1997;74:111-22
18. Das SK, Yano S, Wang J, Edwards DR, Nagase H, Dey SK. Expression of matrix metalloproteinases and tissue inhibitors of metalloproteinases in the mouse uterus during the peri-implantation period. Dev Genet. 1997;21:44-54
19. Jarvelainen H, Sainio A, Koulu M, Wight TN, Penttinen R. Extracellular matrix molecules: potential targets in pharmacotherapy. Pharmacol Rev. 2009;61:198-223
20. Wang W, Zhang Y, Liu M, Wang Y, Yang T, Li D. et al. TIMP2 is a Poor Prognostic Factor and Predicts Metastatic Biological Behavior in Gastric Cancer. Sci Rep. 2018;8:9629
21. Yi X, Guo J, Guo J, Sun S, Yang P, Wang J. et al. EZH2-mediated epigenetic silencing of TIMP2 promotes ovarian cancer migration and invasion. Sci Rep. 2017;7:3568
22. Kai AK, Chan LK, Lo RC, Lee JM, Wong CC, Wong JC. et al. Down-regulation of TIMP2 by HIF-1alpha/miR-210/HIF-3alpha regulatory feedback circuit enhances cancer metastasis in hepatocellular carcinoma. Hepatology. 2016;64:473-87
23. Guan Z, Zhang J, Song S, Dai D. Promoter methylation and expression of TIMP3 gene in gastric cancer. Diagn Pathol. 2013;8:110
24. Cao J, Li Z, Yang L, Liu C, Luan X. Association Between Tissue Inhibitor of Metalloproteinase-3 Gene Methylation and Gastric Cancer Risk: A Meta-Analysis. Genet Test Mol Biomarkers. 2016;20:427-31
25. Su CW, Lin CW, Yang WE, Yang SF. TIMP-3 as a therapeutic target for cancer. Ther Adv Med Oncol. 2019;11:1758835919864247
26. Jackson HW, Hojilla CV, Weiss A, Sanchez OH, Wood GA, Khokha R. Timp3 deficient mice show resistance to developing breast cancer. PLoS One. 2015;10:e0120107
27. Diaz-Moralli S, Tarrado-Castellarnau M, Miranda A, Cascante M. Targeting cell cycle regulation in cancer therapy. Pharmacol Ther. 2013;138:255-71
28. Seo DW, Li H, Qu CK, Oh J, Kim YS, Diaz T. et al. Shp-1 mediates the antiproliferative activity of tissue inhibitor of metalloproteinase-2 in human microvascular endothelial cells. J Biol Chem. 2006;281:3711-21
29. Guan H, Li W, Li Y, Wang J, Li Y, Tang Y. et al. MicroRNA-93 promotes proliferation and metastasis of gastric cancer via targeting TIMP2. PLoS One. 2017;12:e0189490
30. Jiao H, Jiang S, Wang H, Li Y, Zhang W. Upregulation of LINC00963 facilitates melanoma progression through miR-608/NACC1 pathway and predicts poor prognosis. Biochem Biophys Res Commun. 2018;504:34-9
31. Adissu HA, McKerlie C, Di Grappa M, Waterhouse P, Xu Q, Fang H. et al. Timp3 loss accelerates tumour invasion and increases prostate inflammation in a mouse model of prostate cancer. Prostate. 2015;75:1831-43
32. Wang X, Shi Z, Liu X, Su Y, Li W, Dong H. et al. Upregulation of miR-191 promotes cell growth and invasion via targeting TIMP3 in prostate cancer. J BUON. 2018;23:444-52
Author contact
![]() Corresponding authors: Tingan Wang, 552319961com, Yuzhou Qin, guangxitumorcom. Tel: (+86) 0771-5310421, Department of Gastrointestinal Surgery, Guangxi Medical University Cancer Hospital, Guangxi Clinical Research Center for Colorectal Cancer, Nanning 530021, Guangxi Zhuang Autonomous Region, China.
Corresponding authors: Tingan Wang, 552319961com, Yuzhou Qin, guangxitumorcom. Tel: (+86) 0771-5310421, Department of Gastrointestinal Surgery, Guangxi Medical University Cancer Hospital, Guangxi Clinical Research Center for Colorectal Cancer, Nanning 530021, Guangxi Zhuang Autonomous Region, China.