Impact Factor ISSN: 1837-9664

 Global reach, higher impact
J Cancer 2021; 12(12):3515-3528. doi:10.7150/jca.51430 This issue Cite
Research Paper
Prognostic Value of Autophagy, Microsatellite Instability, and KRAS Mutations in Colorectal Cancer
Yuanyuan Wang1*, Zhi Zhao2*, Jing Zhuang3, Xinxin Wu4, Zhizhong Wang4, Bing Zhang1, Ge Gao1, Yinping Zhang1, Caili Guo5 ![]() , Qingxin Xia1
, Qingxin Xia1 ![]()
1. Department of Pathology, Affiliated Cancer Hospital of Zhengzhou University, Henan Cancer Hospital, 127 Dongming Road, Zhengzhou 450008, China.
2. Department of Pathology, Yihe Hospital, Henan University, No. 69 Agriculture East Road, Zhengzhou 450008, China.
3. Department of General Surgery, Affiliated Cancer Hospital of Zhengzhou University, Henan Cancer Hospital, 127 Dongming Road, Zhengzhou 450008, China.
4. Department of Molecular Pathology, Affiliated Cancer Hospital of Zhengzhou University, Henan Cancer Hospital, 127 Dongming Road, Zhengzhou 450008, China.
5. Department of Critical Care Medicine, Affiliated Children's Hospital of Zhengzhou University, No. 255 Gangdu Road, Dongsan Street, Zhengzhou 450008, China.
* These two authors contributed equally to this work and thus are regarded as co-first authors.
Received 2020-8-3; Accepted 2021-3-25; Published 2021-4-20
Abstract

Introduction: Autophagy plays pivotal role in various tumors, including colorectal cancer (CRC). Microsatellite instability (MSI) and KRAS mutations are also involved in response to the adjuvant therapy of CRC. We aimed to investigate the relationships among autophagy, KRAS mutations, MSI, clinicopathological parameters, and prognosis in CRC patients. Methods and Results: We tested 200 CRC tumors for autophagy-related protein expression (Beclin 1 and LC3), MSI status, and KRAS mutations. Results: Expression of Beclin 1 and LC3 was higher in CRC, with Beclin 1 significantly correlating with the depth of invasion, whereas LC3 was not associated with clinicopathological parameters. Patients expressing the LC3 proteins experienced a shorter overall survival (OS) after surgery with adjuvant therapy, especially in the MSS/L-CRC subgroup and the mutated KRAS subgroup. MSS/L-CRC patients with KRAS mutations positively expressed the LC3 protein and suffered a shorter OS than LC3 non-expressing patients. In CRC patients who received either capecitabine or capecitabine combined with oxaliplatin post-surgery, the positive expression of LC3 correlated with worse OS compared to patients who did not express LC3. Sequencing showed BRCA1/2 as the most variant genes in all patients. Nevertheless, deleterious variations were more frequent in patients with MSI-H CRC. Conclusions: High LC3 protein expression shows a certain prognostic value in CRC patients. LC3, the MSI status, and KRAS mutations must be considered when selecting an adjuvant therapy for CRC. The detection of these indexes is of great significance to identify high-risk patients who would benefit from autophagy-related anticancer drugs or help to explore more effective treatment options for patients who are resistant to conventional chemotherapy or relapse.
Keywords: Beclin 1, LC3, MSI, KRAS, prognosis, CRC.
Introduction
Colorectal cancer (CRC) is the third most commonly diagnosed malignancy worldwide, seriously endangering human health [1]. At present, treatment for CRC usually involves surgical resection combined with chemotherapy or radiation therapy. However, due to differences in the genetic background among different individuals, drug resistance remains a widely unresolved issue [2]. Therefore, in recent years, achieving personalized precision medical CRC treatment has been the focus of research.
Studies have shown that several molecular mechanisms are involved in the development of CRC tumors, of which microsatellite instability (MSI) (15%) and chromosomal instability (CIN) (75%) play the most important roles [3, 4]. The gold standard for MSI testing recommended by the National Cancer Institute is using the polymerase chain reaction (PCR) method to detect MSI markers (BAT25, BAT26, D2S123, D5S346, and D17S250) [5]. According to the test results of MSI analysis, patients with CRC can be divided into three groups: high-frequency microsatellite instability (MSI-H) with two or more genes showing instability, low-frequency MSI (MSI-L) with only one locus showing genetic deletion, and microsatellite stable (MSS) with no gene loss.
The KRAS proto-oncogene (KRAS) is known to belong to the RAS family of proteins and has been reported to be frequently mutated in various types of tumors, including CRC [6]. Activation of KRAS has been shown to depend on the receptor tyrosine kinase (RTK) MAPK/PI3K signaling pathway that has been known to promote the cellular proliferation of the tumor. The mutant KRAS is constitutively activated without requiring epidermal growth factor receptor (EGFR) signals, whereas the wild type KRAS gene requires an EGFR signal to be activated. So, KRAS mutations have been shown to directly lead to treatment failure in patients with CRC undergoing an anti-EGFR therapy, such as cetuximab [7, 8]. National Comprehensive Cancer Network (NCCN) guidelines explicitly list cetuximab as a first-line treatment for KRAS wild type CRC.
Autophagy removes damaged or aged intracellular organelles and abnormal proteins, which is essential for cell homeostasis [9]. Recently, autophagy has been extensively reported in various types of tumors, including breast, pulmonary, brain, prostate, and colorectal cancer. To date, due to its dual function, autophagy was considered to be a double-edged sword in carcinogenesis. The process of autophagy is known to be regulated and encoded by autophagy-related genes (ATGs), with more than 30 ATGs being identified in yeast [10], of which Beclin 1 (BECN1) and microtubule-associated protein 1A/1B-light chain 3 (LC3) are the two critical autophagy markers used in this study. The reported results on autophagy in CRC have been inconclusively conflicting, so its function in CRC development and progression remains unclear.
The guidelines of NCCN indicate that patients with stage II MSI-H CRC have a better outcome but do not benefit from fluorouracil (5-FU) adjuvant therapy [11]. It has been shown that autophagy inhibition could increase 5-FU-induced apoptosis in vitro [12, 13]. So, we speculate that autophagy might be related to the failure of MSI-H patients from 5-FU treatment. Furthermore, autophagy was induced by EGFR siRNA in cancer cells [14], and KRAS acts downstream of EGFR. In conclusion, the relationship between autophagy and MSI/KRAS is still unclear. In this study, the status of MSI, KRAS, and autophagy-related proteins, namely, Beclin 1 and LC3 in CRC patients were evaluated. We focused on the correlation between MSI, KRAS, and autophagy in CRC and the prognosis to provide the foundation for studying the targeted antitumor therapy.
Materials and methods
Patients
For this study, 200 formalin-fixed paraffin-embedded (FFEP) CRC tumor tissues were collected from the Department of Pathology, Henan Cancer Hospital (Zhengzhou, China). Control samples were derived from normal mucosal tissues ≥ 5 cm away from the tumor edge for immunohistochemistry. All patients with CRC were categorized based on the recommendations by the seventh American Joint Committee on Cancer Tumor-Node-Metastasis (TNM) staging [15]. The patients with CRC consisted of 110 males and 90 females, aged 31-85 y with a median age of 60 y. None had received radiotherapy or chemotherapy prior to surgery, excluding those with genetic adenomatous polyposis and Lynch syndrome. There were 21 patients in stage I, 95 in stage II, 73 in stage III, and 11 in stage IV. Among the 200 patients, 51 patients did not receive any adjuvant therapy after surgery, 24 patients received capecitabine chemotherapy, 72 patients received capecitabine plus oxaliplatin combined chemotherapy, and 46 patients received other chemotherapy or combined radiotherapy. The postoperative information of 7 patients was unknown. All patients were enrolled from March to November 2015 following surgery. Clinical follow-up information was obtained by telephone calls from the date of the surgery until January 2021. Of the 200 patients with CRC enrolled in the present study, 51 patients did not receive adjuvant therapy after surgery; 7 patients whose postoperative information was unknown were also excluded from the survival analysis; finally, 8 cases did not complete their follow-up. In total, 72 patients survived, and 62 patients died. The OS of all patients ranged from 4 to 66 mo. The study was approved by the Institutional Ethics Committee of the Affiliated Cancer Hospital of Zhengzhou University. Signed informed consent forms were obtained from all patients or their guardians.
Immunohistochemistry (IHC)
Tissue sections (4 µm thick) for immunohistochemistry were deparaffinized in xylene, followed by rehydration with serially decreased ethanol concentrations. Then, tissues were placed in citrate buffer (pH 6.0) for antigen retrieval (95 ºC, 15 min). Endogenous peroxidase was blocked by 3% H2O2 solution for 10 min at 25 ºC. Sections were incubated with each primary antibody for 2 h at 25 ºC, washed three times with phosphate-buffered saline (PBS), and then incubated with secondary antibodies for 20 min at 25 ºC. Subsequently, sections were incubated with DAB substrate for 5-10 min. Anti-LC3 (ab48394, 1:800) and anti-Beclin1 (ab114071, 1:450) were purchased from Abcam (Cambridge, UK). The expression of autophagy-related proteins was evaluated by measuring the percentage of positively stained cells and the staining intensity. The percentage of positively stained cells was graded as follows: 0, ≤ 5%; 1, 6-35%; 2, 36-65%; and 3, 66-100%. The staining intensity was graded as follows: 0, no staining; 1, buff; 2, yellow; and 3, brown. The final staining score was calculated by multiplying the above-obtained scores. Tumors with an immunoreactive score of 0-3 were designated as negative, whereas those with 4-9 were classified as positive. All sections were submitted to 2 pathologists for evaluation.
Amplification refractory mutation system PCR (ARMS-PCR)
Extracted DNA from CRC paraffin blocks was subjected to PCR analysis according to the manufacturer's instructions of the human KRAS gene mutation detection kit (AmoyDx, Xiamen, China). The reaction protocol was as follows: 95 ºC, 5 min; 95 ºC, 25 s, 64 ºC, 20 s, 72 ºC, 20 s (15 cycles); 93 ºC, 25 s, 60 ºC, 35 s, 72 ºC, 20 s (31 cycles); and 72 ºC for 10 min. The FAM and HEX signals were collected under the condition of 60 ºC. The results of this study illustrate the potential use of GAPDH as a reference gene to analyze KRAS mutations.
PCR-capillary electrophoresis
The PCR-capillary electrophoresis was recommended for the detection of MSI in CRC samples. DNA was extracted to detect MSI using 5 microsatellite sites, including BAT25, BAT26, D2S123, D5S346, and D17S250. The primer sequences were as follows: BAT25 forward, 5'-TCGCCTCCAAGAATGTAAGT-3' and reverse, 5'-TCTGGATTTTAACTATGGCTC-3'; BAT26 forward, 5'-TGACTACTTTTGACTTCAGCC-3' and reverse, 5'-AACCATTCAACATTTTTAACC-3'; D2S123 forward, 5'-AAACAGGATGCCTGCCTTTA-3' and reverse, 5'-GGACTTTCCACCTATGGGAC-3'; D5S346 forward, 5'-ACTCACTCTAGTGATAAATCGGG-3' and reverse, 5'-AGCAGATAAGACAAGTATTACTAG-3'; and D17S250 forward, 5'-GGAAGAATCAAATAGACAAT-3' and reverse, 5'-GCTGGCCATATATATATTTAAACC-3'. The reaction system was comprised of 20 μL, including 2 μL primers, 10 μL enzymes, 1-8 μL template DNA, and 0-7 μL deionized water. The conditions of the PCR reaction were as follows: denaturation (42 ºC, 5 min; 94 ºC, 5 min), 40 cycles (94 ºC, 15 s; 55 ºC, 25 s; 72 ºC, 50 s); and 72 ºC for 10 min. The ABI 3500XL Genetic Analyzer (Applied Biosystems, Foster City, CA, USA) was used to detect the PCR products following the manufacturer's instructions. Results were analyzed using the GeneMapper v4.1 (Applied Biosystems) software.
Next-generation sequencing
Library construction was performed following the manufacturer's protocol of the 19 gene sequencing kit (Otogenetics, Atlanta, USA), which includes the DNA sequences of all exons of androgen receptor (AR), ATM serine/threonine kinase (ATM), BRCA1 associated RING domain 1 (BARD1), BRCA1 DNA repair associated (BRCA1), BRCA2 DNA repair associated (BRCA2), BRCA1 interacting protein C-terminal helicase 1 (BRIP1), caspase 8 (CASP8), cadherin 1 (CDH1), checkpoint kinase 2 (CHEK2), DIRAS family GTPase 3 (DIRAS3), Erb-B2 receptor tyrosine kinase 2 (ERBB2), nibrin (NBN), partner and localizer of BRCA2 (PALB2), phosphatase and tensin homolog (PTEN), RAD50 double-strand break repair protein (RAD50), RAD51 recombinase (RAD51), serine/threonine kinase 11 (STK11), transforming growth factor-beta 1 (TGFB1), and tumor protein p53 (TP53). Briefly, 100 μL of DNA was extracted from each sample and fragmented to prepare the DNA library by performing end-repairing, adaptor ligation, size selection (250-700 bp), and hybridization. Then, DNA samples were amplified, captured with Streptavidin Dynabeads (Otogenetics), and selected with magnetic beads followed by subsequent PCR amplification and purification using AMPure beads (Otogenetics). The final pool was used for sequencing using Illumina MiSeq sequencer (Illumina, California, USA) (250-750 bp).
Statistical analysis
Statistical analysis was performed using the Statistical Package for the Social Science (IBM Corp., Armonk, NY, USA) version 21.0. The statistical significance of the protein expression of autophagy markers (Beclin 1 and LC3) and MSI in the tumor samples versus normal controls were compared using the χ2 or Fisher's exact and paired-samples t-tests. The statistical significance of KRAS mutations in the tumor versus control samples was compared using paired-samples χ2 test. The relationship between the protein expression of autophagy markers, MSI, as well as mutations in KRAS and clinicopathological factors were also determined by the same methods. The correlation of autophagy, MSI, and KRAS was evaluated by Spearman's rank correlation test. Kaplan-Meier and log-rank methods were used to calculate overall survival (OS) rates, and the survival curves were compared by the log-rank test. In all statistical analyses, a P-value < 0.05 was considered statistically significant.
Results
Beclin 1 and LC3 proteins expression in CRC
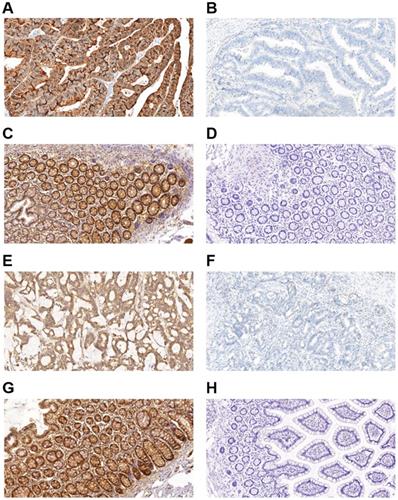
Figure 1 shows representative immunohistochemistry results, and the expression of autophagy-related proteins in CRC tumor cells was predominantly localized in the cytoplasm. Table 1 compared the expression of autophagy-related proteins in CRC. A paired-samples t-test demonstrated that autophagy-related proteins were differentially expressed between CRC tissues and controls, while both the P-values of Beclin 1 and LC3 were less than 0.001 (Table 1). The positive expression frequencies of the autophagy-related proteins were demonstrated to be 84.00% (168/200) for Beclin 1, and 86.50% (173/200) for LC3 among the 200 CRC tumor samples. In contrast, in 200 normal mucosal tissues, we observed 4 samples expressing Beclin 1 and 6 samples expressing LC3. The expression of the Beclin 1 (χ2 = 274.337, P < 0.001) and LC3 (χ2 = 281.999, P < 0.001) autophagy-related proteins was much higher in CRC tumor samples than in the intestinal mucosa group (Table 1). No significant correlation was demonstrated between the protein expression of Beclin 1 and LC3 (r = 0.067, P = 0.345).
Immunohistochemical staining for autophagy-related proteins (Beclin 1 and LC3) in CRC shows positivity in the cytoplasm. Beclin 1 protein positive (score: 9) (A) and negative expression (B) in CRC; Beclin 1 protein positive (score: 9) (C) and negative expression (D) in normal intestinal mucosa; LC3 protein positive (score: 9) (E) and negative expression (F) in CRC; LC3 protein positive (score: 9) (G) and negative expression (H) in the normal intestinal mucosa. All the pictures are magnified 100×.
The expression of autophagy-related proteins (Beclin 1 and LC3) in the colorectal cancer.
| Score | Beclin1 | t | P | χ2 | P | LC3 | t | P | χ2 | P | ||
|---|---|---|---|---|---|---|---|---|---|---|---|---|
| tumor samples n (%) | intestinal mucosa n (%) | tumor samples n (%) | intestinal mucosa n (%) | |||||||||
| 9 | 107(53.5) | 2(1.0) | 28.069 | <0.001 | 274.337 | <0.001 | 95(47.5) | 4(2.0) | 30.066 | <0.001 | 281.999 | <0.001 |
| 6 | 61(30.5) | 2(1.0) | 78(39.0) | 2(1.0) | ||||||||
| 3 | 8(4.0) | 11(5.5) | 11(5.5) | 10(5.0) | ||||||||
| 0 | 24(12.0) | 185(92.5) | 16(8.0) | 184(92.0) | ||||||||
Association between Beclin 1 and LC3 with clinicopathologic features, and overall survival (OS) in CRC
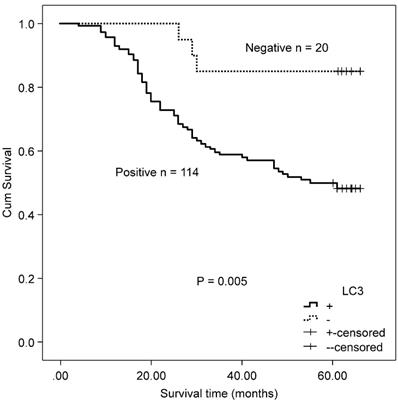
The association between the autophagy-related proteins (Beclin 1 and LC3) and clinicopathologic features in CRC samples was further analyzed (Table 2). Positive expression of Beclin 1 significantly correlated with the depth of invasion (P = 0.005), whereas no significant correlation was observed between Beclin 1 expression and other clinicopathologic parameters and OS (χ2 = 2.846, P = 0.092) by Kaplan-Meier analysis. LC3 expression was not associated with any of the assessed clinicopathological parameters, but patients with positive expression of LC3 experienced a worse OS after surgery than those with a negative protein expression (χ2 = 7.917, P = 0.005, Fig. 2).
Association between the expression of autophagy-related proteins Beclin 1 and LC3 and clinicopathologic features of colorectal cancer.
| Variable | n | Beclin 1 | LC3 | ||||
|---|---|---|---|---|---|---|---|
| + (%) | -(%) | P | + (%) | -(%) | P | ||
| Gender | 0.587 | 0.442 | |||||
| Male | 110 | 91 (82.72) | 19 (17.28) | 97 (88.18) | 13 (11.82) | ||
| Female | 90 | 77 (85.56) | 13 (14.44) | 76 (84.44) | 14 (15.56) | ||
| Age (y) | 0.852 | 0.661 | |||||
| ≤ 50 | 59 | 50 (84.75) | 9 (15.25) | 52 (88.14) | 7 (11.86) | ||
| > 50 | 141 | 118 (83.69) | 23 (16.31) | 121 (85.82) | 20 (14.18) | ||
| Lymph node metastasis | 0.083 | 0.327 | |||||
| No | 116 | 93 (80.17) | 23 (19.83) | 98 (84.48) | 18 (15.52) | ||
| Yes | 84 | 75 (89.28) | 9 (10.72) | 75 (89.28) | 9 (10.72) | ||
| Location | 0.852 | 0.356 | |||||
| Right hemicolon | 59 | 50 (84.75) | 9 (15.25) | 49 (83.05) | 10 (16.95) | ||
| Left hemicolon | 141 | 118 (83.69) | 23 (16.31) | 124 (87.94) | 17 (12.06) | ||
| Tumor differentiation | 0.887 | 0.778 | |||||
| Poor | 79 | 66 (83.54) | 13 (16.46) | 69 (87.34) | 10 (12.66) | ||
| Moderate/well | 121 | 102 (84.30) | 19 (15.70) | 104 (85.95) | 17 (14.05) | ||
| Mucous adenocarcinoma | 0.703 | 0.846 | |||||
| No | 164 | 137 (83.54) | 27 (16.46) | 141 (85.98) | 23 (14.02) | ||
| Yes | 36 | 31 (86.11) | 5 (13.89) | 32 (88.89) | 4 (11.11) | ||
| Depth of invasion | 0.005* | 0.401 | |||||
| T1/T2 | 30 | 20 (66.67) | 10 (33.33) | 24 (80.00) | 6 (20.00) | ||
| T3/T4 | 170 | 148 (87.06) | 22 (12.94) | 149 (87.65) | 21 (12.35) | ||
| TNM stage | 0.340 | 0.327 | |||||
| I/II | 116 | 95 (81.90) | 21 (18.10) | 98 (84.48) | 18 (15.52) | ||
| III/IV | 84 | 73 (86.90) | 11 (13.10) | 75 (89.29) | 9 (10.71) | ||
| MSI | 0.341 | 0.341 | |||||
| MSI-H | 26 | 24 (92.31) | 2 (7.69) | 21 (80.76) | 5 (19.24) | ||
| MSS/L | 174 | 144 (82.75) | 30 (17.25) | 152 (87.36) | 22 (12.64) | ||
| KRAS mutation status | 0.637 | 0.341 | |||||
| Mutated type | 80 | 66 (82.50) | 14 (17.50) | 68 (85.00) | 12 (15.00) | ||
| Wild type | 120 | 102 (85.00) | 18 (15.00) | 105 (87.50) | 15 (12.50) | ||
*P < 0.05 indicates a significant association among the variables. MSI, microsatellite instability; MSI-H, high frequency microsatellite instability; MSI-L, low frequency microsatellite instability; MSS, microsatellite stable.
Kaplan-Meier survival curves comparing survival time for patients with CRC with LC3 expression.
Microsatellite instability (MSI) in CRC
In this study, PCR was used to evaluate the state of MSI in CRC samples. Accordingly, we identified 26 samples with MSI-H, one sample with low MSI-L, and 173 samples that were MSS (Supplementary Table 1). Supplementary Figure 1 shows the MSI state in samples. The frequency of MSI-H was 13% in CRC, whereas the control samples were all MSS. MSI-H was significantly different between CRC and control groups (χ2 = 27.807, P < 0.001; t = 5.237, P < 0.001).
Association between MSI and clinicopathologic features, and OS in CRC
As only 1 case of MSI-L-CRC was found, MSI-L and MSS were combined into 1 group for statistical analysis. Concomitantly, we researched the relationship between the MSI-H and MSS/L groups in CRC (Table 3). We found that the MSI-H state was related to age, lymph node metastasis, location, and tumor differentiation, but not to gender, mucous adenocarcinoma, depth of invasion, and TNM stage. No association was found between MSI and OS in all patients with CRC (χ2 = 0.360, P = 0.548).
Association between MSI, KRAS mutations, and clinicopathologic features of colorectal cancer.
| Variable | Cases | MSI | KRAS | ||||
|---|---|---|---|---|---|---|---|
| MSI-H (%) | MSS/L (%) | P | Mutation type (%) | Wild type (%) | P | ||
| Gender | 0.676 | <0.001* | |||||
| Male | 110 | 15 (13.64) | 95 (86.36) | 32 (29.09) | 78 (70.91) | ||
| Female | 90 | 11 (12.22) | 79 (87.78) | 48 (53.33) | 42 (46.67) | ||
| Age (y) | 0.046* | 0.899 | |||||
| ≤50 | 59 | 12 (20.34) | 47 (79.66) | 24 (40.68) | 35 (59.32) | ||
| >50 | 141 | 14 (9.92) | 127 (90.08) | 56 (39.72) | 85 (60.28) | ||
| Lymph node metastasis | 0.036* | 0.061 | |||||
| No | 116 | 20 (17.24) | 96 (82.76) | 40 (34.48) | 76 (65.52) | ||
| Yes | 84 | 6 (7.14) | 78 (92.86) | 40 (47.62) | 44 (52.38) | ||
| Location | <0.001* | 0.411 | |||||
| Right hemicolon | 59 | 17 (28.81) | 42 (71.19) | 21 (35.59) | 38 (64.41) | ||
| Left hemicolon | 141 | 9 (6.38) | 132 (93.62) | 59 (41.84) | 82 (58.16) | ||
| Tumor differentiation | 0.004* | 0.906 | |||||
| Poor | 79 | 17 (21.52) | 62 (78.48) | 32 (40.50) | 47 (59.50) | ||
| Moderate/well | 121 | 9 (7.44) | 112 (92.56) | 48 (39.67) | 73 (60.33) | ||
| Mucous adenocarcinoma | 0.204 | 0.548 | |||||
| No | 164 | 19 (11.56) | 145 (88.46) | 64 (39.02) | 100 (60.97) | ||
| Yes | 36 | 7 (19.44) | 29 (80.56) | 16 (44.44) | 20 (5.56) | ||
| Depth of invasion | 0.158 | 0.043* | |||||
| T1/T2 | 30 | 1 (3.33) | 29 (96.67) | 17 (56.67) | 13 (43.33) | ||
| T3/T4 | 170 | 25 (14.71) | 145 (85.29) | 63 (37.06) | 107 (62.94) | ||
| TNM stage | |||||||
| I/II | 116 | 19 (16.38) | 97 (83.62) | 0.095 | 38 (32.76) | 78 (67.24) | 0.014* |
| III/IV | 84 | 7 (8.33) | 77 (91.67) | 42 (50.00) | 42 (50.00) | ||
*P < 0.05 indicates a significant association among the variables. MSI, microsatellite instability; MSI-H, high frequency microsatellite instability.
Association between the autophagy-related proteins (Beclin 1 and LC3) and clinicopathologic features, and OS in colorectal cancer of the MSI subgroup
There was no significant correlation observed between autophagy-related proteins and MSI by χ2 test (Beclin 1: χ2 = 0.906, P = 0.341; LC3: χ2 = 0.371, P = 0.341, Table 2), and the Spearman's rank test (Beclin 1: r = 0.088, P = 0.217; LC3: r = ‑0.065, P = 0.362). Expression of both Beclin 1 and LC3 was shown to be unrelated to all clinicopathological parameters in patients with MSI-H CRC. No association was also found between autophagy-related proteins and OS in patients with MSI-H CRC (Beclin 1: χ2 = 0.609, P = 0.435; and LC3: χ2 = 1.332, P = 0.248).
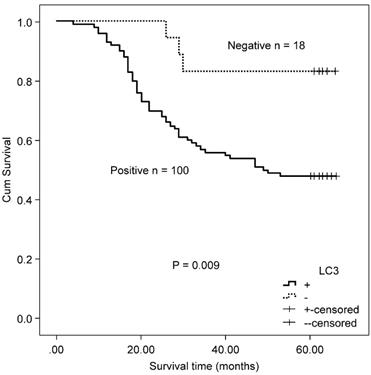
In the MSS/L-CRC subgroup, the expression of Beclin 1 was demonstrated to be higher in the T3/T4 group (85.52%) compared with the T1/T2 group (68.97%) (Table 4). No association was found between Beclin 1 protein expression and OS in MSS/L-CRC patients (χ2 = 2.618, P = 0.106). The expression of LC3 was shown to be unrelated to all clinicopathological parameters in the MSS/L-CRC subgroup (Table 4). LC3-expressing patients in the MSS/L-CRC subgroup had a worse OS than those non-expressing LC3 (χ2 = 6.732, P = 0.009, Fig. 3).
Kaplan-Meier survival curves comparing survival time for CRC patients with MSS/L expressing LC3.
Association between the expression of autophagy-related proteins Beclin 1 and LC3 and clinicopathologic features in patients with colorectal cancer and MSS/L.
| Variable | n | Beclin 1 | LC3 | ||||
|---|---|---|---|---|---|---|---|
| + (%) | - (%) | P | + (%) | - (%) | P | ||
| Gender | 0.802 | 0.168 | |||||
| Male | 95 | 78 (82.11) | 17 (17.89) | 86 (90.53) | 9 (9.47) | ||
| Female | 79 | 66 (83.54) | 13 (16.46) | 66 (83.54) | 13 (16.46) | ||
| Age (y) | 0.963 | 0.628 | |||||
| ≤50 | 47 | 39 (82.98) | 8 (17.02) | 42 (89.36) | 5 (10.64) | ||
| >50 | 127 | 105 (82.68) | 22 (17.32) | 110 (86.61) | 17 (13.39) | ||
| Lymph node metastasis | 0.073 | 0.693 | |||||
| No | 96 | 75 (78.13) | 21 (21.87) | 83 (86.46) | 13 (13.54) | ||
| Yes | 78 | 69 (88.46) | 9 (11.54) | 69 (88.46) | 9 (11.54) | ||
| Location | 0.722 | 0.368 | |||||
| right hemicolon | 42 | 34 (80.95) | 8 (19,05) | 35 (83.33) | 7 (16.67) | ||
| left hemicolon | 132 | 110 (83.33) | 22 (16.67) | 117 (88.64) | 15 (11.36) | ||
| Tumor differentiation | 0.897 | 0.689 | |||||
| Poor | 62 | 51 (82.26) | 11 (17.74) | 55 (88.71) | 7 (11.29) | ||
| Moderate/well | 112 | 93 (83.04) | 19 (16.96) | 97 (86.61) | 15 (13.39) | ||
| Mucous adenocarcinoma | 0.590 | 0.475 | |||||
| No | 145 | 119 (82.07) | 26 (17.93) | 125 (86.21) | 20 (13.79) | ||
| Yes | 29 | 25 (86.21) | 4 (13.79) | 27 (93.10) | 2 (6.90) | ||
| Depth of invasion | 0.031* | 0.610 | |||||
| T1/T2 | 29 | 20 (68.97) | 9 (31.03) | 24 (82.76) | 5 (17.24) | ||
| T3/T4 | 145 | 124 (85.52) | 21 (14.48) | 128 (88.28) | 17 (11.72) | ||
| TNM stage | 0.358 | 0.735 | |||||
| I/II | 97 | 78 (80.41) | 19 (19.59) | 84 (86.60) | 13 (13.40) | ||
| III/IV | 77 | 66 (85.71) | 11 (14.29) | 68 (88.31) | 9 (11.69) | ||
*P < 0.05 indicates a significant association between variables. MSI, microsatellite instability; MSI-L, low frequency microsatellite instability; MSS, microsatellite stable.
KRAS mutations in CRC
Following qPCR analysis, mutations in the KRAS gene were found in 80 of the 200 CRC samples (codon 12 in 65 cases; codon 13 in 15 cases), with a mutation rate of 40.00% (Supplementary Table 2). Supplementary Figure 2 shows KRAS mutation in CRC samples. All control samples were KRAS wild type; KRAS mutation rates in CRC samples were higher than in control samples (χ2 = 100.00, P < 0.001).
Association between KRAS mutations and clinicopathologic features, and OS in CRC
In this study, the rate of KRAS mutations was related to gender, depth of invasion, and TNM stage (Table 3). Moreover, our findings showed no statistically significant association between mutations in the KRAS gene and age, lymph node metastasis, tumor location, tumor differentiation, or mucous adenocarcinoma (Table 3). No association was found between mutations in the KRAS gene and OS in patients with CRC (χ2 = 0.305, P = 0.581).
Correlation of the autophagy-related proteins (Beclin 1 and LC3) and clinicopathologic features, and OS in colorectal cancer with mutated/wild type KRAS
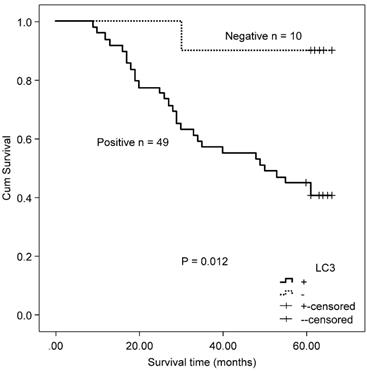
There was no significant correlation observed between autophagy-related proteins and KRAS by χ2 test (Beclin 1: χ2 = 0.223, P = 0.637; LC3: χ2 = 0.257, P = 0.341, Table 2) and the Spearman's rank test (Beclin 1: r = ‑0.033, P = 0.639; LC3: r = ‑0.026, P = 0.614). Both the protein expression of Beclin 1 and LC3 were unrelated to all clinicopathological parameters in the mutated KRAS gene subgroup. Accordingly, no association was found between the protein expression of Beclin 1 and OS in the mutated KRAS gene subgroup (χ2 = 0.429, P = 0.513). Patients with positive protein expression of LC3 exhibited a poorer outcome compared with patients with negative protein expression of LC3 in the mutated KRAS subgroup (χ2 = 6.330, P = 0.012, Fig. 4).
Kaplan-Meier survival curves comparing survival time for CRC patients with mutated KRAS expressing LC3.
The expression of Beclin 1 was demonstrated to be unrelated to all clinicopathological parameters (Table 5). The expression of LC3 was related to TNM stage III/IV (P = 0.014), whereas it was unrelated to other clinicopathological parameters in the subgroup of patients with CRC with wild type KRAS (Table 5). No significant association was found between autophagy-related proteins (Beclin 1 and LC3) and OS in the CRC patient subgroup with wild type KRAS (Beclin 1: χ2 = 2.800, P = 0.094; and LC3: χ2 = 2.362, P = 0.124).
Association between the expression of autophagy-related proteins Beclin 1 and LC3 and clinicopathologic features in patients with colorectal cancer and wild type KRAS.
| Variable | n | Beclin 1 | LC3 | ||||
|---|---|---|---|---|---|---|---|
| + (%) | - (%) | P | + (%) | - (%) | P | ||
| Gender | 0.486 | 0.311 | |||||
| Male | 78 | 65 (83.33) | 13 (16.67) | 70 (89.74) | 8 (10.26) | ||
| Female | 42 | 37 (88.10) | 5 (11.90) | 35 (83.33) | 7 (16.67) | ||
| Age (y) | 0.673 | 0.595 | |||||
| ≤ 50 | 35 | 29 (82.86) | 6 (17.14) | 32 (91.43) | 3 (8.57) | ||
| > 50 | 85 | 73 (85.88) | 12 (14.12) | 73 (85.88) | 12 (14.11) | ||
| Lymph node metastasis | 0.396 | 0.152 | |||||
| No | 76 | 63 (82.89) | 13 (17.11) | 64 (84.21) | 12 (15.79) | ||
| Yes | 44 | 39 (88.64) | 5 (11.36) | 41 (93.18) | 3 (6.82) | ||
| Location | 0.869 | 0.656 | |||||
| right hemicolon | 38 | 32 (84.21) | 6 (15.79) | 32 (84.21) | 6 (15.79) | ||
| left hemicolon | 82 | 70 (85.37) | 12 (14.63) | 73 (89.02) | 9 (10.98) | ||
| Tumor differentiation | 0.979 | 0.104 | |||||
| Poor | 47 | 40 (85.11) | 7 (14.89) | 44 (93.62) | 3 (6.38) | ||
| Moderate/well | 73 | 62 (84.93) | 11 (15.07) | 61 (83.56) | 12 (16.43) | ||
| Mucous adenocarcinoma | 1.000 | 1.000 | |||||
| No | 100 | 85 (85.00) | 15 (15.00) | 87 (87.00) | 13 (13.00) | ||
| Yes | 20 | 17 (85.00) | 3 (15.00) | 18 (90.00) | 2 (10.00) | ||
| Depth of invasion | 0.202 | 0.912 | |||||
| T1/T2 | 13 | 9 (69.23) | 4 (30.77) | 12 (92.31) | 1 (7.69) | ||
| T3/T4 | 107 | 93 (86.92) | 14 (13.08) | 93 (86.92) | 14 (13.08) | ||
| TNM stage | 0.872 | ||||||
| I/II | 78 | 66 (84.62) | 12 (15.38) | 64 (82.05) | 14 (17.95) | 0.014* | |
| III/IV | 42 | 36 (85.71) | 6 (14.29) | 41 (97.62) | 1 (2.38) | ||
*P < 0.05 indicates a significant association between variables.
Correlation of autophagy-related proteins (Beclin 1 and LC3) and OS in MSS/L colorectal cancer with mutated/wild type KRAS
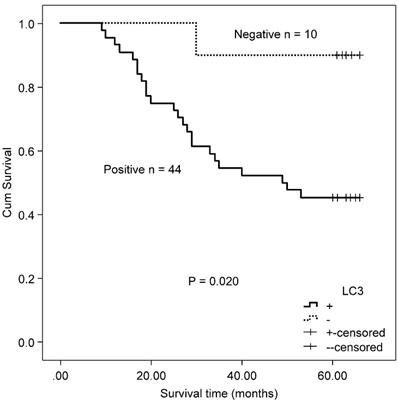
A total of 118 patients with MSS/L colorectal cancer, including 54 patients with KRAS mutations and 64 KRAS wild type patients, were included in this study. The MSS/L-CRC patients bearing KRAS mutations positively expressed LC3 protein and suffered a shorter OS than LC3 non-expressing patients (χ2 = 5.402, P = 0.020, Fig 5). There was no significant association between Beclin 1 and OS in MSS/L-CRC patients with KRAS mutations (χ2 = 0.245, P = 0.620). No association between autophagy-related proteins (Beclin 1 and LC3) and OS was found in the group of MSS/L-CRC patients with wild type KRAS (Beclin 1: χ2 = 2.969, P = 0.085; and LC3: χ2 = 1.762, P = 0.184).
Kaplan-Meier survival curves comparing survival time for MSS/L-CRC patients with mutated KRAS with LC3 expression.
Correlation of autophagy-related proteins (Beclin 1 and LC3) and OS in CRC patients received either capecitabine or capecitabine combined with oxaliplatin after surgery
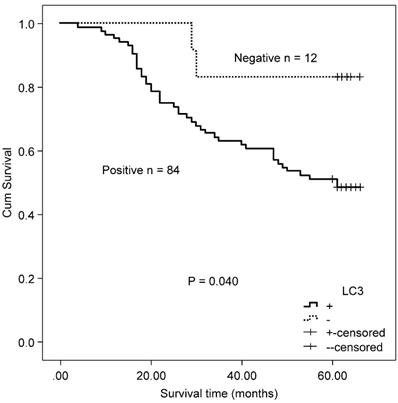
Twenty-four patients received capecitabine adjuvant therapy after surgery, and 72 patients received capecitabine combined with oxaliplatin chemotherapy after surgery. There was no difference in the expressions of autophagy-related proteins (Beclin 1 and LC3) between the two therapeutic groups (Beclin 1: χ2 = 0.933, P = 0.334; and LC3: χ2 = 261, P = 0.609). In CRC patients who received either capecitabine or capecitabine combined with oxaliplatin post-surgery, positive LC3 expression correlated with worse OS relative to non-expressing patients (χ2 = 4.216, P = 0.040, Fig. 6). No association was found between Beclin 1 protein expression and OS in these patients (χ2 = 2.084, P = 0.149).
Kaplan-Meier survival curves comparing survival time for LC3 expression with CRC patients who received either capecitabine or capecitabine combined with oxaliplatin after surgery.
Sequencing results of 19 genes in CRC
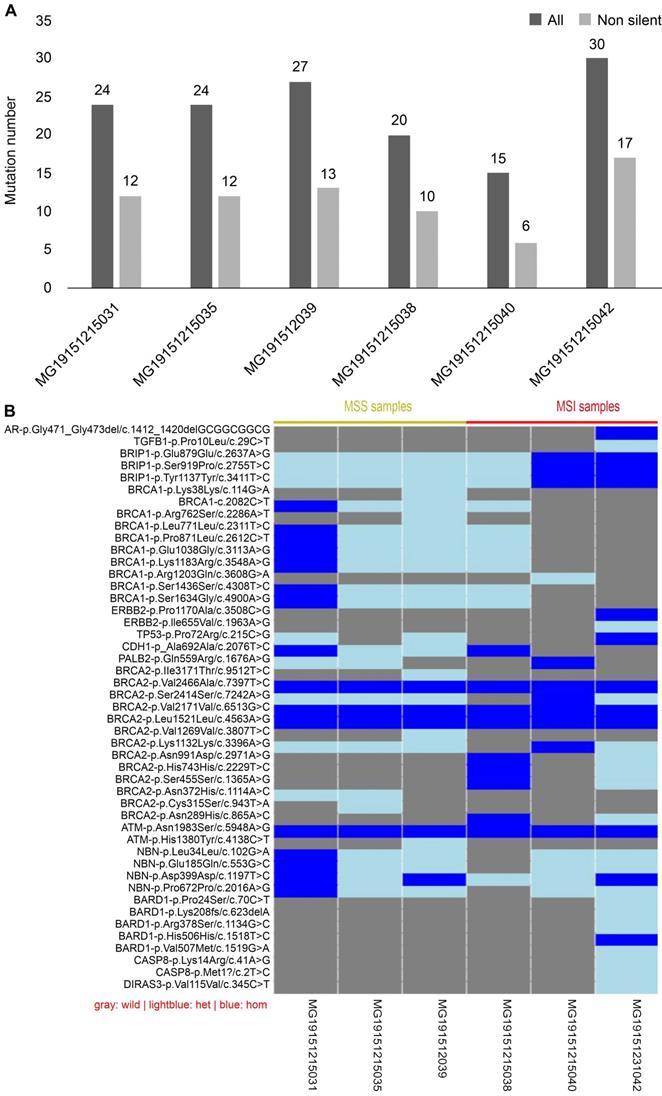
Mismatch repair (MMR), which belongs to the DNA repair systems, plays a crucial role in maintaining genome stability [16]. MSI has been reported to be caused by mutations in MMR [17]. The exon regions of 19 genes, including those involved in the DNA repair systems of genes, tumor suppressor genes, and common genetic markers in tumors, were captured by next-generation sequencing. Forty-seven mutation sites were found in six CRC tissues, including two deletions and 45 single nucleotide polymorphisms (SNP). Of the 47 mutation sites, 44 were known, with 26 being missense mutation sites. Each sample had a different number of variations (Fig. 7A). Compared with MSI samples, the difference in the variations in MSS samples was demonstrated to be smaller, whether containing synonymous mutations or not. Because each sample had a different gene mutation status, we show the variations in all samples one by one in Fig. 7B. For example, BARD1 p.Lys2208fs is a frameshift mutation, whereas CASP8 p.Met1 is a nonsense mutation. Both are known to be high-risk variations and were demonstrated to occur in MSI-H samples. Although all intersample variations were mainly concentrated on the BRCA1 and BRCA2 genes among the 19 DNA damage repair genes, these variations were shown not to be pathogenic factors.
Results of next-generation sequencing in 6 cases CRC samples. (A) Comparison of variants among samples: gray is the number of all variants, while black is the number of variants that do not contain synonymous mutations. (B) Information of the genetic variation of all samples: blue represents a homozygous variation, light blue represents a heterozygous variation, and gray represents no variation in the sample.
Discussion
Autophagy is known to be involved in tumor cell survival and growth [18, 19]. In the present study, we investigated the protein expression and clinical significance of two autophagy-related proteins, namely Beclin 1 and LC3, in CRC by IHC. Consistent with literature reports [20, 21], we found both the protein expression of Beclin 1 and LC3 to be significantly higher in CRC tissues than in normal counterpart tissues. Wu et al. showed that LC3 expression was associated with Beclin 1 by Spearman analysis; however, we did not find a significant correlation [20]. They also reported that the protein expression of Beclin 1 was not significantly associated with clinicopathological parameters, including patient age, gender, tumor size, primary site, tumor differentiation, TNM stage, and lymph node metastasis [20]. Our results were consistent with those observations. We found that the positive expression of Beclin 1 significantly correlated with the depth of invasion, and the correlation was more robust in the T3/T4 group. In contrast, Schmitz et al. reported that the positive expression of Beclin 1 was not associated with the depth of invasion [22]. On the other hand, one study showed that the LC3 protein overexpression was associated with reduced cell differentiation and lymph node metastasis [20]. In contrast, another study showed that the overexpression of the LC3 protein was not associated with patient sex, age, depth of invasion, TNM stage, and lymph node metastasis [21]. In the present study, LC3 expression was demonstrated not to be associated with any assessed clinicopathological parameters. Kaplan-Meier survival analysis of LC3 expressing-patients indicated a worse OS compared to non-expressing patients who underwent postoperative adjuvant therapy, whereas no association was found between the expression of the Beclin 1 protein and OS. Koustas et al. revealed that patients with CRC with low expression levels of the Beclin 1 protein experienced a better OS than patients with high expression levels, whereas no association was found between the expression of the LC3 protein and OS [21]. In contrast, Wu et al. came to an opposing finding and reported that the high protein expression of Beclin 1 and LC3 was positively associated with patients' prolonged survival, assuming that they might act as tumor suppressors [20]. Due to the insufficient sample size, each study's results differed to some extent, so it is necessary to expand the CRC samples in future studies to analyze further the relationship between the expression of autophagy-related proteins, clinicopathologic features, and prognosis.
It has been reported that MSI is identified in ~15% of patients with CRC [23]. In good accordance, the present study results showed that the rate of MSI in patients with CRC was 13%. The MSI-H state was related to age ≤ 50, without lymph node metastasis, located in the right hemicolon, poor tumor differentiation, but not to gender, mucous adenocarcinoma, depth of invasion, and TNM stage. Samowitz et al. reported that MSI-H incidence was high in patients < 50 or > 70 y old, with individuals between these ages exhibiting a low incidence [3]. Besides, certain studies have suggested that MSI-H might not be age-related [24-26]. The incidence of MSI-H in patients with CRC with age ≤ 50 was higher than that in patients > 50 in this study, in accordance with the findings by Samowitz et al. It has been reported that the incidence of MSI-H in female patients was higher than that in male patients [3, 27], but this and other studies did not reach the same conclusion [26]. We agreed with the conclusions of many studies that MSI-H has a high incidence of cancer of the proximal colon in patients with CRC [25, 28-30]. A study showed that MSI-H was more common in patients with CRC without lymph node metastasis than in those with lymph node metastasis [28], quite similar to our results. Respectively, studies have shown a high incidence of MSI-H in mucinous colorectal adenocarcinoma [30], which was not confirmed in this study.
Some studies have indicated that MSI-H might still be a better factor for CRC patients' survival [31, 32]. However, several other studies came to opposite conclusions, stating that MSI-H might function as an adverse factor for OS in CRC [33]. Although the survival curve of patients with MSI-H-CRC was higher than that of patients with MSS/L, because of P > 0.05, we could not assume whether MSI-H might be a beneficial factor in CRC.
5-fluorouracil (5-Fu)-based chemotherapy drugs are currently the first-line chemotherapeutic agents for treating colorectal cancer. Nevertheless, the guidelines of NCCN state that MSI-H CRC patients do not benefit from 5-FU adjuvant therapy [34]. Sena et al. reported that the expression of LC3 in MSS cancer cells was higher than that in MSI cancer cells [35]; however, we did not identify any difference in the expression of autophagy-related proteins between MSH and MSS/L-CRC patients. Since similar reports are rare, more research is needed to corroborate this result. In addition, there have been no reports on the characteristics of autophagy expression in CRC patients with different microsatellite states. In this study, CRC patients were further divided into MSI-H and MSS/L subgroups, and the relationships between the autophagy-related proteins (Beclin 1 and LC3) and clinicopathological features and prognosis in these two subgroups were also analyzed. We found that the expression of Beclin 1 and LC3 was unrelated to all clinicopathological parameters and OS in the MSI-H-CRC subgroup. However, the sample size of patients in this subgroup is small, and future studies with a larger sample size are warranted. The expression of Beclin 1 was demonstrated to be higher in the T3/T4 group; there was no significant association observed between the expression of the LC3 protein and all clinicopathological parameters in the MSS/L-CRC subgroup. Patients with positive expression of LC3 had a worse OS than those with a negative expression in the MSS/L-CRC subgroup, suggesting that LC3 might be a poor prognostic factor in patients with MSS/L-CRC.
5-FU, combined with other agents such as oxaliplatin, has been shown to improve OS in patients with advanced CRC [36]. However, drug toxicity, resistance, and disease relapse are still the most common treatment challenges. Therefore, improved CRC therapeutic efficacy and increased tumor killing are critical to managing patients with CRC. The inhibition of autophagy could increase 5-FU-induced apoptosis in animal experiments [12, 13]. In the present research, CRC patients received either capecitabine (a 5-FU chemotherapy drug) or capecitabine combined with oxaliplatin after surgery, LC3 expression correlated with worse OS compared to patients non-expressing LC3, demonstrating that, in CRC patients, an elevated expression of LC3 protein may affect the efficacy of capecitabine-related chemotherapy. LC3 protein expression should be detected when patients opt for capecitabine-related treatment regimens. If patients have high levels of LC3 protein, other chemotherapy regimens including autophagy inhibitors are recommended to be part of their treatment strategy.
The percentage of mutations in the KRAS gene in CRC is known to be 35-45% [37]. In this study, the incidence of mutation in patients with CRC was reported to be 40%, consistent with most reports. Many studies have examined the relationships between KRAS mutations with various clinicopathologic characteristics, however, with no consistent results [38-44]. We found that the incidence of mutations in the KRAS gene was related to gender, depth of invasion, and TNM stage in CRC, but not related to age, lymph node metastasis, tumor location, tumor differentiation, or mucous adenocarcinoma. Li et al. reported that the rate of mutations in KRAS was different in primary tumor sites, genders, and tumor histology types [38]. Kadowaki et al. also found that mutations in KRAS were associated with gender but with no other variables [41]. Niu et al. reported that mutations in KRAS in patients with stage III CRC were related to the proximal colon and pathological stage but not related to sex, age, lymph node metastasis, or infiltration depth [39]. Such inconsistencies might have arisen due to differences in the distribution of race, age, stage, or other factors in the study population. At present, no convincing evidence has demonstrated that mutations in KRAS might have an independent prognostic role in CRC. Previous studies indicated that patients with CRC with mutations in KRAS had a significantly increased risk of death or recurrence compared with those with a wild type KRAS [38, 40, 41]. However, no association was identified between mutations in the KRAS gene and OS in patients with CRC in the current research and in agreement with Liou et al. [42].
Previus studies have demonstrated that mutations in KRAS can directly lead to a failure for CRC patients subjected to anti-epidermal growth factor receptor (EGFR) therapy, such as cetuximab [45, 46]. Moreover, it has been reported that the effect of cetuximab on colon cancer cells might be improved by autophagy [47]. At present, the relationship between autophagy and KRAS in colorectal cancer remains obscure. We investigated the relationships between mutations in KRAS and autophagy-related proteins in patients with CRC and did not identify a significant correlation. It has not been reported that autophagy characteristics in CRC patients carry or not (wild type) mutations in KRAS at present. We first reported that Beclin 1 was unrelated to all clinicopathological parameters in patients with CRC with wild type KRAS, whereas the expression of LC3 was related to TNM stage III/IV in the same subgroup. The expression of Beclin 1 and LC3 proteins was also first shown to be unrelated to all clinicopathological parameters in the mutated KRAS gene subgroup in the current paper. A previous study on CRCs reported that patients with Beclin 1 nuclear (not cytoplasmic) staining had a significantly decreased OS in the only 34 cases of KRAS-mutated CRC patients and did not find that in the wild type KRAS CRCs [22]. Our study included a larger number of patients; in disagreement with previous findings, we observed that the reported associations between Beclin 1 protein expression and OS were absent in both mutated and wild type KRAS subgroups. This study reported positive nuclear staining of the Beclin 1 protein; however, we mainly observed a cytoplasmic staining pattern in our study. It needs to conduct additional research focus on the cellular localizations about Beclin 1 protein. They also found that overexpression of LC3 was significantly related to worse OS in the KRAS-mutated CRC group, which was not found in the wild type KRAS CRC group [22], consistent with our findings. We gave a novel finding that CRC patients with different KRAS gene states, different autophagy markers may play different prognostic values. A larger sample size of stratified analysis should be examined to confirm these results. For CRC patients with different KRAS gene states, research schemes of targeted therapy for autophagy may be different.
As per NCCN guidelines, RAS and MSI are important molecular features in patients with colorectal cancer and should be considered while tailoring the ideal therapeutic approach for their clinical management [48]. We too believe that status of autophagy, RAS, and MSI should be analyzed in combination in patients with CRC. However, in this study, no association was observed between autophagy-related proteins and OS in MSS/L-CRC patients with wild type KRAS. This finding suggests that for these patients, the detection of autophagy-related protein may be unnecessary in clinical practice; this would also reduce patients' economic burden. Of note, LC3 protein expressing MSS/L-CRC patients with KRAS mutations have a shorter OS than LC3 non-expressing patients. Thus, patients, who have undergone chemotherapy, should also be treated with autophagy inhibitors or other treatments, such as immunotherapy or radiation therapy. Further clinical trials are warranted to investigate the efficacy of these therapeutic strategies.
Next-generation sequencing was used in this study to capture the information on the variation of 19 genes to explore their relationship with MSI. Lin et al. found that the mutation number of MSI-H CRCs was significantly higher than MSS CRCs. Compared with MSI samples, the difference in MSS intersample variation was demonstrated to be smaller whether containing synonymous mutations or not. However, due to the small sample size, the difference in the number of variations between the two groups could not be compared. We found that all the variations in the samples were mainly concentrated on the BRCA1 and BRCA2 genes, but when compared with data obtained from a thousand-genome database, these variations were shown not to be pathogenic. We first identified the BARD1 p.Lys2208fs frameshift mutation and the CASP8 p.Met1 nonsense mutation, which were only observed on MSI-H patients. The BARD1 gene has been reported to be often upregulated and associated with worse outcomes in various tumors, such as breast, ovarian, endometrial, and lung cancers [49, 50]. However, its tumorigenic mechanism has not been reported in colorectal cancer. In addition, several CASP8 gene SNPs are reportedly associated with various types of cancer [51]. However, the CASP8 p.Met1 nonsense mutation has not been previously identified in colorectal cancer. To verify whether this mutation might be incidental in colorectal cancer or not, or whether it might be associated with colon cancer or MSI, more specimens are needed.
Conclusion
In summary, the expression of autophagy-related proteins (Beclin 1 and LC3) was elevated in CRC tissues. LC3-expressing patients who underwent adjuvant therapy experienced a shorter OS after surgery, especially in the MSS/L-CRC and mutated KRAS subgroups. MSS/L-CRC patients with KRAS mutation positively expressed LC3 protein and suffered a shorter OS than LC3 non-expressing patients. LC3 is suggested as a recommendable novel prognostic marker to personalize treatment in CRC patients that do not respond to chemotherapy. LC3, MSI status, and KRAS mutations are critical factors that may affect the efficacy of adjuvant therapy during CRC chemotherapy. The detection of these indexes is of great significance to select ideal clinical treatments for patients with CRC. Nevertheless, further clinical trials are needed to investigate therapeutic strategies combined with autophagy inhibitors, immunotherapy, or radiation therapy.
Abbreviations
CRC: Colorectal cancer; MSI: Microsatellite instability; CIN: Chromosomal instability; MSI-H: High-frequency microsatellite instability; MSI-L: Low-frequency microsatellite instability; EFFR: Epidermal growth factor receptor; ATG: Autophagy-related genes; BARD1: BRCA1 associated RING domain 1; DIRAS3: DIRAS family GTPase 3; ERBB2: Erb-B2 receptor tyrosine kinase 2; NBN: Nibrin; PALB2: Partner and localizer of BRCA2; PTEN: Phosphatase and tensin homolog; TGFB1: Transforming growth factor-beta 1; TP53: Tumor protein p53.
Supplementary Material
Supplementary figures and tables.
Acknowledgements
We would like to thank Editage (www.editage.cn) for English language editing.
Ethical approval and consent to participate
The purpose of this research was explained to the participants, whom all signed a written informed consent prior to the study. This study was approved by the Institutional Ethics Committee of the Affiliated Cancer Hospital of Zhengzhou University.
Funding
This work was supported by The Medical Technology Research and Development Program of Henan Province [grant numbers 201701029, 182102310343].
Authors' contributions
Qingxin Xia conceived and designed the experiments. Caili Guo made essential revisions to the manuscript. Yuanyuan Wang performed IHC, analyzed the data, and contributed to the writing of the manuscript. Zhi Zhao analyzed the data. Xinxin Wu performed the PCR analysis, and Zhi Zhong did the sequencing. Bing Zhang, Gao Ge, and Yinping Zhang contributed to the collection of samples. Jing Zhuang collected the patient's prognosis and clinical chemotherapy information.
Competing Interests
The authors have declared that no competing interest exists.
References
1. Torre LA, Bray F, Siegel RL. et al. Global cancer statistics, 2012. CA Cancer J Clin. 2015;65:87-108
2. Hammond WA, Swaika A, Mody K. Pharmacologic resistance in colorectal cancer: a review. Ther Adv Med Oncol. 2016;8:57-84
3. Samowitz WS, Curtin K, Ma KN. et al. Microsatellite instability in sporadic colon cancer is associated with an improved prognosis at the population level. Cancer Epidemiol Biomarkers Prev. 2001;10:917-23
4. Sinicrope FA, Sargent DJ. Molecular pathways: microsatellite instability in colorectal cancer: prognostic, predictive, and therapeutic implications. Clin Cancer Res. 2012;18:1506-12
5. Boland CR, Thibodeau SN, Hamilton SR. et al. A National Cancer Institute workshop on microsatellite instability for cancer detection and familial predisposition: development of international criteria for the determination of microsatellite instability in colorectal cancer. Cancer Res. 1998;58:5248-57
6. Vaughn CP, Zobell SD, Furtado LV. et al. Frequency of KRAS, BRAF, and NRAS mutations in colorectal cancer. Genes Chromosom Cancer. 2011;50:307-12
7. Riely GJ, Ladanyi M. KRAS mutations: an old oncogene becomes a new predictive biomarker. J Mol Diagn. 2008;10:493-5
8. Riely GJ, Marks J, Pao W. KRAS mutations in non-small cell lung cancer. Proc Am Thorac Soc. 2009;6:201-5
9. Levine B, Kroemer G. Autophagy in the pathogenesis of disease. Cell. 2008;132:27-42
10. Nakatogawa H, Suzuki K, Kamada Y. et al. Dynamics and diversity in autophagy mechanisms: lessons from yeast. Nat Rev Mol Cell Biol. 2009;10:458-67
11. Benson AB 3rd, Venook AP, Cederquist L. et al. Colon Cancer, Version 1.2017, NCCN Clinical Practice Guidelines in Oncology. J Natl Compr Canc Netw. 2017;15:370-98
12. Li J, Hou N, Faried A. et al. Inhibition of autophagy by 3-MA enhances the effect of 5-FU-induced apoptosis in colon cancer cells. Ann Surg Oncol. 2009;16:761-71
13. Li J, Hou N, Faried A. et al. Inhibition of autophagy augments 5-fluorouracil chemotherapy in human colon cancer in vitro and in vivo model. Europ J Cancer. 2010;46:1900-9
14. Weihua Z, Tsan R, Huang WC. et al. Survival of cancer cells is maintained by EGFR independent of its kinase activity. Cancer Cell. 2008;13:385-93
15. Edge SB, Compton CC. The American Joint Committee on Cancer: the 7th edition of the AJCC cancer staging manual and the future of TNM. Ann Surg Oncol. 2010;17:1471-4
16. Chatterjee N, Walker GC. Mechanisms of DNA damage, repair, and mutagenesis. Environ Mol Mutagen. 2017;58:235-63
17. Boussios S, Ozturk MA, Moschetta M. et al. The developing story of predictive biomarkers in colorectal cancer. J Pers Med. 2019;9:E12
18. Jin S, White E. Role of autophagy in cancer: management of metabolic stress. Autophagy. 2007;3:28-31
19. Kihara A, Noda T, Ishihara N. et al. Two distinct Vps34 phosphatidylinositol 3-kinase complexes function in autophagy and carboxypeptidase Y sorting in Saccharomyces cerevisiae. J Cell Biol. 2001;152:519-30
20. Wu S, Sun C, Tian D. et al. Expression and clinical significances of Beclin1, LC3 and mTOR in colorectal cancer. Int J Clin Exp Pathol. 2015;8:3882-91
21. Koustas E, Sarantis P, Theoharis S. et al. Autophagy-related proteins as a prognostic factor of patients with colorectal cancer. Am J Clin Oncol. 2019;42:767-76
22. Schmitz KJ, Ademi C, Bertram S. et al. Prognostic relevance of autophagy-related markers LC3, p62/sequestosome 1, Beclin-1 and ULK1 in colorectal cancer patients with respect to KRAS mutational status. World J Surg Oncol. 2016;14:189
23. Zhang X, Li J. Era of universal testing of microsatellite instability in colorectal cancer. World J Gastrointest Oncol. 2013;5:12-9
24. Ribic CM, Sargent DJ, Moore MJ. et al. Tumor microsatellite-instability status as a predictor of benefit from fluorouracil-based adjuvant chemotherapy for colon cancer. N Engl J Med. 2003;349:247-57
25. Jeong SY, Shin KH, Shin JH. et al. Microsatellite instability and mutations in DNA mismatch repair genes in sporadic colorectal cancers. Dis Colon Rectum. 2003;46:1069-77
26. Wang Y, Zhang B, Gao G. et al. GEFT protein expression in digestive tract malignant tumors and its clinical significance. Oncol Lett. 2019;18:5577-90
27. Ward R, Meagher A, Tomlinson I. et al. Microsatellite instability and the clinicopathological features of sporadic colorectal cancer. Gut. 2001;48:821-9
28. Gryfe R, Kim H, Hsieh ET. et al. Tumor microsatellite instability and clinical outcome in young patients with colorectal cancer. N Engl J Med. 2000;342:69-77
29. Thibodeau SN, Bren G, Schaid D. Microsatellite instability in cancer of the proximal colon. Science. 1993;260:816-9
30. Bertagnolli MM, Redston M, Compton CC. et al. Microsatellite instability and loss of heterozygosity at chromosomal location 18q: prospective evaluation of biomarkers for stages II and III colon cancer-a study of CALGB 9581 and 89803. J Clin Oncol. 2011;29:3153-62
31. Klingbiel D, Saridaki Z, Roth AD. et al. Prognosis of stage II and III colon cancer treated with adjuvant 5-fluorouracil or FOLFIRI in relation to microsatellite status: results of the PETACC-3 trial. Ann Oncol. 2015;26:126-32
32. Guidoboni M, Gafa R, Viel A. et al. Microsatellite instability and high content of activated cytotoxic lymphocytes identify colon cancer patients with a favorable prognosis. Am J Pathol. 2001;159:297-304
33. Venderbosch S, Nagtegaal ID, Maughan TS. et al. Mismatch repair status and BRAF mutation status in metastatic colorectal cancer patients: a pooled analysis of the CAIRO, CAIRO2, COIN, and FOCUS studies. Clin Cancer Res. 2014;20:5322-30
34. Benson AB, Venook AP, Al-Hawary MM, et al. Rectal Cancer, Version 2.2018, NCCN Clinical Practice Guidelines in Oncology, JNCCN. 2018; 16: 874-901
35. Sena P, Mariani F, Mancini S. et al. Autophagy is upregulated during colorectal carcinogenesis, and in DNA microsatellite stable carcinomas. Oncol Rep. 2015;34:3222-30
36. Gustavsson B, Carlsson G, Machover D. et al. A review of the evolution of systemic chemotherapy in the management of colorectal cancer. Clin Colorectal Cancer. 2015;14:1-10
37. Peeters M, Price TJ, Cervantes A. et al. Randomized phase III study of panitumumab with fluorouracil, leucovorin, and irinotecan (FOLFIRI) compared with FOLFIRI alone as second-line treatment in patients with metastatic colorectal cancer. J Clin Oncol. 2010;28:4706-13
38. Li W, Liu Y, Cai S. et al. Not all mutations of KRAS predict poor prognosis in patients with colorectal cancer. Int J Clin Exp Pathol. 2019;12:957-67
39. Niu W, Wang G, Feng J. et al. Correlation between microsatellite instability and RAS gene mutation and stage III colorectal cancer. Oncol Lett. 2019;17:332-8
40. Conlin A, Smith G, Carey FA. et al. The prognostic significance of K-ras, p53, and APC mutations in colorectal carcinoma. Gut. 2005;54:1283-6
41. Kadowaki S, Kakuta M, Takahashi S. et al. Prognostic value of KRAS and BRAF mutations in curatively resected colorectal cancer. World J Gastroenterol. 2015;21:1275-83
42. Liou JM, Wu MS, Shun CT. et al. Mutations in BRAF correlate with poor survival of colorectal cancers in Chinese population. Int J Colorectal Dis. 2011;26:1387-95
43. Watanabe T, Yoshino T, Uetake H. et al. KRAS mutational status in Japanese patients with colorectal cancer: results from a nationwide, multicenter, cross-sectional study. Jpn J Clin Oncol. 2013;43:706-12
44. Roth AD, Tejpar S, Delorenzi M. et al. Prognostic role of KRAS and BRAF in stage II and III resected colon cancer: results of the translational study on the PETACC-3, EORTC 40993, SAKK 60-00 trial. J Clin Oncol. 2010;28:466-74
45. Amado RG, Wolf M, Peeters M. et al. Wild-type KRAS is required for panitumumab efficacy in patients with metastatic colorectal cancer. J Clin Oncol. 2008;26:1626-34
46. Lievre A, Bachet JB, Le Corre D. et al. KRAS mutation status is predictive of response to cetuximab therapy in colorectal cancer. Cancer Res. 2006;66:3992-5
47. Guo GF, Wang YX, Zhang YJ. et al. Predictive and prognostic implications of 4E-BP1, Beclin-1, and LC3 for cetuximab treatment combined with chemotherapy in advanced colorectal cancer with wild-type KRAS: Analysis from real-world data. World J Gastroenterol. 2019;25:1840-53
48. Provenzale D, Ness RM, Llor X. et al. NCCN Guidelines Insights: Colorectal Cancer Screening, Version 2.2020. J Natl Compr Canc Netw. 2020;18(10):1312-20
49. Wu JY, Vlastos AT, Pelte MF. et al. Aberrant expression of BARD1 in breast and ovarian cancers with poor prognosis. Int J Cancer. 2006;118:1215-26
50. Zhang YQ, Bianco A, Malkinson AM. et al. BARD1: an independent predictor of survival in non-small cell lung cancer. Int J Cancer. 2012;131:83-94
51. Zhang Y, Li W, Hong Y. et al. A systematic analysis of the association studies between CASP8 D302H polymorphisms and breast cancer risk. J Genet. 2017;96:283-9
Author contact
![]() Corresponding author: Qingxin Xia (Principal corresponding author), Department of Pathology, Affiliated Cancer Hospital of Zhengzhou University, Henan Cancer Hospital, 127 Dongming Road, Zhengzhou, Henan 450008, P.R. China; Tel: +86-13849060526; Fax: +86-0371 65587086; E-mail: tudou414135404com; Caili Guo, Department of Critical Care Medicine, Affiliated Children's Hospital of Zhengzhou University, No. 255 Gangdu Road, Dongsan Street, Zhengzhou 450008, China; Tel: 86-15093269666; Fax: +86-0371 65587086; E-mail: guocaili8888com.
Corresponding author: Qingxin Xia (Principal corresponding author), Department of Pathology, Affiliated Cancer Hospital of Zhengzhou University, Henan Cancer Hospital, 127 Dongming Road, Zhengzhou, Henan 450008, P.R. China; Tel: +86-13849060526; Fax: +86-0371 65587086; E-mail: tudou414135404com; Caili Guo, Department of Critical Care Medicine, Affiliated Children's Hospital of Zhengzhou University, No. 255 Gangdu Road, Dongsan Street, Zhengzhou 450008, China; Tel: 86-15093269666; Fax: +86-0371 65587086; E-mail: guocaili8888com.