Impact Factor ISSN: 1837-9664

 Global reach, higher impact
J Cancer 2021; 12(11):3344-3353. doi:10.7150/jca.49658 This issue Cite
Research Paper
The prediction of survival in Gastric Cancer based on a Robust 13-Gene Signature
Guoguang Wang1#, Tian Zhan1#, Fan Li1#, Jian Shen1, Xiang Gao1, Lei Xu1, Yuan Li2 ![]() , Jianping Zhang1
, Jianping Zhang1 ![]()
1. Department of General Surgery, The Second Affiliated Hospital of Nanjing Medical University, Nanjing, China.
2. Jiangsu Key Lab of Cancer Biomarkers, Prevention and Treatment, Jiangsu Collaborative Innovation Center For Cancer Personalized Medicine, School of Public Health, Nanjing Medical University, Nanjing, China.
#These authors contributed equally to this work.
Received 2020-6-18; Accepted 2021-3-27; Published 2021-4-12
Abstract

Gastric cancer represents a major public health problem. Owing to the great heterogeneity of GC, conventional clinical characteristics are limited in the accurate prediction of individual outcomes and survival. This study aimed to establish a robust gene signature to predict the prognosis of GC based on multiple datasets. Initially, we downloaded raw data from four independent datasets of The Cancer Genome Atlas (TCGA) and Gene Expression Omnibus (GEO), and performed univariate Cox proportional hazards regression analysis to identify prognostic genes associated with overall survival (OS) from each dataset. Thirteen common genes from four datasets were screened as candidate prognostic signatures. Then, a risk score model was developed based on this 13‑gene signature and validated by four independent datasets and the entire cohort. Patients with a high-risk score had poorer OS and recurrence-free survival (RFS). Multivariate regression and stratified analysis revealed that the 13-gene signature was not only an independent predictive factor but also associated with recurrence when adjusting for other clinical factors. Furthermore, in the high-risk group, gene set enrichment analysis (GSEA) showed that the mTOR signaling pathway and MAPK signaling pathway were significantly enriched. The present study provided a robust and reliable gene signature for prognostic prediction of both OS and RFS of patients with GC, which may be useful for delivering individualized management of patients.
Keywords: drug resistance, gastric cancer, Kyoto Encyclopedia of Genes and Genomes pathway, recurrence, prognostic signature
Introduction
GC remains a major challenge for public health worldwide [1]. Accurate prediction of prognosis can confirm patients who would benefit from more radical treatment, such as chemotherapy, neoadjuvant therapy and targeted molecular therapy. Currently, the tumor-node-metastasis (TNM) classification system is still the most common method to select therapeutic strategies and evaluate the prognosis of patients with GC [2]. Nevertheless, various outcomes have been identified in patients with GC with similar clinical factors, which suggests that the predictive efficacy of conventional models may be insufficient [3-5]. Hence, it is crucial to develop robust and reliable prognostic signatures to improve individualized survival predictions in GC.
Modern biomedical research, such as microarray and next-generation sequencing analyses, has explored many GC prognostic genes that are crucial for risk stratification and personalized treatment decisions [6, 7]. However, the vast majority of studies have concentrated mainly on a single gene, and its predictive ability is insufficient compared with multiple biomarker-based models [8, 9]. In clinical practice, accurately predicting OS for patients with GC may facilitate individual clinical decision-making. In this study, we established a robust 13-gene prognostic signature for gastric cancer by integrating multiple datasets, which might complement classical clinical prognostic characteristics, and further aid clinicians in personalized treatment planning.
Materials and methods
Acquisition of gene expression clinical data
Three independent datasets and corresponding clinical information were downloaded from GEO (GEO; https://www.ncbi.nlm.nih.gov/geo/), under the accession numbers GSE15459, GSE62254 and GSE57303, and one dataset in TCGA was employed from University of California Santa Cruz Xenabrowser (UCSC Xena) (http://genome.ucsc.edu/). The mRNA expression profiles of the GSE15459, GSE62254 and GSE57303 datasets were all detected by using the GPL570 platform (Affymetrix Human Genome U133 Plus 2.0 Array). After the samples with overall survival (OS) ≤ 30 days were excluded, 884 patients were enrolled, including 182 samples from GSE15459, 299 from GSE62254, 70 from GSE57303, and 333 from TCGA (Table S1). In terms of cancer recurrence, patients from TCGA were excluded if (i) the records of primary therapy outcome and radiation therapy were not clearly presented (n = 26); (ii) patients underwent radiation therapy (n = 45); or (iii) patients with stage I gastric cancer who recurred within one year did not achieve complete resection after primary therapy (n = 2), resulting in the enrolling of a total of 191 patients (Table S2). Raw datasets from the GEO database were normalized respectively via Robust Multichip Average (RMA) in the affy package of R, while the TCGA data were normalized as transcripts per million (TPM).
Development and validation of the gene signature
In the present study, a univariate Cox proportional hazard regression model was used to assess the relationships between overall survival and the level of expression in each cohort. Statistical significance was assumed at p < 0.05, and the shared genes between four datasets were selected to formulate a signature model for prediction of prognosis. Risky genes (hazard ratio (HR) > 1) and protective genes (HR < 1) were defined by the HR from the univariate Cox regression analysis. Next, we used a risk score model to develop prognostic signatures, and validated it via four datasets and the entire cohort. A detailed flow‑chart of this study is depicted in Figure 1.
Study flow diagram.
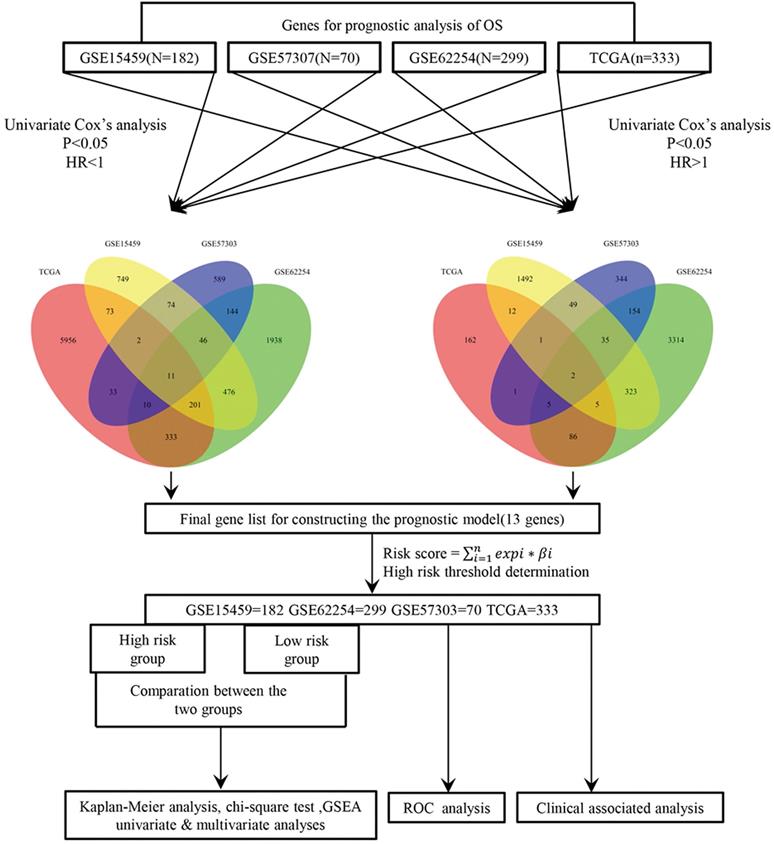
Based on the expression of the gene signature and corresponding weighted coefficient, we calculated a risk score for each patient as follows:

In the above equation, n was the number of prognostic genes, expi was the expression value of gene i, and βi was the regression coefficient of gene i. According to the median risk score obtained, patients with GC in each cohort were segmented into high-risk and low-risk group. Subsequently, we investigated the relationship between the prognosis signature and RFS based on TCGA.
Gene set enrichment analysis (GSEA)
GSEA was implemented to explore the Kyoto Encyclopedia of Genes and Genomes (KEGG) pathways that were significantly enriched in high-risk tumor samples by GSEA v4.0.3 (http://www.broadinstitute.org/gsea/index.jsp). The gene sets of canonical pathways (c2.all.v7.0.symbols.gmt) were used 1,000 times for each analysis to obtain the normalized enrichment score (NES). P<0.05 and NES >1 were considered statistically significant.
Statistical analysis
The data were analysed using R software (version 3.4.3). Comparisons between the two groups were inspected by the Kaplan‑Meier curve and compared by the log‑rank test. The chi-square test was implemented to evaluate the relativity between the risk score and recurrence. To investigate whether the prognostic gene signature could be independent of other clinical and pathological characteristics, we carried out univariate and multivariate Cox proportional hazard regression models. Factors with P value < 0.05 in the univariate analyses were included in the multivariate analyses [10]. Unless otherwise stipulated, P < 0.05 was set as the cut‑off value. Receiver operating characteristic (ROC) curve analysis was performed to examine the predictive accuracy of the risk score for time-dependent disease outcomes within three years. Afterwards, the area under the curve (AUC) values were calculated according to the ROC curves.
Results
Prognostic signature generation
Survival-associated genes were identified via univariate Cox regression analysis in each dataset. Under the cut-off threshold of HR < 1 and P < 0.05, 1919 genes in GSE15459, 3924 genes in GSE62254, 591 genes in GSE57303, and 274 genes in TCGA were selected as candidate protective genes. According to the screening criteria (HR > 1 and P < 0.05), 1632 genes in GSE15459, 3159 genes in GSE62254, 909 genes in GSE57303, and 6619 genes in TCGA were selected as risky candidate genes. Finally, a total of 13 common genes (ADAT3, TMEM171, DCBLD2, MARCKS, CLIP4, CTNNAL1, PIP4K2A, ZBTB10, NRP1, CST6, PLTP, CD109, and JAZF1) were finally identified and nominated as the “13-gene signature” by overlapping these candidate genes, including 2 protective genes and 11 risky genes (Table S3). The general information of these 13 genes and the prognostic correlation of the 13 in each dataset are displayed in Tables 1 & 2.
General information of the 13 genes for constructing the prognostic signature
| Gene stable ID | Gene name | Gene type | Chromosome | Gene start (bp) | Gene end (bp) |
|---|---|---|---|---|---|
| ENSG00000213638 | ADAT3 | Protein coding | 19 | 1905399 | 1913447 |
| ENSG00000157111 | TMEM171 | Protein coding | 5 | 73120569 | 73131809 |
| ENSG00000057019 | DCBLD2 | Protein coding | 3 | 98795941 | 98901695 |
| ENSG00000277443 | MARCKS | Protein coding | 6 | 113857345 | 113863475 |
| ENSG00000115295 | CLIP4 | Protein coding | 2 | 29097705 | 29189643 |
| ENSG00000119326 | CTNNAL1 | Protein coding | 9 | 108942569 | 109013522 |
| ENSG00000150867 | PIP4K2A | Protein coding | 10 | 22534854 | 22714578 |
| ENSG00000205189 | ZBTB10 | Protein coding | 8 | 80485619 | 80526265 |
| ENSG00000099250 | NRP1 | Protein coding | 10 | 33177492 | 33336262 |
| ENSG00000175315 | CST6 | Protein coding | 11 | 66012008 | 66013505 |
| ENSG00000100979 | PLTP | Protein coding | 20 | 45898621 | 45912155 |
| ENSG00000156535 | CD109 | Protein coding | 6 | 73695785 | 73828316 |
| ENSG00000153814 | JAZF1 | Protein coding | 7 | 27830573 | 28180795 |
Univariate regression analysis of the 13 genes and overall survival of GC patients in 4 datasets
| Genes | GSE15459 | GSE62254 | GSE57303 | TCGA | ||||
|---|---|---|---|---|---|---|---|---|
| HR (95% CI) | P | HR (95% CI) | P | HR (95% CI) | P | HR (95% CI) | P | |
| ADAT3 | 0.46 (0.24-0.86) | 1.52E-02 | 0.17 (0.07-0.40) | 4.09E-05 | 0.04 (0.00-0.39) | 5.49E-03 | 0.95 (0.92-0.98) | 1.77E-03 |
| CD109 | 1.39 (1.11-1.75) | 4.73E-03 | 0.64 (0.52-0.80) | 5.85E-05 | 1.59 (1.01-2.50) | 4.68E-02 | 1.01 (1.01-1.02) | 3.28E-05 |
| CLIP4 | 1.34 (1.06-1.69) | 1.49E-02 | 1.37 (1.06-1.77) | 1.78E-02 | 2.00 (1.19-3.35) | 8.93E-03 | 1.04 (1.01-1.07) | 7.57E-03 |
| CST6 | 1.19 (1.05-1.34) | 4.96E-03 | 1.75 (1.18-2.60) | 5.72E-03 | 1.34 (1.02-1.76) | 3.76E-02 | 1.00 (1.00-1.00) | 3.78E-04 |
| CTNNAL1 | 1.35 (1.03-1.77) | 2.90E-02 | 1.79 (1.36-2.37) | 4.09E-05 | 2.06 (1.11-3.83) | 2.22E-02 | 1.02 (1.01-1.03) | 1.89E-03 |
| DCBLD2 | 1.94 (1.31-2.87) | 9.55E-04 | 1.67 (1.36-2.06) | 1.20E-06 | 2.62 (1.45-4.74) | 1.41E-03 | 1.02 (1.00-1.03) | 3.85E-02 |
| JAZF1 | 1.34 (1.04-1.73) | 2.26E-02 | 1.57 (1.28-1.93) | 1.46E-05 | 1.57 (1.00-2.46) | 4.93E-02 | 1.03 (1.00-1.05) | 1.69E-02 |
| MARCKS | 2.25 (1.44-3.53) | 3.92E-04 | 1.22 (1.02-1.45) | 2.65E-02 | 2.44 (1.26-4.71) | 7.85E-03 | 1.01 (1.00-1.01) | 3.20E-05 |
| NRP1 | 2.38 (1.53-3.70) | 1.15E-04 | 1.81 (1.24-2.63) | 2.06E-03 | 2.21 (1.08-4.54) | 3.00E-02 | 1.02 (1.01-1.03) | 9.26E-05 |
| PIP4K2A | 1.54 (1.03-2.30) | 3.43E-02 | 1.73 (1.35-2.20) | 1.03E-05 | 3.00 (1.14-7.88) | 2.55E-02 | 1.02 (1.00-1.03) | 9.27E-03 |
| PLTP | 1.21 (1.00-1.45) | 4.64E-02 | 1.35 (1.12-1.62) | 1.32E-03 | 1.39 (1.01-1.91) | 4.21E-02 | 1.00 (1.00-1.00) | 3.34E-02 |
| TMEM171 | 0.72 (0.53-0.98) | 3.73E-02 | 1.25 (1.03-1.53) | 2.56E-02 | 0.50 (0.27-0.91) | 2.28E-02 | 0.99 (0.98-1.00) | 4.90E-02 |
| ZBTB10 | 1.61 (1.18-2.18) | 2.58E-03 | 1.42 (1.00-2.00) | 4.76E-02 | 1.81 (1.06-3.08) | 2.99E-02 | 1.03 (1.00-1.05) | 3.43E-02 |
HR, hazard ratio; CI, confidence interval.
Thirteen-gene prognostic signature validation
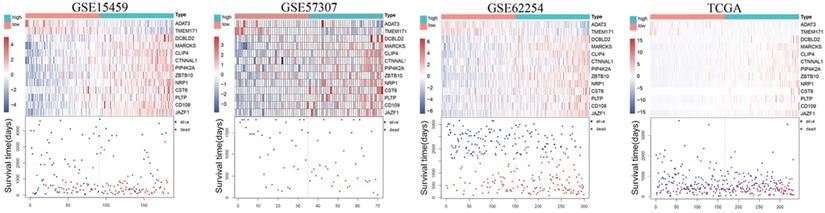
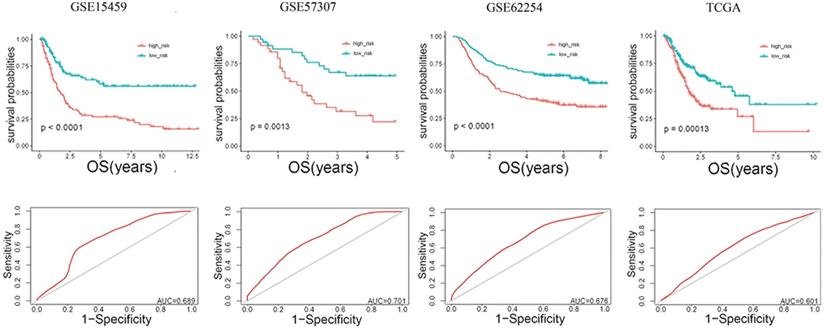
The risk score (RS) for each patient was achieved based on the expression levels of the 13-gene signature and corresponding weighted coefficients. The samples in each data set were sorted by risk score, and the median risk score was set as the cut-off point to stratify the subjects into high‑ and low‑risk groups. In Figure 2, the survival status, and gene expression of patients in each dataset were profiled, which showed that the survival events decreased as RS increased. Furthermore, the survival curves demonstrated that the prognosis of patients with a high-risk score suffered a poorer prognosis than those with a low-risk score (GSE15459: P < 0.0001, GSE57303: P = 0.0013, GSE62254: P < 0.0001, TCGA: P = 0.00012) (Figure 3). The area under the ROC curve of the 13-gene signature was 0.689, 0.701, 0.676, and 0.601 in GSE57303, GSE62254, GSE15459, and TCGA respectively, revealing that the 13-gene prognostic model had a certain accuracy in predicting outcome in GC (Figure 3). The above data confirmed that RS derived from a 13-gene signature could appropriately predict the prognosis of patients with GC.
Risk-score analysis of GC patients in the four datasets. In each dataset, the gene expression profiles, and patients' survival status are displayed. The black-dotted line represents the median cut-off, dividing patients into high- and low-risk groups.
Kaplan-Meier and ROC curves for the 13-gene signature in the four datasets. Patients with high risk scores had poor outcome in terms of overall survival.
The 13-gene signature is an independent prognostic factor
To investigate the prognostic prediction value of the 13-gene prognostic signature and identify the independent factors in gastric cancer, univariate and multivariate Cox regression analyses were performed. Covariates are composed of RS and other clinicopathological characteristics, such as gender, age, stage, Lauren classification and recurrence. Multivariate regression analysis revealed that the 13-gene signature was significantly correlated with OS even after adjustment for other covariates in the four datasets (GSE15459: P = 9.84E-05, GSE57303: P = 2.07E-03, GSE62254: P = 4.27E-03, and TCGA: P = 4.89E-03) (Table 3) or the entire cohort (P = 2.59E-12) (Table 4).
Univariate and multivariate Cox regression analyses of the gene signature and overall survival of GC patients in 4 independent datasets
| Variables | Patients (N) | Univariate analysis | Multivariate analysis | ||
|---|---|---|---|---|---|
| HR (95% CI) | P | HR (95% CI) | P | ||
| GSE57303 | |||||
| Age (≤65/>65) | 45/23 | 0.6 (0.3-1.4) | 2.50E-01 | ||
| Gender (Male/Female) | 52/18 | 0.6 (0.2-1.3) | 1.60E-01 | ||
| Lauren subtype (Diffuse/Intestinal) | 35/20 | 1.1 (0.5-2.3) | 8.70E-01 | ||
| Stage (I+II/III+IV) | 13/57 | 1.5 (0.6-4.0) | 3.70E-01 | ||
| Risk score (Low/High) | 35/35 | 3.0 (1.5-6.1) | 2.10E-03 | 3.0 (1.5-6.1) | 2.07E-03 |
| GSE15495 | |||||
| Age (≤65/>65) | 81/101 | 1.0 (0.6-1.4) | 7.80E-01 | ||
| Gender (Male/Female) | 116/66 | 0.7 (0.5-1.1) | 1.30E-01 | ||
| Lauren subtype (Diffuse/Intestinal) | 73/91 | 0.9 (0.6-1.3) | 5.40E-01 | ||
| Stage (I+II/III+IV) | 59/123 | 6.5 (3.6-12) | 6.40E-10 | 6.2 (3.4-11.2) | 2.69E-09 |
| Risk score (Low/High) | 91/91 | 2.7 (1.7-4.1) | 9.20E-06 | 2.4 (1.5-3.7) | 9.84E-05 |
| GSE62254 | |||||
| Age (≤65/>65) | 171/128 | 1.3 (1.0-1.8) | 7.90E-02 | ||
| Gender (Male/Female) | 198/101 | 1.1 (0.8-1.6) | 5.20E-01 | ||
| Lauren subtype (Diffuse/Intestinal) | 124/140 | 0.6 (0.4-0.8) | 3.40E-03 | 0.9 (0.6-1.2) | 4.12E-01 |
| Stage (I+II/III+IV) | 125/172 | 3.5 (2.4-5.1) | 8.20E-11 | 3.5 (2.3-5.4) | 1.36E-08 |
| Risk score (Low/High) | 150/149 | 2.1 (1.5-2.9) | 1.40E-05 | 1.7 (1.2-2.5) | 4.27E-03 |
| TCGA | |||||
| Age (≤65/>65) | 152/178 | 1.6 (1.1-2.2) | 1.10E-02 | 1.7 (1.1-2.7) | 2.55E-02 |
| Gender (Male/Female) | 216/117 | 0.8 (0.5-1.1) | 1.20E-01 | ||
| Stage (I+II/III+IV) | 151/168 | 1.8 (1.2-2.5) | 1.80E-03 | 1.3 (0.8-2.0) | 2.85E-01 |
| Lauren subtype (Diffuse/Intestinal) | 58/70 | 1.3 (0.8-2.2) | 3.30E-01 | ||
| Recurrence (No/Yes) | 209/57 | 3.7 (2.4-5.7) | 2.40E-09 | 3.6 (2.3-5.7) | 3.04E-08 |
| Risk score (Low/High) | 167/166 | 1.9 (1.4-2.7) | 1.70E-04 | 2.0 (1.2-3.3) | 4.89E-03 |
HR, hazard ratio.
Univariate and multivariate Cox regression analyses of the gene signature and overall survival of GC patients in entire cohort
| Variables | Patients (N) | Univariate analysis | Multivariate analysis | ||
|---|---|---|---|---|---|
| HR (95% CI) | P | HR (95% CI) | P | ||
| Age (≤65/>65) | 449/430 | 1.3 (1.0-1.5) | 1.40E-02 | 1.6 (1.3-1.9) | 9.10E-06 |
| Gender (Male/Female) | 582/302 | 0.9 (0.7-1.0) | 1.30E-01 | ||
| Lauren subtype (Diffuse/Intestinal) | 300/326 | 0.8 (0.6-1.0) | 5.50E-02 | ||
| Stage (I+II/III+IV) | 348/520 | 2.9 (2.3-3.7) | 2.60E-20 | 2.9 (2.3-3.6) | 2.00E-16 |
| Risk score (Low/High) | 443/441 | 2.2 (1.8-2.7) | 2.30E-14 | 2.1 (1.7-2.6) | 2.59E-12 |
HR, hazard ratio; CI, confidence interval.
The prognostic signature is associated with cancer recurrence
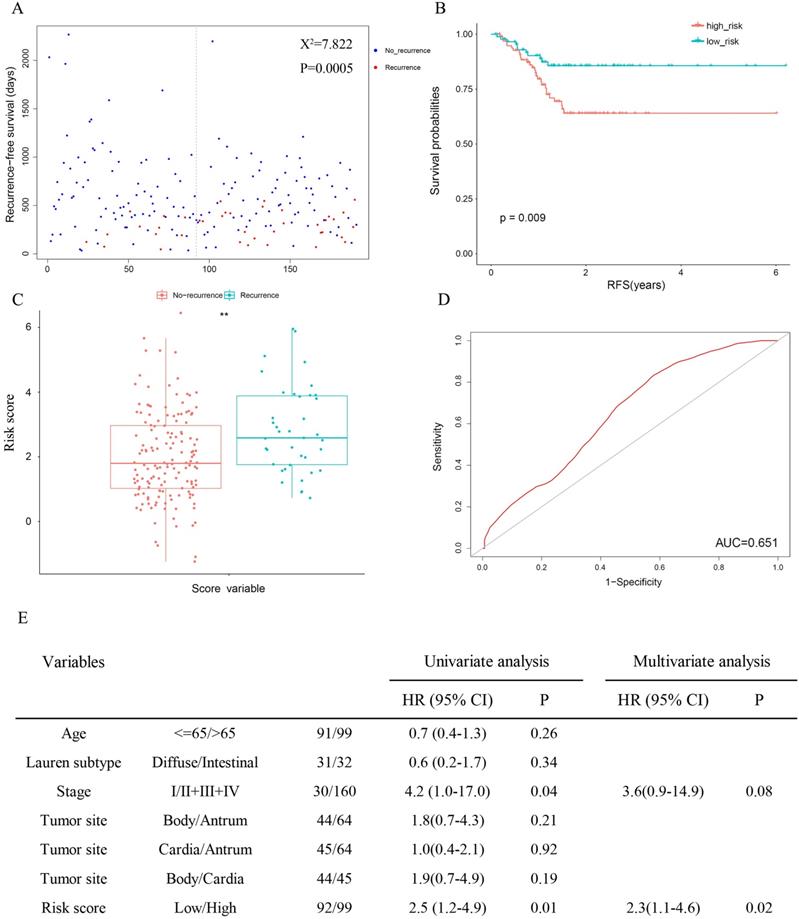
Since cancer recurrence and RS are both independent factors of patient survival in TCGA (Table 3), the relativity between recurrence and the risk score was tested. The results revealed significantly favourable RFS in the low-risk group (Figure 4A: χ2 = 7.822, P = 0.0005; Figure 4B: P = 0.009), and patients with recurrence were more likely to have a higher risk score (Figure 4C). Meanwhile, the AUC for 3-year recurrence-free survival predictions was 0.651(Figure 4D). Then we performed univariate and multivariate Cox proportional hazards models. In univariate analyses, high stage (HR = 4.2, 95% CI = 1.0-17.0, P = 0.04) and risk score (HR = 2.5, 95% CI = 1.2-4.9, P = 0.01) were associated with shorter (RFS). Multivariate analysis indicated that risk score was the only independent prognostic factor in terms of RFS (HR = 2.3, 95% CI = 1.1-4.6, P = 0.02).
The 13-gene signature is associated with cancer recurrence.
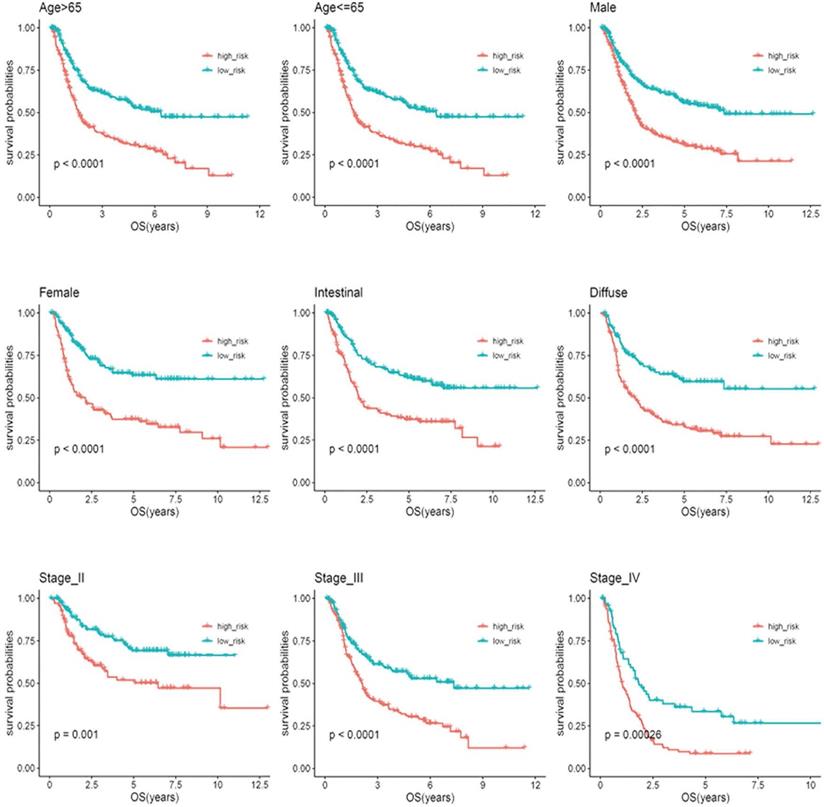
Stratification analysis
Based on clinical parameters, such as age (65/>65), gender (female/male), stage (II/III/IV) and Lauren subtype (diffuse/intestinal), the patients in the entire cohort were factitiously stratified. Patients in stage I were excluded from the stratification analysis due to the small sample size. In Figure 5, the survival curves in different subgroups displayed that patients with high-risk scores in each stratum had significantly shorter OS (P < 0.05).
Kaplan-Meier analysis of overall survival for patients stratified by age, gender, Lauren'subtype, and stage.
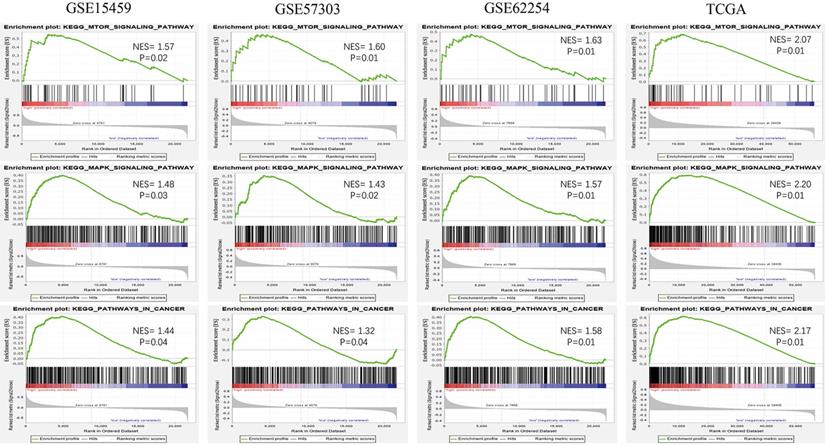
Identification of KEGG pathways
To explore the potential function of the 13-gene signature, we conducted GSEA among high-risk and low-risk patients in the four datasets. Oncological pathways, such as the mTOR signaling pathway (GSE15459: NES = 1.57, GSE57303: NES = 1.60, GSE62254: NES = 1.63, TCGA: NES = 2.07), MAPK signaling pathway (GSE15459: NES = 1.48, GSE57303: NES = 1.43, GSE62254: NES = 1.57, and TCGA: NES = 2.20, and Pathway in cancer (GSE15459: NES = 1.44, GSE57303: NES = 1.32, GSE62254: NES = 1.58, TCGA: NES = 2.17), were highly concentrated in the high-risk group (Figure 6). GSEA suggested that molecular alterations in the high-risk group were closely related to the malignant characteristics of gastric cancer.
Oncological KEGG pathways enriched in the high-risk group from 4 independent datasets.
Discussion
Previous studies have developed a number of molecular signatures that divide patients into various prognostic groups and are involved in tumor progression [11-17]. Wang et al. built a prognostic seven‐gene signature using integrated multi‐step analysis [11]. Chen et al. found novel proposed clinical-immune signature based on TCGA [12]. However, these assumed prognostic signatures were mostly derived from one or two training sets. In the present study, we establish 13-gene prognostic signatures by taking the intersection of the survival-related genes from four independent datasets for the first time in gastric cancer and partially handling the problems of clinical heterogeneity and insufficient sample size, which were eventually validated.
Our study suggested that the 13-gene signature was an independent prognostic factor (Tables 3 & 4). In addition, age, stage and recurrence were significantly associated with OS of patients in TCGA; stage was correlated with OS of patients in GSE15459; and stage and Lauren subtype were prominently related to OS of patients in GSE62254. Age and stage were identified as independent prognostic factors for OS in the entire patient cohort. Interestingly, Marqués-Lespier et al. indicated that diffuse-type gastric cancer is more aggressive and has a worse prognosis than intestinal-type gastric cancer [18]. In our study, multivariate Cox regression analysis revealed that, except for patients in GSE62254, no significant correlation was found between the Lauren type and either OS or RFS in GC (Table 4, Figure 4E).
Among the identified 13 genes (ADAT3, TMEM171, DCBLD2, MARCKS, CLIP4, CTNNAL1, PIP4K2A, ZBTB10, NRP1, CST6, PLTP, CD109, and JAZF1) in our study, overexpression of MARCKS, CLIP4, NRP1, PLTP, CD109 has been previously associated with poor prognosis of GC [19-23]. MARCKS aggravates gastric cancer tumorigenesis and progression via EMT pathway [19]. It has been found that high expression of CLIP4 and CD109 was associated with poor GC overall survival according to assay and RNA-Seq data of patients with GC [20, 21]. Loss of PLTP expression has been reported to inhibite the proliferation in both AGS and SGC‐7901 cell lines [23]. NRP1 plays an essential role in the proliferation, migration, and invasion of gastric cancer cells [24]. Our findings are consistent with these studies. In addition, ZBTB10 was regarded to regulate specificity proteins (Sp) by reactive oxygen species (ROS)- microRNA27a [25]. Chen et al. proposed that JAZF1 suppresses proliferation and induces apoptosis via TAK1/NF-κB pathways [26]. DCBLD2 over-expression has been implicated in causing tumorigenesis, invasion and metastasis in colorectal cancer expression [27]. CTNNAL1 can contribute to drug-resistance of melanoma through the way of activating NF-κB and AP-1 [28]. Shin et al. believed that PIP4K2A played a negative regulatory role on PI3K in PTEN-deficient glioblastoma [29]. Emerging evidence has shown that High CST6 expression predicts poor prognosis in Triple-Negative Breast Cancer [30]. For ADAT3 and TMEM171, there is little published data on TMEM171 and ADAT3 function in cancer. Except for MARCKS, CLIP4, NRP1, PLTP, CD109, other mRNAs are newly reported to be associated with GC survival.
The TNM staging system, currently used as the most important and basic tool for GC patient stratification, is deficient in accurately predicting individual survival [3-5]. This happens because nearly one-third of patients experienced recurrence after surgery, whereas the current staging system cannot accurately reflect it [31], which is also displayed in our study (Figure 4E). This is directly linked to chemotherapy strategy after gastrectomy. GSEA disclosed that several oncological pathways, including the mTOR signaling pathway and MAPK signaling pathway, were significantly concentrated in the high-risk group. Among them, the activated mTOR signaling pathway is critical for cell transformation, growth, metastasis and predicts poor prognosis in gastric cancer [32, 33]. The consequences of increased mTOR pathway signaling can also lead to drug resistance, which continues to be the principal limiting factor to achieving cures in patients with cancer [34, 35]. In trastuzumab-resistant HER2 positive gastric cancer cells, mTOR pathway is among multiple signaling pathways that mediate trastuzumab resistance [36]. Notably, suppressing the mTOR pathway can significantly inhibit tumor progression and improve the efficacy of trastuzumab in GC [36, 37]. The MAPK signaling pathway is reported to be frequently activated in the process of tumor development, such as proliferation, migration, and invasion [38, 39]. The expression of MAPKs is elevated in almost all high-grade GC and is correlated with tumorigenesis and metastatic potential [40]. Similarly, lots of studies have demonstrated that the MAPK signaling pathway has an effect on chemotherapy resistance in gastric cancer. Guo et al. found that the p38-MAPK pathway was activated in vincristine-resistant gastric cancer SGC7901/VCR cells and confirmed its regulatory effect on multidrug resistance [41]. In addition, emerging evidence suggests that SB203580, a selective inhibitor of p38 MAPK, increases sensitivity to doxorubicin in two gastric cancer cell lines (SGC7901 and BGC823) by inducing apoptosis in vitro and in vivo [42]. In general, these oncological pathways may provide further understanding of the risk score model in GC, and repression of these pathways might be a useful therapeutic strategy for high-risk patients.
Some flaws in our study should be taken into consideration. First, this is a retrospective study and validation of the signature for each patient in a large-scale prospective clinical trial is necessary. Second, the molecular mechanism of these genes remains unclear, and further functional experiments are needed to in the future.
Conclusions
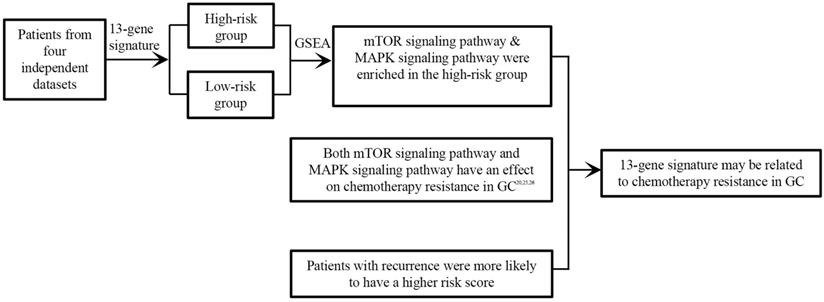
Collectively, we identified a novel 13-gene signature as a potential prognostic biomarker based on four independent datasets for the first time in GC, that was independent of other clinical factors. Besides, most of the 13 genes were the first time finding associated with the prognosis of GC. Last but not least, the signature may be associated with cancer recurrence and chemotherapy resistance in GC (Figure 7). Further experimental studies are warranted to elucidate the mechanisms of the 13 genes in gastric cancer.
13-gene signature may be related to chemotherapy resistance in GC.
Supplementary Material
Supplementary table S1 and table S2.
Supplementary table S3.
Acknowledgements
This research was financially supported by the National Natural Science Foundation of China (grant no. 81874058).
Competing Interests
The authors have declared that no competing interest exists.
References
1. Bray F, Ferlay J, Soerjomataram I, Siegel RL, Torre LA, Jemal A. Global cancer statistics 2018: GLOBOCAN estimates of incidence and mortality worldwide for 36 cancers in 185 countries. CA: a cancer journal for clinicians. 2018;68:394-424
2. In H, Solsky I, Palis B, Langdon-Embry M, Ajani J, Sano T. Validation of the 8th Edition of the AJCC TNM Staging System for Gastric Cancer using the National Cancer Database. Ann Surg Oncol. 2017;24:3683-91
3. Gullo I, Carneiro F, Oliveira C, Almeida GM. Heterogeneity in Gastric Cancer: From Pure Morphology to Molecular Classifications. Pathobiology. 2018;85:50-63
4. Bornschein J, Rokkas T, Selgrad M, Malfertheiner P. Gastric cancer: clinical aspects, epidemiology and molecular background. Helicobacter. 2011;16(Suppl 1):S45-S52
5. Fang C, Wang W, Deng JY, Sun Z, Seeruttun SR, Wang ZN. Proposal and validation of a modified staging system to improve the prognosis predictive performance of the 8th AJCC/UICC pTNM staging system for gastric adenocarcinoma: a multicenter study with external validation. Cancer Commun. 2018;38:67
6. Kanda M, Kodera Y. Recent advances in the molecular diagnostics of gastric cancer. World J. Gastroenterol. 2015;21:9838-52
7. He R, Zuo S. A Robust 8-Gene Prognostic Signature for Early-Stage Non-small Cell Lung Cancer. Front Oncol. 2019;9:693
8. Yan X, Fu X, Guo ZX, Liu XP, Liu TZ, Li S. Construction and validation of an eight-gene signature with great prognostic value in bladder cancer. J Cancer. 2020;11:1768-79
9. Lv X, Zhao Y, Zhang L, Zhou S, Zhang B, Zhang Q. et al. Development of a novel gene signature in patients without Helicobacter pylori infection gastric cancer. J Cell Biochem. 2020;121:1842-54
10. Cai Q, Zhou W, Li J, Ou X, Chen C, Cai S. et al. Association of Preoperative Serum Carcinoembryonic Antigen and Gastric Cancer Recurrence: A Large Cohort Study. J Cancer. 2021;12:397-403
11. Wang J, Gao P, Song Y, Sun J, Chen X, Yu H. et al. Prognostic value of gastric cancer-associated gene signatures: Evidence based on a meta-analysis using integrated bioinformatics methods. J Cell Mol Med. 2018;22:5743-7
12. Zhao E, Zhou C, Chen S. A signature of 14 immune-related gene pairs predicts overall survival in gastric cancer. Clin Transl Oncol. 2020 doi: 10.1007/s12094-020-02414-7
13. Wang Z, Chen G, Wang Q, Lu W, Xu M. Identification and validation of a prognostic 9-genes expression signature for gastric cancer. Oncotarget. 2017;8:73826-36
14. Zhu X, Tian X, Sun T, Yu C, Cao Y, Yan T. et al. GeneExpressScore Signature: a robust prognostic and predictive classifier in gastric cancer. Mol Oncol. 2018;12:1871-83
15. Ma B, Li Y, Ren Y. Identification of a 6-lncRNA prognostic signature based on microarray re-annotation in gastric cancer. Cancer Med. 2020;9:335-49
16. Zare A, Ganji M, Omrani MD, Alipoor B, Ghaedi H. Gastric Cancer MicroRNAs Meta-signature. International journal of molecular and cellular medicine. Int J Mol Cell Med. 2019;8:94-102
17. Yin Y, Zhuo W, Zhao Y, Chen S, Li J, Wang L. et al. Converting a microarray signature into a diagnostic test: a trial of custom 74 gene array for clarification and prediction the prognosis of gastric cancer. PLoS One. 2013;8:e81561
18. Marqués-Lespier JM, González-Pons M, Cruz-Correa M. Current Perspectives on Gastric Cancer. Gastroenterol Clin North Am. 2016;45:413-28
19. Quan R, Ning Z, Wang Y, Yu W, Zhu H. Prognostic Value of Upregulation of Myristoylated Alanine-Rich C-Kinase Substrate in Gastric Cancer. Med Sci Monit. 2019;25:279-87
20. Lee J, Sohn I, Do IG, Kim KM, Park SH, Park JO. et al. Nanostring-based multigene assay to predict recurrence for gastric cancer patients after surgery. PLoS One. 2014;9:e90133
21. Dai J, Li ZX, Zhang Y, Ma JL, Zhou T, You WC. et al. Whole Genome Messenger RNA Profiling Identifies a Novel Signature to Predict Gastric Cancer Survival. Clin Transl Gastroenterol. 2019;10:e00004
22. Sun M, Qiu J, Zhai H, Wang Y, Ma P, Li M. et al. Prognostic Implications of Novel Gene Signatures in Gastric Cancer Microenvironment. Med Sci Monit. 2020;26:e924604
23. Huang K, Chen S, Xie R, Jiang P, Yu C, Fang J. et al. Identification of three predictors of gastric cancer progression and prognosis. FEBS Open Bio. 2020;10:1891-9
24. Wang G, Shi B, Fu Y, Zhao S, Qu K, Guo Q. et al. Hypomethylated gene NRP1 is co-expressed with PDGFRB and associated with poor overall survival in gastric cancer patients. Biomed Pharmacother. 2019;111:1334-41
25. Pathi SS, Jutooru I, Chadalapaka G, Sreevalsan S, Anand S, Thatcher GR. et al. GT-094, a NO-NSAID, inhibits colon cancer cell growth by activation of a reactive oxygen species-microRNA-27a: ZBTB10-specificity protein pathway. Mol Cancer Res. 2011;9:195-202
26. Huang L, Cai Y, Luo Y, Xiong D, Hou Z, Lv J. et al. JAZF1 Suppresses Papillary Thyroid Carcinoma Cell Proliferation and Facilitates Apoptosis via Regulating TAK1/NF-κB Pathways. Onco Targets Ther. 2019;12:10501-14
27. He J, Huang H, Du Y, Peng D, Zhou Y, Li Y. et al. Association of DCBLD2 upregulation with tumor progression and poor survival in colorectal cancer. Cell Oncol (Dordr). 2020;43:409-20
28. Kreiseder B, Holper-Schichl YM, Muellauer B, Jacobi N, Pretsch A, Schmid JA. et al. Alpha-catulin contributes to drug-resistance of melanoma by activating NF-κB and AP-1. PLoS One. 2015;10:e0119402
29. Shin YJ, Sa JK, Lee Y, Kim D, Chang N, Cho HJ. et al. PIP4K2A as a negative regulator of PI3K in PTEN-deficient glioblastoma. J Exp Med. 2019;216:1120-34
30. Li Q, Zheng ZC, Ni CJ, Jin WX, Jin YX, Chen Y. et al. Correlation of Cystatin E/M with Clinicopathological Features and Prognosis in Triple-Negative Breast Cancer. Ann Clin Lab Sci. 2018;48:40-4
31. Spolverato G, Ejaz A, Kim Y, Squires MH, Poultsides GA, Fields RC. et al. Rates and patterns of recurrence after curative intent resection for gastric cancer: a United States multi-institutional analysis. J Am Coll Surg. 2014;219:664-75
32. Yu G, Wang J, Chen Y, Wang X, Pan J, Li G. et al. Overexpression of phosphorylated mammalian target of rapamycin predicts lymph node metastasis and prognosis of chinese patients with gastric cancer. Clin Cancer Res. 2009;15:1821-9
33. Murayama T, Inokuchi M, Takagi Y, Yamada H, Kojima K, Kumagai J. et al. Relation between outcomes and localisation of p-mTOR expression in gastric cancer. Br J Cancer. 2009;100:782-8
34. Burris HA 3rd. Overcoming acquired resistance to anticancer therapy: focus on the PI3K/AKT/mTOR pathway. Cancer Chemother Pharmacol. 2013;71:829-42
35. Vasan N, Baselga J, Hyman DM. A view on drug resistance in cancer. Nature. 2019;575:299-309
36. Liu W, Chang J, Liu M, Yuan J, Zhang J, Qin J. et al. Quantitative proteomics profiling reveals activation of mTOR pathway in trastuzumab resistance. Oncotarget. 2017;8:45793-806
37. Al-Batran SE, Ducreux M, Ohtsu A. mTOR as a therapeutic target in patients with gastric cancer. Int J Cancer. 2012;130:491-6
38. Braicu C, Buse M, Busuioc C, Drula R, Gulei D, Raduly L. et al. A Comprehensive Review on MAPK: A Promising Therapeutic Target in Cancer. Cancers. 2019 11.1618
39. Yang M, Gu YY, Peng H, Zhao M, Wang J, Huang SK. et al. NAIF1 inhibits gastric cancer cells migration and invasion via the MAPK pathways. J Cancer Res Clin Oncol. 2015;141:1037-47
40. Liang B, Wang S, Zhu XG, Yu YX, Cui ZR, Yu YZ. Increased expression of mitogen-activated protein kinase and its upstream regulating signal in human gastric cancer. World J Gastroenterol. 2005;11:623-8
41. Guo X, Ma N, Wang J, Song J, Bu X, Cheng Y. et al. Increased p38-MAPK is responsible for chemotherapy resistance in human gastric cancer cells. BMC cancer. 2008;8:375
42. Tan W, Yu HG, Luo HS. Inhibition of the p38 MAPK pathway sensitizes human gastric cells to doxorubicin treatment in vitro and in vivo. Mol Med Rep. 2014;10:3275-81
Author contact
![]() Corresponding author: Dr Jianping Zhang, Department of General Surgery, The Second Affiliated Hospital of Nanjing Medical University, Nanjing, 210011, China. E-mail: drzhangjpedu.cn, Tel: +8625-5850 9832. Professor Yuan Li, Department of Nutrition and Food Hygiene, School of Public Health, Nanjing Medical University, Nanjing, 210011, China. Email: liyuanedu.cn, Tel: +8625-86868329.
Corresponding author: Dr Jianping Zhang, Department of General Surgery, The Second Affiliated Hospital of Nanjing Medical University, Nanjing, 210011, China. E-mail: drzhangjpedu.cn, Tel: +8625-5850 9832. Professor Yuan Li, Department of Nutrition and Food Hygiene, School of Public Health, Nanjing Medical University, Nanjing, 210011, China. Email: liyuanedu.cn, Tel: +8625-86868329.