Impact Factor ISSN: 1837-9664

 Global reach, higher impact
J Cancer 2021; 12(11):3277-3290. doi:10.7150/jca.55077 This issue Cite
Research Paper
High expression of TREM2 promotes EMT via the PI3K/AKT pathway in gastric cancer: bioinformatics analysis and experimental verification
Chunmei Li1,2,3#, Xiaoming Hou3#, Shuqiao Yuan4#, Yigan Zhang5, Wenzhen Yuan6, Xiaoguang Liu1,2,7, Juan Li1,2,8, Yuping Wang1,2, Quanlin Guan6, Yongning Zhou1,2 ![]()
1. Department of Gastroenterology, The First Hospital of Lanzhou University, Lanzhou, China.
2. Key Laboratory for Gastrointestinal Diseases of Gansu Province, The First Hospital of Lanzhou University, Lanzhou, China.
3. Department of Oncology, The First Hospital of Lanzhou University, Lanzhou, China.
4. Department of medical laboratory, The First Hospital of Lanzhou University, Lanzhou, China.
5. The First School of Clinical Medicine, Lanzhou University, Lanzhou, China.
6. Department of Oncology Surgery, The First Hospital of Lanzhou University, Lanzhou, China.
7. Department of Rheumatology, The First Hospital of Lanzhou University, Lanzhou, China.
8. Department of Gastroenterology, Gansu Provincial Hospital, Lanzhou, China.
#These authors contributed equally to this work.
Received 2020-10-26; Accepted 2021-3-15; Published 2021-4-2
Abstract

Background: To date, the pathogenesis of gastric cancer (GC) remains unclear. We combined public database resources and bioinformatics analysis methods, explored some novel genes and verified the experiments to further understand the pathogenesis of GC and to provide a promising target for anti-tumor therapy.
Methods: We downloaded the chip data related to GC from the Gene Expression Omnibus (GEO) database, extracted differentially expressed genes (DEGs), and then determined the key genes in the development of GC via PPI networks and model analysis. Functional annotation via GO and KEGG enrichment of DEGs was used to understand the latent roles of DEGs. The expression of the triggering receptor expressed on myeloid cells 2 (TREM2) gene in GC cell lines was verified via RT-PCR and western blotting. Moreover, the CCK-8, wound healing assay, and transwell migration and invasion assays were used to understand the changes in the proliferation, migration, and invasion abilities of GC cells after silencing TREM2. Western blotting verified the interaction between TREM2 and PI3K predict of the string website, as well as the effect of TREM2 on EMT. Finally, a lung metastasis model was used to explore the relationship between TREM2 and metastasis.
Results: Our study identified 16 key genes, namely BGN, COL1A1, COL4A1, COL5A2, NOX4, SPARC, HEYL, SPP1, TIMP1, CTHRC1, TREM2, SFRP4, FBXO32, GPX3, KIF4A, and MMP9 genes associated with GC. The EMT-related pathway was the most significantly altered pathway. TREM2 expression was higher in GC cell lines and was remarkably associated with tumor invasion depth, TNM stage, histological grade, histological type, anatomic subdivision, and Helicobacter pylori state. Knockdown of TREM2 expression inhibited the proliferation, migration, and invasion of GC cells as well as the progression of EMT by PI3K/AKT signaling in vitro. In addition, lung metastasis were decreased in vivo.
Conclusions: We identified some important genes associated with the progression of GC via public database analysis, explored and verified the effects of proto-oncogene TREM2 on EMT via the PI3K/AKT pathway. TREM2 may be a novel target in the GC therapy.
Keywords: TREM2, gastric cancer (GC), EMT, PI3K/AKT pathway, bioinformatics
Introduction
Gastric cancer (GC) is a fatal disease that seriously affects people's health. In 2018, 730,000 people died of GC worldwide [1]. Most patients with GC are diagnosed at an advanced stage and lose the opportunity for surgery. Limited therapy options are available, such as chemotherapy, radiotherapy, and targeted therapy, but outcomes are not satisfactory because of the heterogeneity and diversity of GC [2]. Therefore the 5-year survival rate of patients with GC is low. We should actively search for important molecules associated with the carcinogenesis of GC, deeply understand the pathogenesis of GC, and provide more novel and effective targets for the diagnosis and treatment of GC.
In the past decade, the development of microarray technology and bioinformatics analyses tools has facilitated the discovery of some novel genes and pathways in the development of tumor from multiple levels as well as exploration of biomarkers related to tumor survival, prognosis, and diagnosis [3-7]. Many newly discovered genes have also been confirmed in cell and animal experiments [8,9]. This new idea provides a new direction for the study of the detailed mechanism of tumorigenesis. We used the data of patients with GC in the public database Gene Expression Omnibus (GEO) to explore the functional aggregation of differentially expressed genes (DEGs) and to search for significantly altered metabolic pathways. We found key genes in the progression of GC by constructing protein-protein interaction (PPI) networks and modular analysis and further explored and validated the genes that may be therapeutic targets.
Bioinformatics analysis has revealed that the protein-coding gene triggering receptor expressed on myeloid cells 2 (TREM2) was a key gene in GC progression. Previous studies have reported that TREM2 has roles in the degree of the inflammatory response under infection [10,11], osteoclast differentiation during bone reconstruction [12], and the occurrence of Alzheimer's disease [13,14]. With the rapid emergence of different studies, TREM2 has been reported to affect the pathogenesis of some types of tumor [15-20]. For example, Kim et al. proved that TREM2 suppresses tumor development in vivo and in vitro assays by targeting Wnt1/β-catenin and Erk signaling and serves as a therapeutic target for colorectal cancer [17]. TREM2 affects carcinogenesis by PI3K/AKT/β-catenin signaling in hepatocellular carcinoma [20]. Besides, silencing TREM2 suppresses cell proliferation, invasion, and migration and significantly increases the apoptosis of glioma cell lines, suggesting that TREM2 may be a novel therapeutic target [19]. Nonetheless, the role of TREM2 in GC remains unclear.
In our study, we analyzed the public database resources using bioinformatics methods to find the key genes that may participate in the occurrence and development of GC and reviewed the connection between these key genes and GC. Furthermore, we determined that the key gene TREM2 is related to a variety of clinicopathological features and overall survival (OS) in patients with GC. We explored and verified that TERM2 can promote the EMT process via the PI3K/AKT pathway at the bioinformatic and experiment levels.
Materials and methods
Data processing and DEGs identification
Two gene expression microarray datasets, namely GSE72305 and GSE103236, were acquired from the GEO database. The GSE72305 dataset was from the Agilent GPL15314 platform and included two normal gastric tissues, five cases of primary GC specimens without lymph node metastasis (LNM), and five cases of primary GC specimens with LNM. The GSE103236 dataset was from the Agilent GPL4133 platform and included ten pairs GC and normal adjacent tissues. The LIMMA package in R language, a linear regression model, was used to explore the DEGs in GC tissues and adjacent tissues [21]. A p value of <0.05 and logFC (fold change) of >1.0 were set as thresholds to screen DEGs. The intersection genes were graphically overlapped using online Venn diagram tools (http://bioinformatics.psb.ugent.be/ webtools/Venn/).
Functional enrichment analysis
The enrichment analyses of the DEGs, consisting of Gene Ontology (GO) function and Kyoto Encyclopedia of Genes and Genomes (KEGG) pathway, were implemented using the FunRich software. These analyses provide gene functional classification and comprehensive functional explanation for researchers to comprehend biological characteristics [22].
PPI network construction, module analysis, and hub gene selection
Based on STRING (http://string-db.org. Version 10.0) online tool [23], the PPIs of the DEGs were screened with a confidence score of ≥0.7. Then, the PPI network was visualized using the Cytoscape software (version 3.5.1). PPI networks were drawn using Cytoscape, and the most significant module in the PPI networks was identified using MCODE [24]. The criteria for selection were as follows: MCODE scores >5, degree cut-off = 2, node score cut-off = 0.2, Max depth = 100, and k-score = 2. Finally, the node of high degree of >10 was selected as the hub genes.
Survival analysis of key genes
The Kaplan-Meier plotter online database (http://kmplot.com/analysis/) was used to calculate the OS of individual key gene, which classified the GC patients into high-expression and low-expression groups based on the expression median of the key gene.
Patients sample from TCGA database
We downloaded clinicopathological data including patients' sex, age, histologic type, histologic grade, TNM stage, and anatomic subdivision from TCGA database, 393 cases about patient with gastric adenocarcinoma, 175 cases about patient with gastric adenocarcinoma and HP infection status. The correlation between TREM2 and clinicopathological features were analyzed by these database, separately.
Cell culture
Normal gastric epithelium cell line (GES-1) and human GC cell lines (SGC-7901, BGC-823, MGC-803, HGC-27, and MKN-45) were purchased from Chinese Academy of Sciences (Shanghai, China). Cells were cultured in RPMI 1640 medium supplemented with 10% fetal bovine serum (FBS), 100 mg/mL streptomycin, and 100 U/mL penicillin. Cells were maintained in a humidified incubator with 5% CO2 at 37 °C and logarithmic growth.
Lentivirus transduction
The small hairpin RNA (shRNA) oligonucleotides against human TREM2 (target region 1, 5′-GAGCCTCTTGGAAGGAGAAAT-3′; target region 2, 5′-CACAGCCATCACAGACGATAC -3′) and control shRNA non-specific control oligonucleotides were annealed and inserted into the BamH I-EcoR I site of pPLK/GFP+puro vector. Viral packaging was implemented in HEK293T cells using the GM easyTM Lentiviral Packaging Kit (Genomeditech, Shanghai). The supernatant conditioned viral particles were harvested at 48 and 72 h after transfection and the filtered through 0.45 μm filters. After viral infection, GC cells were incubated with filtered conditioned media for 8 h. Puromycin was then added to select lentivirus-infected cells. After 2 weeks, experiments were performed.
Cell proliferation assay
Cell proliferation was analyzed using the Cell Counting Kit-8 (CCK-8) assay. Different groups of GC cells (1 × 10³) were seeded into 96-well plates and were cultured for 24, 48, 72, 96, and 120 h. Then, cells were incubated with 10 μL of CCK-8 solution for 2 h. The absorbance in each well was measured at OD450 using a microplate reader RT-6000 (Rayto, China).
Wound healing assay
In brief, the transfected cells were seeded into 6-well plates at a concentration of 3-7 × 10⁵ cells/ml. When cells were cultured to approximately 90% confluency, a 200 μL pipette tip was used to make a straight wound on the confluent monolayer. The cells were then culturing on serum-free medium for 48 h. The wounded monolayer was washed with phosphate-buffered saline (PBS) and photographed using an inverted microscope.
Transwell migration and invasion assays
Migration and invasion assays were performed in 24-well plates with inserts (8 μmol/L pore size, Corning) without or with Matrigel. Cancer cells (2 × 10⁴ cells/well) were added into the upper chambers in serum-free media. Meanwhile, RPMI 1640 containing 5% FBS was added to the lower chambers. After incubation at 37 °C in 5% CO2 for 24 h (migration assay) or 36 h (invasion assay), the upper chamber was cleaned with a cotton swab and the lower chamber was fixed with 4% paraformaldehyde, dyed with 0.1% crystal violet, and then washed with water for three times. An inversion microscope (Olympus CKX53, Japan) was used to image the cells under a microscope. The number of cells per field was calculated using the Image J Version 1.48 software (National Institutes of Health, Bethesda, MD).
Real-time polymerase chain reaction (RT-PCR)
RNA was extracted from GC cells using the Trizol Kit (Invitrogen, CA) according to a standard protocol. Biophotometer B-500 (Metash, Shanghai) was used to determine the quality and quantity of the isolated RNA. Subsequently, complementary DNA was synthesized using the PrimeScript™ RT reagent Kit with gDNA Eraser (Takara). The expression level of TREM2 was detected using RT-PCR with TB Green™ Premix Ex Taq II (Takara) according to the manufacturer's instructions. GAPDH was used as a reference for normalization. The primer sequences were as follows: TREM2 primer: F, 5′-ACTACTCTGCCTGAACAC-3′ and R, 5′-GCTAAATATGACAGTCTTGGA-3′, GAPDH primer: F, 5′-GTCTCCTCTGACTTCAACAGCG-3′ and R, 5′-ACCACCCTGTTGCTGTAGCCAA-3′. The fold change of TREM2 was calculated by the 2-ΔΔCT method.
Western blot analysis
Total protein was extracted using the RIPA Lysis Buffer and PMSF, phosphatase inhibitor (Sangon Biotech, Shanghai) following the manufacturers' instructions, followed by centrifugation for 15 min at 12,000 rpm. The bicinchoninic acid assay was used to measure total protein concentrations. Proteins (30 µg per lane) were separated on SDS-PAGE gels and transferred on to PVDF membranes. Membranes were blocked with 5% non-fat milk and incubated with primary antibodies at 4 °C overnight. Then, cells were incubated with an HRP-conjugated secondary antibody. The bands were detected with enhanced chemiluminescence and visualized using a Fluorescent and Chemiluminescence Gel Imaging System (Peiqing Science and Technology Co., Ltd.). The primary antibodies were purchased from ABcam (Cambridge, UK). Antibody dilutions were 1:800 for the anti-TREM2 antibody; 1:1000 for the anti-E-cadherin antibody; 1:800 for the anti-N-cadherin antibody; 1:1000 for the anti-Vimentin antibody; 1:500 for the anti-PI3K antibody; 1:500 for the anti-AKT antibody; 1:500 anti-p-PI3K antibody; and 1:500 for the anti-p-AKT antibody. The Image J Version 1.48 software was used to quantify protein expression, and GAPDH was used as a loading control.
Immunofluorescence
Cells were fixed with 4% paraformaldehyde for 20 min and washed with PBS three times for 3 min. Cells were then permeabilized at room temperature with 0.5% Triton X-100 for 20 min and washed with PBS. Goat serum was used for blocking at room temperature for 30 min. Cells were incubated with 1:50 dilution of the anti-E-cadherin primary antibody (ABclonal , A3044) overnight at 4 °C and then washed with PBS. The fluorescent secondary antibody [1:200, goat anti-Rabbit Alexa 594 (ZSGB‐BIO)] was added and the cells were incubated at room temperature in the dark for 2 h. Cells nuclei were visualized via staining with DAPI (Sigma Aldrich) in the dark for 2 min and were observed under an inverted fluorescent microscope.
Pulmonary metastasis model
Ten BALB/C nude mice were purchased from Hunan SJA Laboratory Animal Co., Ltd. Five-week-old male nude mice were divided into two groups, and 1 × 10⁶/100 µL of BGC-823 shCtrl or BGC-823 shTREM2 #2 cells were injected via the tail vein. After 1 month, all mice were sacrificed. The tumors in lung tissues were observed under a microscope. Experiments conformed to the local ethics committee and the Use Committee for Animal Care and were performed in compliance with institutional guidelines.
Statistical analysis
All date analysis was performed using the Statistical Package for the Social Sciences (SPSS) 23.0 software and the GraphPad Prism v. 7.01, software package. The results are expressed as means ±standard deviation (SD) unless otherwise mentioned. Correlations between TREM2 expression and clinicopathological factors were analyzed using the Chi-squared test. The statistical comparisons were evaluated using the Student's t-test and one- or two-way ANOVA. A P< 0.05 was considered statistically significant. All experiments were repeated three times.
Results
Identification of DEGs in GC
After standardization of the chips, we identified 146 and 127 upregulated DEGs and 150 and 48 downregulated DEGs in the GSE72305 and GSE103236 datasets (Figure 1A, 1B), respectively, by the LIMMA package.
Identification of key genes and function and pathway analysis about GSE72305 and GSE103236. (A) The expression profile of gastric cancer related expressed genes. (B) Volcanic plot of gastric cancer-related differentially expressed genes (DEGs) respectively. (C, D) The biological process of EDGs by Gene Ontology (GO) and the biological pathways analysis of DEGs by Kyto Encyclopedia of Gene and Genomes (KEGG) enrichment about GSE72305 and GSE103236.
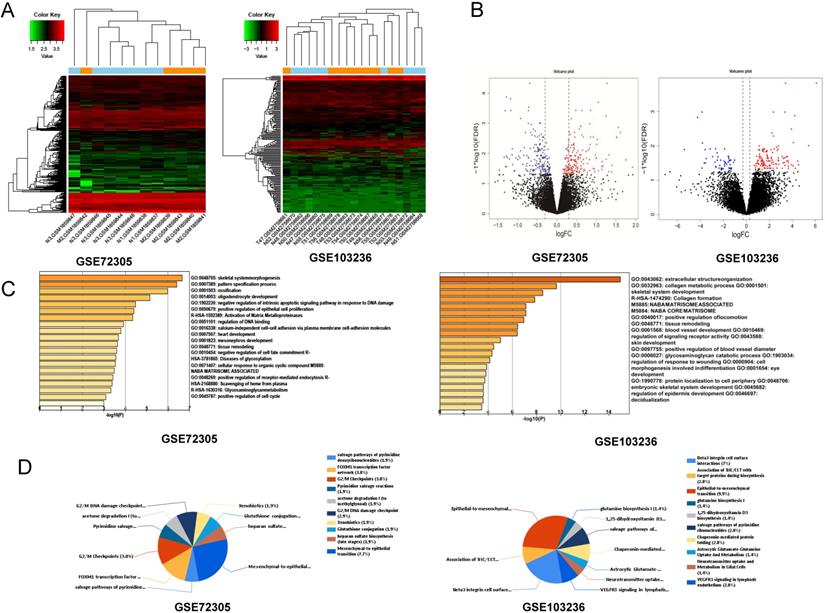
Functional enrichment analysis of DEGs
We analyzed biological classification and functional enrichment using the FunRich software. The biological functions of DEGs from GSE72305 dataset were mainly involved in skeletal system morphogenesis and ossification, oligodendrocyte development, negative regulation of intrinsic apoptotic signaling pathway in response to DNA damage, positive regulation of epithelial cell proliferation (Figure 1C). Meanwhile, the biological pathways were mainly associated with the EMT (7.7%), G2/M checkpoint (3.8%), FOXM1 transcription factor network (3.8%), G2/M DNA damage checkpoint (2.9%) (Figure 1D). Moreover, the biological process of DEGs from GSE103236 were mainly involved in extracellular structure organization, collagen metabolic process, skeletal system development, and collagen formation (Figure 1C), and the biological pathway mainly associated with EMT (9.9%), beta-3 integrin cell surface interactions (7%), VEGFR3 signaling in lymphatic endothelium (2.8%), and chaperonin-mediated protein folding (2.8%) (Figure 1D). Among these singling pathways of the two chips, it was observed that the EMT singling pathway was important in DEG-related pathways.
Screening of the key gene
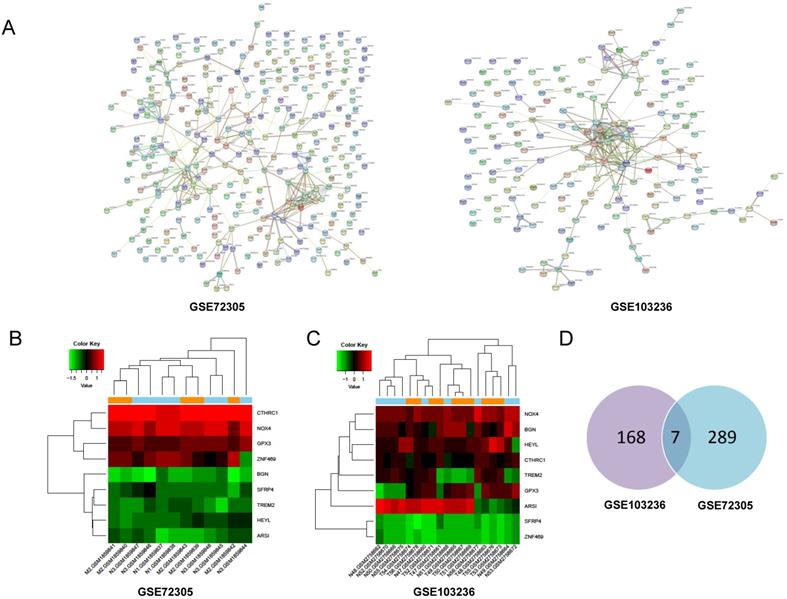
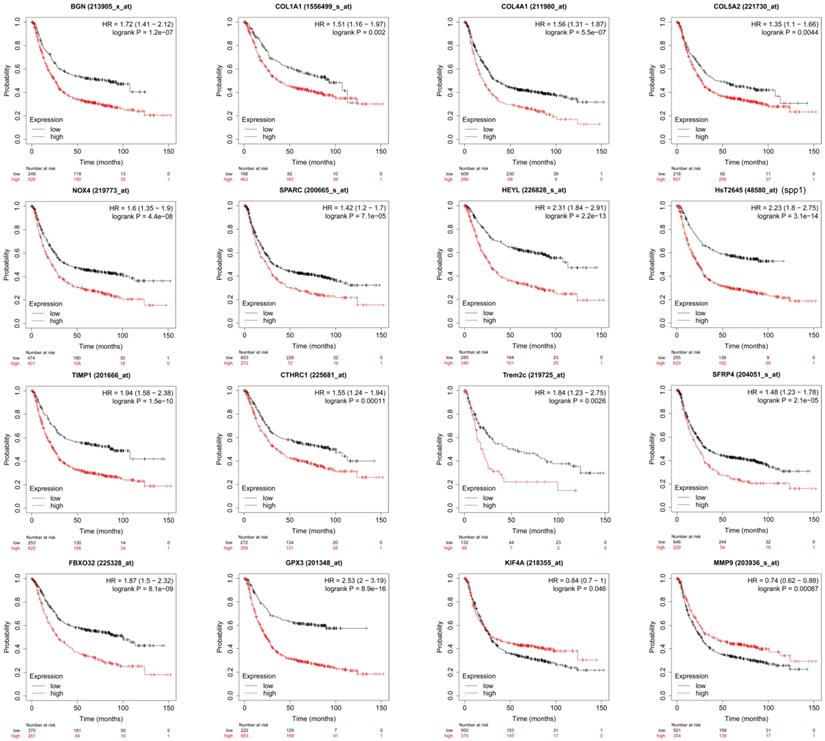
Through PPI network construction and module analysis of DEGs (Figure 2A), we found 10 hub genes from two chips including BGN, COL4A1, COL5A2, SPP1, TIMP1, KIF4A, MMP9, FBXO32, COL1A1, and SPARC. Meanwhile, we found 9 common genes (Figure 2B, 2C) and 7 common DEGs in GSE72305 and GSE103236 (Figure 2D). To avoid missing important molecules, we analyzed 7 common DEGs shared by the two chips together with hub genes namely TREM2, CTHRC1, BGN, NOX4, GPX3, HEYL, and SFRP4. Therefore, these 16 genes were included in the next-step analysis. Furthermore, in addition to GPX3 other genes were highly expression in GC tissue compared with normal gastric mucosal tissue with the cancer genome atlas (TCGA) database as the validation dataset (Additional file: Figure S1). Besides, these genes expression were closely associated with GC occurrence, development (Table 1) and prognosis by the Kaplan-Meier plotter online database (Figure 3). Most genes have been verified to take part in the occurrence and development of GC. Inflammation related gene TREM2 related to clinicopathological characteristics and prognosis in GC, but specific mechanism is not clear. We will further explore it by experiments.
Screening of hub genes by PPI network and model analysis. (A) Protein-protein interaction network of differentially expressed genes in GSE72305 and GSE103236. The different colored lines indicate the different evidences demonstrating the interaction. (B, C) The heatmap about expression profile of nine common genes in GSE72305 and GSE103236. (D) Seven common DEGs in GSE72305 and GSE103236 by Venn diagrm software.
Functional role of 16 hub genes
| Gene symbol | Full name | Function |
|---|---|---|
| BGN | biglycan | High expression of BGN enhance invasion and associated with a poor outcome in GC. |
| COL1A1 | collagen, type I, alpha 1 | High expression of COL1A1 promotes cell proliferation, migration, and invasion in GC. |
| COL4A1 | collagen, type IV, alpha 1 | COL4A1 may confer trastuzumab resistance and COL4A1 expression profiles can be reversed by drugs in GC. |
| COL5A2 | collagen, type V, alpha 2 | COL5A2 is a hub gene in most tumors, linked to angiogenesis, blood vessel development in MIBC. |
| NOX4 | NADPH oxidase 4 | NOX4 is involved in development and progression of GC, and as a new genetic target. |
| SPARC | secreted protein, acidic, cysteine-rich (osteonectin) | SPARC is associated with development and progression of GC, and predict GC recurrence. |
| HEYL | hes-related family bHLH transcription factor with YRPW motif-like | HEYL is target genes of Notch signaling pathway, involved in development and progression of most tumors. |
| SPP1 | secreted phosphoprotein 1 | High expression of SPP1 promoted proliferation, EMT process, but inhibited apoptosis of GC cells. |
| TIMP1 | TIMP metallopeptidase inhibitor 1 | High expression of TIMP1 is associated with proliferative potential and poor prognosis of GC. |
| CTHRC1 | Collagen triple helix repeat containing 1 | CTHRC1 is associated with invasion, metastasis and poor prognosis of GC. |
| TREM2 | Triggering receptor expressed on myeloid cells 2 | TREM2 have a role in chronic inflammations, related to poor prognosis of GC and progression of HCG, RCC, colon cancer. |
| SFRP4 | Secreted frizzled-related protein 4 | SFRP4 as modulators of Wnt signaling, and predicte chemotherapy response in resectable GC. |
| FBXO32 | F-box protein 32 | FBXO32 is a TGF-β/Smad signaling pathway target gene, can effected 5-FU resistance in GC. |
| GPX3 | Glutathione peroxidase 3 | GPX3 down-regulation in GC is due to aberrant promoter hypermethylation, suppressor of GC metastasis. |
| KIF4A | kinesin family member 4A | KIF4A is involved in development and progression of numerous types of cancer. |
| MMP9 | Matrix metalloproteinase 9 | High expression of MMP9 can promote metastasis in most tumors. |
GC: gastric cancer; HCC: hepatocellular carcinoma; RCC: renal cell carcinoma; MIBC: muscle-invasive bladder cancer.
The survival analysis of the key genes in GC patients. The online Kaplan-Meier plotter tool was used to analysis the prognostic information of the 16 key genes. p<0.05 was considered statistically significant.
TREM2 overexpression in GC
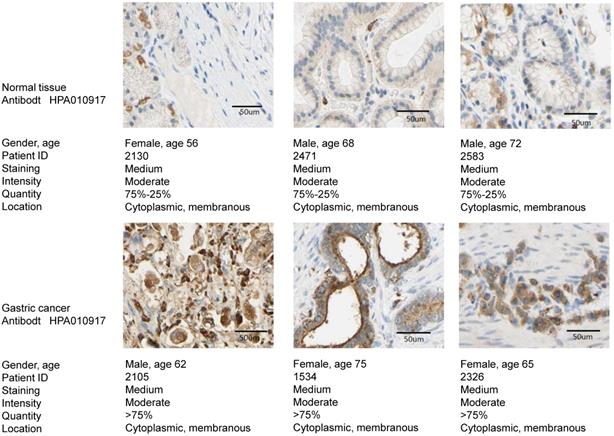
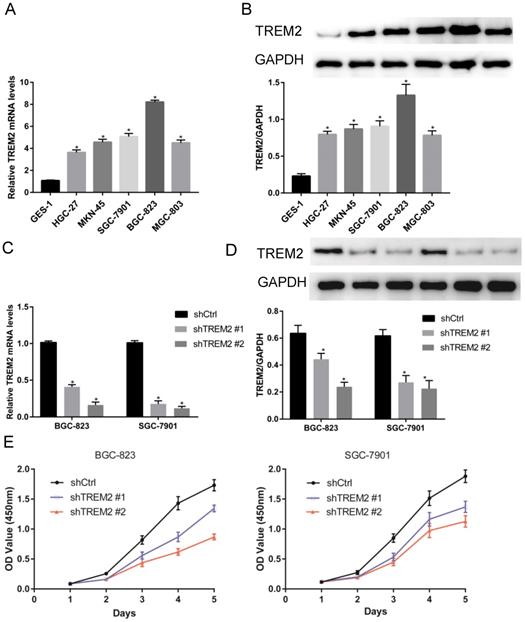
The expression of TREM2 was remarkably elevated in GC tissues than in paracancerous normal tissues in both GEO and TCGA databases. From The human protein ATLAS, the TREM2 expression level in GC sample were improved than normal tissue with immunohistochemistry analysis (Figure 4). To further confirm the expression of TREM2, we used RT-PCR and western blotting to verify the expression of TREM2 in different GC cell lines. The mRNA and protein expression levels of TREM2 were significantly improved in the GC cell lines SGC-7901, BGC-823, MGC-803, MKN-45, and HGC-27 compared with in GES-1 (Figure 5A, 5B). These results demonstrated that TREM2 is overexpressed in GC.
The TREM2 expression level between GC sample and normal tissue with immunohistochemistry analysis from the human protein ATLAS.
The expression of TREM2 in GC and affected cell proliferation. (A, B) TREM2 is high expression in GC cell lines at mRNA and protein levels. (C, D) Verified the ability of silence, shTREM2# 2 is more effectivity than shTREM2# 1 both in BGC-823 and SGC-7901 by RT-PCR and Western Blot. (E) The proliferation of BGC-823 and SGC-7901 were inhibited after knockdown of TREM2 measured by CCK8.
Correlation between TREM2 and clinicopathological features
393 cases about patient with gastric adenocarcinoma, 175 cases about patient with gastric adenocarcinoma and HP infection status, were used to analyze. The expression of TREM2 was associated with the depth of tumor invasion (P < 0.05), TNM stage (P < 0.05), histologic grade (P < 0.0001), histologic type (P < 0.05), and anatomic subdivision (P < 0.01) in 393 patients (Table 2). In the analysis of 175 patients with HP infection status, TREM2 was correlated with tumor invasion depth (P < 0.05), histologic grade (P < 0.0001), HP infection status (P < 0.05). This difference may be related to the different sample size in the data set. HP infected patients were detected in the TREM2 low group with 25%, while 75% in TREM2 high group, HP negative patients were detected in the TREM2 low group with 51.61%, while 48.39% in TREM2 high group (P < 0.05) (Additional file: Table S1). There are not associated between TREM2 expression and age, gender, or LNM, distant metastasis. Above results indicate that the expression of TREM2 is related to clinicopathological features of patients with GC.
Relationship between the expression of TREM2 and clinical characteristics in GC patients
| Characteristic | No. tumors (%) | P value | ||
|---|---|---|---|---|
| Total (n=393) | Low expression (n=192) | High expression (n=201) | ||
| Age (y) | 0.717 | |||
| <60 | 118 | 56 (47.46) | 62 (52.54) | |
| ≥60 | 275 | 136 (49.45) | 139 (50.55) | |
| Sex | 0.764 | |||
| Female | 138 | 66 (47.83) | 72 (52.17) | |
| Male | 255 | 126 (49.41) | 129 (50.59) | |
| Pathologic T | 0.010* | |||
| Tis and T1 | 19 | 15 (78.95) | 4 (21.05) | |
| T2 | 85 | 47 (55.29) | 38 (44.71) | |
| T3 | 185 | 88 (47.57) | 97 (52.43) | |
| T4 | 104 | 42 (40.38) | 62 (59.62) | |
| Pathologic N | 0.817 | |||
| N0 | 125 | 60 (48.00) | 65 (52.00) | |
| N1-3 | 268 | 132 (49.25) | 136 (50.75) | |
| Pathologic M | 0.435 | |||
| M0 | 372 | 180 (48.39) | 192 (51.61) | |
| M1 | 21 | 12 (57.14) | 9 (42.86) | |
| TNM stage | 0.014* | |||
| Stage I | 53 | 35 (66.04) | 18 (33.96) | |
| Stage II | 135 | 58 (42.96) | 77 (57.04) | |
| Stage III | 172 | 79 (45.93) | 93 (54.07) | |
| Stage IV | 33 | 20 (60.61) | 13 (39.39) | |
| Histologic grade | ||||
| G1 | 11 | 5 (45.45) | 6 (54.55) | 0.000* |
| G2 | 143 | 94 (65.73) | 49 (34.27) | |
| G3 | 239 | 93 (38.91) | 146 (61.09) | |
| Histological type | ||||
| Diffuse | 71 | 27 (38.03) | 44 (61.97) | 0.015* |
| Intestinal | 183 | 103 (56.28) | 80 (43.72) | |
| NOS | 139 | 62 (44.60) | 77 (55.40) | |
| Anatomic subdivision | 0.006* | |||
| Antrum | 145 | 70 (48.28) | 75 (51.72) | |
| Cardia | 51 | 25 (49.02) | 26 (50.98) | |
| Fundus | 141 | 59 (41.84) | 82 (58.16) | |
| GEJ | 48 | 35 (72.92) | 13 (27.08) | |
| NOS | 8 | 3 (37.50) | 5 (62.50) | |
*p<0.05, statistically.
TREM2 knockdown inhibits GC cell proliferation, migration and invasion in vitro
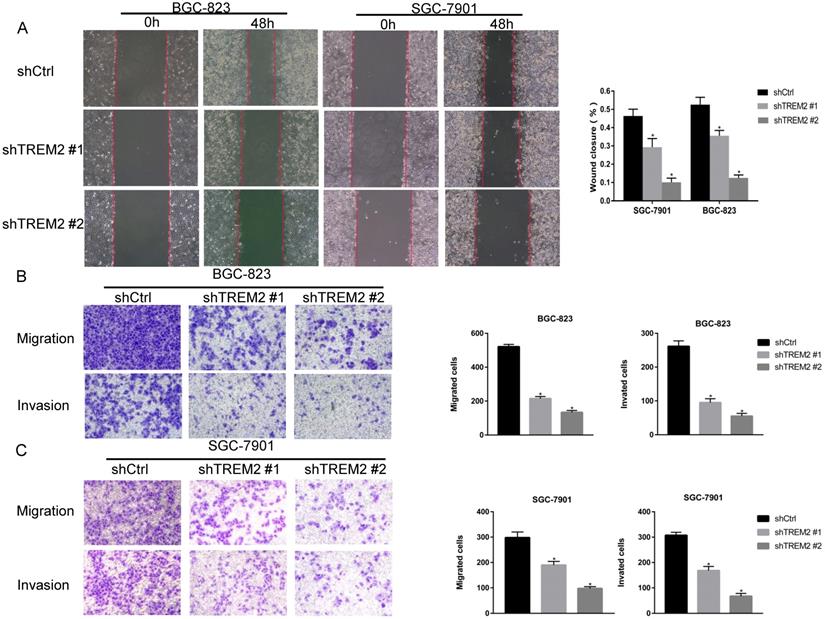
To investigate the role of TREM2 in GC, two kinds of shRNA against TREM2 were transfected into BGC-823 and SGC-7901 cell lines, the mRNA and protein expression levels of TREM2 were decreased by RT-PCR and Western blotting. The efficiency of shTREM2#2 knockdown TREM2 is higher than shTREM2#1 in BGC-823 and SGC-7901 cell lines (Figure 5C, 5D). Knockdown of TREM2 significantly inhibit cell proliferation ability compared to their corresponding control cell lines, by CCK-8, both in BGC-823 and SGC-7901 cell lines (Figure 5E). Wound healing assay and transwell migration assays were used to detect the effect of TREM2 on the migration of GC cells. The migration ability was inhibited when TREM2 silence (Figure 6A, 6B). The invasion ability also decreased after TREM2 konckdown by transwell invasion assays (Figure 6C). These results indicate that TREM2 is participates in the regulation of proliferation, migration, and invasion of GC.
TREM2 affected the GC cell migration and invasion. Knockdown of TREM2, (A, B, C) the ability of migration assessed with wound healing assay and transwell migration assays (magnification, ×100), the ability of invasion measured by transwell invasion assays (magnification, X100). The statistical analysis was shown in the bar graphs (*, P<0.05, vs. control group; mean ± SD, n=3).
High expression of TREM2 promote EMT by PI3K/AKT pathway
In the analysis of KEGG pathway enrichment of DEGs, EMT pathway accounted for the largest proportion in the GSE72305 and GSE103236 datasets, respectively. We therefore investigate whether key gene TREM2 is impact EMT process. The expression of E-cadherin increases when TREM2 expression decreased contrast of their corresponding control cell lines in SGC-7901 cell line observed by immunofluorescence (Figure 7A). Moreover, we used western blotting to detect the expression level of EMT-related protein in SGC-7901 and BGC-823 cell lines. After the konckdown of TREM2, the expression of E-cadherin elevated, and the expression of N-cadherin and Vimentin decreased (Figure 7B, 7C). The above data confirmed that TREM2 is participated in the EMT process of GC.
TREM2 promote EMT by PI3K/AKT pathway. (A) In GC cell line SGC-7901, the expression of E-cadherin was increased after knockdown of TREM2, measured by immunofluorescence staining (magnification, X100). (B) After knockdown of TREM2, the expression of E-cadherin was increased, the expression of N-cadherin, Vimentin, p-PI3K, p-AKT were decreased, the expression of PI3K and AKT not changed significantly. (C) The statistical analysis of proteins expression was shown in the bar graphs (*, P<0.05, vs. control group; mean ± SD, n=3). (D) Protein interaction network of TREM2 interacts with PIK3R2, PIK3CA, and PIK3CB proteins predicted by string website.
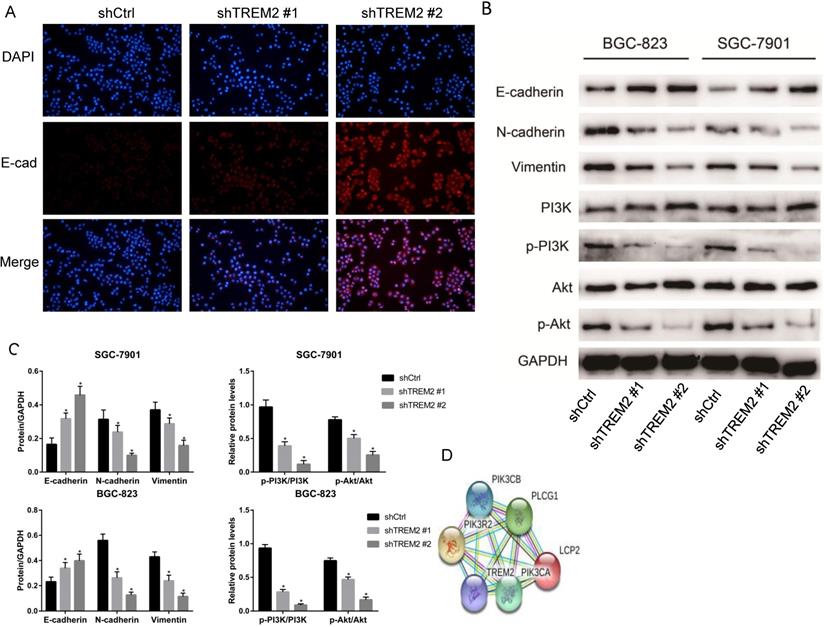
The string website predicted that TREM2 interacts with PIK3R2, PIK3CA, and PIK3CB proteins (Figure 7D), so we focused on the changes in the PI3K/AKT pathway. After knockdown of TREM2, there was no remarkable change in the expression of PI3K and AKT, but the expression of p-PI3K and p-AKT decreased in SGC-7901 and BGC-823 cell lines through western blotting (Figure 7B, 7C). As predicted, we found that PI3K/AKT pathway was inhibited when knockdown of TREM2. The PI3K/AKT pathway can regulate the EMT process, which has been proved in many kinds of tumors including GC. Combined with the above-mentioned outcomes, we believe that TREM2 can inhibit EMT through PI3K/AKT pathway.
Knockdown of TREM2 inhibits GC cells metastasis in vivo
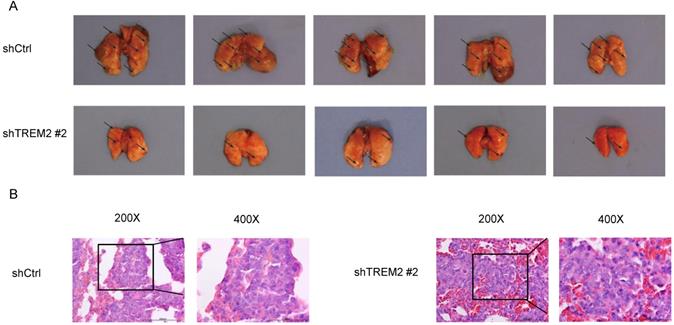
To assess metastasis, BGC-823 shCtrl or BGC-823 shTREM2 #2 cells were injected into nude mice via the tail vein. The TREM2 high-expression group had more lung metastasis tumors than the TREM2 low-expression group. Representative photographs of obviously lungs and H&E images of lung metastatic tumors are shown for the indicated groups (Figure 8).
Knockdown of TREM2 inhibits GC cells metastasis in vivo. (A) The lung metastasis tumors about BGC-823 shCtrl group were increased than BGC-823 shTREM2# 2 group (n = 5/group). A representative photographs of gross lungs from indicated groups are shown (n = 5/group). (B) Representative H&E images of lung metastatic tumors.
Discussion
With the development of bioinformatics, we can obtain high-throughput data, such as mRNA profiles, DNA methylation status, non-coding RNA profiles, and SNPs, from GEO, TCGA, Oncomine public databases and determine the key genes and pathways involved in tumor development [3,7]. This provides new targets for the molecular mechanisms of tumor research. Our research explored hub genes MMP9, KIF4A, and FBXO32 in the GSE72305 dataset and COL1A1, TIMP1, SPARC, COL5A2, SPP1, BGN, and COL4A1 in the GSE103236 dataset. Intersection genes TREM2, CTHRC1, BGN, NOX4, GPX3, HEYL, and SFRP4 from the GSE72305 and GSE103236 datasets, which were differentially expressed in the normal gastric mucosa than in gastric cancer cells and in lymph node free to lymph node metastatic GC. Therefore, these genes may play crucial roles in the development of GC.
To corroborate the outcomes of bioinformatics analysis, we reviewed the role of these genes in tumorigenesis and development, especially in GC. Previous analyses have reported these genes. All of the above genes are associated with the occurrence and development of GC in different degrees, which also proves the reliability of our analysis results. BGN, NOX4, SPARC, HEYL, SPP1, CTHRC1, SFRP4, FBXO32, KIF4A, MMP9, TIMP1 were related to the proliferation, invasion, prognosis, and recurrence of GC in different level and validated in many kind of tumors [25-37]. The key gene GPX3 is downregulation in GC cell lines and samples because of abnormal promoter methylation, and related to lymph node metastasis [38]. Cai et al. study proved that GPX3 affected migration and invasion through NFкB/Wnt5a/JNK pathway in GC [39]. The key genes COL1A1, COL4A1, COL5A2 belong to the collagen family, which is a constituent of the ECM component of tumors, and is closely related to tumor proliferation, invasion, drug resistance, and prognosis [7,40-46]. For example, the high expression of COL1A1 promotes cell proliferation, invasion, and migration in GC [42]. Liu et al. research identified that COL1A1 can predict the prognosis of GC patients with HP (+) [43]. COL5A2 has been identified as a hub gene in multiple biological analyses of GC, and enrich in EMT-related pathway [44]. In another example, COL4A1 may confer trastuzumab resistance and promote gastric carcinoma recurrence in GC [45,46]. Zhang et al. prior studies reported TREM2 is high expression in GC, and significantly associated with clinicopathological characteristics and prognosis [47]. However, there are few studies on the specific mechanism of TREM2 affecting the occurrence and development of GC.
About 90% of gastric adenocarcinoma are associated with HP infection [48], TREM2 is not only associated with chronic inflammation and OS of GC patients, but also involve in carcinogenesis of some other tumors [11,17,19,47]. Therefore, the synthesis of above features surprised us in GC. We carry out further cell studies to find the specific mechanisim about TREM2 involved in GC carcinogenesis, as extension and verification of bioinformatics analysis.
Our present study observed TREM2 is highly expressed in GC tissues and cell lines. In TCGA database, TREM2 is provides a key link of the clinicopathological features of GC (invasion depth, histologic grade, TNM stage, HP infection status, histologic grade and anatomic subdivision) in different data sets, which is consistent with previous research results. We were surprised to find that TREM2 is closely related to HP infection in GC. Moreover, after knockdown TREM2 expression in GC cell line BGC-823 and SGC-7901, the proliferation, migration, and invasion of GC cells were inhibited and lung metastasis was decreased in mice.
TREM2 is a cell surface receptor that does not have the ability to activate signals. Modern view, TREM2 binds to the ligand activating protein DNAX activating protein 12/Spleen tyrosine kinase (DAP12/Syk), then activate downstream signal pathways (PI3K, ERK, PLC pathway, etc.) to play a role [13]. The prediction of string website suggests that TREM2 interacts with the proteins of PIK3R2, PIK3CA and PIK3CB. We assume TREM2/DAP12/Syk may play a further role through PI3K. On the other hand, EMT is correlation with initiation, invasion, metastasis of tumor based on different cellular states in cancer progression [49-51]. The EMT-related pathway is the top altered pathway by DEGs KEGG enrichment analyses, suggesting the crucial role of EMT in GC initiation and progression. The activation of EMT depends on the stimulation of various extracellular signals (PI3K/AKT, Wnt, notch, TGF-β/Smad, ERK/MAPK, etc.) and the execution of EMT-TFs (snail, ZEB, and twist) [50,51]. PI3K/AKT pathway promotes EMT process of cancer which has been confirmed in many experiments [50-54], such as mouse adult Schwann cells-derived CXCL5 can activated PI3K/AKT pathway and through EMT-TFs (Snail, Twist) to promote EMT in lung cancer [53]. The lnc RNA PTTG3P can activate PI3K/AKT signaling by upregulating PTTG1, and affected cell cycle progression, cell apoptosis, and EMT-associated genes [54]. We hypothesized TREM2/DAP12/Syk activated the PI3K / AKT pathway to promote the EMT process based on prediction of bioinformatics. As expected, our findings demonstrated this signaling pathway, and confirmed the prediction of bioinformatics, deepening the mechanism of inflammation related gene TREM2 in the pathogenesis of GC, and provided a new direction for the treatment of GC.
With the increasing appreciation of the relationship between inflammation of tumor, mounting evidence indicates that inflammation is a hallmark of tumors [48]. The link between inflammation and GC has been confirmed in many experiments [55]. For example, inflammation-related factors, consist of T lymphocytes, macrophages, cytokines, and pro-inflammatory chemokines, can promote the development of HP related GC [48, 56]; Inflammatory fraction is associated with the prognosis of GC [57]; In addition, amplification of inflammatory response can advance the occurrence of GC in the animal model [58]. The above results are consistent with our idea inflammation related gene TREM2 can affects the malignant phenotype of gastric cancer. In previous analysis TREM2 is associated with HP infected, but exact mechanism about HP and TREM2 is unclear. When the gastric mucosa infected with HP, Syk can adjust the amplification of proinflammatory signaling [59]. In another study, Syk associated with T1 tumors, lymphatic invasion, venous invasion and lymph node metastasis [60]. TREM2 have functions after binds to DAP12/Syk activate downstream signal pathways. Whether HP infection can affect the expression of Syk through TREM2, and enlarge inflammation through TREM2, etc. needs further study.
In conclusion, we used a large database to find the novel gene in the development of GC and reviewed and analyzed the gene function. At the same time, the newly discovered inflammation related gene TREM2 has been verified to affect the EMT by PI3K/AKT pathway. This study extends the role of inflammation in the development of GC, facilitates us to better understand the relationship between inflammation and GC, and explores a possible therapeutic target for GC. However, the specific relationship and mechanism between HP and TREM2 need to be further explored.
Abbreviations
GC: gastric cancer; EMT: epithelial-mesenchymal transition; TCGA: The Cancer Genome Atlas; PPI: protein-protein interaction; GO: Gene Ontology; GEO: Gene Expression Omnibus; DEGs: differentially expressed genes; TREM2: Triggering receptor expressed on myeloid cells 2; KEGG: Kyoto Encyclopedia of Genes and Genomes; DAP12: DNAX activation protein 12; Syk: Spleen tyrosine kinase; BCA: Bicinchoninic acid; GEPIA: The Gene Expression Profiling Interactive Analysis; LMN: lymph node metastasis; OS: overall survival; FBS: fetal bovine serum; CCK8: Cell Counting Kit 8; RT-PCR: real-time polymerase chain reaction; SPSS: statistical package for the social sciences; SD: standard deviation.
Supplementary Material
Supplementary figures and tables.
Acknowledgements
This work was supported by the Hospital Fund Project of the First Hospital of Lanzhou University, China (no. ldyyyn2019-24 and no. ldyyyn2019-56), the Natural Science Foundation of Gansu Province, China (no. 18JR3RA343 and no. 20JR10RA395), the National Natural Science Foundation of China (71964021).
Ethics approval and consent to participate
All animal experiments were performed in accordance with the guidelines for animal care and the protocol was approved by the Committee on the Ethics of Animal Experiments of The First Hospital of Lanzhou University (approval no. LDYYLL2020-39).
Author contributions
(I) Conception and design: CM Li, YN Zhou; (II) Administrative support: XM Hou, SQ Yuan, YG Zhang; (III) Provision of study materials or patients: WZ Yuan, XG Liu, J Li; (IV) Collection and assembly of data: CM Li, XM Hou, SQ Yuan; (V) Data analysis and interpretation: YP Wang, QL Guan; (VI) Manuscript writing: All authors; (VII) Final approval of manuscript: All authors.
Competing Interests
The authors have declared that no competing interest exists.
References
1. Bray F, Ferlay J, Soerjomataram I, Siegel RL, Torre LA, Jemal A. Global cancer statistics 2018: GLOBOCAN estimates of incidence and mortality worldwide for 36 cancers in 185 countries. CA Cancer J Clin. 2018;68:394-424
2. Ang TL, Fock KM. Clinical epidemiology of gastric cancer. Singapore Med J. 2014;55:621-8
3. Zheng X, Zhang N, Wu HJ, Wu H. Estimating and accounting for tumor purity in the analysis of DNA methylation data from cancer studies. Genome biology. 2017;18:17
4. Ramazzotti D, Lal A, Wang B, Batzoglou S, Sidow A. Multi-omic tumor data reveal diversity of molecular mechanisms that correlate with survival. Nature communications. 2018;9:4453
5. Hackl H, Charoentong P, Finotello F, Trajanoski Z. Computational genomics tools for dissecting tumour-immune cell interactions. Nature reviews Genetics. 2016;17:441-58
6. Wang P, Wang Y, Langley SA, Zhou YX, Jen KY, Sun Q. et al. Diverse tumour susceptibility in Collaborative Cross mice: identification of a new mouse model for human gastric tumourigenesis. Gut. 2019;68:1942-52
7. Sun H. Identification of key genes associated with gastric cancer based on DNA microarray data. Oncol Lett. 2016;11:525-30
8. Arbel Rubinstein T, Shahmoon S, Zigmond E, Etan T, Merenbakh-Lamin K, Pasmanik-Chor M. et al. Klotho suppresses colorectal cancer through modulation of the unfolded protein response. Oncogene. 2019;38:794-807
9. Hou G, Dong C, Dong Z, Liu G, Xu H, Chen L. et al. Upregulate KIF4A Enhances Proliferation, Invasion of Hepatocellular Carcinoma and Indicates poor prognosis Across Human Cancer Types. Scientific reports. 2017;7:4148
10. Kong J, Du Z, Dong L. Pinitol Prevents Lipopolysaccharide (LPS)-Induced Inflammatory Responses in BV2 Microglia Mediated by TREM2. Neurotoxicity research. 2020;38:96-104
11. Zhu Z, Zhang X, Dong W, Wang X, He S, Zhang H. et al. TREM2 suppresses the proinflammatory response to facilitate PRRSV infection via PI3K/NF-κB signaling. PLoS pathogens. 2020;16:e1008543
12. Humphrey MB, Daws MR, Spusta SC, Niemi EC, Torchia JA, Lanier LL. et al. TREM2, a DAP12-associated receptor, regulates osteoclast differentiation and function. Journal of bone and mineral research: the official journal of the American Society for Bone and Mineral Research. 2006;21:237-45
13. Yao H, Coppola K, Schweig JE, Crawford F, Mullan M, Paris D. Distinct Signaling Pathways Regulate TREM2 Phagocytic and NFkappaB Antagonistic Activities. Front Cell Neurosci. 2019;13:457
14. Konishi H, Kiyama H. Microglial TREM2/DAP12 Signaling: A Double-Edged Sword in Neural Diseases. Front Cell Neurosci. 2018;12:206
15. Zhang H, Sheng L, Tao J, Chen R, Li Y, Sun Z. et al. Depletion of the triggering receptor expressed on myeloid cells 2 inhibits progression of renal cell carcinoma via regulating related protein expression and PTEN-PI3K/Akt pathway. Int J Oncol. 2016;49:2498-506
16. Ye Y, Song Y, Zhuang J, Wang G, Ni J, Xia W. Anticancer effects of echinacoside in hepatocellular carcinoma mouse model and HepG2 cells. J Cell Physiol. 2019;234:1880-8
17. Kim SM, Kim EM, Ji KY, Lee HY, Yee SM, Woo SM. et al. TREM2 Acts as a Tumor Suppressor in Colorectal Carcinoma through Wnt1/beta-catenin and Erk Signaling. Cancers (Basel). 2019;11:1315
18. Yao Y, Li H, Chen J, Xu W, Yang G, Bao Z. et al. TREM-2 serves as a negative immune regulator through Syk pathway in an IL-10 dependent manner in lung cancer. Oncotarget. 2016;7:29620-34
19. Wang XQ, Tao BB, Li B, Wang XH, Zhang WC, Wan L. et al. Overexpression of TREM2 enhances glioma cell proliferation and invasion: a therapeutic target in human glioma. Oncotarget. 2016;7:2354-66
20. Tang W, Lv B, Yang B, Chen Y, Yuan F, Ma L. et al. TREM2 acts as a tumor suppressor in hepatocellular carcinoma by targeting the PI3K/Akt/beta-catenin pathway. Oncogenesis. 2019;8:9
21. Smyth GK. Linear models and empirical bayes methods for assessing differential expression in microarray experiments. Stat Appl Genet Mol Biol. 2004;3:Article3
22. Pathan M, Keerthikumar S, Chisanga D, Alessandro R, Ang CS, Askenase P. et al. A novel community driven software for functional enrichment analysis of extracellular vesicles data. J Extracell Vesicles. 2017;6:13214-55
23. Szklarczyk D, Franceschini A, Wyder S, Forslund K, Heller D, Huerta-Cepas J. et al. STRING v10: protein-protein interaction networks, integrated over the tree of life. Nucleic Acids Res. 2015;43:D447-52
24. Bader GD, Hogue CW. An automated method for finding molecular complexes in large protein interaction networks. BMC Bioinformatics. 2003;4:2
25. Zhao SF, Yin XJ, Zhao WJ, Liu LC, Wang ZP. Biglycan as a potential diagnostic and prognostic biomarker in multiple human cancers. Oncol Lett. 2020;19:1673-82
26. You X, Ma M, Hou G, Hu Y, Shi X. Gene expression and prognosis of NOX family members in gastric cancer. Onco Targets Ther. 2018;11:3065-74
27. Wang C, Li X, Zhang J, Ge Z, Chen H, Hu J. EZH2 contributes to 5-FU resistance in gastric cancer by epigenetically suppressing FBXO32 expression. Onco Targets Ther. 2018;11:7853-64
28. Matsumoto Y, Saito M, Saito K, Kanke Y, Watanabe Y, Onozawa H. et al. Enhanced expression of KIF4A in colorectal cancer is associated with lymph node metastasis. Oncol Lett. 2018;15:2188-94
29. Hu L, Zang MD, Wang HX, Li JF, Su LP, Yan M. et al. Biglycan stimulates VEGF expression in endothelial cells by activating the TLR signaling pathway. Mol Oncol. 2016;10:1473-84
30. Wang L, Yang M, Shan L, Qi L, Chai C, Zhou Q. et al. The role of SPARC protein expression in the progress of gastric cancer. Pathol Oncol Res. 2012;18:697-702
31. Lavery DN, Villaronga MA, Walker MM, Patel A, Belandia B, Bevan CL. Repression of androgen receptor activity by HEYL, a third member of the Hairy/Enhancer-of-split-related family of Notch effectors. The Journal of biological chemistry. 2011;286:17796-808
32. Song SZ, Lin S, Liu JN, Zhang MB, Du YT, Zhang DD. et al. Targeting of SPP1 by microRNA-340 inhibits gastric cancer cell epithelial-mesenchymal transition through inhibition of the PI3K/AKT signaling pathway. J Cell Physiol. 2019;234:18587-601
33. Ding X, Huang R, Zhong Y, Cui N, Wang Y, Weng J. et al. CTHRC1 promotes gastric cancer metastasis via HIF-1α/CXCR4 signaling pathway. Biomed Pharmacother. 2020;123:109742
34. Lee KW, Lee SS, Hwang JE, Jang HJ, Lee HS, Oh SC. et al. Development and Validation of a Six-Gene Recurrence Risk Score Assay for Gastric Cancer. Clin Cancer Res. 2016;22:6228-35
35. Peduk S, Tatar C, Dincer M, Ozer B, Kocakusak A, Citlak G. et al. The Role of Serum CK18, TIMP1, and MMP-9 Levels in Predicting R0 Resection in Patients with Gastric Cancer. Disease markers. 2018;2018:5604702
36. Wang YY, Li L, Zhao ZS, Wang HJ. Clinical utility of measuring expression levels of KAP1, TIMP1 and STC2 in peripheral blood of patients with gastric cancer. World journal of surgical oncology. 2013;11:81
37. Chen Y, Wei X, Guo C, Jin H, Han Z, Han Y. et al. Runx3 suppresses gastric cancer metastasis through inactivation of MMP9 by upregulation of TIMP-1. Int J Cancer. 2011;129:1586-98
38. Peng DF, Hu TL, Schneider BG, Chen Z, Xu ZK, El-Rifai W. Silencing of glutathione peroxidase 3 through DNA hypermethylation is associated with lymph node metastasis in gastric carcinomas. PLoS One. 2012;7:e46214
39. Cai M, Sikong Y, Wang Q, Zhu S, Pang F, Cui X. Gpx3 prevents migration and invasion in gastric cancer by targeting NFкB/Wnt5a/JNK signaling. International journal of clinical and experimental pathology. 2019;12:1194-203
40. Yan P, He Y, Xie K, Kong S, Zhao W. In silico analyses for potential key genes associated with gastric cancer. PeerJ. 2018;6:e6092
41. Meng XY, Shi MJ, Zeng ZH, Chen C, Liu TZ, Wu QJ. et al. The Role of COL5A2 in Patients With Muscle-Invasive Bladder Cancer: A Bioinformatics Analysis of Public Datasets Involving 787 Subjects and 29 Cell Lines. Front Oncol. 2018;8:659
42. Shi Y, Duan Z, Zhang X, Zhang X, Wang G, Li F. Down-regulation of the let-7i facilitates gastric cancer invasion and metastasis by targeting COL1A1. Protein Cell. 2019;10:143-8
43. Liu Y, Zhu J, Ma X, Han S, Xiao D, Jia Y. et al. ceRNA network construction and comparison of gastric cancer with or without Helicobacter pylori infection. J Cell Physiol. 2019;234:7128-40
44. Wang Y. Transcriptional Regulatory Network Analysis for Gastric Cancer Based on mRNA Microarray. Pathol Oncol Res. 2017;23:785-91
45. Li F, Wang NN, Chang X, Wang SL, Wang LS, Yao J. et al. Bioinformatics analysis suggests that COL4A1 may play an important role in gastric carcinoma recurrence. J Dig Dis. 2019;20:391-400
46. Huang R, Gu W, Sun B, Gao L. Identification of COL4A1 as a potential gene conferring trastuzumab resistance in gastric cancer based on bioinformatics analysis. Mol Med Rep. 2018;17:6387-96
47. Zhang X, Wang W, Li P, Wang X, Ni K. High TREM2 expression correlates with poor prognosis in gastric cancer. Hum Pathol. 2018;72:91-9
48. Piazuelo MB, Riechelmann RP, Wilson KT, Algood HMS. Resolution of Gastric Cancer-Promoting Inflammation: A Novel Strategy for Anti-cancer Therapy. Curr Top Microbiol Immunol. 2019;421:319-59
49. Brabletz T, Kalluri R, Nieto MA, Weinberg RA. EMT in cancer. Nat Rev Cancer. 2018;18:128-34
50. Nieto MA, Huang RY, Jackson RA, Thiery JP. Emt: 2016. Cell. 2016;166:21-45
51. Pastushenko I, Blanpain C. EMT Transition States during Tumor Progression and Metastasis. Trends Cell Biol. 2019;29:212-26
52. Wang Y, Liang Y, Yang G, Lan Y, Han J, Wang J. et al. Tetraspanin 1 promotes epithelial-to-mesenchymal transition and metastasis of cholangiocarcinoma via PI3K/AKT signaling. J Exp Clin Cancer Res. 2018;37:300
53. Zhou Y, Shurin GV, Zhong H, Bunimovich YL, Han B, Shurin MR. Schwann Cells Augment Cell Spreading and Metastasis of Lung Cancer. Cancer Res. 2018;78:5927-39
54. Huang JL, Cao SW, Ou QS, Yang B, Zheng SH, Tang J. et al. The long non-coding RNA PTTG3P promotes cell growth and metastasis via up-regulating PTTG1 and activating PI3K/AKT signaling in hepatocellular carcinoma. Mol Cancer. 2018;17:93
55. Alfarouk KO, Bashir AHH, Aljarbou AN, Ramadan AM, Muddathir AK, AlHoufie STS. et al. The Possible Role of Helicobacter pylori in Gastric Cancer and Its Management. Front Oncol. 2019;9:75
56. Wessler S, Krisch LM, Elmer DP, Aberger F. From inflammation to gastric cancer - the importance of Hedgehog/GLI signaling in Helicobacter pylori-induced chronic inflammatory and neoplastic diseases. Cell Commun Signal. 2017;15:15
57. Li Y, Wang HC, Wang JS, Sun B, Li LP. Chemokine receptor 4 expression is correlated with the occurrence and prognosis of gastric cancer. FEBS open bio. 2020;10:1149-61
58. Cai WY, Lin LY, Wang L, Yang L, Ye GD, Zeng Q. et al. Inhibition of Bcl6b promotes gastric cancer by amplifying inflammation in mice. Cell Commun Signal. 2019;17:72
59. Slomiany BL, Slomiany A. Syk: a new target for attenuation of Helicobacter pylori-induced gastric mucosal inflammatory responses. Inflammopharmacology. 2019;27:203-11
60. Nakashima H, Natsugoe S, Ishigami S, Okumura H, Matsumoto M, Hokita S. et al. Clinical significance of nuclear expression of spleen tyrosine kinase (Syk) in gastric cancer. Cancer Lett. 2006;236:89-94
Author contact
![]() Corresponding author: Dr. Yong-Ning Zhou, Department of Gastroenterology, Key Laboratory for Gastrointestinal Diseases of Gansu Province, The First Hospital of Lanzhou University, Lanzhou, China; Tel.: +86-931-835 6872; E-mail: zhouynedu.cn.
Corresponding author: Dr. Yong-Ning Zhou, Department of Gastroenterology, Key Laboratory for Gastrointestinal Diseases of Gansu Province, The First Hospital of Lanzhou University, Lanzhou, China; Tel.: +86-931-835 6872; E-mail: zhouynedu.cn.