Impact Factor ISSN: 1837-9664

 Global reach, higher impact
J Cancer 2021; 12(11):3239-3248. doi:10.7150/jca.51591 This issue Cite
Research Paper
Increased Expression of KNSTRN in Lung Adenocarcinoma Predicts Poor Prognosis: A Bioinformatics Analysis Based on TCGA Data
Pengbo Deng1,2,3, Rongrong Zhou4, Jinghui Zhang1,2,3, Liming Cao1,2,3 ![]()
1. Department of Respiratory Medicine, National Key Clinical Specialty, Branch of National Clinical Research Center for Respiratory Disease, Xiangya Hospital, Central South University, Changsha, China.
2. Hunan Provincial Clinical Research Center for Respiratory Diseases, Changsha, China.
3. Xiangya Hospital, Central South University, Changsha, China.
4. National Clinical Research Center for Geriatric Disorders, Xiangya Hospital, Central South University, Changsha, China.
5. Department of Radiation Oncology, Xiangya Hospital, Central South University, Changsha, China.
Received 2020-8-6; Accepted 2021-3-3; Published 2021-4-2
Abstract

Purpose: Available evidence indicates that kinetochore-localized astrin/SPAG5-binding protein (KNSTRN) is an oncogene in skin carcinoma. This study aimed to evaluate the prognostic value of KNSTRN in lung adenocarcinoma (LUAD) underlying the Cancer Genome Atlas (TCGA) database.
Methods: The relationship between clinicopathological features and KNSTRN was analyzed with the Wilcoxon signed-rank test and logistic regression. The clinicopathological characteristics associated with overall survival (OS) were evaluated using Cox regression and the Kaplan-Meier method. Gene ontology (GO) analysis, gene set enrichment analysis (GSEA), and single-sample GSEA (ssGSEA) were performed using TCGA data.
Results: The KNSTRN expression level was found to be significantly higher in LUAD tissue than in normal lung tissue. Also, it correlated significantly with advanced clinicopathological characteristics. The Kaplan-Meier survival curve revealed a significant relationship of high expression of KNSTRN with poor OS in patients with LUAD. The multivariate Cox regression hazard model demonstrated the KNSTRN expression level as an independent prognostic factor for patients with LUAD. GO and GSEA analyses indicated the involvement of KNSTRN in cell cycle checkpoints, DNA replication, and G2-M checkpoint M phase. Based on ssGSEA analysis, KNSTRN had a positive relationship with Th2 cells and CD56dim natural killer cells. The KNSTRN expression levels in several types of immune cells were significantly different.
Conclusion: The findings suggested that the increased expression level of KNSTRN was significantly associated with the progression of LUAD and could also serve as a novel prognostic biomarker for patients with LUAD.
Keywords: Bioinformatics analysis, lung adenocarcinoma, kinetochore-localized astrin/SPAG5-binding protein (KNSTRN), prognosis, the Cancer Genome Atlas (TCGA).
Introduction
Lung cancer is still the leading cause of cancer-related death in both men and women worldwide [1]. Lung adenocarcinoma (LUAD) is the most common subtype of lung cancer leading to more than 1 million deaths annually across the world [2]. Although the treatment of LUAD has significantly improved over the past decades with the development and progress of new therapeutic methods, the 5-year survival rate for patients with LUAD remains very low, approximately 5% [3]. This may be attributed to the difficulty in the early diagnosis and the lack of appropriate therapeutic approaches for LUAD. Thus, finding effective biomarkers of LUAD for early diagnosis and targeted therapy is crucial to increase the survival rate.
The kinetochore-localized astrin/SPAG5-binding protein (KNSTRN) gene, also known as a small kinetochore-associated protein gene [4], which encodes for a kinetochore-associated protein, is found to promote the metaphase-to-anaphase transition and chromosome segregation during mitosis [4]. It is also believed to be closely related to tumorigenesis in the skin. A genomic study by Lee et al. identified recurrent somatic mutations of KNSTRN in 19% of cutaneous squamous cell carcinoma (SCC) [5]. Among the detected mutations of KNSTRN, more than half of them mapped to a 17-amino-acid N-terminal region, with a “hotspot” serine-to-phenylalanine substitution present at codon 24 (p.Ser24Phe). In addition, KNSTRN mutations were found in 23 of 490 (4.7%) melanomas, and the p.Ser24Phe mutation was found in 19% actinic keratosis (AKs) [5]. Thus, a mutated KNSTRN gene, especially the p.Ser24Phe mutation, might functionally lead to disrupted chromatid cohesion in normal cells and correlated with increased aneuploidy in primary tumors and enhanced SCC development in vivo [5]. Additionally, Schmitz et al. recently reported that another recurrent somatic mutation “p.Ala40Glu” in the KNSTRN gene was associated with basal proliferative AK lesions and invasive carcinoma [6]. Moreover, in a recent study on endometrial cancer, it was found that the expression of KNSTRN was positively correlated with AKT1, and high expression of KNSTRN was significantly associated with poor prognosis of endometrial cancer. And as is well-known, the PI3K/AKT/mTOR pathway can promote the proliferation of endometrial cancer cells [7]. Therefore, based on the above findings, it is possible to speculate that genetic alternations of KNSTRN, the essential molecular for cell-cycle progression, may be related to the proliferation of cancer cells. Recent studies also found that altered KNSTRN expression resulted in the loss of chromatid cohesion in the noncutaneous tumor cell line HeLa cells. These data suggested a possibility that aberrant KNSTRN expression might exist in other tissues as well as in the skin, and played an important role in tumorigenesis.
Researches have indicated that sustaining cell proliferation is one of the basic traits of lung cancer [8, 9]. Dysregulation of signaling pathways involved in cell proliferation, including PI3K/AKT/mTOR, have also been observed in lung cancer [9]. And in our pre-analysis using the RNA sequencing data of LUAD patients in TCGA database, we found several differentially expressed genes including KNSTRN. However, the role of KNSTRN in LUAD tumorigenesis and the potential molecules or pathways involved need to been clarified.
Thus, the objective of the present study was to evaluate the prognostic value of KNSTRN expression in human LUAD based on data obtained from the Cancer Genome Atlas (TCGA) database. To gain further insight into the potential functions, the biological pathways involved in LUAD pathogenesis-related KNSTRN regulatory network, Gene Ontology (GO) analysis and gene set enrichment analysis (GSEA) were performed. Moreover, the relationship of KNSTRN with tumor-infiltrating immune cells in different tumor microenvironments was analyzed using single-sample gene set enrichment analysis (ssGSEA).
Methods
RNA-sequencing data acquisition and processing
Clinical information of lung adenocarcinoma patients and high-throughput RNA-sequencing data were downloaded from the TCGA database (https://portal.gdc.cancer.gov). There was a total of 522 cases of lung adenocarcinoma. Eventually, 513 patients were enrolled into analysis due to eligibility of both clinical information as well as RNA-seq data. The transcript expression levels were estimated using the fragments per kilobase per million fragments mapped (FPKM) method in HTSeq. Also, the RNA-Seq gene expression level 3 HTSeq-FPKM data of 513 patients with LUAD and clinical data were converted into transcripts per million (TPM) reads format for further analysis.
Differential expression analysis
According to the median value normalized by the Z-score, tumors were divided into high- and low-KNSTRN expression groups, and differentially expressed genes were analyzed by HTSeq-Counts using the DESeq2 package [10]. The log fold change (logFC) > 2 and the adjusted P value < 0.01 were set as the thresholds for a statistical difference. The differential analysis results were displayed using volcano plots and heat maps.
Enrichment analysis
The Metascape (http://metascape.org) [11] database was used for the GO enrichment analysis of KNSTRN and its list of differentially expressed molecules, including biological processes, molecular functions, and cellular components. The parameters were set at P < 0.01, minimum count > 3, and enrichment factor > 1.5. The GSEA [12] method enriched KNSTRN expression-related pathways and ranked the genome 1000 times per analysis. The C2.all.v6.2.symbols.gmt composition was used as the reference gene set. The threshold for statistically significant GSEA analysis was set to a corrected P < 0.05 and an FDR < 0.25. The results of the enrichment analysis were characterized using corrected P values and normalized enrichment scores (NESs). The Cluster Profiler package [13] was used for GSEA enrichment analysis and visualization.
Immune infiltration analysis
The marker genes of 24 different immune cell types were acquired from Bindea G's research [14]. The infiltration of 24 immune cell types in the tumor was analyzed using the ssGSEA method. The Spearman correlation method was used to analyze the degree of correlation between KNSTRN and the aforementioned 24 types of immune cells, and for the analysis of immune cell infiltration between KNSTRN high- and low-expression groups.
Statistical analysis
All statistical analyses were performed in R (v3.6.2). The Wilcoxon rank-sum test was used for unpaired samples, while the Wilcoxon signed-rank test was used for paired samples. The receiver operating characteristic (ROC) curve was used to analyze whether KNSTRN expression could be the diagnostic marker. Kruskal-Wallis test, Wilcoxon signed-rank test, and logistic regression method were used to analyze the relationship between clinicopathological characteristics and KNSTRN expression. The chi-square test or Fisher exact test was used to analyze the relationship between KNSTRN expression and clinicopathological characteristics. Cox hazard regression analysis or Kaplan-Meier method was used to evaluate the prognostic value of KNSTRN expression. In the Cox hazard regression analysis, variables with P < 0.1 in the univariate analysis were included in the multivariate Cox hazard regression. A statistically significant P value was set at 0.05. Due to the incomplete clinical information in the TCGA database, not every sample recorded clinical baseline information such as age, TNM stage, treatment outcome, and etc. Therefore, a complete analysis of each clinical category was not possible. So, there is a discrepancy between the total number of samples and the number of samples in different clinical categories in the tables of Results section.
Results
Relationship between KNSTRN expression and clinical characteristics
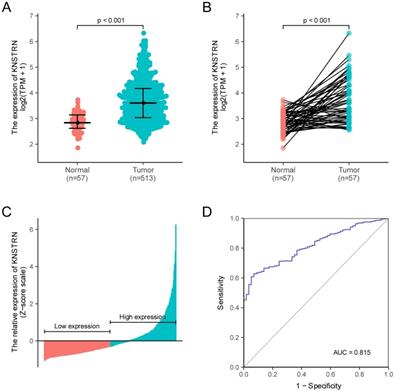
KNSTRN expression in LUAD and normal tissues was analyzed, revealing a difference in the KNSTRN expression levels in LUAD and normal tissues (Supplementary Fig. 1A, B and C); KNSTRN was highly expressed in tumor tissues (P < 0.001, Fig. 1A). At the same time, KNSTRN expression in LUAD tissues and paired adjacent nontumorous tissues were analyzed. The results also suggested that KNSTRN was highly expressed in tumor tissues (P < 0.001, Fig. 1B). KNSTRN expression in tumor tissues was standardized using the Z-score, and the LUAD cohort was divided into high- and low-expression groups according to KNSTRN expression (Fig. 1C). In addition, ROC curves were used to analyze the diagnostic value of KNSTRN. The area under the curve (AUC) of KNSTRN was 0.815, and the results suggested that KNSTRN might be a potential diagnostic biomarker (Fig. 1D).
Relationship between KNSTRN expression and lung adenocarcinoma (LUAD). (A) Differential expression analysis: Analysis of differences in the KNSTRN expression levels between tumor tissues and normal tissues. (B) Analysis of differential expression of KNSTRN between tumor tissues and matched paracancerous tissues. (C) KNSTRN expression status in all LUAD samples between low-expression and high-expression groups. (D) Diagnostic value of KNSTRN expression in LUAD. Analysis between two groups of unpaired samples: Wilcoxon rank-sum test; analysis between two groups of paired samples: Wilcoxon signed-rank test.
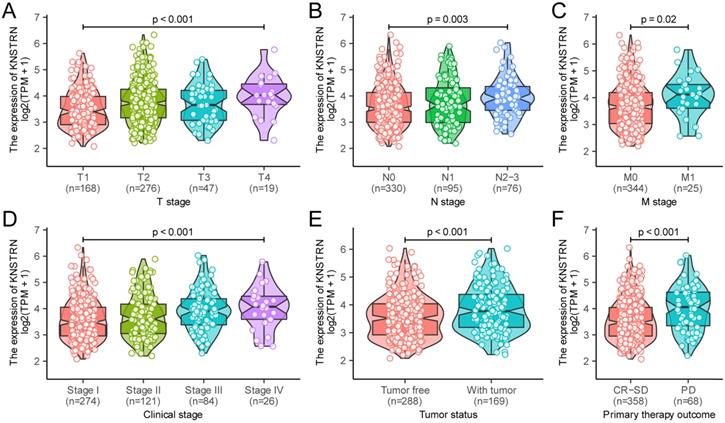
In addition, the Kruskal-Wallis test and Wilcoxon signed-rank test were used to analyze the relationship between KNSTRN expression and clinical characteristics. The increased expression levels of KNSTRN positively correlated with higher grades of T stage (P < 0.001, Fig. 2A), N stage (P = 0.003, Fig. 2B), M stage (P = 0.02, Fig. 2C), clinical stage (P < 0.001, Fig. 2D), tumor status (P < 0.001, Fig. 2E), and the outcome of the primary therapy (P = 0.003, Fig. 2F). At the same time, consistent results were also found using the chi-square test or Fisher exact test (Table 1). Moreover, the univariate logistic regression of KNSTRN expression also suggested a close relationship between KNSTRN and clinical characteristics., including T stage [odds ratio (OR) = 1.04 (1.02-1.07), P < 0.001], N stage [OR = 1.02 (1.01-1.04), P = 0.010], clinical stage [OR = 1.03 (1.01-1.05), P = 0.003)], tumor status [OR = 1.03 (1.01-1.05), P = 0.002], outcome of the primary therapy [OR = 1.04 (1.02-1.07), P < 0.001], and TP53 mutation [OR = 1.04 (1.02-1.06), P < 0.001] (Table 2). No significant difference was found in the relationship with M stage [OR = 1.02 (0.99-1.05), P = 0.099]. These results suggested that KNSTRN expression was related to clinical characteristics.
Relationship between KNSTRN expression and clinicopathological characteristics. Relationship of KNSTRN expression with T stage (A), N stage (B), M stage (C), clinical stage (D), tumor status (E), and primary therapy outcome (F). Analysis between two groups: Wilcoxon rank-sum test; analysis between multiple groups: Kruskal-Wallis rank-sum test.
Relationship between KNSTRN expression and clinicopathological characteristics in patients with lung adenocarcinoma.
| Characters | level | Low expression of KNSTRN | High expression of KNSTRN | p | test |
|---|---|---|---|---|---|
| n | 256 | 257 | |||
| OS event (%) | Alive | 180 (70.3) | 146 (56.8) | 0.002 | |
| Dead | 76 (29.7) | 111 (43.2) | |||
| T stage (%) | T1 | 104 (40.6) | 64 (24.9) | <0.001 | exact |
| T2 | 125 (48.8) | 151 (58.8) | |||
| T3 | 21 (8.2) | 26 (10.1) | |||
| T4 | 4 (1.6) | 15 (5.8) | |||
| NA | 2 (0.8) | 1 (0.4) | |||
| N stage (%) | N0 | 179 (69.9) | 151 (58.8) | 0.002 | exact |
| N1 | 45 (17.6) | 50 (19.4) | |||
| N2 | 23 (9.0) | 51 (19.8) | |||
| N3 | 1 (0.4) | 1 (0.4) | |||
| NA | 8 (3.1) | 4 (1.6) | |||
| M stage (%) | M0 | 164 (64.1) | 180 (70.0) | 0.090 | |
| M1 | 7 (2.7) | 18 (7.0) | |||
| NA | 85 (33.2) | 59 (23.0) | |||
| Clinical stage (%) | Stage I | 156 (60.9) | 118 (45.9) | <0.001 | |
| Stage II | 60 (23.4) | 61 (23.7) | |||
| Stage III | 27 (10.6) | 57 (22.2) | |||
| Stage IV | 8 (3.1) | 18 (7.0) | |||
| NA | 5 (2.0) | 3 (1.2) | |||
| Tumor status (%) | Tumor free | 157 (61.3) | 131 (51.0) | 0.080 | |
| With tumor | 77 (30.1) | 92 (35.8) | |||
| NA | 22 (8.6) | 34 (13.2) | |||
| Primary therapy outcome (%) | PD | 23 (9.0) | 45 (17.5) | 0.003 | exact |
| SD | 23 (9.0) | 14 (5.4) | |||
| PR | 4 (1.6) | 2 (0.8) | |||
| CR | 177 (69.1) | 138 (53.7) | |||
| NA | 29 (11.3) | 58 (22.6) | |||
| Age (%) | < 65 | 98 (38.3) | 122 (47.4) | 0.025 | |
| >= 65 | 151 (59.0) | 123 (47.9) | |||
| NA | 7 (2.7) | 12 (4.7) | |||
| Gender (%) | Female | 158 (61.7) | 118 (45.9) | <0.001 | |
| Male | 98 (38.3) | 139 (54.1) | |||
| Anatomic subdivision (%) | Left | 107 (41.8) | 92 (35.8) | 0.257 | |
| Right | 144 (56.2) | 155 (60.3) | |||
| NA | 5 (2.0) | 10 (3.9) | |||
| Smoking status (%) | Non-smoker | 46 (18.0) | 28 (10.9) | 0.028 | |
| Smoker | 202 (78.9) | 223 (86.8) | |||
| NA | 8 (3.1) | 6 (2.3) | |||
| TP53 mutation (%) | No | 165 (64.4) | 102 (39.7) | <0.001 | |
| Yes | 89 (34.8) | 152 (59.1) | |||
| NA | 2 (0.8) | 3 (1.2) |
OS: Overall Survival; NA: Not Available
Logistic regression analysis of KNSTRN expression.
| Characteristics | Total (N) | Odds ratio in KNSTRN expression | P value |
|---|---|---|---|
| T stage (T1 vs. T2-4) | 510 | 1.04 (1.02-1.07) | <0.001 |
| N stage (N0 vs. N1-3) | 501 | 1.02 (1.01-1.04) | 0.01 |
| M stage (M0 vs. M1) | 369 | 1.02 (0.99-1.05) | 0.099 |
| Clinical stage (Stage I vs. Stage II-IV) | 505 | 1.03 (1.01-1.05) | 0.003 |
| Tumor status (Tumor free vs. With tumor) | 457 | 1.03 (1.01-1.05) | 0.002 |
| Primary therapy outcome (CR-SD vs. PD) | 426 | 1.04 (1.02-1.07) | <0.001 |
| Anatomic subdivision (Left vs. Right) | 498 | 1.01 (0.99-1.02) | 0.547 |
| TP53 mutation (No vs. Yes) | 508 | 1.04 (1.02-1.06) | <0.001 |
Prognostic value of KNSTRN expression in LUAD
The relationships of KNSTRN expression with prognostic outcomes in overall survival (OS), progression-free survival (PFS), and disease-specific survival (DSS) are shown in Figure 3A-3C. High expression of KNSTRN was associated with poor OS [hazard ratio (HR) = 1.730 (1.288-2.324), P < 0.001, Fig. 3A (and Supplementary Fig. 1D, E and F)], poor PFS [HR = 1.397 (1.062-1.838), P = 0.017, Fig. 3B], and poor DSS [HR = 1.967 (1.345-2.875), P < 0.001, Fig. 3C]. At the same time, this study also showed the distribution of high expression and low expression of KNSTRN with respect to OS and risk score (Fig. 3D). The results suggested that patients with LUAD and high-risk scores had high expression levels of KNSTRN, while patients with low-risk scores were associated with low expression levels of KNSTRN.
Prognostic analysis of KSTRN expression. Patients with high expression level of KNSTRN had poor prognosis compared with those with low expression level of KNSTRN, including overall Survival (OS) (A), progression-free interval (PFS) (B), and disease-specific survival (DSS) (C) (both log-rank P < 0.001). (D) Risk factors for OS of KNSTRN expression. (E) Prognosis of KNSTRN expression in subgroups of clinical characteristics (OS). (F) Multivariate analysis nomogram based on the clinical characteristics of KNSTRN expression. (G) Calibration chart shows the predictive performance of the model constructed using multifactor Cox regression analysis.
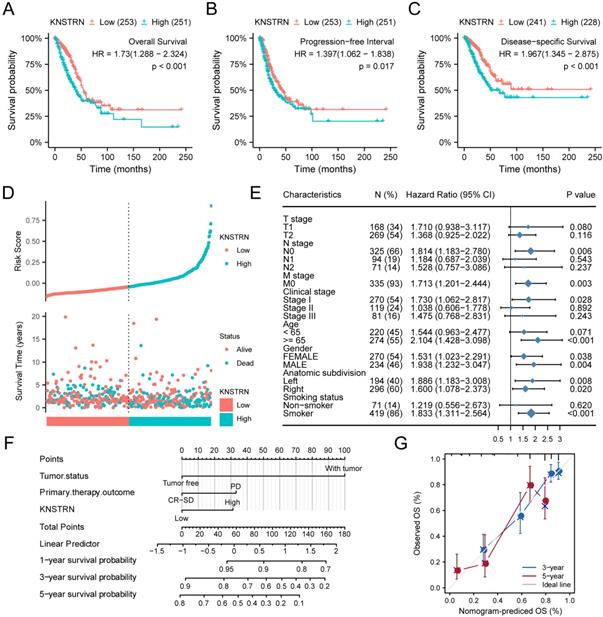
In addition, this study analyzed the relationship between KNSTRN expression and different subgroups. KNSTRN was found to be highly expressed in N0 stage [HR = 1.814 (1.183-2.780), P = 0.006], M0 stage [HR = 1.713 (1.201-2.444), P = 0.003], stage I [HR = 1.730 (1.062-2.817), P = 0.028], age >65 years [HR = 2.104 (1.428-3.098), P < 0.001], and smokers [HR = 1.833 (1.311-2.564), P < 0.001]; high expression of KNSTRN was related to poor OS (Table 3 and Fig. 3E).
Prognostic analysis of KNSTRN expression in a subset of patients with LUAD.
| Characteristics | N (%) | Hazard ratio | P value |
|---|---|---|---|
| T stage | |||
| T1 | 168 (34) | 1.710 (0.938-3.117) | 0.080 |
| T2 | 269 (54) | 1.368 (0.925-2.022) | 0.116 |
| T3 | 45 (9) | 2.930 (1.166-7.363) | 0.022 |
| N stage | |||
| N0 | 325 (66) | 1.814 (1.183-2.780) | 0.006 |
| N1 | 94 (19) | 1.184 (0.687-2.039) | 0.543 |
| N2 | 71 (14) | 1.528 (0.757-3.086) | 0.237 |
| M stage | |||
| M0 | 335 (93) | 1.713 (1.201-2.444) | 0.003 |
| Clinical stage | |||
| Stage I | 270 (54) | 1.730 (1.062-2.817) | 0.028 |
| Stage II | 119 (24) | 1.038 (0.606-1.778) | 0.892 |
| Stage III | 81 (16) | 1.475 (0.768-2.831) | 0.243 |
| Age | |||
| < 65 | 220 (45) | 1.544 (0.963-2.477) | 0.071 |
| >= 65 | 274 (55) | 2.104 (1.428-3.098) | <0.001 |
| Gender | |||
| Female | 270 (54) | 1.531 (1.023-2.291) | 0.038 |
| Male | 234 (46) | 1.938 (1.232-3.047) | 0.004 |
| Anatomic subdivision | |||
| Left | 194 (40) | 1.886 (1.183-3.008) | 0.008 |
| Right | 296 (60) | 1.600 (1.078-2.373) | 0.020 |
| Smoking status | |||
| Non-smoker | 71 (14) | 1.219 (0.556-2.673) | 0.620 |
| Smoker | 419 (86) | 1.833 (1.311-2.564) | <0.001 |
Moreover, univariate Cox regression was also performed, and the results suggested that TNM stage, clinical stage, tumor status, primary therapy outcome, and high expression of KNSTRN were associated with poor OS (P < 0.05). Moreover, high expression of KNSTRN was an independent prognostic factor for OS [HR = 1.730 (1.288-2.234), P < 0.001, Table 4] as revealed by multivariate Cox hazard regression analysis. Tumor status, primary therapy outcome, and KNSTRN expression were used to construct a clinical prognostic risk score for LUAD (Fig. 3F). At the same time, the prediction accuracy of the model was assessed using a calibration chart (Fig. 3G). The results suggested that the KNSTRN expression level could better predict the 3-year and 5-year survival of patients. In general, all these results suggested that the KNSTRN expression level correlated with the prognosis of patients with LUAD.
Univariate and multivariate Cox proportional hazard analyses of KNSTRN expression.
| Characteristics | Univariate analysis | Multivariate analysis | ||
|---|---|---|---|---|
| HR (95% CI) | P value | HR (95% CI) | P value | |
| T stage (T1 vs. T2-4) | 1.668 (1.184-2.349) | 0.003 | 1.096 (0.641-1.874) | 0.739 |
| N stage (N0 vs. N1-3) | 2.606 (1.939-3.503) | <0.001 | 1.495 (0.739-3.026) | 0.263 |
| M stage (M0 vs. M1) | 2.111 (1.232-3.616) | 0.007 | 0.92 (0.394-2.15) | 0.848 |
| Clinical stage (Stage I vs. Stage II-IV) | 2.975 (2.188-4.045) | <0.001 | 1.033 (0.477-2.24) | 0.934 |
| Tumor status (Tumor free vs. With tumor) | 6.215 (4.261-9.064) | <0.001 | 5.483 (3.244-9.266) | <0.001 |
| Primary therapy outcome (CR-SD vs. PD) | 3.978 (2.785-5.682) | <0.001 | 2.478 (1.536-3.997) | <0.001 |
| Age (< 65 vs. >= 65) | 1.172 (0.871-1.578) | 0.295 | ||
| Gender (Female vs. Male) | 1.06 (0.792-1.418) | 0.694 | ||
| Anatomic subdivision (Left vs. Right) | 1.024 (0.758-1.383) | 0.878 | ||
| Smoking status (Non-smoker vs. Smoker) | 0.887 (0.587-1.339) | 0.568 | ||
| KNSTRN (Low vs. High) | 1.73 (1.288-2.324) | <0.001 | 1.563 (1.014-2.409) | 0.043 |
Relationship between KNSTRN expression and whole gene expression profile
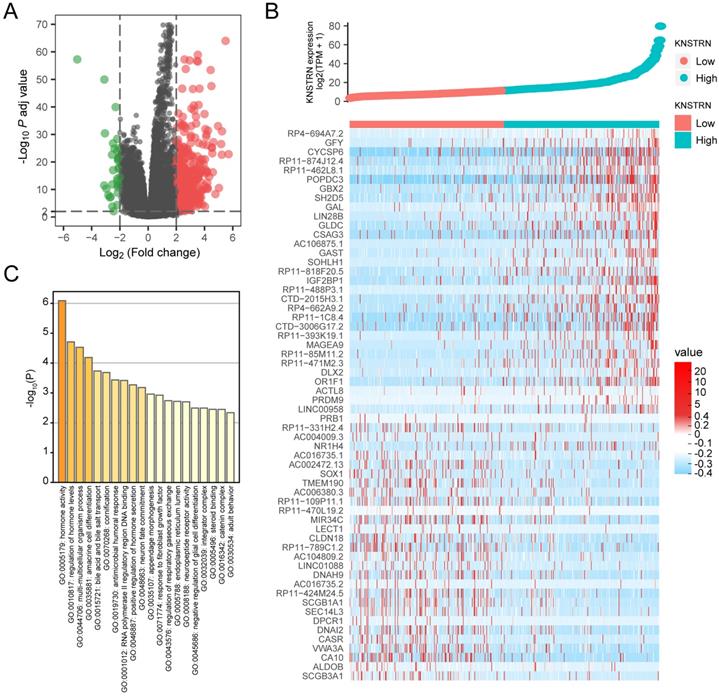
The gene expression profiling analysis related to KNSTRN was performed to further explore the biological function of KNSTRN in LUAD. A total of 34 downregulated genes and 486 upregulated genes were considered to be significantly associated with KNSTRN expression (logFC > 2 and Padj < 0.01) (Fig. 4A). Further, the top 30 upregulated genes and top 30 downregulated genes among these abnormally expressed genes were shown in the gene expression heat map (Fig. 4B). In addition, based on KNSTRN expression, GO enrichment analysis was performed using Metascape. The biological functions of the KNSTRN gene are associated mainly with hormone activity, regulation of hormone levels, multi-multicellular organism process, and so forth (Fig. 4C).
Differential expression analysis and GO enrichment analysis related to KSTRN gene expression. (A) Volcanic plot of differentially expressed based on KSTRN expression status. (B) Heat map showing 30 upregulated and downregulated genes, selected based on KSTRN expression status. (C) Metascape database was used to analyze the GO enrichment results of differentially expressed genes screened based on KSTRN expression.
GSEA analysis of KNSTRN expression
GSEA analysis of the TCGA gene expression data was used to identify functional and biological pathways between low and high expression of KNSTRN. Based on the normalized enrichment scores (NESs), the enrichment signaling pathway most significant in terms of KNSTRN gene expression was selected (Fig. 5 and Table 5). GSEA analysis results showed that the highly expressed KNSTRN phenotype was concentrated mainly in cell cycle checkpoints (A), DNA replication (B), cell cycle (C), mitotic spindle checkpoint (D), G2-M checkpoint 9 (E), and M phase (F).
GSEA enrichment analysis results. GSEA results showed that cell cycle checkpoints (A), DNA replication (B), cell cycle (C), mitotic spindle checkpoint (D), G2-M checkpoint 9 (E), and M phase (F) were enriched mainly in KSTRN-related LUAD. ES, Enrichment score; FDR, false discovery rate; NES, normalized ES.
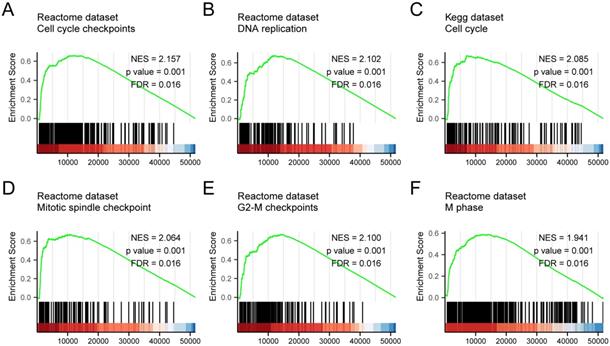
GSEA enrichment analysis results.
| ID | Set Size | Enrichment Score | NES | P value | P adjust | FDR | Rank | Leading_edge |
|---|---|---|---|---|---|---|---|---|
| REACTOME M PHASE | 352 | 0.590 | 1.941 | 0.001 | 0.020 | 0.016 | 14014 | tags=56%, list=27%, signal=41% |
| REACTOME CELL CYCLE CHECKPOINTS | 263 | 0.660 | 2.157 | 0.001 | 0.020 | 0.016 | 10642 | tags=55%, list=21%, signal=44% |
| REACTOME G2 M CHECKPOINTS | 145 | 0.668 | 2.100 | 0.001 | 0.020 | 0.016 | 14627 | tags=75%, list=28%, signal=54% |
| REACTOME DNA REPLICATION | 125 | 0.679 | 2.102 | 0.001 | 0.020 | 0.016 | 11562 | tags=67%, list=22%, signal=52% |
| KEGG CELL CYCLE | 124 | 0.675 | 2.085 | 0.001 | 0.020 | 0.016 | 7088 | tags=44%, list=14%, signal=38% |
| REACTOME MITOTIC SPINDLE CHECKPOINT | 106 | 0.674 | 2.064 | 0.001 | 0.020 | 0.016 | 10642 | tags=55%, list=21%, signal=44% |
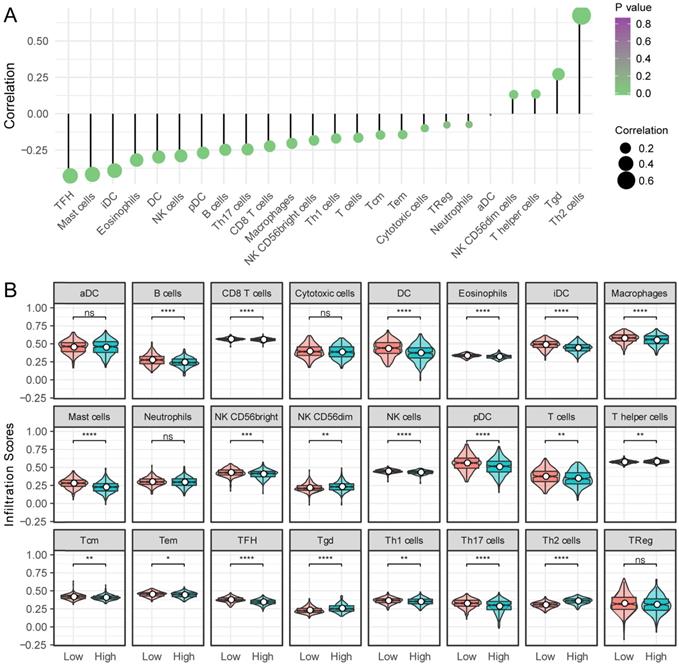
Relationship between KNSTRN expression and immune infiltration
Next, the relationship between KNSTRN expression and 24 different immune cell types was evaluated in LUAD. KNSTRN expression had a close positive relationship with T helper 2 (Th2) cells, Tgd, and NK CD56dim cells, and a close negative relationship with T follicular helper (TFH) cells, mast cells, immature dendritic cells (iDCs), and so forth (Fig. 6A). Further research showed significant differences in the KNSTRN expression level among the infiltrating immune cells, including B cells, CD8 T cells, eosinophils, macrophages, TFH, TH2 cells, NK cells, and so on (Fig. 6B).
Relationship between KSTRN expression and immune infiltration. (A) Relationship between KSTRN expression and immune cells. (B) Enrichment differences in different immune cell subpopulations in the high- and low-expression groups of KSTRN. Nonsignificant (ns) represents P ≥ 0.05; *represents P <0.05; **represents P <0.01; ***represents P <0.001; ****represents P <0.0001.
Discussion
LUAD is a highly malignant and heterogeneous disease with varied prognosis. Despite extensive studies on the biomarkers for lung cancer, research on the prognostic markers of LUAD were still limited [15]. Therefore, novel biomarkers with clinicopathological significance and prognostic value for LUAD needed to be urgently identified. In this study, bioinformatics analysis was conducted based on the data obtained from the TCGA database to study the significance, prognostic value, and hypothetical mechanism of KNSTRN in LUAD.
Previous studies showed that KNSTRN was a mitosis-associated protein that contributed to chromosome alignment, accurate chromosome segregation, and maintenance of spindle pole architecture [16-18]. The overexpression of KNSTRN could promote cell apoptosis after exposure to tumor necrosis factor alpha (TNF-α), TNF-related apoptosis-inducing ligand (TRAIL), staurosporine, and ultraviolet irradiation [19]. Furthermore, mutant KNSTRN was reported to be involved in the pathogenesis of basal cell carcinoma [20], endometrial cancer [21], and mucosal melanoma [22]. In addition, Lee et al. performed whole-exome sequencing on cutaneous SCC samples and patient-matched normal skin samples to investigate the genetic causes of cutaneous SCC [5]. The results showed that KNSTRN ranked third after CDKN2A and TP53 among frequently mutated genes in SCC, providing evidence that KNSTRN was a novel oncogene not reported earlier. Moreover, they searched TCGA database, suggesting that KNSTRN might also play a role in melanoma. However, the expression and role of KNSTRN in lung cancer were not reported. In the present study, bioinformatics analysis using high-throughput RNA-sequencing data from TCGA database demonstrated that KNSTRN was significantly highly expressed in LUAD tissues compared with paired normal tissues, indicating that KNSTRN played a role in tumorigenesis and progression. In addition, the ROC analysis showed that the AUC was 0.815 in the diagnosis of LUAD, suggesting that KNSTRN might be a potential diagnostic biomarker. Furthermore, high expression of KNSTRN positively correlated with advanced clinicopathological characteristics (TNM stage, clinical stage, tumor status, and primary therapy outcome), survival time, and poor prognosis. Additionally, the subgroup analysis indicated that KNSTRN expression could be used to stratify the prognosis of patients with stage I LUAD. It might also be useful when identifying stage I patients with undesirable prognoses and subsequently guiding their therapeutic regimen. KNSTRN was further validated as an independent prognostic factor for OS in multivariate analysis. In summary, KNSTRN overexpression was associated with cancer progression and poor prognosis in LUAD. It also found to be a diagnostic marker and might be used in the early screening of LUAD.
The genomic analysis of 2229 patients within 18 different tumor types, including lung squamous cell carcinomas, could not detect any somatic mutation of KNSTRN (p.Ser24Phe) [23]. However, other variations of KNSTRN, such as overexpression, might be involved in the development of cancer. With respect to the molecular mechanism involved, the STRING website (https://string-db.org/) was employed to predict the potential genes' interaction with KNSTRN. The corresponding protein-protein interaction (PPI) network of KNSTRN was constructed when we selected the interactions pertaining to Homo sapiens, chose physical network and showed minimum interactions with a medium confidence = 0.4 (Supplementary Fig. 1G). It was found that CENPE, CENPL, PRPF19, and KIF2B had the tendency to interact with KNSTRN, which were all involved in the mitosis. Interestingly, Huo et al. performed a multi-steps bioinformatics analysis in endometrial cancer, and the identified six hub genes, including KNSTRN, were in the PPI network with AKT1, and both higher expression of AKT1 and KNSTRN was significantly associated with poor prognosis of endometrial cancer [21]. In addition, GO enrichment analysis using Metascape in this study found that the biological functions of KNSTRN were associated mainly with hormone activity, regulation of hormone levels, and multi-multicellular organism process. To further investigate the functions of KNSTRN in LUAD, GSEA using TCGA data. The findings showed that cell cycle checkpoints, DNA replication, cell cycle, mitotic spindle checkpoint, G2-M checkpoint, and M phase are differentially enriched in the KNSTRN high-expression phenotype. These results were highly consistent with previous findings. However, the role of KNSTRN in these pathways needs to be further verified in LUAD, both in vitro and in vivo.
Another important aspect of this study was that KNSTRN expression correlated with diverse immune infiltration levels in LUAD. Numerous studies have demonstrated that the lung tumor microenvironment contributes to the immunological changes during the progression of lung cancer [24], and there are various known and unknown mechanisms involved in this process. Sharfe et al. recently reported that the dual loss of p110δ PI3-kinase and KNSTRN expression led to combined immunodeficiency and multisystem syndromic features [25]. This finding suggested that KNSTRN might play an important role in the immune system. Thus, the difference in immune cell infiltration between patients with high and low KNSTRN expression was compared in this study. The results based on ssGSEA analysis demonstrated a significantly positive relationship of the KNSTRN expression level with the infiltration level of Th2 cells, Tgd, and NK CD56dim cells, and a significantly negative relationship of the infiltration level of TFH cells, mast cells, and iDC with KNSTRN expression. Moreover, these relationships indicated the role of KNSTRN in regulating tumor immunology in LUAD. In addition, the results showed significant differences in the KNSTRN expression level in the immune cells, including B cells, CD8 T cells, T helper cells (Th1, Th2, TFH, and Th17), memory T cells (Tc and Tem), NK cells, DC (iDC and pDC), eosinophils, macrophages, neutrophils, and mast cells. Together these findings suggested that KNSTRN might play an important role in regulating immune functions in LUAD.
Since KNSTRN was recognized as an oncogene only recently, the present study was performed to investigate its relationship with different progression steps and gradings of LUAD. However, a limitation of this study was that only one dataset was included, and it was not validated in our own clinical samples. Thus, further experimental verifications are necessary to elucidate the biological functions of these predicted molecular mechanisms in LUAD to deepen our understanding of the direct impact of KNSTRN on LUAD. Moreover, the prognostic value of KNSTRN in LUAD also needs further verification.
In summary, the data showed aberrantly increased expression levels of KNSTRN in LUAD tissues compared with normal lung tissues. High expression of KNSTRN in patients with LUAD was significantly associated with advanced clinicopathological characteristics. Survival analyses indicated that high expression of KNSTRN could serve as an independent factor for poor survival in patients with LUAD. Furthermore, the KNSTRN high-expression phenotype was associated with cell cycle checkpoints, DNA replication, cell cycle, mitotic spindle checkpoint, G2-M checkpoint, and M phase, as revealed by GSEA putatively via physical interactions of CENPE, CENPL, PRPF19, and KIF2B. Taken together, the findings suggested that KNSTRN could be a novel prognostic biomarker for patients with LUAD. However, the mechanisms by which KNSTRN promotes tumor progression and metastases in LUAD need further elucidation.
Supplementary Material
Supplementary figure S1.
Acknowledgements
We thank Amoy Diagnostics Co., Ltd for their support in data analysis.
Data availability statement
The data of this manuscript can be downloading from The Cancer Genome Atlas database (https://portal.gdc.cancer.gov/).
Author contribution
Liming Cao conceived and designed the experiments; Rongrong Zhou, Jinghui Zhang, Jian An, Pengbo Deng analyzed the data; Liming Cao and Pengbo Deng wrote the paper. All authors read and approved the final manuscript.
Competing Interests
The authors have declared that no competing interest exists.
References
1. Siegel RL, Miller KD, Jemal A. Cancer statistics, 2020. CA Cancer J Clin. 2020;70:7-30
2. Cheng TY, Cramb SM, Baade PD, Youlden DR, Nwogu C, Reid ME. The International Epidemiology of Lung Cancer: Latest Trends, Disparities, and Tumor Characteristics. J Thorac Oncol. 2016;11:1653-71
3. Siegel RL, Miller KD, Jemal A. Cancer statistics, 2018. CA Cancer J Clin. 2018;68:7-30
4. Fang L, Seki A, Fang G. SKAP associates with kinetochores and promotes the metaphase-to-anaphase transition. Cell Cycle. 2009;8:2819-27
5. Lee CS, Bhaduri A, Mah A, Johnson WL, Ungewickell A, Aros CJ. et al. Recurrent point mutations in the kinetochore gene KNSTRN in cutaneous squamous cell carcinoma. Nat Genet. 2014;46:1060-2
6. Schmitz L, Grinblat B, Novak B, Hoeh AK, Handschke K, von Dobbeler C. et al. Somatic mutations in kinetochore gene KNSTRN are associated with basal proliferating actinic keratoses and cutaneous squamous cell carcinoma. J Eur Acad Dermatol Venereol. 2019;33:1535-40
7. Lee II, Kim JJ. Influence of AKT on progesterone action in endometrial diseases. Biology of reproduction. 2014;91:63
8. Stewart DJ. Wnt signaling pathway in non-small cell lung cancer. Journal of the National Cancer Institute. 2014;106:djt356
9. Papadimitrakopoulou V. Development of PI3K/AKT/mTOR pathway inhibitors and their application in personalized therapy for non-small-cell lung cancer. Journal of thoracic oncology: official publication of the International Association for the Study of Lung Cancer. 2012;7:1315-26
10. Love MI, Huber W, Anders S. Moderated estimation of fold change and dispersion for RNA-seq data with DESeq2. Genome Biol. 2014;15:550
11. Zhou Y, Zhou B, Pache L, Chang M, Khodabakhshi AH, Tanaseichuk O. et al. Metascape provides a biologist-oriented resource for the analysis of systems-level datasets. Nat Commun. 2019;10:1523
12. Subramanian A, Tamayo P, Mootha VK, Mukherjee S, Ebert BL, Gillette MA. et al. Gene set enrichment analysis: a knowledge-based approach for interpreting genome-wide expression profiles. Proc Natl Acad Sci U S A. 2005;102:15545-50
13. Yu G, Wang LG, Han Y, He QY. clusterProfiler: an R package for comparing biological themes among gene clusters. OMICS. 2012;16:284-7
14. Bindea G, Mlecnik B, Tosolini M, Kirilovsky A, Waldner M, Obenauf AC. et al. Spatiotemporal dynamics of intratumoral immune cells reveal the immune landscape in human cancer. Immunity. 2013;39:782-95
15. Wistuba II, Behrens C Lombardi F, Wagner S Fujimoto J, Raso MG et al. Validation of a proliferation-based expression signature as prognostic marker in early stage lung adenocarcinoma. Clinical cancer research: an official journal of the American Association for Cancer Research. 2013;19:6261-71
16. Dunsch AK, Linnane E, Barr FA, Gruneberg U. The astrin-kinastrin/SKAP complex localizes to microtubule plus ends and facilitates chromosome alignment. J Cell Biol. 2011;192:959-68
17. Huang Y, Wang W, Yao P, Wang X, Liu X, Zhuang X. et al. CENP-E kinesin interacts with SKAP protein to orchestrate accurate chromosome segregation in mitosis. J Biol Chem. 2012;287:1500-9
18. Wang X, Zhuang X, Cao D, Chu Y, Yao P, Liu W. et al. Mitotic regulator SKAP forms a link between kinetochore core complex KMN and dynamic spindle microtubules. J Biol Chem. 2012;287:39380-90
19. Lu S, Wang R, Cai C, Liang J, Xu L, Miao S. et al. Small kinetochore associated protein (SKAP) promotes UV-induced cell apoptosis through negatively regulating pre-mRNA processing factor 19 (Prp19). PLoS One. 2014;9:e92712
20. Jaju PD, Nguyen CB, Mah AM, Atwood SX, Li J, Zia A. et al. Mutations in the Kinetochore Gene KNSTRN in Basal Cell Carcinoma. J Invest Dermatol. 2015;135:3197-200
21. Huo X, Sun H, Liu Q, Ma X, Peng P, Yu M. et al. Clinical and Expression Significance of AKT1 by Co-expression Network Analysis in Endometrial Cancer. Front Oncol. 2019;9:1147
22. Wong K, van der Weyden L, Schott CR, Foote A, Constantino-Casas F, Smith S. et al. Cross-species genomic landscape comparison of human mucosal melanoma with canine oral and equine melanoma. Nat Commun. 2019;10:353
23. Lee JH, Kim MS, Yoo NJ, Lee SH. Absence of KNSTRN Mutation, a Cutaneous Squamous Carcinoma-Specific Mutation, in Other Solid Tumors and Leukemias. Pathol Oncol Res. 2016;22:227-8
24. Altorki NK, Markowitz GJ, Gao D, Port JL, Saxena A, Stiles B. et al. The lung microenvironment: an important regulator of tumour growth and metastasis. Nature reviews Cancer. 2019;19:9-31
25. Sharfe N, Karanxha A, Dadi H, Merico D, Chitayat D, Herbrick JA. et al. Dual loss of p110delta PI3-kinase and SKAP (KNSTRN) expression leads to combined immunodeficiency and multisystem syndromic features. J Allergy Clin Immunol. 2018;142:618-29
Author contact
![]() Corresponding author: Liming Cao, E-mail: clmingedu.cn. 87 Xiangya Road, Changsha, Hunan, P.R. China, 410008.
Corresponding author: Liming Cao, E-mail: clmingedu.cn. 87 Xiangya Road, Changsha, Hunan, P.R. China, 410008.