Impact Factor ISSN: 1837-9664

 Global reach, higher impact
J Cancer 2021; 12(10):3077-3088. doi:10.7150/jca.51322 This issue Cite
Research Paper
Consumption of sugar-sweetened beverages and fruit juice and human cancer: a systematic review and dose-response meta-analysis of observational studies
Yuting Li1*, Li-liangzi Guo1*, Kaiyin He1*, Changbing Huang2*, Shaohui Tang1 ![]()
1. Department of Gastroenterology, The First Affiliated Hospital, Jinan University, Guangzhou, Guangdong, China.
2. Department of Information, Affiliated Hospital (Clinical College) of Xiangnan University, Chenzhou, Hunan, China.
*These authors contributed equally to this work.
Received 2020-7-30; Accepted 2021-3-4; Published 2021-3-21
Abstract

Background: Several epidemiological studies have assessed the association of sugary drinks consumption with cancer, but the results remain controversial.
Objective: We performed this analysis to evaluate possible causal relationship between sugary drinks consumption and cancer risk and mortality.
Methods: We searched PubMed, Embase, and Web of Science databases in English. Observational studies evaluating the association of sugary drinks intake with cancer were included. Random-effects meta-analysis was used to calculate the risk estimates.
Results: A total of 71 observational articles with 32 case-control and 39 cohort studies were included in the meta-analysis. 60 addressed cancer risk, and 11 reported cancer mortality. Compared with the lowest level, the highest level of sugar-sweetened beverages (SSB) consumption showed an increased overall cancer risk (RR=1.12 95% CI: 1.06-1.19, P=0.000) and mortality (RR=1.07 95% CI: 1.01-1.14, P=0.029), and fruit juice intake showed a positive association with cancer risk in cohort studies (RR=1.06 95% CI: 1.01-1.11, P=0.013). Subgroup analyses based on cancer type indicated that risk of breast cancer, hepatocellular carcinoma, colorectal cancer, and prostatic cancer mortality had a positive association with SSB consumption. For dose-response analysis, evidence of a linear association was found between overall cancer risk and SSB or fruit juice consumption, and the risk increase by 4% for one servings/d increment in SSB intake and 14% in fruit juice.
Conclusions: Our findings suggest the consumption of sugary beverages may increase the risk and mortality of cancer, especially risk of breast cancer, hepatocellular carcinoma, colorectal cancer, and prostatic cancer, and mortality of breast cancer, though the evidence was limited.
Keywords: sugary beverages, cancer, risk, mortality, meta-analysis
Introduction
Cancer is one of the leading causes of morbidity and mortality worldwide, which responsible for nearly 18.1 million new cases and 9.6 million deaths in 2018 [1]. It is well-known that is a complicated disease caused by interaction of genetic and environmental factors, such as smoking, physical exercise, and diet [2-4]. In terms of diet, some food such as red and processed meat may increase cancer risk and mortality [5, 6], and some such as vegetables seem to decrease cancer incidence [7] and mortality [8]. However, the association between sugary drinks and cancer is still uncertain.
The consumption of sugary beverages (such as sugary-sweetened beverages (SSB) and fruit juice), has increased all over the world in the last decades, especially in adolescents [9]. SSB, including soft drink, carbonated drinks, artificially sweetened drinks and fruit drinks (lemonade and punch), are defined as beverages containing added caloric sweetener (sucrose, fructose, artificial sweetener, etc.). Investigations of sugary beverages and its potential health effects have been an active area of research interest. Several studies have found that sugary drinks is associated with having a higher risk of type 2 diabetes [10], hypertension and cardiometabolic disease [11], as well as a greater risk of depression [12] and non-alcoholic fatty liver disease [13]. However, the potential link between sugary drinks and cancer is inconsistent, with some reporting a positive association [14], some a negative association [15] and others finding no relationship [16].
To better understand the relationship between the consumption of sugary beverages (SSB and fruit juice) and cancer risk and mortality, we combined all published epidemiologic studies on this issue and conducted a dose-response meta-analysis.
Methods
Following the Preferred Reporting Items for Systematic reviews and Meta-Analysis (PRISMA) guidelines [17], we performed a meta-analysis and systematic review dealing with the association of sugary beverages with cancer risk and mortality in human. We employed the PICO format (population, intervention, comparison, outcome) to answer the research question: “Are sugary beverages consumption (SSB and fruit juice) associated with cancer risk and mortality. Population: Adults with any type of cancer; Intervention: SSB and fruit juice; Comparison: Adults without cancer; O: The risk and mortality of cancer.
Search strategy
There is a two-step search strategy. First, a systematic review was performed by querying Pubmed, Embase and Web of science database in English until October 2020. The keywords we used as “sugary beverages or sweetened beverages or fruit juice or soft drink or carbonated drink or soda beverages” combined with “cancer or tumor or carcinoma or melanoma or sarcoma or neoplasms or lymphoma or leukemia”. In the second part, we searched the bibliographies of retrieved publications to further increase the yield of potentially relevant articles. For studies that did not report outcomes of interest, we contacted the authors via email. Two independent reviewers (Y.T.L and K.Y.H) made an initial judgment of whether the studies were eligible to be included in the analysis, and any disagreements were resolved by consulting the third investigator (S.H.T).
Inclusion and exclusion criteria
The inclusion criteria were required as follows: (1) adult participants; (2) observational studies that investigated sugar-sweetened beverages/fruit juice consumption and cancer risk and mortality. SSB included regular sugar-sweetened soda, soft drinks, artificially sweetened drinks and fruit drinks (such as lemonade and punch). Fruit juice included apple juice, orange juice, grapefruit juice and other juice (without vegetable juice); (3) Studies reported the risk estimates (hazard ratio (HR) or relative risk (RR) or Odds ratio (OR)) with their corresponding 95% confidence interval (CI) or original data allowing us to compute them were available; (4) if the published studies reported data for specific subgroups, results for the whole population were considered in this meta-analysis; (5) if the original publications provided several independent studies, they were considered as separate studies in the following data analysis.
Exclusion criteria: (1) animal studies; (2) pregnancy women; (3) did not provide enough data on sugary beverage consumption and cancer risk or mortality; (4) duplicate reports, abstracts and review articles.
Data extraction and quality assessment
Data extraction from each study included the name of the first author, study design, publication year, study region, sample size (number of cases and total number of participants), type of cancer, sugary beverages categories, the RRs with their 95% CIs for each category of sugary beverages intake and covariates adjusted for in the multivariable analysis. We extracted the RRs that reflected the greatest degree of adjustment for potential confounders. Two investigators (L.L.Z.G and C.B.H) independently extracted the data, and discrepancies were resolved through consensus.
The methodological quality of included studies was evaluated based on the Newcastle-Ottawa Scale (NOS) [18] for assessing the quality of observational studies in meta-analysis. A star system of the NOS ranges from 0 to 9 and contains eight questions grouped under three categories: selection, comparability, and exposure. The score of 7 or higher in case-control studies and cohort studies was considered as the high-quality studies. Study quality was assessed independently by two of the investigators (L.L.Z.G and K.Y.H), and any discrepancies were addressed by a joint reevaluation of the original article.
Statistical analysis
The results were expressed in terms of RR and 95% CI for the highest versus the lowest category of sugary beverages consumption. Dose-response analysis were also conducted and P<0.05 was considered statistically significant. To assess the heterogeneity in results of individual studies, Cochran's Q-test and I2 statistics were used. And I2 >50% and P<0.1 was considered as statistically significant heterogeneity [19]. The causes of heterogeneity were investigated by subgroup analysis based on study design, cancer types, geographic location, patient sex, and number of cases, study quality score, and type of food frequency questionnaire (FFQ), if data permitted. And, to examine the stability of results, sensitivity analysis by omitting one study at a time and recalculating the pooled RR was also performed. Effect differences were formally tested by means of random effects meta-analysis. According to the Cochrane Handbook, if ≥10 studies are available, publication bias was evaluated with the Begg's test and Egger's test. When P<0.05, publication bias exists. To reduce the potential influence of publication bias, we used the trim and fill method [20].
Moreover, a dose-response meta-analysis was carried out in ≥2 prospective cohort studies to assess the trend between different exposure levels of sugary drinks and cancer incidence and mortality using a random effects meta-regression [21]. The dose-response relation analysis was estimated using the two-stage generalized least squares trend estimation [21]. This method requires that the distribution of cases and person-years or non-cases and RRs with 95% CI for at least three categories of exposure to sugary beverages. The generalized least-squares trend and variance-weighted least squares methods require median values for categories of intake levels. When medians and means were not presented, the category mid-point was used. If the highest category was open ended, we assumed the size of the open-ended interval to the same as that of the closest interval. The consumption of sugary drinks was used to assess the exposure levels in different studies, so the intake in one serving/weeks was estimated in the dose-response analysis. Doses reported as cups or glasses per day or per month were transformed into servings/w. The results in the forest plots are presented for every seven servings/w (one serving/day) increment in sugary drinks consumption. All statistical analysis was performed using STATA version 12.0.
Results
Search results and study characteristics
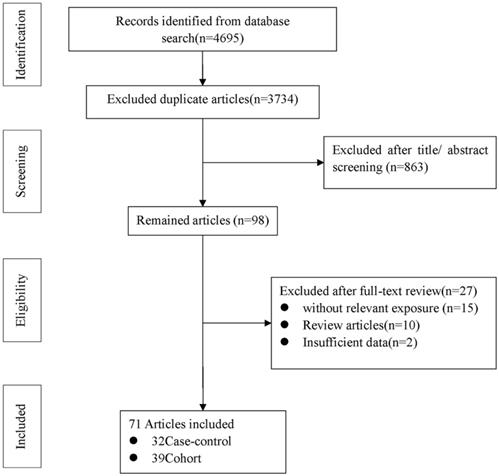
Figure 1 shows the flow diagram of detailed selection process. A total of 4695 potentially relevant articles were initially retrieved, then 3734 duplicate articles were excluded. After screening the title and assessing the abstract, 98 articles were remained for full text review. Among them, 27 articles were excluded (10 were review articles, 15 were unmatched with the study exposure, and 2 did not provide insufficient data). In the end, a total of 71 eligible articles [14-16, 22-78] were included in our meta-analysis: 32 case-control [14-16, 22, 24-28, 30, 36, 40, 42-47, 51, 52, 54, 55, 62-64, 67, 70, 73, 75-77] and 39 cohort studies [23, 29, 31-35, 37-39, 41, 48-50, 53, 56-61, 65, 66, 68, 69, 71, 72, 74, 78] (Supplementary Table S1).
Flow diagram of literature search and study selection.
A total of 60 included articles to investigate the association between sugary drinks and cancer risk had 50122 cases with cancers originating from the following 16 sites involved in 2 hepatocellular carcinoma (HCC) [67, 74], 10 colorectal cancer [22, 24, 29, 35, 38, 52, 53, 61, 76, 78], 6 gastric cancer [14, 16, 38, 55, 64, 66], 2 lymphomas [56, 71], 8 breast cancer [28, 29, 34, 38, 53, 54, 63, 68], 8 prostatic cancer [29, 31, 33, 38, 42, 53, 57, 73], 4 renal cancer [40, 50, 65, 75], 6 bladder cancer [25, 30, 43, 44, 69, 77], 1 leukemia [71], 5 esophageal cancer [15, 16, 47, 55, 66], 2 biliary tract cancer [49, 74], 3 endometrial cancer [38, 41, 45], 11 pancreatic cancer [23, 26, 27, 36, 37, 48, 51, 58-60, 72], 2 ovary cancer [38, 46], 3 nasopharyngeal cancer [62, 66, 70] and 2 glioma [32, 39]. Among them, 53 eligible studies were included to investigate the association between SSB and cancer risk, and 17 studies to evaluate the association between fruit juice and cancer risk. Of the studies, 23 [14, 24, 25, 29, 31, 36, 37, 43, 47-49, 59, 60, 62, 65, 67-70, 74-77] were conducted in Europe, 29 [16, 23, 26-28, 32-35, 39-42, 44-46, 50, 51, 53, 55-57, 61, 63, 66, 71-73, 78] in North America, 3 [54, 58, 64] in Asia, 3 [15, 22, 38] in Oceania, 1 [30] in South America, 1 [52] in Africa. The main characteristics of the included studies are illustrated in Supplementary Table S1.
A total of 11 eligible articles [79-89] (10 cohorts) involved in 7 overall cancer [79, 83, 84, 86-89], 3 colorectal, and 1 upper aerodigestive tract [85] were studied to review the association of SSB with cancer mortality. Of the studies, 1 [86] were conducted in Europe, 3 [83, 87, 89] in Asia, and 7 [79-82, 84, 85, 88] in North America. No enough study was provided to evaluate the association between fruit juice and cancer mortality.
The quality on the basis of the NOS score was described in Supplementary Tables S1. NOS scores ranged from 5 to 9, and study quality was maximal (nine stars) in cases (n=5); lower quality studies were graded with eight stars (n=19), seven stars (n=19), six stars (n=19), and five stars (n=9).
Sugar-sweetened beverages (SSB) and cancer risk
Highest vs lowest category meta-analysis
For the primary outcome of cancer incidence, a total of 53 [14-16, 23-25, 27-33, 35-59, 61-63, 66-69, 71-78] articles including 26 [23, 29, 31-33, 35, 37-39, 41, 48-50, 53, 56-59, 61, 66, 68, 69, 71, 72, 74, 78] cohort studies and 27 [14-16, 24, 25, 27, 28, 30, 36, 40, 42-47, 51, 52, 55, 62, 63, 67, 73, 75-77] case-control studies with 44370 cases were used to evaluate the pooled RR. Highest category versus lowest category of SSB consumption could have a significantly positive association with overall cancer incidence by 12% (RR=1.12 95%CI: 1.06-1.19, P=0.000; I2=64.9%) (Fig. 2). Evidence in favor of an association with cancer risk was weaker among cohort studies (RR=1.08 95%CI: 1.01-1.15, P=0.020; I2=59.3%) (Fig. 2) when compared with case-control studies (RR=1.20 95%CI: 1.06-1.35, P=0.003; I2=68.5%) (Fig. 2). Nevertheless, the heterogeneity between-study did not decrease remarkable across studies with the same design.
Meta-analysis of SSB consumption and cancer risk by study design. Forest plot showing the summary relative ratio (RR). Weights are from random-effects analysis.
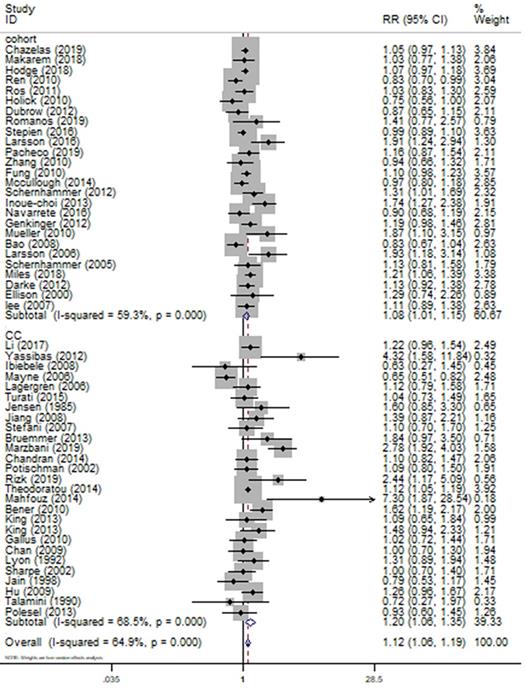
Table 1 shows the results of subgroup analysis by cancer type. The results showed that the greatest risk of cancer following SSB consumption was observed for breast cancer (n=7, RR=1.21 95% CI: 1.02-1.43, P=0.027; I2=62.5%), HCC (n=2, RR=2.00 95% CI: 1.33-3.03, P=0.001; I2=0%), colorectal cancer (n=9, RR=1.14 95% CI: 1.01-1.27, P=0.030; I2=66.6%), prostatic cancer (n=8, RR=1.14 95% CI: 1.05-1.24, P=0.003; I2=0%). In contrast, meta-analysis suggested no evidence of association for the following tumor site: esophageal cancer (n=5), gastric cancer (n=6), renal cancer (n=4), bladder cancer (n=6), ovary cancer (n=2), endometrial cancer (n=3), pancreatic cancer (n=9), hematopoietic cancer (n=2), nasopharyngeal cancer (n=2), biliary tract cancers (n=2). In our analysis, SSB consumption seemed to be linked to a statistical significantly lower risk of glioma (n=2, RR=0.81 95% CI: 0.66-0.99, P=0.041; I2=0%) and non-cardia gastric cancer (n=2, RR=0.69 95% CI: 0.50-0.95, P=0.022; I2=0%).
SSB consumption and cancer risk
| Factors | Number of studies | Random-effect | P value | Heterogeneity | Begg's/Egger's | |
|---|---|---|---|---|---|---|
| Pooled RR (95%CI) | I2 | p | ||||
| SSB | ||||||
| Total | 53 | 1.12 (1.06,1.19) | P=0.000 | 64.9% | 0.000 | 0.002/0.005 |
| Cohort | 26 | 1.08 (1.01,1.15) | P=0.020 | 59.3% | 0.000 | 0.047/0.051 |
| CC | 27 | 1.20 (1.06,1.35) | P=0.003 | 68.5% | 0.000 | 0.076/0.082 |
| D-R | 20 | 1.04 (1.01,1.09) | P=0.022 | 0.032 | ||
| EC | 5 | 0.84 (0.63,1.12) | P=0.240 | 59% | 0.099 | |
| EADC | 5 | 0.93 (0.65,1.34) | P=0.709 | 64.1% | 0.025 | |
| ESCC | 3 | 0.68 (0.43,1.08) | P=0.105 | 41.5% | 0.181 | |
| CC | 4 | 0.79 (0.54,1.16) | P=0.232 | 69.3% | 0.006 | |
| Cohort | 1 | 0.99 (0.67,1.47) | P=0.974 | 0.0% | 0.513 | |
| GC | 6 | 0.99 (0.79,1.29) | P=0.960 | 48.3% | 0.043 | |
| Cardia | 5 | 1.03 (0.86,1.24) | P=0.717 | 0% | 0.617 | |
| Non-cardia | 2 | 0.69 (0.50,0.95) | P=0.022 | 0% | 0.668 | |
| CC | 4 | 1.09 (0.73,1.63) | P=0.660 | 68.0% | 0.008 | |
| Cohort | 2 | 0.94 (0.73,1.22) | P=0.664 | 0.0% | 0.637 | |
| D-R | 2 | 1.02 (0.97,1.06) | P=0.414 | 0.159 | ||
| Breast | 7 | 1.21 (1.02,1.43) | P=0.027 | 62.5% | 0.004 | |
| Premenopausal | 4 | 1.24 (0.96,1.61) | P=0.101 | 66.5% | 0.011 | |
| postmenopausal | 4 | 1.10 (0.89,1.36) | P=0.394 | 49.3% | 0.066 | |
| CC | 3 | 1.38 (0.90,2.10) | P=0.137 | 84.3% | 0.000 | |
| Cohort | 4 | 1.11 (0.98,1.26) | P=0.089 | 0% | 0.630 | |
| D-R | 4 | 1.09 (0.98,1.23) | P=0.116 | 0.144 | ||
| HCC | 2 | 2.00 (1.33,3.03) | P=0.001 | 0% | 0.526 | |
| BTC | 2 | 1.01 (0.90,1.13) | P=0.866 | 58.9% | 0.045 | |
| EHBC | 2 | 1.22 (0.66,2.27) | P=0.530 | 79.8% | 0.026 | |
| IHBC | 2 | 0.97 (0.90,1.05) | P=0.492 | 0% | 0.445 | |
| Gallbladder | 2 | 1.30 (0.53,3.16) | P=0.566 | 80.8% | 0.023 | |
| Vater cancer | 1 | 1.02 (0.95,1.10) | P=0.586 | 0% | 0.434 | |
| CRC | 9 | 1.14 (1.01,1.27) | P=0.030 | 66.6% | 0.000 | |
| CC | 3 | 2.04 (1.16,3.59) | P=0.014 | 86.9% | 0.000 | |
| Cohort | 6 | 1.07 (0.97,1.18) | P=0.168 | 28.3% | 0.193 | |
| D-R | 4 | 1.01 (0.93,1.10) | P=0.302 | 0.736 | ||
| Prostatic | 8 | 1.14 (1.05,1.24) | P=0.003 | 0% | 0.528 | |
| CC | 2 | 0.90 (0.70,1.17) | P=0.442 | 0% | 0.380 | |
| Cohort | 6 | 1.17 (1.07,1.28) | P=0.001 | 0% | 0.800 | |
| D-R | 4 | 1.09 (0.87,1.36) | P=0.445 | 0.661 | ||
| Pancreatic | 9 | 1.12 (0.95,1.32) | P=0.165 | 57.9% | 0.015 | |
| CC | 3 | 1.08 (0.89,1.32) | P=0.446 | 0% | 0.526 | |
| Cohort | 6 | 1.16 (0.92,1.47) | P=0.217 | 71.7% | 0.003 | |
| D-R | 6 | 1.11 (0.94, 1.32) | P=0.207 | 0.002 | ||
| Ovarian | 2 | 1.24 (0.88,1.74) | P=0.225 | 0% | 0.821 | |
| Endometrial | 3 | 1.32 (0.95,1.84) | P=0.099 | 45.8% | 0.137 | |
| CC | 1 | 1.48 (0.94,2.33) | P=0.090 | |||
| Cohort | 2 | 1.21 (0.73,1.99) | P=0.460 | 63.6% | 0.064 | |
| Renal | 4 | 1.16 (0.99,1.36) | P=0.062 | 0% | 0.625 | |
| CC | 2 | 1.18 (0.82,1.68) | P=0.372 | 11.6% | 0.288 | |
| Cohort | 2 | 1.14 (0.94,1.38) | P=0.198 | 0% | 0.511 | |
| D-R | 2 | 1.07 (0.92,1.24) | P=0.354 | 0.740 | ||
| Bladder | 6 | 1.14 (0.98,1.33) | P=0.095 | 0% | 0.515 | |
| CC | 5 | 1.25 (1.01,1.54) | P=0.040 | 0% | 0.579 | |
| Cohort | 1 | 1.03 (0.82,1.29) | P=0.796 | |||
| Nasopharyngeal | 2 | 0.81 (0.66,1.00) | P=0.051 | 0% | 0.941 | |
| CC | 1 | 0.78 (0.62,0.99) | P=0.747 | |||
| Cohort | 1 | 0.93 (0.60,1.45) | P=0.042 | |||
| Hematopoietic | 2 | 1.09 (0.92,1.30) | P=0.304 | 10.4% | 0.347 | |
| Cohort | 2 | 1.09 (0.92,1.30) | P=0.304 | 10.4% | 0.347 | |
| D-R | 2 | 1.03 (0.90,1.18) | P=0.688 | 0.170 | ||
| Lymphoid | 2 | 1.11 (0.90,1.37) | P=0.314 | 32.7% | 0.216 | |
| Leukemia | 1 | 1.06 (0.56,2.00) | P=0.858 | |||
| Glioma | 2 | 0.81 (0.66,0.99) | P=0.041 | 0% | 0.774 | |
| Cohort | 2 | 0.81 (0.66,0.99) | P=0.041 | 0% | 0.774 | |
| D-R | 2 | 0.93 (0.79,1.08) | P=0.325 | 0.750 | ||
SSB: sugar-sweetened beverages; CC: case-control; D-R: dose-response analysis; EC: esophageal cancer; GC: gastric cancer; ESCC: esophageal squamous cell carcinoma; EADC: esophageal adenocarcinoma; IHBC: intrahepatic bile duct; GBTC: biliary track cancer; EHBC: extrahepatic bile duct; HCC: hepatocellular carcinoma; CRC: colorectal cancer.
To assess the potential modifying effects, subgroup analysis by geographic location, number of cases, study quality score, and type of questionnaires was conducted for all SSB studies involved in overall cancer and each cancer (Supplementary Table S2). Overall, a positively association were observed between highest vs lowest intake of SSB and overall cancer risk in the stratified analysis by study quality score, and type of food frequency questionnaires (FFQ). By geographic location, the association was significant in European (n=19, RR=1.23 95%CI: 1.11-1.37, P=0.001; I2=58.2%) and in Asia (n=2, RR=2.39 95%CI: 1.64-3.48, P<0.001; I2=31.4%), but nonsignificant in North America (n=28, RR=1.06 95%CI: 0.66-1.45, P=0.147; I2=59%). Similarly, the association stratified by number of cases was significant in group of <500 cases (n=28, RR=1.25 95%CI: 1.12-1.41, P=0.000; I2=69.5%), but not in ≥500 cases (n=25, RR=1.06 95%CI: 0.99-1.13, P=0.076; I2=59.7%). For cohort studies, only subgroup analysis in validated FFQ and high-quality score had an increased risk of cancer incidence with RR of 1.10 (n=15) and 1.08 (n=26). For case-control studies, subgroup analysis in European, <500 cases, validated FFQ and low-quality score had an increased risk of cancer incidence with RR of 1.40 (n=12), 1.43 (n=16), 1.12(n=5), 1.25 (n=19). The rest of group in cohort and in case-control studies were not significantly associated with SSB consumption (Supplementary Table S2). For each cancer, the results of subgroup analysis were also showed in Supplementary Table S2, which suggests that the relationship between consumption of SSB and cancer risk may vary with different tumors.
Dose-response meta-analysis
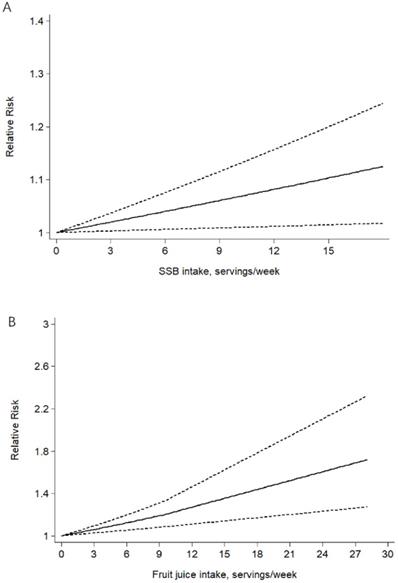
Combing data from 20 [23, 29, 32, 33, 38, 39, 48-50, 53, 56-59, 61, 66, 68, 71, 72, 78] prospective cohort studies, trend meta-analysis showed a statistically significant positive dose-response relationship between SSB and overall cancer incidence from linearity (P-nonlinearity=0.802). We found that one servings/d increment in SSB consumption could increase 4% risk of overall cancer (RR=1.04 95%CI: 1.01-1.09, P=0.022) (Fig. 3A) using random model with significant heterogeneity. In the light of the statistically significant heterogeneity (P=0.032), we investigated its potential sources. Subgroup analysis by cancer type showed no evidence of dose-response relationship for the following tumor site: gastric cancer (n=2), breast cancer (n=4), colorectal cancer (n=5), prostatic cancer (n=5), pancreatic cancer (n=6), endometrial cancer (n=2), renal cancer (n=2), hematopoietic cancer (n=2) and glioma (n=2), with no heterogeneity.
The linear dose-response association meta-analysis between SSB (A) and fruit juice (B) consumption and risks of cancer in prospective cohort studies. Weights are from random-effects analysis.
Sensitivity analysis and publication bias
We also conducted a sensitivity analysis to investigate the influences of single studies on the overall risk estimate by omitting one study in each turn (Supplementary Table S5). The omission of any study made no significant difference in the overall, cohort, and case-control studies meta-analysis, respectively.
For overall cancer, the Egger's test revealed evidence of publication bias across studies (Egger's P=0.005, Begg's P=0.002). However, there was a low probability of publication bias in case-control studies (Egger's P=0.082, Begg's P=0.076) and in cohort studies (Egger's P=0.051, Begg's P=0.047). The funnel plot of the studies is presented in Figure S1. According to the trim and fill method, which looks for missing studies based on a random-effects model, we found the results were not relatively stable. So, the evidence was poor to identify SSB as a risk factor for cancer incidence.
Fruit juice and cancer risk
Highest vs lowest category meta-analysis
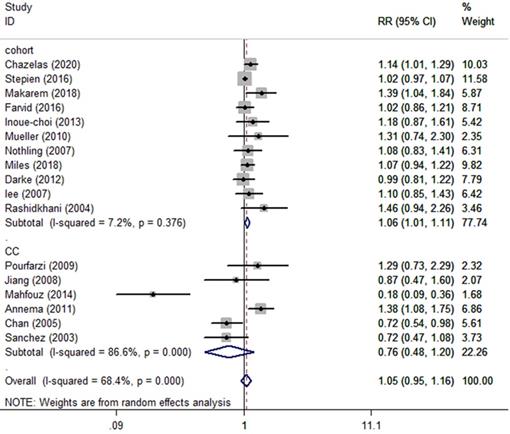
Seventeen [22, 26, 29, 31, 34, 41, 44, 50, 52, 53, 57, 58, 60, 64, 65, 70, 74] published studies involved in 15192 cases reporting fruit juice consumption and cancer incidence met the inclusion criteria and were included in our meta-analysis. The pooled summary effect size indicated no significant association between fruit juice consumption and cancer incidence in overall and case-control studies. For eleven [29, 31, 34, 41, 50, 53, 57, 58, 60, 65, 74] cohort studies, however, the highest category showed a 6% increased risk of overall cancer (RR=1.06 95%CI: 1.01-1.11, P=0.013; I2=7.2%) (Fig. 4 and Table 2) compared to the lowest category.
Meta-analysis of fruit juice consumption and cancer risk by study design. Forest plot showing the summary relative ratio (RR). Weights are from random-effects analysis.
Fruit juice consumption and cancer risk
| Factors | Number of studies | Random-effect | P value | Heterogeneity | Begg's/Egger's | |
|---|---|---|---|---|---|---|
| Pooled RR (95%CI) | I2 | p | ||||
| Fruit juice | ||||||
| Total | 17 | 1.05 (0.95,1.16) | 0.338 | 68.4% | 0.000 | 0.650/0.442 |
| Cohort | 11 | 1.06 (1.01,1.11) | 0.013 | 7.2% | 0.376 | 0.029/0.018 |
| CC | 6 | 0.76 (0.48,1.20) | 0.240 | 86.6% | 0.000 | |
| D-R | 7 | 1.14 (1.06,1.23) | 0.000 | 0.447 | ||
| CRC | ||||||
| 4 | 0.87 (0.42,1.81) | 0.715 | 90.3% | 0.000 | ||
| CC | 2 | 0.51 (0.07,3.77) | 0.511 | 96.6% | 0.000 | |
| Cohort | 2 | 1.32 (0.92,1.88) | 0.123 | 0% | 0.392 | |
| D-R | 2 | 1.32 (1.01,1.74) | 0.045 | 0.897 | ||
| Pancreatic | ||||||
| 3 | 0.96 (0.69,1.35) | 0.362 | 63.3% | 0.066 | ||
| CC | 1 | 0.72 (0.53,0.97) | 0.031 | |||
| Cohort | 2 | 1.12 (0.88,1.42) | 0.362 | 0% | 0.545 | |
| D-R | 2 | 1.23 (0.83,1.93) | 0.272 | 0.662 | ||
| Breast | ||||||
| 3 | 1.06 (0.93,1.20) | 0.375 | 0% | 0.755 | ||
| Cohort | 3 | 1.06 (0.93,1.20) | 0.375 | 0% | 0.755 | |
| Prostatic | ||||||
| 4 | 1.08 (0.95,1.22) | 0.250 | 22.9% | 0.274 | ||
| Cohort | 4 | 1.08 (0.95,1.22) | 0.250 | 22.9% | 0.274 | |
| D-R | 3 | 1.38 (1.02,1.87) | 0.036 | 0.360 | ||
| Renal | ||||||
| 2 | 1.20 (0.93,1.54) | 0.165 | 15.6% | 0.277 | ||
| Cohort | 2 | 1.20 (0.93,1.54) | 0.165 | 15.6% | 0.277 | |
| D-R | 2 | 1.15 (0.88,1.50) | 0.302 | 0.334 | ||
CC: case-control; D-R: dose-response analysis; CRC: colorectal cancer.
To assess the potential modifying effects, subgroup analysis by cancer type, geographic location, number of cases, study quality score, and type of FFQ was conducted for all fruit juice studies. Subgroup analysis suggested no evidence of association for the following cancer type (Table 2): colorectal cancer (n=4), pancreatic cancer (n=3), breast cancer (n=3), and renal cancer (n=2). Except for the 11 studies with high-quality score by which the result showed a positive association between highest vs lowest intake of fruit juice and cancer incidence (RR=1.06), the other results stratified by geographic location, number of cases, and type of FFQ showed no association (Supplementary Table S3). For cohort studies, however, subgroup analysis in European, ≥500 cases, unvalidated FFQ and high-quality score had an increased risk of cancer incidence with RR of 1.14 (n=5), 1.08 (n=6), 1.11 (n=5), and 1.06 (n=11), respectively (Supplementary Table S3). For case-control studies, subgroup analysis revealed no association between fruit juice and cancer incidence.
Dose-response meta-analysis
Combing data from 7[29, 34, 50, 53, 57, 58, 60] prospective cohort studies, trend meta-analysis showed a statistically significant positive dose-response relationship between fruit juice and overall cancer incidence from linearity (P-nonlinearity=0.778). We found that one servings/d increment in fruit juice consumption could increase 14% risk of overall cancer (RR=1.14 95%CI: 1.06-1.23, P=0.000) (Fig. 3B) using random model with no heterogeneity (P=0.447). And the rest showed no evidence of dose-response relationship.
Publication bias and sensitivity analysis
The results of Egger's test showed no evidence of publication bias for the analysis between overall cancer incidence and fruit juice consumption (Egger's P=0.442, Begg's P=0.650), but a publication bias in cohort studies (Egger's P=0.018, Begg's P=0.029). We used the trim and fill method, founding the results were not relatively stable. So, the evidence was poor to identify fruit juice as a risk factor for cancer incidence. The funnel plot of the studies is presented in Figure S2. The sensitivity analysis was conducted to investigate the influences of single studies on the overall risk estimate by omitting one study in each turn (Supplementary Table S6).
Sugar-sweetened beverages (SSB) and cancer mortality
Highest vs lowest category meta-analysis
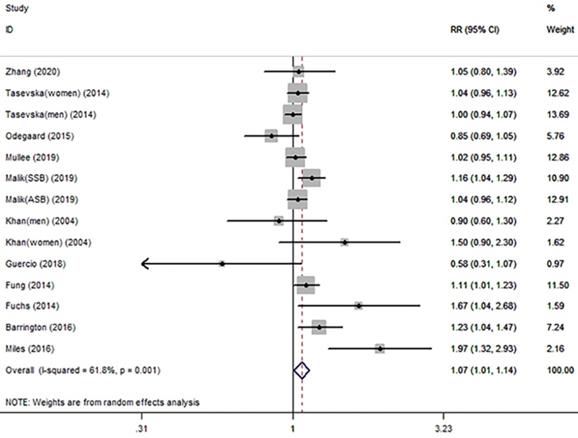
For the primary outcome of cancer mortality, a total of 11 articles [79-89] involved in 10 cohort studies and 1 case-control study were included to evaluated the pooled RR. Highest category versus lowest category of SSB consumption showed a significantly positive association with overall cancer mortality (RR=1.07 95%CI: 1.01-1.14, P=0.029; I2=61.8%) (Fig. 5 and Table 3). Evidence in favor of an association with cancer mortality was the same as 10 [79-84, 86-89] cohort studies (RR=1.06 95%CI: 1.00-1.12, P=0.046; I2=50.9%). Table 3 shows the results of subgroup analysis by cancer type. The results showed that only breast cancer mortality had a significant association with SSB consumption (RR=1.17 95%CI: 1.03-1.34, P=0.017; I2=0%). Colorectal cancer, prostate cancer and lung cancer seemed to be no association with SSB. Other subgroup analyses by geographic location, number of cases, study quality score, and type of FFQ were conducted for the association between overall cancer mortality and SSB consumption in Supplementary Table S4. The results in validated FFQ and North America showed an increased risk of cancer mortality with RR of 1.12 (n=5) and 1.10 (n=7), and the nonsignificant associations were observed in the other subgroup analyses.
Meta-analysis of SSB consumption and cancer mortality. Forest plot showing the summary relative ratio (RR). Weights are from random-effects analysis.
SSB consumption and cancer mortality
| Factors | Number of studies | Random-effect | P value | Heterogeneity | Begg's/Egger's | |
|---|---|---|---|---|---|---|
| Pooled RR (95%CI) | I2 | p | ||||
| Total | ||||||
| 11 | 1.07 (1.01,1.14) | 0.029 | 61.8% | 0.001 | 0.189/0.506 | |
| Cohort | 10 | 1.06 (1.00,1.12) | 0.046 | 50.9% | 0.018 | 0.360/0.869 |
| D-R | 7 | 1.00 (0.98,1.03) | 0.561 | 0.005 | ||
| CRC | ||||||
| Cohort | 6 | 1.09 (0.90,1.33) | 0.715 | 64.7% | 0.006 | |
| D-R | 2 | 1.01 (0.93,1.09) | 0.867 | 0.024 | ||
| Breast | ||||||
| Cohort | 2 | 1.17 (1.03,1.34) | 0.017 | 0% | 0.611 | |
| Prostatic | ||||||
| Cohort | 2 | 0.96 (0.79,1.17) | 0.687 | 0% | 0.791 | |
| Lung | ||||||
| Cohort | 2 | 0.99 (0.86,1.13) | 0.835 | 0% | 0.557 | |
D-R: dose-response analysis; CRC: colorectal cancer.
Dose-response meta-analysis
Combing data from 6 cohort studies [80, 82, 84, 86, 87, 89], a trend meta-analysis showed no significant dose-response relationship between SSB and overall cancer (P=0.561) or colorectal cancer (P=0.867) mortality.
Sensitivity analysis and Publication bias
The results of Egger's test showed no evidence of publication bias for the analysis between overall cancer mortality and SSB (Egger's P=0.506, Begg's P=0.189). The funnel plot of the studies is presented in Figure S3. The sensitivity analysis was conducted to investigate the influences of single studies on the overall mortality estimate by omitting one study in each turn (Supplementary Table S7).
Discussion
This present meta-analysis with 71 observational articles was designed to investigate the association between the consumption of sugary drinks (SSB and fruit juice) and cancer risk and mortality. To some extent, the results of this meta-analysis support the hypothesis that SSB consumption was associated with a significant increased overall cancer risk and mortality, and fruit juice intake also significantly increased overall cancer risk in cohort studies. What's more, a significant dose-response relationship was observed between SSB or fruit juice consumption and overall cancer risk, strengthening this hypothesis. When we considered cancers by site, the incidence of breast cancer, HCC, CRC, and prostatic cancer had an increased risk with SSB consumption, which was consistent with the overall results. We also found that SSB seem to play a preventive role in glioma and non-cardia gastric cancer. However, these results were based on only 2 glioma and 2 non-cardia gastric cancer studies.
The most important advantage of this meta-analysis is that, to the best of our knowledge, this is the latest, the most comprehensive and the most meaningful article. It updates and expands two previous meta-analyses. The first meta-analysis conducted by Boyle et al. [90] showed no link between the consumption of carbonated beverages and the risk of overall cancer and specific cancer without a statistical analysis, unlike our findings. We determined RRs and dose-response risk functions for the association between SSB consumption and a large number of neoplasms, some of which were never investigated using a meta-analytic approach. The second meta-analysis by Milajerdi et al. included 5 cohort studies and 4 case-control studies, and the results from both the 5 cohort and the 4 case-control studies indicated that there were no significant associations between sugary drinks consumption and PC risk (P>0.05); also, the subgroup analyses based on study location (USA/Non-USA) and follow-up duration (≥10 years/<10 years) showed that SB consumption was not associated with the risk of PC (P>0.05). In our study, we also included the aforementioned 5 cohort and 4 case-control studies and the other two studies [48, 72] to evaluate the association between SSB or fruit juice and PC; furthermore, we conducted the subgroup analyses by study design (cohort/case-control), geographic location (European, North America, and Asia), number of cases (≥500/<500), study quality score (>6/≤6), and type of questionnaires (FFQ/no-FFQ). All the results indicated that sugary drinks consumption was not associated with the risk of PC (P>0.05), which was consistent with the report by Milajerdi et al. [91]. However, more importantly, we also evaluated the potential link between the consumption of SSB and fruit juice and overall cancer risk or mortality. Moreover, the study by Philipsborn et al. [92] assessed the effects of environmental interventions on the consumption of SSB. They focused on measures that helped people to drink fewer SSB to improve their health, but did not investigate effects of SSB on cancer risk or mortality.
In a large, high-quality prospective cohort study[90], Chazelas et al. reported that the consumption of SSB was positively associated with the risk of overall cancer and breast cancer, and fruit juice intake was also associated with an increased risk of overall cancers, which was consistent with our main findings. In line with our results, another large prospective cohort study [38] showed that the consumption of sugar-sweetened drinks increased the risk of colorectal cancer and breast cancer. Moreover, Malik et al. [84] found that SSB consumption was associated with a higher risk of cancer mortality in a large, high-quality prospective cohort analysis, which was also consistent with our findings.
In addition, several previous studies listed some findings to describe the association between SB and human health. The report by Ferreira-Pego et al.[93] showed consumption of >5 servings/d sugary drinks was associated with a higher risk of metabolic syndrome and hypertension; Mullee et al [86] examined a large multinational cohort of people to evaluate the association between sugary drinks and all-cause mortality, and indicated that higher all-cause mortality was found among participants who consumed ≥2 glasses/d of sugary drinks; the report by Anderson et al. [94] also showed all-cause mortality was positively associated with total SSB intake. These results were consistent with our findings.
Although it is impossible to draw causal links on the basis of these data, there are several possible explanations for the association between sugary drinks consumption and cancer. The first explanation for the increased cancer risk and mortality is that sugary drinks contain a large amount of sugar, which in part responsible for high dietary glycemic index and obesity, may lead to diabetes-related cancer (liver, prostatic, endometrium, colorectal, breast, bladder)[95, 96]. In addition, sugary beverages can promote insulin-glucose dysregulation, oxidative stress, inflammation, and adiposity and finally cause steroid hormone imbalances, which collectively increase cancer risk [96-98]. Secondly, some chemical compounds also play an important role, such as 4-methylimidazole, an additive in drinks that contain caramel coloring (e.g., sodas) or pesticides that might be associated with increased risk of cancer and could be present in fruit juice [99, 100]. Thirdly, postprandial hyperglycemia induced by diets high in sugars triggers insulin and insulin-like growth factor I synthesis, which may enhance tumor development through promoting cell proliferation and inhibiting apoptosis [88]. For the decreased cancer risk including non-cardia gastric, and glioma, the current study provides no evidence that sugar-sweetened beverages consumption would be an effective strategy to lower the cancer incidence. For upper gastrointestinal tract cancer risk, they provided little support for an inverse association between sugary drinks consumption and cancer risk. Some researchers [14, 16, 101] suggested sugary drinks increase gastric reflux, and thus could be associated with an increased risk of esophageal and gastric cancer. Some [55, 66] found there is null results. For glioma risk, Dubrow et al. [32] observed a borderline-significant inverse association between glioma risk and the highest levels of intake of soda, without any dose-response relationship. So, we cannot exclude the possibility that higher sugary drinks intake than that observed in this study may be associated with an elevated risk of cancer. Further longitudinal studies are needed to shed light on this inconsistent result.
The strengths of our study include the large number of cancer cases that ensure a greater precision and high statistical power of the results. Our findings provide an assumption that sugary beverages consumption, including SSB and fruit juice, should be further considered as a risk factor for overall cancer risk and mortality. We also focused on dose-response analysis, which provide more compelling evidence to assess these associations. Even so, we have to admit that there are several limitations in our meta-analysis. Firstly, publication bias between studies not allow us to draw definitive conclusion on the role of SSB and fruit juice in the development of malignant disease in general. Studies included in the analysis were the observational studies such as case-control and cohort studies, which are more susceptible to biases, such as selection bias and recall bias. Secondly, though a sensitivity analysis showed the stability of these results by omitting one study, the disparities still lie in potential biases of each study, the definition and range of sugary beverages consumption, the type of questionnaire, and the confounders for which analysis were adjusted. These differences may all affect the accuracy of these results. Thirdly, we could not make a distinction between soft drink, carbonated drink, and artificially drink, as well as did not perform a subgroup analysis by genders. Because these projects are always mixed in some original articles. The last limitation is that the included study populations mainly come from Europe and North America, where the people have specific dietary behaviors. So, the study coverage in the world was limited because of a small amount studied from Africa, and Asia. Therefore, the overall findings of increased in cancer risk should not be overemphasized.
Conclusions
In conclusion, our results suggest a positive relationship between the consumption of sugary beverages and overall cancer risk and mortality, though the evidences were limited. More large and precise prospective studies are required to further assess the association and the underlying mechanisms between them.
Supplementary Material
Supplementary figures and tables.
Acknowledgements
The authors would like to acknowledge all authors of the original studies that were included in this meta-analysis.
Competing Interests
The authors have declared that no competing interest exists.
References
1. Bray F, Ferlay J, Soerjomataram I, Siegel RL, Torre LA, Jemal A. Global cancer statistics 2018: GLOBOCAN estimates of incidence and mortality worldwide for 36 cancers in 185 countries. CA: a cancer journal for clinicians. 2018;68:394-424
2. Wang JL, Chang CH, Lin JW, Wu LC, Chuang LM, Lai MS. Infection, antibiotic therapy and risk of colorectal cancer: a nationwide nested case-control study in patients with Type 2 diabetes mellitus. International journal of cancer. 2014;135:956-67
3. Graham TA, Sottoriva A. Measuring cancer evolution from the genome. The Journal of pathology. 2017;241:183-91
4. Tiffon C. The Impact of Nutrition and Environmental Epigenetics on Human Health and Disease. Int J Mol Sci. 2018;19:3425
5. Yip CSC, Lam W, Fielding R. A summary of meat intakes and health burdens. Eur J Clin Nutr. 2018;72:18-29
6. Han MA, Zeraatkar D, Guyatt GH, Vernooij RWM, El Dib R, Zhang Y. et al. Reduction of Red and Processed Meat Intake and Cancer Mortality and Incidence: A Systematic Review and Meta-analysis of Cohort Studies. Ann Intern Med. 2019;171:711-20
7. Angelino D, Godos J, Ghelfi F, Tieri M, Titta L, Lafranconi A. et al. Fruit and vegetable consumption and health outcomes: an umbrella review of observational studies. Int J Food Sci Nutr. 2019;70:652-67
8. Aune D, Giovannucci E, Boffetta P, Fadnes LT, Keum N, Norat T. et al. Fruit and vegetable intake and the risk of cardiovascular disease, total cancer and all-cause mortality-a systematic review and dose-response meta-analysis of prospective studies. International journal of epidemiology. 2017;46:1029-56
9. Stea TH, Øverby NC, Klepp KI, Bere E. Changes in beverage consumption in Norwegian children from 2001 to 2008. Public Health Nutr. 2012;15:379-85
10. Greenwood DC, Threapleton DE, Evans CEL, Cleghorn CL, Nykjaer C, Woodhead C. et al. Association between sugar-sweetened and artificially sweetened soft drinks and type 2 diabetes: systematic review and dose-response meta-analysis of prospective studies. The British journal of nutrition. 2014;112:725-34
11. Xi B, Huang Y, Reilly KH, Li S, Zheng R, Barrio-Lopez MT. et al. Sugar-sweetened beverages and risk of hypertension and CVD: a dose-response meta-analysis. The British journal of nutrition. 2015;113:709-17
12. Hu D, Cheng L, Jiang W. Sugar-sweetened beverages consumption and the risk of depression: A meta-analysis of observational studies. Journal of affective disorders. 2019;245:348-55
13. Chen H, Wang J, Li Z, Lam CWK, Xiao Y, Wu Q. et al. Consumption of Sugar-Sweetened Beverages Has a Dose-Dependent Effect on the Risk of Non-Alcoholic Fatty Liver Disease: An Updated Systematic Review and Dose-Response Meta-Analysis. International journal of environmental research and public health. 2019;16:2192
14. Yassibaş E, Arslan P, Yalçin S. Evaluation of dietary and life-style habits of patients with gastric cancer: a case-control study in Turkey. Asian Pacific journal of cancer prevention: APJCP. 2012;13:2291-7
15. Ibiebele TI, Hughes MC, O'Rourke P, Webb PM, Whiteman DC. Cancers of the esophagus and carbonated beverage consumption: a population-based case-control study. Cancer Causes Control. 2008;19:577-84
16. Li N, Petrick JL, Steck SE, Bradshaw PT, McClain KM, Niehoff NM. et al. A pooled analysis of dietary sugar/carbohydrate intake and esophageal and gastric cardia adenocarcinoma incidence and survival in the USA. International journal of epidemiology. 2017;46:1836-46
17. Moher D, Liberati A, Tetzlaff J, Altman DG. Preferred reporting items for systematic reviews and meta-analyses: the PRISMA statement. BMJ (Clinical research ed). 2009;339:b2535
18. Stang A. Critical evaluation of the Newcastle-Ottawa scale for the assessment of the quality of nonrandomized studies in meta-analyses. Eur J Epidemiol. 2010;25:603-5
19. Chen B, Benedetti A. Quantifying heterogeneity in individual participant data meta-analysis with binary outcomes. Syst Rev. 2017;6:243
20. Duval S, Tweedie R. Trim and fill: A simple funnel-plot-based method of testing and adjusting for publication bias in meta-analysis. Biometrics. 2000;56:455-63
21. Greenland S, Longnecker MP. Methods for trend estimation from summarized dose-response data, with applications to meta-analysis. Am J Epidemiol. 1992;135:1301-9
22. Annema N, Heyworth JS, McNaughton SA, Iacopetta B, Fritschi L. Fruit and vegetable consumption and the risk of proximal colon, distal colon, and rectal cancers in a case-control study in Western Australia. Journal of the American Dietetic Association. 2011;111:1479-90
23. Bao Y, Stolzenberg-Solomon R, Jiao L, Silverman DT, Subar AF, Park Y. et al. Added sugar and sugar-sweetened foods and beverages and the risk of pancreatic cancer in the National Institutes of Health-AARP Diet and Health Study. Am J Clin Nutr. 2008;88:431-40
24. Bener A, Moore MA, Ali R, El Ayoubi HR. Impacts of family history and lifestyle habits on colorectal cancer risk: a case-control study in Qatar. Asian Pacific journal of cancer prevention: APJCP. 2010;11:963-8
25. Bruemmer B, White E, Vaughan TL, Cheney CL. Fluid intake and the incidence of bladder cancer among middle-aged men and women in a three-county area of western Washington. Nutr Cancer. 1997;29:163-8
26. Chan JM, Wang F, Holly EA. Vegetable and fruit intake and pancreatic cancer in a population-based case-control study in the San Francisco bay area. Cancer Epidemiol Biomarkers Prev. 2005;14:2093-7
27. Chan JM, Wang F, Holly EA. Sweets, sweetened beverages, and risk of pancreatic cancer in a large population-based case-control study. Cancer Causes Control. 2009;20:835-46
28. Chandran U, McCann SE, Zirpoli G, Gong Z, Lin Y, Hong CC. et al. Intake of energy-dense foods, fast foods, sugary drinks, and breast cancer risk in African American and European American women. Nutr Cancer. 2014;66:1187-99
29. Chazelas E, Srour B, Desmetz E, Kesse-Guyot E, Julia C, Deschamps V. et al. Sugary drink consumption and risk of cancer: results from NutriNet-Santé prospective cohort. Bmj. 2019;366:l2408
30. De Stefani E, Boffetta P, Deneo-Pellegrini H, Correa P, Ronco AL, Brennan P. et al. Non-alcoholic beverages and risk of bladder cancer in Uruguay. BMC Cancer. 2007;7:57
31. Drake I, Sonestedt E, Gullberg B, Ahlgren G, Bjartell A, Wallström P. et al. Dietary intakes of carbohydrates in relation to prostate cancer risk: a prospective study in the Malmö Diet and Cancer cohort. Am J Clin Nutr. 2012;96:1409-18
32. Dubrow R, Darefsky AS, Freedman ND, Hollenbeck AR, Sinha R. Coffee, tea, soda, and caffeine intake in relation to risk of adult glioma in the NIH-AARP Diet and Health Study. Cancer Causes Control. 2012;23:757-68
33. Ellison LF. Tea and other beverage consumption and prostate cancer risk: a Canadian retrospective cohort study. Eur J Cancer Prev. 2000;9:125-30
34. Farvid MS, Chen WY, Michels KB, Cho E, Willett WC, Eliassen AH. Fruit and vegetable consumption in adolescence and early adulthood and risk of breast cancer: population based cohort study. Bmj. 2016;353:i2343
35. Fung TT, Hu FB, Wu K, Chiuve SE, Fuchs CS, Giovannucci E. The Mediterranean and Dietary Approaches to Stop Hypertension (DASH) diets and colorectal cancer. Am J Clin Nutr. 2010;92:1429-35
36. Gallus S, Turati F, Tavani A, Polesel J, Talamini R, Franceschi S. et al. Soft drinks, sweetened beverages and risk of pancreatic cancer. Cancer Causes Control. 2011;22:33-9
37. Genkinger JM, Li R, Spiegelman D, Anderson KE, Albanes D, Bergkvist L. et al. Coffee, tea, and sugar-sweetened carbonated soft drink intake and pancreatic cancer risk: a pooled analysis of 14 cohort studies. Cancer Epidemiol Biomarkers Prev. 2012;21:305-18
38. Hodge AM, Bassett JK, Milne RL, English DR, Giles GG. Consumption of sugar-sweetened and artificially sweetened soft drinks and risk of obesity-related cancers. Public Health Nutr. 2018;21:1618-26
39. Holick CN, Smith SG, Giovannucci E, Michaud DS. Coffee, tea, caffeine intake, and risk of adult glioma in three prospective cohort studies. Cancer Epidemiol Biomarkers Prev. 2010;19:39-47
40. Hu J, Mao Y, DesMeules M, Csizmadi I, Friedenreich C, Mery L. et al. Total fluid and specific beverage intake and risk of renal cell carcinoma in Canada. Cancer epidemiology. 2009;33:355-62
41. Inoue-Choi M, Robien K, Mariani A, Cerhan JR, Anderson KE. Sugar-sweetened beverage intake and the risk of type I and type II endometrial cancer among postmenopausal women. Cancer Epidemiol Biomarkers Prev. 2013;22:2384-94
42. Jain MG, Hislop GT, Howe GR, Burch JD, Ghadirian P. Alcohol and other beverage use and prostate cancer risk among Canadian men. Int J Cancer. 1998;78:707-11
43. Jensen OM, Wahrendorf J, Knudsen JB, Sørensen BL. The Copenhagen case-control study of bladder cancer. II. Effect of coffee and other beverages. Int J Cancer. 1986;37:651-7
44. Jiang X, Castelao JE, Groshen S, Cortessis VK, Shibata DK, Conti DV. et al. Water intake and bladder cancer risk in Los Angeles County. Int J Cancer. 2008;123:1649-56
45. King MG, Chandran U, Olson SH, Demissie K, Lu SE, Parekh N. et al. Consumption of sugary foods and drinks and risk of endometrial cancer. Cancer Causes Control. 2013;24:1427-36
46. King MG, Olson SH, Paddock L, Chandran U, Demissie K, Lu SE. et al. Sugary food and beverage consumption and epithelial ovarian cancer risk: a population-based case-control study. BMC Cancer. 2013;13:94
47. Lagergren J, Viklund P, Jansson C. Carbonated soft drinks and risk of esophageal adenocarcinoma: a population-based case-control study. J Natl Cancer Inst. 2006;98:1158-61
48. Larsson SC, Bergkvist L, Wolk A. Consumption of sugar and sugar-sweetened foods and the risk of pancreatic cancer in a prospective study. Am J Clin Nutr. 2006;84:1171-6
49. Larsson SC, Giovannucci EL, Wolk A. Sweetened Beverage Consumption and Risk of Biliary Tract and Gallbladder Cancer in a Prospective Study. J Natl Cancer Inst. 2016;108:1-6
50. Lee JE, Hunter DJ, Spiegelman D, Adami HO, Bernstein L, van den Brandt PA. et al. Intakes of coffee, tea, milk, soda and juice and renal cell cancer in a pooled analysis of 13 prospective studies. Int J Cancer. 2007;121:2246-53
51. Lyon JL, Mahoney AW, French TK, Moser R Jr. Coffee consumption and the risk of cancer of the exocrine pancreas: a case-control study in a low-risk population. Epidemiology (Cambridge, Mass). 1992;3:164-70
52. Mahfouz EM, Sadek RR, Abdel-Latief WM, Mosallem FA, Hassan EE. The role of dietary and lifestyle factors in the development of colorectal cancer: case control study in Minia, Egypt. Central European journal of public health. 2014;22:215-22
53. Makarem N, Bandera EV, Lin Y, Jacques PF, Hayes RB, Parekh N. Consumption of Sugars, Sugary Foods, and Sugary Beverages in Relation to Adiposity-Related Cancer Risk in the Framingham Offspring Cohort (1991-2013). Cancer prevention research (Philadelphia, Pa). 2018;11:347-58
54. Marzbani B, Nazari J, Najafi F, Marzbani B, Shahabadi S, Amini M. et al. Dietary patterns, nutrition, and risk of breast cancer: a case-control study in the west of Iran. Epidemiology and health. 2019;41:e2019003
55. Mayne ST, Risch HA, Dubrow R, Chow WH, Gammon MD, Vaughan TL. et al. Carbonated soft drink consumption and risk of esophageal adenocarcinoma. J Natl Cancer Inst. 2006;98:72-5
56. McCullough ML, Teras LR, Shah R, Diver WR, Gaudet MM, Gapstur SM. Artificially and sugar-sweetened carbonated beverage consumption is not associated with risk of lymphoid neoplasms in older men and women. J Nutr. 2014;144:2041-9
57. Miles FL, Neuhouser ML, Zhang ZF. Concentrated sugars and incidence of prostate cancer in a prospective cohort. Br J Nutr. 2018;120:703-10
58. Mueller NT, Odegaard A, Anderson K, Yuan JM, Gross M, Koh WP. et al. Soft drink and juice consumption and risk of pancreatic cancer: the Singapore Chinese Health Study. Cancer Epidemiol Biomarkers Prev. 2010;19:447-55
59. Navarrete-Muñoz EM, Wark PA, Romaguera D, Bhoo-Pathy N, Michaud D, Molina-Montes E. et al. Sweet-beverage consumption and risk of pancreatic cancer in the European Prospective Investigation into Cancer and Nutrition (EPIC). Am J Clin Nutr. 2016;104:760-8
60. Nöthlings U, Murphy SP, Wilkens LR, Henderson BE, Kolonel LN. Dietary glycemic load, added sugars, and carbohydrates as risk factors for pancreatic cancer: the Multiethnic Cohort Study. Am J Clin Nutr. 2007;86:1495-501
61. Pacheco LS, Anderson CAM, Lacey JV Jr, Giovannucci EL, Lemus H, Araneta MRG. et al. Sugar-sweetened beverages and colorectal cancer risk in the California Teachers Study. PLoS One. 2019;14:e0223638
62. Polesel J, Serraino D, Negri E, Barzan L, Vaccher E, Montella M. et al. Consumption of fruit, vegetables, and other food groups and the risk of nasopharyngeal carcinoma. Cancer Causes Control. 2013;24:1157-65
63. Potischman N, Coates RJ, Swanson CA, Carroll RJ, Daling JR, Brogan DR. et al. Increased risk of early-stage breast cancer related to consumption of sweet foods among women less than age 45 in the United States. Cancer Causes Control. 2002;13:937-46
64. Pourfarzi F, Whelan A, Kaldor J, Malekzadeh R. The role of diet and other environmental factors in the causation of gastric cancer in Iran-a population based study. Int J Cancer. 2009;125:1953-60
65. Rashidkhani B, Lindblad P, Wolk A. Fruits, vegetables and risk of renal cell carcinoma: a prospective study of Swedish women. Int J Cancer. 2005;113:451-5
66. Ren JS, Freedman ND, Kamangar F, Dawsey SM, Hollenbeck AR, Schatzkin A. et al. Tea, coffee, carbonated soft drinks and upper gastrointestinal tract cancer risk in a large United States prospective cohort study. Eur J Cancer. 2010;46:1873-81
67. Rizk M, Guilloteau A, Mouillot T, Thiefin G, Bronowicki JP, Richou C. et al. Dietary components modulate the risk of hepatocellular carcinoma in cirrhotic patients. Nutr Res. 2019;61:82-94
68. Romanos-Nanclares A, Toledo E, Gardeazabal I, Jiménez-Moleón JJ, Martínez-González MA, Gea A. Sugar-sweetened beverage consumption and incidence of breast cancer: the Seguimiento Universidad de Navarra (SUN) Project. Eur J Nutr. 2019;58:2875-86
69. Ros MM, Bas Bueno-de-Mesquita HB, Buchner FL, Aben KK, Kampman E, Egevad L. et al. Fluid intake and the risk of urothelial cell carcinomas in the European Prospective Investigation into Cancer and Nutrition (EPIC). Int J Cancer. 2011;128:2695-708
70. Sánchez MJ, Martínez C, Nieto A, Castellsagué X, Quintana MJ, Bosch FX. et al. Oral and oropharyngeal cancer in Spain: influence of dietary patterns. Eur J Cancer Prev. 2003;12:49-56
71. Schernhammer ES, Bertrand KA, Birmann BM, Sampson L, Willett WC, Feskanich D. Consumption of artificial sweetener- and sugar-containing soda and risk of lymphoma and leukemia in men and women. Am J Clin Nutr. 2012;96:1419-28
72. Schernhammer ES, Hu FB, Giovannucci E, Michaud DS, Colditz GA, Stampfer MJ. et al. Sugar-sweetened soft drink consumption and risk of pancreatic cancer in two prospective cohorts. Cancer Epidemiol Biomarkers Prev. 2005;14:2098-105
73. Sharpe CR, Siemiatycki J. Consumption of non-alcoholic beverages and prostate cancer risk. Eur J Cancer Prev. 2002;11:497-501
74. Stepien M, Duarte-Salles T, Fedirko V, Trichopoulou A, Lagiou P, Bamia C. et al. Consumption of soft drinks and juices and risk of liver and biliary tract cancers in a European cohort. Eur J Nutr. 2016;55:7-20
75. Talamini R, Barón AE, Barra S, Bidoli E, La Vecchia C, Negri E. et al. A case-control study of risk factor for renal cell cancer in northern Italy. Cancer Causes Control. 1990;1:125-31
76. Theodoratou E, Farrington SM, Tenesa A, McNeill G, Cetnarskyj R, Korakakis E. et al. Associations between dietary and lifestyle risk factors and colorectal cancer in the Scottish population. Eur J Cancer Prev. 2014;23:8-17
77. Turati F, Bosetti C, Polesel J, Zucchetto A, Serraino D, Montella M. et al. Coffee, Tea, Cola, and Bladder Cancer Risk: Dose and Time Relationships. Urology. 2015;86:1179-84
78. Zhang X, Albanes D, Beeson WL, van den Brandt PA, Buring JE, Flood A. et al. Risk of colon cancer and coffee, tea, and sugar-sweetened soft drink intake: pooled analysis of prospective cohort studies. J Natl Cancer Inst. 2010;102:771-83
79. Barrington WE, White E. Mortality outcomes associated with intake of fast-food items and sugar-sweetened drinks among older adults in the Vitamins and Lifestyle (VITAL) study. Public Health Nutr. 2016;19:3319-26
80. Fuchs MA, Sato K, Niedzwiecki D, Ye X, Saltz LB, Mayer RJ. et al. Sugar-sweetened beverage intake and cancer recurrence and survival in CALGB 89803 (Alliance). PLoS One. 2014;9:e99816
81. Fung TT, Kashambwa R, Sato K, Chiuve SE, Fuchs CS, Wu K. et al. Post diagnosis diet quality and colorectal cancer survival in women. PLoS One. 2014;9:e115377
82. Guercio BJ, Zhang S, Niedzwiecki D, Li Y, Babic A, Morales-Oyarvide V. et al. Associations of artificially sweetened beverage intake with disease recurrence and mortality in stage III colon cancer: Results from CALGB 89803 (Alliance). PLoS One. 2018;13:e0199244
83. Khan MM, Goto R, Kobayashi K, Suzumura S, Nagata Y, Sonoda T. et al. Dietary habits and cancer mortality among middle aged and older Japanese living in hokkaido, Japan by cancer site and sex. Asian Pacific journal of cancer prevention: APJCP. 2004;5:58-65
84. Malik VS, Li Y, Pan A, De Koning L, Schernhammer E, Willett WC. et al. Long-Term Consumption of Sugar-Sweetened and Artificially Sweetened Beverages and Risk of Mortality in US Adults. Circulation. 2019;139:2113-25
85. Miles FL, Chang SC, Morgenstern H, Tashkin D, Rao JY, Cozen W. et al. Association of sugary beverages with survival among patients with cancers of the upper aerodigestive tract. Cancer Causes Control. 2016;27:1293-300
86. Mullee A, Romaguera D, Pearson-Stuttard J, Viallon V, Stepien M, Freisling H. et al. Association Between Soft Drink Consumption and Mortality in 10 European Countries. JAMA internal medicine. 2019;179:1479-90
87. Odegaard AO, Koh WP, Yuan JM, Pereira MA. Beverage habits and mortality in Chinese adults. J Nutr. 2015;145:595-604
88. Tasevska N, Park Y, Jiao L, Hollenbeck A, Subar AF, Potischman N. Sugars and risk of mortality in the NIH-AARP Diet and Health Study. Am J Clin Nutr. 2014;99:1077-88
89. Zhang YB, Chen JX, Jiang YW, Xia PF, Pan A. Association of sugar-sweetened beverage and artificially sweetened beverage intakes with mortality: an analysis of US National Health and Nutrition Examination Survey. Eur J Nutr. 2020;74:1-11
90. Boyle P, Koechlin A, Autier P. Sweetened carbonated beverage consumption and cancer risk: meta-analysis and review. Eur J Cancer Prev. 2014;23:481-90
91. Milajerdi A, Larijani B, Esmaillzadeh A. Sweetened Beverages Consumption and Pancreatic Cancer: A Meta-Analysis. Nutr Cancer. 2019;71:375-84
92. von Philipsborn P, Stratil JM, Burns J, Busert LK, Pfadenhauer LM, Polus S. et al. Environmental interventions to reduce the consumption of sugar-sweetened beverages and their effects on health. Cochrane Database Syst Rev. 2019;6:Cd012292
93. Ferreira-Pego C, Babio N, Bes-Rastrollo M, Corella D, Estruch R, Ros E. et al. Frequent Consumption of Sugar- and Artificially Sweetened Beverages and Natural and Bottled Fruit Juices Is Associated with an Increased Risk of Metabolic Syndrome in a Mediterranean Population at High Cardiovascular Disease Risk. J Nutr. 2016;146:1528-36
94. Anderson JJ, Gray SR, Welsh P, Mackay DF, Celis-Morales CA, Lyall DM. et al. The associations of sugar-sweetened, artificially sweetened and naturally sweet juices with all-cause mortality in 198,285 UK Biobank participants: a prospective cohort study. BMC Med. 2020;18:97
95. Augustin LS, Kendall CW, Jenkins DJ, Willett WC, Astrup A, Barclay AW. et al. Glycemic index, glycemic load and glycemic response: An International Scientific Consensus Summit from the International Carbohydrate Quality Consortium (ICQC). Nutr Metab Cardiovasc Dis. 2015;25:795-815
96. Avgerinos KI, Spyrou N, Mantzoros CS, Dalamaga M. Obesity and cancer risk: Emerging biological mechanisms and perspectives. Metabolism. 2019;92:121-35
97. Roberts DL, Dive C, Renehan AG. Biological mechanisms linking obesity and cancer risk: new perspectives. Annual review of medicine. 2010;61:301-16
98. Wiseman M. The second World Cancer Research Fund/American Institute for Cancer Research expert report. Food, nutrition, physical activity, and the prevention of cancer: a global perspective. The Proceedings of the Nutrition Society. 2008;67:253-6
99. Nardin T, Barnaba C, Abballe F, Trenti G, Malacarne M, Larcher R. Fast analysis of quaternary ammonium pesticides in food and beverages using cation-exchange chromatography coupled with isotope-dilution high-resolution mass spectrometry. Journal of separation science. 2017;40:3928-37
100. Mostafalou S, Abdollahi M. Pesticides: an update of human exposure and toxicity. Archives of toxicology. 2017;91:549-99
101. Mehta RS, Song M, Staller K, Chan AT. Association Between Beverage Intake and Incidence of Gastroesophageal Reflux Symptoms. Clinical gastroenterology and hepatology: the official clinical practice journal of the American Gastroenterological Association. 2019;18:2226-33
Author contact
![]() Corresponding author: Mr Shaohui Tang, PD; Department of Gastroenterology, The First Affiliated Hospital, Jinan University, Guangzhou, Guangdong 510630, P. R. China, E-mail: tangshaohui206edu.cn, Tel.:+86-020-38688929.
Corresponding author: Mr Shaohui Tang, PD; Department of Gastroenterology, The First Affiliated Hospital, Jinan University, Guangzhou, Guangdong 510630, P. R. China, E-mail: tangshaohui206edu.cn, Tel.:+86-020-38688929.