Impact Factor ISSN: 1837-9664

 Global reach, higher impact
J Cancer 2021; 12(7):1967-1977. doi:10.7150/jca.52455 This issue Cite
Research Paper
Reduced miR-16 levels are associated with VEGF upregulation in high-risk myelodysplastic syndromes
Bei Xiong1 ![]() *, Yanbo Nie2*, Yalan Yu1, Shixuan Wang3, Xuelan Zuo1
*, Yanbo Nie2*, Yalan Yu1, Shixuan Wang3, Xuelan Zuo1 ![]()
1. Department of Hematology, Zhongnan Hospital of Wuhan University, Wuhan, China.
2. Sino-us-diagnostics, Tianjin, China.
3. Department of Hematology, The First Affiliated Hospital of Nanchang University, Nanchang, China.
* These authors contributed equally to this work.
Received 2020-8-26; Accepted 2020-12-26; Published 2021-1-30
Abstract

Objective: Overexpression of vascular endothelial growth factor (VEGF), a major angiogenic factor, was found in myelodysplastic syndromes (MDS) and showed different expression statuses in different risk groups of MDS. We aimed to investigate the possible role of microRNA (miR)-15a and miR-16 on the regulation of VEGF expression and their effect on angiogenesis in lower- and higher-risk MDS.
Methods: We studied peripheral blood and bone marrow samples of MDS patients or several leukaemia and MDS cell lines by enzyme-linked immunosorbent assay, immunohistochemical staining, immunofluorescence and quantitative PCR for expression levels of VEGF, miR-15a and miR-16. MiRNA transfection and Luciferase reporter assays were conducted to investigate whether VEGF is a target of miR-16. Migration and tube formation assays were performed in cells exposed to medium from cells with overexpressed or knockdown miR-16.
Results: It showed a significantly lower level of miR-16 in higher-risk MDS patients, while the VEGF levels were upregulated. Inverse correlation between VEGF and miR-16 were determined in cells lines including SKM-1, THP-1, and K562 cells. Overexpression of miR-16 in SKM-1 cells resulted in reduced VEGF secretion and cell protein levels. Direct binding of miR-16 to the 3' untranslated region (3'-UTR) of VEGF was confirmed by luciferase reporter assays. The migration and tube formation of human umbilical vein endothelial cells decreased in the presence of medium from SKM-1 cells with overexpressed miR-16.
Conclusion: These data suggest that miR-16 may play a role in angiogenesis in higher-risk MDS by targeting VEGF and therefore modulating MDS progression. MiR-16 might be a novel therapeutic target in higher-risk MDS.
Keywords: myelodysplastic syndromes, vascular endothelial growth factor, miR-16, angiogenesis, SKM-1 cells.
Introduction
Myelodysplastic syndromes (MDS) are a heterogeneous group of haematological disorders characterised by dysplastic and ineffective hematopoiesis, peripheral cytopenias, and increased risk of transformation to acute myeloid leukaemia (AML) [1, 2]. The prognosis varies a lot, ranging from a few months to more than 10 years [3, 4]. Low-risk MDS often show hypercellularity in bone marrow and display increased apoptosis of haematopoietic progenitors. In contrast, high-risk MDS always link to a reduced level of apoptosis [5-7]. Vascular endothelial growth factor (VEGF), a chief angiogenic factor, has attracted much attention for its critical role involved in regulating haematopoietic cells in addition to its role in angiogenesis and vasculogenesis [8, 9]. Its deregulation promotes tumour proliferation and angiogenesis by stimulating endothelial as well as leukemic cells [10].
Several studies using different methods have revealed that VEGF is aberrantly expressed in low- and high-risk MDS [11-14]. By western blotting and radioimmunoassay, Verstovstek et al. showed that increased VEGF expression in bone marrow samples of MDS patients is associated with decreased survival [11]. Wimazal et al. demonstrated the correlation among the expression of VEGF mRNA, the percentage of immature myeloid cells, and the French- American-British (FAB) classification in the bone marrow of MDS patients [12]. Gianelli et al. revealed a higher expression of VEGF levels normalised for bone marrow cellularity (VEGF index [VEGFi]) in the “very high risk” group than in the “very low risk” group according to the World Health Organization (WHO) classification-based prognostic scoring system (WPSS) by immunohistochemistry. High VEGFi predicted transfusion dependence and was inversely correlated with overall survival and leukaemia-free survival [13]. In addition, Bellamy et al. demonstrated a higher immunohistochemical expression of VEGF receptors in the bone marrow of high-risk MDS than in low-risk MDS patients and healthy controls [14]. The strong immunohistochemical co-expression of VEGF and its receptors in myeloblasts and immature myeloid elements of MDS bone marrow indicated that an autocrine loop of VEGF may facilitate self-renewal of leukaemia progenitors [14]. These findings illustrate that, whereas apoptosis is increased in MDS patients with low-risk, the disease with progression into high-risk stage exhibit an acquired resistance to apoptosis and aberrant expression of VEGF. Therefore, we decided to investigate the mechanism of the dysregulation of VEGF in MDS and whether it contributes to disease progression. The recognition of the differences in molecular pathways between low- and high-risk MDS will hopefully provide important information in future targeted therapies.
MicroRNAs (miRNAs) are endogenous, single stranded molecules of about 22 nucleotides in length, which attract widespread attention for their significant regulatory roles in various biological processes [15-17]. Emerging evidences have demonstrated aberrant expression of miRNAs in hematologic cancers, suggesting possible roles for miRNAs involved in haematopoiesis and tumorigenesis [18-20]. We hypothesised that changes in the levels of one or more miRNAs might be involved in the increased expression of VEGF in high-risk MDS. Few studies have investigated the role of miRNAs in VEGF expression. A small number of studies have shown that microRNA (miR)-15a and miR-16 inhibit VEGF expression in lymphoma and multiple myeloma cell lines [21, 22], but whether these miRNAs contribute to the regulation of VEGF in MDS has not been studied yet. In this report, we investigated the expression status of miR-15a and miR-16 in MDS and their correlation with disease stages, and verified the possible role of miRNAs on the regulation of VEGF expression and their effect on angiogenesis in MDS.
Materials and methods
Cells and cell culture
Bone marrow samples from 80 new cases of MDS and 20 healthy controls at the Hematology Department of Zhongnan Hospital of Wuhan University were collected, followed by isolation of bone marrow mononuclear cells using Ficoll-Hypaque (Haoyang Biotechnology, Tianjin, China) gradient centrifugation. Then the enrichment of CD34+ cells from bone marrow mononuclear cells were performed according to a standard protocol using a CD34+ MicroBead kit (Miltenyi Biotec, Auburn, CA, USA). The purity of CD34+ cells was ≥90% by fluorescence-activated cell sorting (FACS) using a flow cytometer (BD Biosciences, San Jose, CA, USA). Written informed consents were obtained from all participants, and this study was approved by the research ethics committee of Wuhan University. The human MDS cell line (SKM-1), was donated by the Union Hospital of Huazhong University of Science and Technology, and leukaemia cell lines (K562, HL-60, THP-1) were kindly provided by the Institute of Hematology & Hospital of Blood Diseases Chinese Academy of Medical Sciences, China. SKM-1, K562, HL-60, and THP-1 cells were cultured in RPMI 1640 medium (Hyclone, Logan, UT, USA), while 293T cells were grown in Dulbecco's modified Eagle's medium (DMEM; Sigma-Aldrich, San Francisco, USA) supplemented with 10% foetal bovine serum (FBS; Gibco, MD, USA) and 2 mM L-glutamine and penicillin/streptomycin (Gibco, MD, USA). Human umbilical vein endothelial cells (HUVEC, from American Type Culture Collection [ATCC], Manassas, VA, USA) were maintained in Endothelial Cell Basal Medium (EBM) completed with 5 ng/mL recombinant human (rh) VEGF, 5 ng/mL rh epidermal growth factor (EGF), 5 ng/mL rh- basic fibroblast growth factor (b-FGF), 15 ng/mL rh- Insulin-like growth factor 1 (IGF-1), 10 mM l-glutamine, 0.75 units/mL heparin sulphate, 1 µg/mL hydrocortisone, 2% foetal bovine serum, and 50 µg/mL ascorbic acid. The cells were cultured in a humidified incubator at 37 °C with 95% air and 5% CO2.
MiRNAs transfection
The miR-16 mimics (5ʹ-UAGCAGCACGUAAAUAUUGGCG-3ʹ), inhibitor (5ʹ-CGCCAAUAUUUACGUGCUGCUA-3ʹ), and negative control (5ʹ-UUCU CCGAACGUGUCACGUTT-3ʹ) with FAM fluorescence were purchased from GenePharma Co., Ltd. (Shanghai, China). Transfection of mimics or inhibitor was performed with Lipofectamine™ 2000 (Invitrogen, Thermo Fisher Scientific, Inc.) according to the manufacturer's instructions. Firstly, add 40-100pmol miR-16 mimics/inhibitor and 1µl lipofectamin reagent to the 50 µl DMEM serum free medium respectively, and mix them thoroughly in room temperature for 20 min, then 400µl cells suspension (about 4.0×10⁵ cells) were added to them and evenly distributed to 12 wells. Secondly, the cells were cultured in a humidified incubator at 37 °C with 95% air and 5% CO2. The transfection efficiency was about 90% as assessed by FACS. Cells were harvested 48 h-72 h after transfection for further analyses.
MiRNAs RT-qPCR
Total RNA was extracted using TRIzol reagent (Invitrogen, Carlsbad, CA, USA) according to the manufacturer's instructions. cDNA was synthesised from total mRNA (2 μg) in 20μL reactions using a reverse transcriptase and miR-15a, miR-16, or U6 primers obtained from Invitrogen at 37 °C for 1 h. For measuring the expression of mature miR-15a and miR-16, a polyA qPCR analysis was performed. The primers specific for miR-15a and miR-16 were 5ʹ-UAGCAGCACAUAAUGGUUUGUG-3ʹ and 5ʹ- UAGCAGCACGUAAAUAUUGGCG-3ʹ, respectively. The reactions were performed in a 7500 Real-Time PCR System (Applied Biosystems, USA), using the U6 small nuclear RNA (specific primer: 5ʹ- CTCGCTTCGGCAGCACA-3ʹ) as an internal control. The qPCR reaction condition was performed by pre-denaturation (94˚C for 2 min) and denaturation with 45 cycles (94˚C for 2 min), annealing (62˚C for 34 sec), and extension (72˚C for 10 s) with 45 cycles. The relative expression was calculated using the 2-ΔΔCt method [23]. All qPCR assays were performed in triplicate.
3'-untranslated region (UTR) luciferase constructs generation and luciferase assays
Luciferase plasmids containing the wild-type or mutated miR-16 binding site in the 3'UTR of the VEGF mRNA was chemically synthesised by GenePharma Co., Ltd. (Shanghai, China). This sequence was cloned downstream of the stop codon in the psiCheck-2 vector (Promega, Madison, WI, USA) to generate the VEGF 3'UTR reporter. The primers used for the luciferase reporter plasmid construction are listed in Table 1. The 293T cells were grown in 24-well plates and co-transfected with luciferase reporters containing WT and mutant 3′-UTR of VEGF, and pre-miR-16 precursor or controls using Lipofectamine™ 2000, according to the manufacturer's instructions. Luciferase activity was measured using the Dual Luciferase Assay kit (Promega, USA). The relative luciferase activity was obtained by normalisation to the Renilla luciferase activity.
Primers used for luciferase reporter plasmid construction
| Primer name | Sequence oligonucleotide (5'-3') |
|---|---|
| VEGF-UTR-Forward | TAGGCGATCGCTCGAGGCCGGGCAGGAGGA A |
| VEGF-UTR-Reverse | AATTCCCGGGCTCGAGTGAGATCAGAATTA |
| VEGF-Mut(16)-Forward | TTCTACGACGAAAATCACCGAGCCCGGAAG |
| VEGF-Mut(16)-Reverse | ATTTTCGTCGTAGAAAAATAAAATGGCGAATCC |
VEGF, Vascular endothelial growth factor; UTR, untranslated region; Mut, mutant.
Enzyme-linked immunosorbent assay (ELISA)
The levels of VEGF and other pro-angiogenic factors (b-FGF, connective tissue growth factor [CTGF], and matrix metalloproteinase-2 [MMP-2]) in culture supernatants were measured using specific ELISA kits (Neobioscience, Shenzhen, China) according to the manufacturer's instructions. Collected supernatants, blank control, and standard samples were transferred into a 96-well plate and incubated at 37 °C for 90 min, and then the supernatants were discarded, followed by washing with a washing buffer for 5 times. Biotinylated antibody was added into the wells of MDS and healthy controls, while Biotinylated antibody diluent was added into the blank control well and incubated at 37 °C for 60 min. The supernatants were then discarded, and the wells were washed 5 times. Enzyme conjugates were added and incubated at 37 °C for 30 min; the supernatants were then discarded, and the wells were washed 5 times. A chromogenic substrate was added and incubated at 37 °C for 15 min. Finally, a stop solution was added into the wells and the absorbance was measured using a microplate reader (Bio-Rad, USA) with optical density (OD) values at 450 nm.
Western blotting analysis
Protein extraction and western blotting were performed as described previously [24]. Briefly, 30-60 μg cell lysates were subjected to sodium dodecyl sulphate-polyacrylamide gel electrophoresis, transferred to nitrocellulose membranes, and blotted with a rabbit polyclonal anti-VEGF antibody (1:1,000, ab46154, Abcam, Burlingame, CA, USA) overnight at 4 ˚C. After washing three times with Tris-buffered saline with Tween-20 (TBST; Sigma-Aldrich, USA), the membranes were incubated with a horseradish peroxidase (HRP)-conjugated secondary antibody (1:1,000; sc-2012; Santa Cruz Biotechnology, Santa Cruz, CA, USA) at 37 ˚C for 2 h. The membranes were stripped using a western blot stripping buffer (Pierce, Rockford, IL, USA) and re-incubated with GAPDH (1:2,000; CST-#2118, Cell Signaling Technology, Danvers, MA, USA) to verify equal protein loading.
Immunohistochemical staining (IHC)
Paraffin sections sliced from bone marrow specimens of MDS patients and healthy controls were deparaffinised twice for 10 min and then rehydrated with doubled distilled (dd)H2O. Subsequently, the slides were heated in 10 mM citrate buffer (pH 6.0) and treated with 3% H2O2 in phosphate-buffered saline (PBS) for 10 min, blocked with 5% normal goat serum, and incubated with a mouse monoclonal anti-VEGFA antibody (1:1,000; ab1316, Abcam, CA, USA) at 4 ºC overnight. Next, the slides were incubated with an HRP-Polymer-conjugated secondary antibody (Maixin, Shanghai, China) at 37 °C for 1 h. The slides were then stained with diaminobenzidine (DAB) for 3 min and counterstained with haematoxylin. Three fields were selected for examination with an inverted microscope (Olympus, Tokyo, Japan). The integrated optical density (IOD) of VEGF expressions were measured by Image-Pro Plus 6.0 software (Media Cybernetics, Siver Spring, MD, U.S.A.).
Immunofluorescence (IF)
The number of cells in cell suspensions (K562, THP-1, SKM-1, and HL-60) was counted and adjusted to 1.5 × 10⁴/100 µL. Cells were centrifuged for 10 min at 450 g to allow their adhesion to the slides, and then washed three times with PBS (5 min/wash) and fixed with 4% paraformaldehyde for 15 min. The slides were then incubated with 0.25% bovine serum albumin for 5 min and 0.05%Triton X-100 in the slides for 5 min. After incubation with a rabbit polyclonal anti-VEGF antibody (1:1,000, ab46154, Abcam, CA, USA) overnight at 4˚C, the slides were incubated with a green fluorescence-labelled goat anti-rabbit secondary antibody (1:1000, sc-2012, Santa Cruz, CA, USA) for 60 min at 37 ˚C in the dark. Nuclei were stained with 4',6-diamidino-2-phenylindole (DAPI) in the dark for 10 min. The slides were then observed using a fluorescence microscope (Leica, Germany).
HUVEC tube formation and cell migration assays
HUVECs tube formation on Matrigel (BD Biosciences, Bedford, MA, USA) was evaluated as previously described [25]. At least, 30 min before the experiment, 48-well plates were coated with Matrigel (BD, Biosciences, USA) at 4 ºC. Next, trypsin-harvested HUVECs were seeded onto the Matrigel-coated plates (2 × 10⁴ cells per well) in serum-free EBM and incubated at 37 ˚C for 12 h. The supernatant of K562 cells overexpressing or silenced for miR-16, or medium from the control group was added to each well at a dilution of 1:1 (final volume/well, 500 μL). Images showing the formation of capillary-like structures were obtained after 12 h with an inverted microscope (Olympus, Tokyo, Japan) at 200× magnification.
Cell migration assays were performed using Transwells with 6.5 mm diameter and 8 μm pore size (Corning, Corning, NY, USA). HUVECs (1-2 × 10⁴ cells) were seeded in the upper chambers, while the lower chambers were filled with 500 µL of the supernatant of K562 cells overexpressing or silenced for miR-16 and incubated at 37 °C for about 36 h. The cells in the upper chamber were then removed using cotton swabs. Cells migrating into the bottom of the membrane were stained with 0.1% crystal violet for 20 min at 37 °C and washed with PBS. Four random fields from each membrane were photographed under an inverted microscope and counted for statistical analysis.
Statistical analysis
All data are indicated as mean ± the standard deviation (SD). All results were analysed using the SPSS 24.0 software (IBM Corp., Armonk, NY, USA). One-way analysis of variance, or the Mann-Whitney U-test non-parametric alternative, were used for the analysis of differences between groups, as appropriate. Results were considered significantly different for P values < 0.05. All experiments were performed at least three times to ensure their reproducibility.
Results
VEGF levels are significantly higher and miR-16 is downregulated in higher-risk MDS
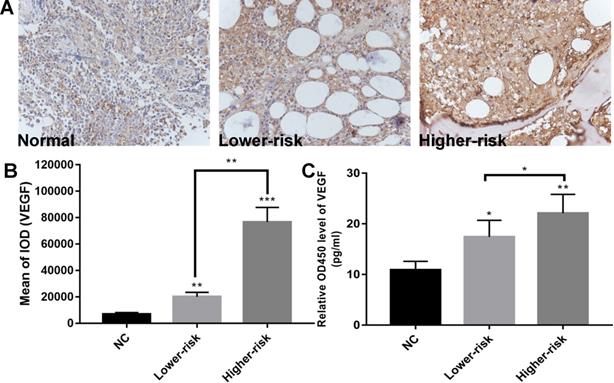
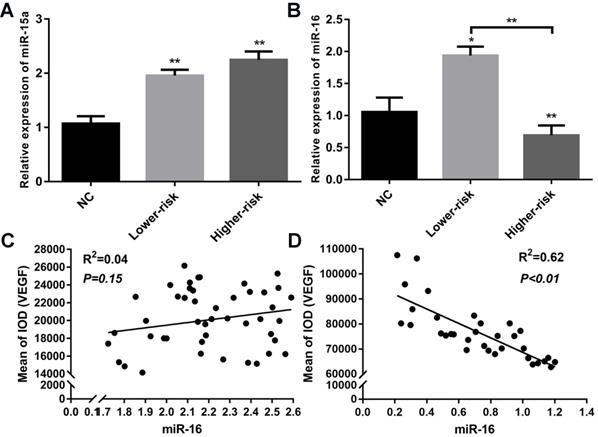
MDS patients were classified into two large groups, a lower-risk group (very low and low IPSS-R risk) and a higher-risk group (intermediate, high, and very high IPSS-R risk) (n=47 and 33, respectively) according to the Revised International Prognostic Scoring System (IPSS-R)[26] (Table 2). To identify the VEGF expression in MDS bone marrow samples, we performed IHC of VEGF on bone marrow biopsies. It showed increased expression of VEGF in MDS patients compared with healthy controls. And MDS patients with higher-risk exhibited a stronger positive immunostaining than MDS patients with lower-risk (Figure 1A-B). The secretion of VEGF in peripheral blood of MDS patients and controls was examined by ELISA. As shown in Figure 1C, VEGF secretion in patients with MDS (lower- and higher-risk) was higher than that in healthy subjects (P < 0.05 and P < 0.01, respectively) and VEGF secretion was significantly increased in the higher-risk group compared with the lower-risk group (P < 0.05). To investigate whether the upregulation of VEGF was associated with changes in miR-15a and miR-16 levels, we performed qPCR assays on freshly purified MDS CD34+ cells and normal CD34+ cells. The levels of miR-15a were significantly higher in patients with both lower-risk and higher-risk MDS than in healthy controls (P < 0.01). No significant difference in miR-15a levels was found between lower-risk and higher-risk MDS (Figure 2A). The levels of miR-16 were remarkably lower in higher-risk MDS patients and significantly higher in healthy individuals and lower-risk MDS patients (Figure 2B). Because higher-risk MDS patients have increased bone marrow angiogenesis, we hypothesised that the reduction in miR-16 levels might be involved in angiogenesis of MDS. Correlation analyses were performed to explore the relationships between miR-16 expression and VEGF expression on bone marrow biopsies in lower and higher-risk MDS patients (Figure 2C-D). Negative correlations between miR-16 levels and VEGF expression levels (R2=0.62, P<0.01) were determined in higher-risk MDS patients.
Clinical characteristics of MDS patients
| Features | |
|---|---|
| No. of patients | 80 |
| Sex, M/F | 41/39 |
| Age(years), median (range) | 53 (24-82) |
| WBC (109/L), median (range) | 3.5 (0.5-15.9) |
| Neutrophils(109/L), median (range) | 0.9 (0-8.1) |
| Hemoglobin (g/L), median (range) | 68 (40-153) |
| RBC (1012/L), median (range) | 2.7 (3.1-5.6) |
| Platelets (109/L), median (range) | 64 (5-571) |
| MCV (fL), median (range) | 101 (70-125) |
| WHO subgroups | |
| MDS-SLD | 14(17.5%) |
| MDS-MLD | 32 (40.0%) |
| MDS-U | 11(13.8%) |
| MDS-EB-I | 12 (15.0%) |
| MDS-EB-II | 11 (13.8%) |
| IPSS-R risk groups | |
| Very Low | 12(15.0%) |
| Low | 35 (43.7%) |
| Intermediate | 13 (16.3%) |
| High | 12 (15.0%) |
| Very High | 8 (10.0%) |
WBC: white blood cells; RBC: red blood cell; MCV: mean corpuscular volume; MDS-SLD: MDS with single lineage dysplasia; MDS-MLD: MDS with multilineage dysplasia; MDS-U: MDS-unclassifiable; MDS-EB-1: MDS with excess blasts-1; MDS-EB-2: MDS with excess blasts- 2; IPSS-R: Revised-International Prognostic Scoring System.
Aberrantly high expression of VEGF and down-regulated expression of miR-16 in high-risk MDS. (A) Representative immunohistochemical images of VEGF in MDS patients and controls. (B) Bar graph of the cumulative VEGF expression levels of different MDS risk patients (lower vs higher) vs healthy controls. Up-regulated expression of VEGF in the MDS patients compared with normal controls and stronger VEGF immunostaining in higher-risk MDS patients than in lower-risk MDS patients as revealed by immunohistochemistry. Staining was quantified by mean of integrated optical density (IOD). (C) ELISA reveals significantly higher VEGF secretion in MDS patients compared with normal controls and increased VEGF secretion in higher-risk MDS patients compared with lower-risk MDS. * P<0.05, **P<0.01, ***P<0.001.
Aberrantly down-regulated expression of miR-16 and inverse correlation between miR-16 and VEGF expression in high-risk MDS. (A) CD34+cells from MDS patients and healthy controls were used to extract total RNA. RT-PCR of miR-15a revealed both lower-risk and higher-risk MDS patients had significantly higher miR-15a levels compared with normal controls. (B) RT-PCR of miR-16 revealed the expression level of miR-16 was remarkably lower in higher-risk MDS patients compared with normal controls and lower-risk patients. (C) Correlation analysis between miR-16 expression levels and VEGF expression levels in MDS lower-risk patients. (D) Correlation analysis between miR-16 expression levels and VEGF expression levels in MDS higher-risk patients. * P<0.05, **P<0.01.
Inverse correlation between VEGF and miR-16 in cells lines
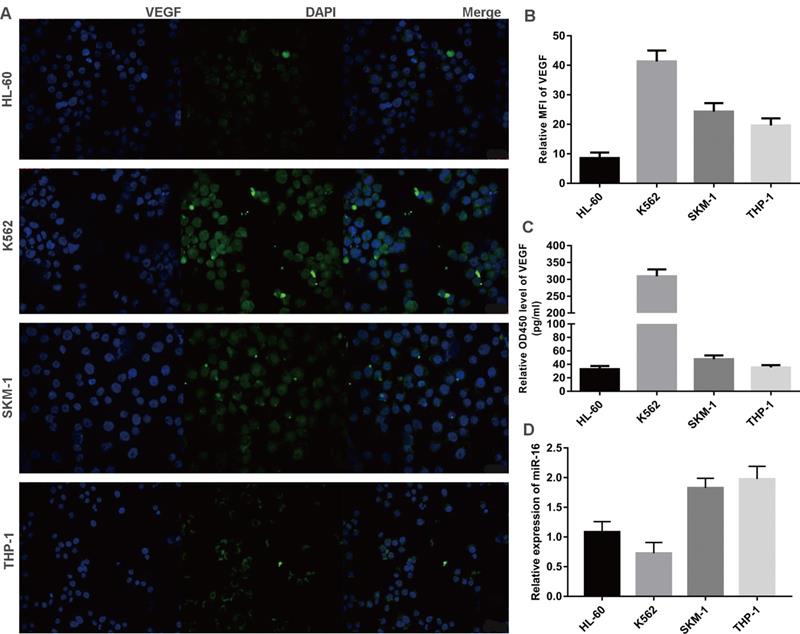
Three leukaemia cell lines (K562, THP-1, HL-60) and a MDS cell line (SKM-1) were analysed for VEGF and miR-16 expression. VEGF levels in exponentially growing cells were measured by immunofluorescence and the mean fluorescence intensity (MFI) was calculated, while the secretion of VEGF was determined by ELISA. As shown in Figure 3A-C, VEGF was expressed at high levels in K562 and SKM-1 cells. The levels of VEGF protein expression and secretion (mean ± SD) in the four cell lines were as follows (from high to low): K562, 40.36 ± 3.36 and 321.70 ± 20.29; SKM-1, 26.73 ± 1.66 and 48.93 ± 6.63; THP-1, 20.86 ± 0.50 and 35.74 ± 4.88; and HL-60, 8.97 ± 1.63 and 33.30 ± 6.96). qPCR showed that the levels of miR-16 (mean ± SD) were as follows (from low to high): K562, 0.72 ± 0.27; HL-60, 1.12 ± 0.16; SKM-1, 1.83 ± 0.13; and THP-1, 1.92 ± 0.16 (Figure 3D). These data indicate that the levels of VEGF are inversely correlated with those of miR-16 in SKM-1, THP-1, and K562 cells, but not in HL-60 cells.
Inverse correlation between VEGF and miR-16 in cells lines (A) VEGF expression in four cell lines (K562, THP-1, HL-60 and SKM-1) were detected by immunofluorescence techniques. Representative images were taken to assess the expression level by confocal microscopy (×200 magnification). (B) MFI was measured by Volocity Demo6.1.1 software. (C) The secretion of VEGF in cell lines were tested by ELISA. (D) The miR-16 levels in cell lines were measured by qRT-PCR.
VEGF expression is inhibited by miR-16
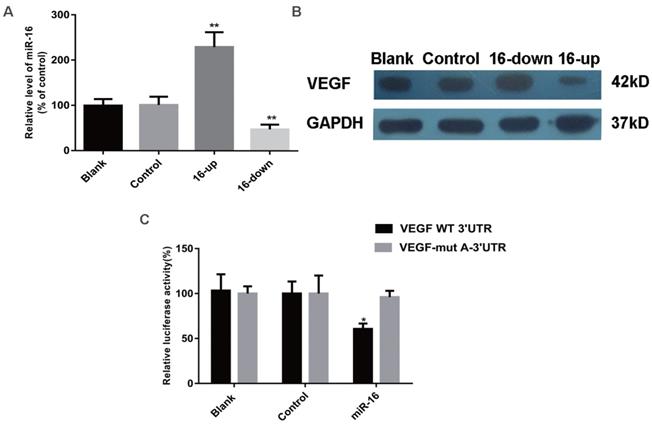
To determine whether the secretion of VEGF and other pro-angiogenic factors (b-FGF, CTGF, and MMP-2) were altered by miR-16, SKM-1 cells were transfected with a specific miR-16 inhibitor, mimics, or control (empty) particles. MiR-16 levels at 48 h after transfection were detected by qPCR (Figure 4A). ELISA was performed 48 h after transfection to analyse the secretion of VEGF, b-FGF, CTGF, and MMP-2. As shown in Table 3, VEGF levels were significantly decreased in the supernatant of miR-16-overexpressing cells (P < 0.001) and increased in that of miR-16-knock down cells (P < 0.01) compared with those in non-transfected cells or cells transfected with control miRNA. However, the secretion of b-FGF, CTGF, and MMP-2 did not significantly change among the different groups.
VEGF is a direct target of miR‑16 in cells. (A) The miR-16 levels of SKM-1 cells following miR-16 mimics /inhibitor (16-up/down) transfection for 48 h were analysed by qPCR. (B) The expression of VEGF protein of SKM-1 cells following miR-16 mimics /inhibitor transfection for 48 h was analysed by Western blotting analysis with β-actin as internal control. (C) Luciferase reporter assays were performed by co-transfection of pre-miR-16 oligonucleotide with a luciferase reporter gene containing wild-type 3'UTR of VEGF or mutated 3'UTR of VEGF. Expression of pre-miR-16 reduced luciferase activity of the wild-type reporter. * P<0.05, **P<0.01.
Secretion of angiogenic factors from control and transfected SKM-1 cells
| CM of SKM-1 cells | VEGF (pg/106 cells/ml) (mean ± SD) | bFGF (pg/106 cells/ml) (mean ± SD) | CTGF (pg/106 cells/ml) (mean ± SD) | MMP-2(pg/106 cells/ml) (mean ± SD) |
|---|---|---|---|---|
| Non-transfected cells | 82.7 ±3.1 | 62.1±2.9 | 1.61±0.28 | 10.2±0.9 |
| miRNA precursor control | 83.4 ±3.2 | 68.9±3.4 | 1.65±0.09 | 11.1±1.3 |
| mimics-miR-16 | 30.9±4.9*** | 63.6±3.4 | 1.51±0.29 | 10.8±1.9 |
| inhibitor-miR-16 | 102.7±6.7** | 62.9±3.9 | 1.75±0.22 | 10.4±0.8 |
(***P<0.001, **P<0.01) CM: culture media; VEGF: Vascular endothelial growth factor; b-FGF: basic fibroblast growth factor; CTGF: connective tissue growth factor; MMP-2: matrix metalloproteinase-2.
To examine whether VEGF is indeed a target of miR-16, its expression was evaluated by western blotting in SKM-1 cells as described above. VEGF levels were significantly reduced in cells overexpressing miR-16, compared with those in non-transfected cells or cells transfected with control miRNA. In contrast, knockdown of miR-16 was associated with increased expression of VEGF (Figure 4B). These results strongly suggested that VEGF may be a target of miR-16 in MDS cells.
The 3ʹ-UTR of VEGF is a target of miR-16
A luciferase reporter assay was used to verify the direct interaction between miR-16 and the 3ʹ-UTR of VEGF. Wild-type (WT) or mutant (MUT) VEGF 3ʹ-UTR, in which the putative miR-16 binding site has been altered, was cloned into reporter plasmids. 293T cells were co-transfected with pre-miR-16 precursor or control and either the WT or MUT VEGF 3ʹ-UTR constructs. The overexpression of miR-16 markedly decreased the luciferase activity of the wild-type reporter but not that of the mutant reporter (P < 0.05), suggesting that miR-16 targets the 3ʹ-UTR of VEGF and that the point mutations in MUT VEGF 3ʹ-UTR abolish its effect (Figure 4C).
miR-16 negatively regulates HUVEC tube formation and migration in vitro
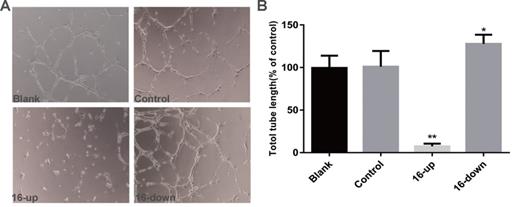
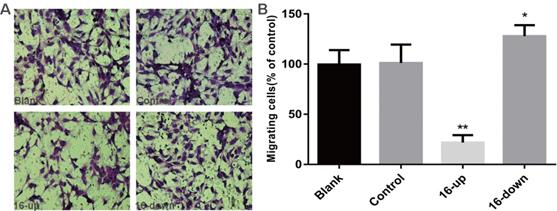
To investigate the impact of miR-16 on tumour angiogenesis, we performed tube-formation assays and cell migration assays. HUVEC tube formation assays were performed using three groups of conditioned medium of transfected SKM-1 cells: miR-16 inhibitor, mimics, and control. Our data revealed that the tube-forming capability of HUVECs was suppressed by medium from cells transfected with miR-16 mimics (P < 0.01), and opposite results were obtained upon transfection with the miR-16 inhibitor (P < 0.05, Figure 5A-B). Next, Cell migration assays on HUVECs were performed using conditioned medium of the above three groups. Compared with control cells, medium from cells overexpressing miR-16 dramatically suppressed the migration of HUVECs (P < 0.01), whereas the medium of cells with miR-16 knock down augmented the migration of HUVECs (P < 0.05, Figure 6A-B). These results demonstrated that miR-16 significantly affects the tube formation ability and the migration ability of HUVEC cells in vitro.
miR-16 negatively regulates HUVEC tube formation in vitro (A) Tube-formation assays with HUVECs were performed with the different groups of conditioned medium from K562 cells transfected with miR-16 inhibitor (16-down), miR-16 mimics (16-up) or empty vector. Representative images were taken to assess the tube formation (×200 magnification). (B) Quantification of the vascular tube structure was conducted by measuring the total tubule length in 5 high-power fields. *P<0.05. ** P<0.01.
miR-16 negatively regulates HUVEC migration in vitro (A) Transwell migration assays with HUVECs were performed with the different groups of conditioned medium from K562 cells transfected with miR-16 inhibitor (16-down), miR-16 mimics (16-up) or empty vector. Representative images were taken to assess the cell migration in the open space (×200 magnification). (B) Quantification of cell migration capability was evaluated by measuring the distances migrated in 5 high-power fields. Data represent the mean±SD from three independent experiments. *P<0.05. ** P<0.01.
Discussion
Using ELISA and IHC, we confirmed that VEGF secretion in the peripheral blood and VEGF levels in the bone marrow of MDS patients were significantly increased in higher-risk group compared with those in lower-risk group according to the IPSS-R classification. Although previous studies also demonstrated that increased expression of VEGF is associated with high-risk MDS and predicted decreased survival [11-14], the role of VEGF in MDS progression is yet to be clarified. Meanwhile, no study has investigated the mechanism of the significant differential expression of VEGF between high and low-risk MDS. In the present study, we investigated the possible role of miR-15a and miR-16 in the regulation of VEGF and their effect on angiogenesis in MDS.
In humans, miR-15a and miR-16 are clustered within 0.5 kb at chromosome 13q14, which is frequently deleted or downregulated in chronic lymphocytic leukaemia (CLL) [27, 28]. Previous reports have demonstrated that the miR-15a/16 cluster functions as a tumour suppressor in CLL [28, 29], prostate cancer [30], and non-small cell lung cancer [31]. Pons et al. reported that miR-15a is overexpressed in the bone marrow of patients with IPSS high-risk MDS and that miR-16 is overexpressed in the peripheral blood of IPSS lower-risk MDS [32]. However, few studies have investigated the function of miR-15a/16 in MDS. In this study, we investigated the expression levels of miR-15a and miR-16 in bone marrow CD34+ cells of MDS patients and analysed the correlation between their expression and disease risk. Our results showed that miR-15a is similarly upregulated in both lower-risk and higher-risk MDS patients compared with healthy controls and that there is no difference in miR-15a level between lower-risk and higher-risk MDS. However, decreased miR-16 levels were observed in higher-risk MDS patients, and miR-16 levels were significantly higher in healthy individuals and lower-risk patients. Detection of VEGF and miR-16 levels in K562, THP-1 and SKM-1 cells also confirmed the inverse correlation between VEGF and miR-16 in MDS and leukaemia. Although several miRNAs have been implicated in the proliferation and differentiation of haematopoietic cells in MDS [33-36], there are few published data regarding the role of miRNAs in the angiogenesis of MDS. Because higher-risk MDS patients have increased bone marrow angiogenesis, we speculate that downregulation of miR-16 contributes to diseases progression by inducing angiogenesis in high-risk MDS.
Then, we demonstrated that ectopic expression of miR-16 efficiently inhibits the secretion of VEGF but does not affect that of other pro-angiogenic factors. Luciferase reporter assays confirmed that miR-16 binds to the VEGF 3′-UTR. Furthermore, the ectopic expression of miR-16 inhibits the overexpression of VEGF in SKM-1 cells and negatively regulates the migration and tube formation ability of HUVEC cells in vitro. Similar to all other miRNAs, miR-15a/16 has a broad range of cellular targets [37-39]. B-cell lymphoma 2 (Bcl-2) has been reported as one of the targets of miR-15a/16 in CLL and prostate cancer, and inhibition of cell proliferation by miR-15a/16 through Bcl-2 has been reported in both lymphoid and non-lymphoid tissues [29, 40]. This study highlighted a distinct role of miR-16 in angiogenesis in high-risk MDS via VEGF.
Although recent studies have revealed that VEGF expression is closely correlated with the progression of MDS, advancements in measures of dealing with the poor prognosis of high-risk MDS have been limited, with no significant change in recent years [41]. Notably, the clinical use of anti-VEGF agents is limited because of their adverse effect on normal vasculature [42]. Re-expression of lost miRNAs has attracted much attention as a promising strategy in targeted therapy of tumours [43]. We believe that miR-16 may serve as a potential diagnostic marker and therapeutic target in high-risk MDS patients. However, additional studies are necessary to investigate the detailed regulatory mechanisms of miR-16 in high-risk MDS.
In summary, we demonstrated that miR-16 expression is downregulated in patients with high-risk MDS and that miR-16 negatively modulate angiogenesis via VEGF suppression. These evidences suggest that miR-16 may act as a tumour suppressor in MDS development, by directly targeting VEGF.
Acknowledgements
The authors thank the Union Hospital, Tongji Medical College of Huazhong University of Science and Technology for donating the SKM-1 cell line and the Hospital of Blood Diseases of the Chinese Academy of Medical Sciences for donating the leukaemia cell lines (K562, HL-60, and THP-1).
Availability of data and materials
Literature collection was performed using PubMed. Statistical analyses were executed by using SPSS 24.0 software (IBM Corp, Armonk, NY, USA) and GraphPad (Prism 5.0). Three different internet-based miR prediction programs were used to predict a number of putative targets (http://tumor.informatics.jax.org/mtbwi/index.do, http://www.targetscan.org, http://mirnamap.mbc.nctu.edu.tw). All data generated or analyzed during this study are included in this published article.
Ethics approval and consent to participate
All samples were collected with informed consent and the experiments wereapproved by the Institutional Review Board of the Wuhan University.
Authors' contributions
B.X. initiated, designed and performed research, analysed data, and wrote the manuscript.
Y.B.N. designed and performed research, collected and analysed data, and wrote the manuscript; Y.L.Y. designed and performed research, and analysed data; S.X.W. performed research and provided important data; X.L.Z. designed research, analysed data, and wrote the manuscript.
Competing Interests
The authors have declared that no competing interest exists.
References
1. Tefferi A, Vardiman JW. Myelodysplastic syndromes. N Engl J Med. 2009;361:1872-85
2. Corey SJ, Minden MD, Barber DL, Kantarjian H, Wang JC, Schimmer AD. Myelodysplastic syndromes: the complexity of stem-cell diseases. Nat Rev Cancer. 2007;7:118-29
3. Ma X, Does M, Raza A, Mayne ST. Myelodysplastic syndromes: incidence and survival in the United States. Cancer. 2007;109:1536-42
4. Raza A, Galili N. The genetic basis of phenotypic heterogeneity in myelodysplastic syndromes. Nat Rev Cancer. 2012;12:849-59
5. Jilg S, Reidel V, Müller-Thomas C, König J, Schauwecker J, Höckendorf U. Blockade of BCL-2 proteins efficiently induces apoptosis in progenitor cells of high-risk myelodysplastic syndromes patients. Leukemia. 2016;30:112-23
6. Parker JE, Mufti GJ, Rasool F, Mijovic A, Devereux S, Pagliuca A. The role of apoptosis, proliferation, and the Bcl-2-related proteins in the myelodysplastic syndromes and acute myeloid leukemia secondary to MDS. Blood. 2000;96:3932-8
7. Shetty V, Hussaini S, Broady-Robinson L, Allampallam K, Mundle S, Borok R. et al. Intramedullary apoptosis of hematopoietic cells in myelodysplastic syndrome patients can be massive: apoptotic cells recovered from high-density fraction of bone marrow aspirates. Blood. 2000;96:1388-92
8. Gerber HP, Malik AK, Solar GP, Sherman D, Liang XH, Meng G. et al. VEGF regulates haematopoietic stem cell survival by an internal autocrine loop mechanism. Nature. 2002;417:954-8
9. Gerber HP, Ferrara N. The role of VEGF in normal and neoplastic hematopoiesis. J Mol Med (Berl). 2003;81:20-31
10. He R, Liu B, Yang C, Yang RC, Tobelem G, Han ZC. Inhibition of K562 leukemia angiogenesis and growth by expression of antisense vascular endothelial growth factor (VEGF) sequence. Cancer Gene Ther. 2003;10:879-86
11. Verstovsek S, Estey E, Manshouri T, Giles FJ, Cortes J, Beran M. et al. Clinical relevance of vascular endothelial growth factor receptors 1 and 2 in acute myeloid leukaemia and myelodysplastic syndrome. Br J Haematol. 2002;118:151-6
12. Wimazal F, Krauth MT, Vales A, Böhm A, Agis H, Sonneck K. et al. Immunohistochemical detection of vascular endothelial growth factor (VEGF) in the bone marrow in patients with myelodysplastic syndromes: correlation between VEGF expression and the FAB category. Leuk Lymphoma. 2006;47:451-60
13. Gianelli U, Fracchiolla NS, Bucciarelli P, Ferla V, Boiocchi L, Savi F. et al. High Levels of Vascular Endothelial Growth Factor Protein Expression Are Associated with an Increased Risk of Transfusion Dependence in Myelodysplastic Syndromes. Am J Clin Pathol. 2013;139:380-7
14. Bellamy WT, Richter L, Sirjani D, Roxas C, Glinsmann-Gibson B, Frutiger Y. et al. Vascular endothelial cell growth factor is an autocrine promoter of abnormal localized immature myeloid precursors and leukemia progenitor formation in myelodysplastic syndromes. Blood. 2001;97:1427-34
15. Garzon R, Fabbri M, Cimmino A, Calin GA, Croce CM. MicroRNA expression and function in cancer. Trends Mol Med. 2006;12:580-7
16. He L, Hannon GJ. MicroRNAs: small RNAs with a big role in gene regulation. Nat Rev Genet. 2004;5:522-31
17. Bartel DP. MicroRNAs: genomics, biogenesis, mechanism, and function. Cell. 2004;116:281-97
18. Isken F, Steffen B, Merk S, Dugas M, Markus B, Tidow N. et al. Identification of acute myeloid leukaemia associated microRNA expression patterns. Br J Haematol. 2008;140:153-61
19. Garzun R, Garofalo M, Martelli MP. et al. Distinctive micoRNA signature of acute myeloid leukemia bearing cytoplasmic mutated nucleophosmin. Proc Nail Acad Sci USA. 2008;105:3945-50
20. Zaneue DL, Rivadavia F, Molfetta GA, Barbuzano FG, Proto-Siqueira R, Silva WA Jr. et al. miRNA expression profiles in chronic lymphocytic and acute lymphocytic leukemia. Braz J Med Biol Res. 2007;40:1435-40
21. Dejean E, Renalier MH, Foisseau M, Agirre X, Joseph N, de Paiva GR. et al. Hypoxia-microRNA-16 downregulation induces VEGF expression in anaplastic lymphoma kinase (ALK)-positive anaplastic large-cell lymphomas. Leukemia. 2011;25:1882-90
22. Sun CY, She XM, Qin Y, Chu ZB, Chen L, Ai LS. et al. miR-15a and miR-16 affect the angiogenesis of multiple myeloma by targeting VEGF. Carcinogenesis. 2013;34:426-35
23. Pfaffl MW. A new mathematical model for relative quantification in real-time RT-PCR. Nucleic Acids Res. 2001;29:e45
24. Felli N, Fontana L, Pelosi E, Botta R, Bonci D, Facchiano F. et al. MicroRNAs 221 and 222 inhibit normal erythropoiesis and erythroleukemic cell growth via kit receptor down-modulation. Proc Natl Acad Sci USA. 2005;102:18081-6
25. Pourgholami MH, Khachigian LM, Fahmy RG, Badar S, Wang L, Chu SW. et al. Albendazole inhibits endothelial cell migration, tube formation, vasopermeability, VEGF receptor-2 expression and suppresses retinal neovascularization in ROP model of angiogenesis. Biochem Biophys Res Commun. 2010;397:729-34
26. Greenberg PL, Tuechler H, Schanz J, Sanz G, Garcia-Manero G, Solé F. et al. Revised international prognostic scoring system for myelodysplastic syndromes. Blood. 2012;120:2454-65
27. Aqeilan RI, Calin GA, Croce CM. miR-15a and miR-16-1 in cancer: Discovery, function and future perspectives. Cell Death Differ. 2010;17:215-20
28. Calin G A, Dumitru CD, Shimizu M, Bichi R, Zupo S, Noch E. et al. Frequent deletions and down-regulation of micro-RNA genes miR15 and miR16 at 13q14 in chronic lymphocytic leukemia. Proc Nail Acad Sci USA. 2002;99:15524-9
29. Cimmino A, Calin GA, Fabbri M, Iorio MV, Ferracin M, Shimizu M. et al. miR-15 and miR-16 induce apoptosis by targeting BCL2. Proc Nail Acad Sci USA. 2005;102:13944-9
30. Bonci D, Coppola V, Musumeci M, Addario A, Giuffrida R, Memeo L. et al. The miR-15a-miR-16-1 cluster controls prostate cancer by targeting multiple oncogenic activities. Nat Med. 2008;14:1271-7
31. Bandi N, Zbinden S, Gugger M, Arnold M, Kocher V, Hasan L. et al. miR-15a and miR-16 are implicated in cell cycle regulation in a Rb-dependent manner and are frequently deleted or down-regulated in non-small cell lung cancer. Cancer Res. 2009;69:5553-9
32. Pons A, Nomdedeu B, Navarro A, Gaya A, Gel B, Diaz T. et al. Hematopoiesis- related microRNA expression in myelodysplastic syndromes. Leuk Lymphoma. 2009;50:1854-9
33. Bhagat TD, Zhou L, Sokol L, Kessel R, Caceres G, Gundabolu K. et al. miR-21 mediates hematopoietic suppression in MDS by activating TGF-β signaling. Blood. 2013;121:2875-81
34. Lee DW, Futami M, Carroll M, Feng Y, Wang Z, Fernandez M. et al. Loss of SHIP-1 protein expression in high-risk myelodysplastic syndromes is associated with miR-210 and miR-155. Oncogene. 2012;31:4085-94
35. Rhyasen GW, Starczynowski DT. Deregulation of microRNAs in myelodysplastic syndrome. Leukemia. 2012;26:13-22
36. Guo Y, Strickland SA, Mohan S, Li S, Bosompem A, Vickers KC. et al. MicroRNAs and tRNA-derived fragments predict the transformation of myelodysplastic syndromes to acute myeloid leukemia. Leuk Lymphoma. 2017;58:1-15
37. Abraham M, Klein S, Bulvik B, Wald H, Weiss ID, Olam D. et al. The CXCR4 inhibitor BL-8040 induces the apoptosis of AML blasts by downregulating ERK, BCL-2, MCL-1 and cyclin-D1 via altered miR-15a/16-1 expression. Leukemia. 2017;31:2336-46
38. Ye EA, Liu L, Jiang Y, Jan J, Gaddipati S, Suvas S. et al. miR-15a/16 reduces retinal leukostasis through decreased pro-inflammatory signaling. J Neuroinflammation. 2016;13:305
39. Chu J, Zhu Y, Liu Y, Sun L, Lv X, Wu Y. et al. E2F7 overexpression leads to tamoxifen resistance in breast cancer cells by competing with E2F1 at miR-15a/16 promoter. Oncotarget. 2015;6:31944-57
40. Musumeci M, Coppola V, Addario A, Patrizii M, Maugeri-Saccà M, Memeo L. et al. Control of tumor and microenvironment cross-talk by miR-15a and miR-16 in prostate cancer. Oncogene. 2011;13:4231-42
41. Gore SD. Inhibitors of signaling in myelodysplastic syndrome. Best Pract Res Clin Haematol. 2004;17:613-22
42. McWhirter E, Quirt I, Gajewski T, Pond G, Wang L, Hui J. et al. A phase II study of cediranib, an oral VEGF inhibitor, in previously untreated patients with metastatic or recurrent malignant melanoma. Invest New Drugs. 2016;34:231-5
43. Mishra PJ, Merlino G. MicroRNA reexpression as differentiation therapy in cancer. J Clin Invest. 2009;119:2119-23
Author contact
![]() Corresponding authors: Bei Xiong, MD, Department of Hematology, Zhongnan Hospital of Wuhan University, Donghu Road No 169, Wuchang District, Wuhan. 430071.Tel: 86-027 -67812751; E-mail:xiongbei909com; Xuelan Zuo, MD, Department of Hematology, Zhongnan Hospital of Wuhan University, Donghu Road No 169, Wuchang District, Wuhan. 430071, Tel: 86-027-67812752; E-mail: zuoxuelan2004com.
Corresponding authors: Bei Xiong, MD, Department of Hematology, Zhongnan Hospital of Wuhan University, Donghu Road No 169, Wuchang District, Wuhan. 430071.Tel: 86-027 -67812751; E-mail:xiongbei909com; Xuelan Zuo, MD, Department of Hematology, Zhongnan Hospital of Wuhan University, Donghu Road No 169, Wuchang District, Wuhan. 430071, Tel: 86-027-67812752; E-mail: zuoxuelan2004com.