Impact Factor ISSN: 1837-9664

 Global reach, higher impact
J Cancer 2021; 12(6):1634-1643. doi:10.7150/jca.49231 This issue Cite
Research Paper
DNA methylation integratedly modulates the expression of Pit-Oct-Unt transcription factors in esophageal squamous cell carcinoma
Wei He1 ![]() , Shuai Gong1, Xin Wang2, Xinhua Dong3, Hua Cheng4
, Shuai Gong1, Xin Wang2, Xinhua Dong3, Hua Cheng4
1. Department of Oncology, the First Affiliated Hospital of Zhengzhou University, Zhengzhou 450052, Henan province, China.
2. Department of Radiotherapy, the First Affiliated Hospital of Zhengzhou University, Zhengzhou 450052, Henan province, China.
3. Department of Gastrointestinal Surgery, the First Affiliated Hospital of Zhengzhou University, Zhengzhou 450052, Henan province, China.
4. Department of Oncology, Xiayi Hospital of Traditional Chinese Medicine. Shangqiu 476400, Henan province, China.
Received 2020-6-8; Accepted 2020-12-20; Published 2021-1-15
Abstract

Background: Dysregulation of Pit-Oct-Unc family transcription factors has been implicated in esophageal squamous cell carcinoma (ESCC). In this study, we evaluated the expression and promoter methylation status of Octamer (OCT) transcription factor genes in human ESCC clinical specimens to investigate the mechanism underlying this observation along with the clinical significance.
Methods: Total DNA or RNA was extracted from ESCC tissue specimens and the mRNA level of genes encoding the transcription factors OCT1, OCT2, OCT3/OCT4, OCT5, OCT7, OCT9, and OCT11 were evaluated by quantitative PCR. The DNA methylation status of gene promoters was assessed by bisulfite pyrosequencing and next-generation sequencing. The relationship between the expression of these transcription factors and ESCC proliferation was investigated in vitro and in vivo with the colony formation assay and a mouse xenograft tumor model, respectively. We also examined the correlation between OCT gene expression and promoter methylation and clinicopathologic characteristics of ESCC.
Results: OCT1 was upregulated whereas OCT4, OCT6, and OCT11 were downregulated in ESCC compared to non-tumor tissue. OCT2, OCT7, and OCT9 were undetected in all samples. OCT1, OCT6, and OCT11 levels were negatively correlated with the methylation of their respective promoters, but there was no relationship between OCT4 expression and promoter methylation status.
Conclusion: Changes in promoter methylation rate underlie the observed alterations in OCT1, OCT6, and OCT11 expression in ESCC, whereas another mechanism is likely responsible for the dysregulation of OCT4.
Keywords: OCT transcription factor, DNA methylation, esophageal squamous cell carcinoma, clinical characteristics
Introduction
Pit-Oct-Unc (POU) family transcription factors mediate the transcription of downstream genes that are necessary for the maintenance of pluripotency in embryonic stem cells but also promote the proliferation or stemness of human cancers by binding to the octamer sequence motif (AGTCAAAT consensus sequence) of gene promoters. Octamer (OCT) transcription factors belonging to the POU family have been shown to play a regulatory role in cancer cells [1-3]. However, their functions in esophageal squamous cell carcinoma (ESCC) are not known. ESCC is one of the most fatal malignancies of the digestive system; the incidence of ESCC is especially high in certain regions such as Linxian, Anyang City, Henan Province, China [4-6]. Clarifying the expression patterns of OCT proteins in ESCC can provide insight into their functions, which can in turn serve as a basis for the development of more effective diagnostic and therapeutic strategies.
Methylation of gene promoters is an epigenetic modification that regulates gene transcription [7, 8]. It was previously reported that the expression of OCT transcription factors is dysregulated in ESCC [9, 10]. In order to elucidate the mechanism underlying this observation, in the present study we examined the expression levels of OCT family proteins in ESCC tissue samples and the methylation status of their gene promoters, as well as the relationships between these two variables and their association with clinicopathologic features of ESCC.
Material and Methods
Patients and Clinical samples
A series of 150 surgically resected fresh ESCC and their corresponding adjacent normal tissue samples were collected at the First Affiliated Hospital of Zhengzhou University (Zhengzhou, China) and snap-frozen in liquid nitrogen from 2012 to 2016 (Supplemental table 1). No patients had received any preoperative treatment. Among them, 98 are men and 52 are women, ranging from 37-76 years of age with a mean age of 58.2 years. According to the International Union against Cancer (UICC) 2017 standard, 5 cases were classified as stage I, 39 were stage II, 97 were stage III and 9 were stage IV. Histologically, 52 were well differentiated, 58 were moderate and 40 were poorly differentiated. The collection of clinical specimens and all experiments were performed according to the Helsinki Declaration and were reviewed and approved by the ethics committee of the First Affiliated Hospital of Zhengzhou University, Zhengzhou City, Henan Province, China.
Cell lines and agents
We used three ESCC cell lines (KYSE70, KYSE140, and KYSE450) that have also been described in our previous work [10]. Patient-derived cells were prepared from ESCC tissue specimens according to a published protocol [11]. Het-1A human esophageal epithelial cells were preserved in our laboratory. Lentivirus particles harboring the full-length cDNA sequence of OCT or two small interfering RNA (siRNA) targeting OCT1 (siRNA-1 or siRNA-2 of OCT1) were prepared by Vigene Corporation (Jinan City, China). The anticancer agents cisplatin, 5-fluorouracil (5-FU), and paclitaxel were purchased from Selleck Chemicals (Houston, TX, USA) and dissolved in dimethylsulfoxide (DMSO) for in vitro experiments and in DMSO along with polyethylene glycol 400 or Tween 80 for use in mice. The agents were prepared according to a published protocol [12].
Bisulfite sequencing (BSP) and next-generation sequencing (NGS) [13]
Genomic DNA was extracted from ESCC or non-tumor tissue using the QIAamp DNA Mini Kit (Qiagen, Hilden, Germany) according to the manufacturer's protocol. DNA concentration and quality were determined using a spectrophotometer (Thermo Fisher Scientific, Waltham, MA, USA). The samples were subjected to bisulfite treatment with the ZYMO EZ DNA Methylation-Gold Kit (Zymo Research, Orange, CA, USA) according to the manufacturer's protocol. The promoter region of each target gene - i.e., the sequence 2000 bp upstream of the transcription start site—was obtained by searching the NCBI database. Methyl Primer Express v1.0 software (Thermo Fisher Scientific) was used to identify and predict CpG sites in the promoter sequence and primers were designed for PCR amplification of this region. The amplified product, which was about 218 bp in size, was purified using magnetic beads for sequencing library construction (Life Technologies, Carlsbad, CA, USA), and a barcode was added for second-generation sequencing on the Iontorrent PGM platform (Life Technologies). If the sequencing result of the OCTs' promoter region after BSP treatment is C, it indicates that the CpG site was methylated; if the sequence of the OCTs promoter region sequencing after BSP treatment was T, it indicated that the methylation of the CpG site was not occurred. The methylation rate of OCT gene promoter sequences was calculated as the number of methylated CpG sites divided by the total number of CpG sites. The forward and reverse primers used for BSP and NGS experiments were as follows: Oct1/POU2F1, 5'-ATTGAGGGYGTTGTTTTAGTT-3' and 5'-CCTCAAAAAAACTCCACC-3'; Oct4/POU5F1, 5'-GTGGTTAGGTATTTTGGGAGGT-3' and 5'-CAAACTAAACTCR AACTCCC-3'; Oct6/POU3F1, 5'-TYGAGATTTTTTTTTTTTGGAATT-3' and 5'-AACRA TTCTACAATCCTACRC-3'; and Oct11/POU2F3, 5'-TTGTAATTTTAGGGAAG TTTAATTGA-3' and 5'-CTCAAATTCTCTTATCCCTAATTAAA-3' (where R = A or G; Y = C or T).
Quantitative polymerase chain reaction (qPCR)
RNA was extracted from paired ESCC and non-tumor clinical specimens using the PARIS Kit (Thermo Fisher Scientific) and reverse transcribed using Multiscribe reverse transcriptase (Thermo Fisher Scientific) according to the manufacturer's protocol. qPCR was performed as previously described [14, 15] to analyze the expression levels of OCT1, OCT2, OCT3/OCT4, OCT5, OCT7, OCT9, and OCT11. The forward and reverse primers used for qPCR were as follows: Oct1/POU2F1, 5'-GAAACGCACCAGCATAGAGACC-3' and 5'-GGCGGTTACAG AACCAAACACG-3'; Oct2/SLC22A2, 5'-GAGATAGTCTGCCTGGTCAATGC-3' and 5'-GTAGACCAGGAA TGGCGTGATG-3'; Oct4/POU5F1, 5'-CCTGAAGCAGAAGA GGATCACC-3' and 5'-AAAGCGGCAGATGGTCGTTTGG-3'; Oct6/POU3F1, 5'-GTGTTC TCGCAGA CCACCATCT-3' and 5'-CGCGA TCTTGTCCAGGTTGGTG-3'; Oct7/POU3F2, 5'-GTGTTCTCGCAGACCACCATCT-3' and 5'-GCTGCGATCTTGTCTATGCTCG-3'; Oct9/POU3F4, 5'-GTGTTCTCGCAGACCACCATCT-3' and 5'-GCGATCTTGTCAAT GCTGGTCG-3'; and Oct11/POU2F3, 5'-GCTGGAGAAGTTTGCCAAGACC-3' and 5'-GTGAGATGGTGGTCTGGCTGAA-3'. The β-Actin gene (5' CACCATTGG CAATGAGCGGTTC-3' and 5'- AGGTCTTTGCGGATGTCCACGT-3') was used as an internal control for calculating the relative expression level of target genes.
Cell culture and cell growth analysis
ESCC cells were cultured in Dulbecco's Modified Eagle Medium containing 10% fetal bovine serum. For colony formation experiments, the cells were treated with various concentrations of antitumor agent (Supplemental Table 2) for 48 h, then harvested and seeded in 6-well plates (2 × 10³ cells/well); the colony formation assay was performed as previously described [16, 17]. Optical density at 546 nm (OD546) was measured and used to calculate colony formation rate according to the following formula: [(OD546 of the control group) - (OD546 of the treatment group)]/(OD546 of the control group)] × 100%. The results were used to determine half-maximal inhibitory concentration (IC50) values [18, 19].
Western blotting
Total protein was extracted from ESCC cells according to a published protocol [20-22]. Non-tumor Het-1A human esophageal epithelial cells or patient-derived ESCC cells expressing low levels of endogenous OCT1 were transfected with lentivirus particles harboring the full-length OCT1 sequence or a siRNA targeting OCT1. OCT1 protein level was detected by western blotting (antibody from Abcam, Cambridge, UK; ab51363), with GAPDH serving as a loading control.
Xenograft tumor model
All experiments with mice were approved by the Institutional Animal Care and Use Committee of Zhengzhou University (Henan, China) and were performed in accordance with the 1986 UK Animals (Scientific Procedures) Act and associated guidelines. To examine the growth of ESCC cells in vivo, we established a subcutaneous xenograft tumor model in nude mice. Cultured ESCC cells were subcutaneously injected into the mice [23, 24] and 3 or 4 days later, the mice were orally administered cisplatin (Supplemental Table 3) once every 2 days. After 3 weeks (10 treatments), tumors were harvested from the mice and tumor volume was calculated as (tumor length × tumor width × tumor width) / 2 [25, 26]. Tumor weight was measured using a precision balance. The rate of inhibition of tumor growth was calculated as [(tumor volume of control group) - (tumor volume of drug treatment group)] / (tumor volume of control group) × 100%; or as [(tumor weight of control group) - (tumor weight of drug treatment group)] / (tumor weight of control group) × 100%.
Statistical analysis
Statistical analyses were performed with SPSS v9.0 software (SPSS Inc., Chicago, IL, USA). Differences between groups were evaluated for statistical significance by two-way analysis of variance with Bonferroni correction. P < 0.05 was considered significant. IC50 values of the tested agents against ESCC cells were calculated using Origin v6.0 software (OriginLab, Northampton, MA, USA).
Results
Expression of OCT transcription factors in ESCC
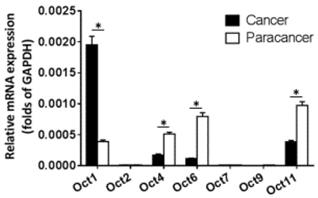
The expression of OCT transcription factors in ESCC and paired non-tumor tissue was examined by qPCR. OCT2, OCT7, and OCT9 were not expressed in either type of sample (Figure 1). Meanwhile, OCT1 was upregulated whereas OCT4, OCT6, and OCT11 were downregulated in ESCC relative to non-tumor tissue, with a statistically significant difference observed for OCT1 (P < 0.05).
Expression levels of OCT transcription factors in ESCC and paired non-tumor tissue. The mRNA levels of OCT transcription factors was determined by qPCR. Results are shown as mean ± SD. *P < 0.05.
Methylation status of OCT gene promoters in ESCC
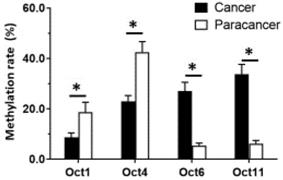
Given that OCT1, OCT4, OCT6, and OCT11 expression was dysregulated in ESCC specimens, we examined the methylation status of their promoters (Figure 2 and Table 1). Table 1 indicated the methylation rate data of each CpG site in the promoter regions of OCT1, OCT4, OCT6 and OCT11; whereas Figure 2 indicated the structure of the OCT1, OCT4 promoter region and the CpG sites in the selected region. The methylation rates at the OCT1 and OCT4 promoters were lower in ESCC (8.6% and 23.0%, respectively) compared to non-tumor tissue (18.6% and 42.5%, respectively) (Figure 3 and Table 1). However, the opposite results were observed for OCT6 and OCT11 (5.4% and 6.2% in the non-tumor tissues, respectively vs 27.1% and 33.7% in ESCC tissues).
The CpG sites or the methylation rates of OCTs transcription factor's promoter region in ESCC clinical specimens. The CPG sites that could be methylated was shown as “YG” in Figure. There are four CpG sites in the selected region in the promoter of OCT1 (A) or OCT4 (B), and the methylation rates of these four sites in ESCC specimens or the non-tumor tissues was shown.
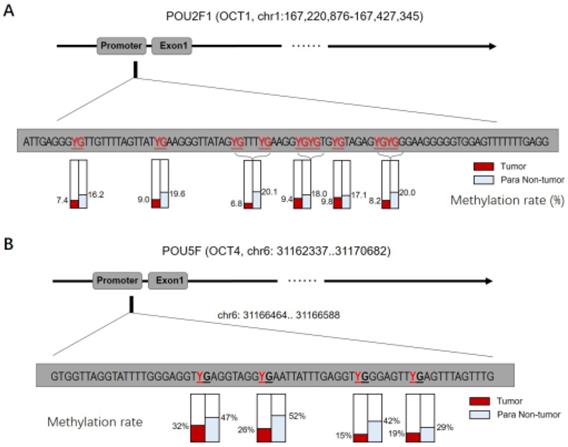
The CpG sites or the methylation rates of OCTs transcription factor's promoter region in ESCC clinical specimens
| Targets | Sequence (5'-3') | Methylation rate (%) | |
|---|---|---|---|
| Tumor | Non-tumor | ||
| OCT1 | ATTGAGGGYGTTGTTTTAGTTATYGAAGGGTTATAGYGTTTYGAAGGYGYGTGYGTAGAGYGYGGGAAGGGGGTGGAGTTTTTTTGAGG | 8.60% | 18.60% |
| OCT4 | GTGGTTAGGTATTTTGGGAGGTYGAGGTAGGYGAATTATTTGAGGTYGGGAGTTYGAGTTTAGTTTG | 23.00% | 42.50% |
| OCT6 | TYGAGATTTTTTTTTTTTGGAATTTYGGAGYGYGGTYGGGTATTAGGGGTTYGYGTAGGATTGTAGAATYGTT | 27.10% | 5.40% |
| OCT11 | TTGTAATTTTAGGGAAGTTTAATTGAAGTTTGATTYGTYGTTTTAGTATTTAATTAGGGATAAGAGAATTTGAG | 33.70% | 6.20% |
YP: the methylation sites (CpG sites) of the OCTs transcription factor's promoter region.
The methylation rates of OCTs transcription factors. The methylation rates of OCTs transcription factors OCT1, OCT4, OCT6 or OCT11 in ESCC specimens or the paired non-tumor specimens were shown as mean±SD. *P < 0.05 versus the methylation rates of OCTs transcription factors in ESCC clinical specimens or the paired non-tumor specimens.
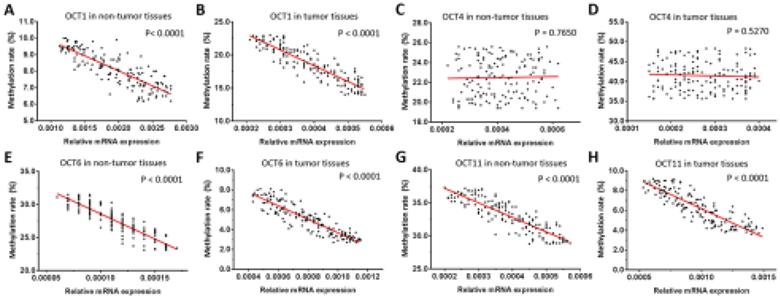
We next examined the relationship between the expression levels (mRNA level) of OCT transcription factors and methylation of their gene promoters in ESCC and non-tumor tissues. We found that the methylation rates of OCT1, OCT6, and OCT11 were negatively correlated with transcript levels in both types of sample (Figure 4). However, there was no association between promoter methylation status and expression level of OCT4. These results imply that the decreased methylation of OCT1, OCT6, and OCT11 promoters, but not OCT4, is responsible for the observed dysregulation of these genes in ESCC tissue.
Correlation between methylation rates of OCT promoter sequences and transcript levels in ESCC and non-tumor tissues. (A-H) Correlations were determined by linear regression analysis and are shown as scatterplots for OCT1 (A, B), OCT4 (C, D), OCT6 (E, F), and OCT11 (G, H) in ESCC (B, D, F, H) and paired non-tumor (A, C, E, G) tissues. The Y-axis (ordinate) of the scatter-plot images is the methylation rates of OCTs transcription factor. The correlation between the methylation rates of OCTs transcription factors' promoter sequences and the expression level of OCTs in ESCC specimens or the paired non-tumor tissues was examined by linear regression and the P-values were shown. *P < 0.05.
Correlation between OCT1 and OCT4 expression and clinicopathologic characteristics of ESCC
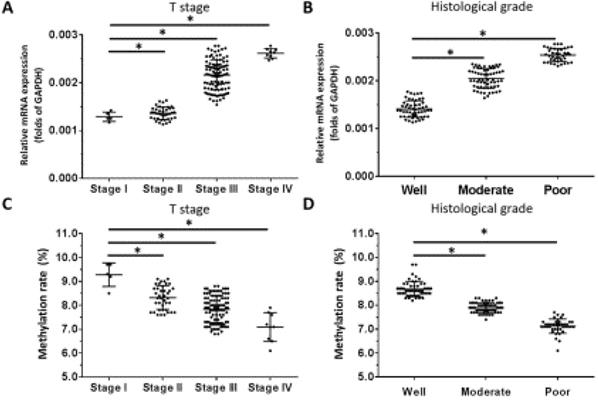
Based on our observation that OCT1 was the most highly expressed OCT transcription factor in ESCC specimens and our previous finding that higher levels of OCT4 were significantly associated with higher tumor grade in ESCC [10], we examined the correlation between OCT1 and OCT4 expression and clinicopathologic characteristics of the tumors specimens. We found that OCT1 levels were elevated for higher (more aggressive) T stages of ESCC (ie, Stage III or IV) compared to lower T stages (ie, Stage I or II) (Figure 5A). Moreover, high OCT1 expression was significantly associated with higher histologic grade of ESCC (Figure 5B) and poor histologic differentiation (Figure 5B), a trend that was opposite to that of promoter methylation rate (Figure 5C, D).
OCT1 expression level and promoter methylation rate in ESCC. OCT1 level was detected by qPCR and OCT1 promoter methylation rate was determined by BSP and NGS. (A-D) Transcript level and promoter methylation rate of OCT1 in ESCC clinical specimens of different T stages (A, C) and histologic grades (B, D). *P < 0.05.
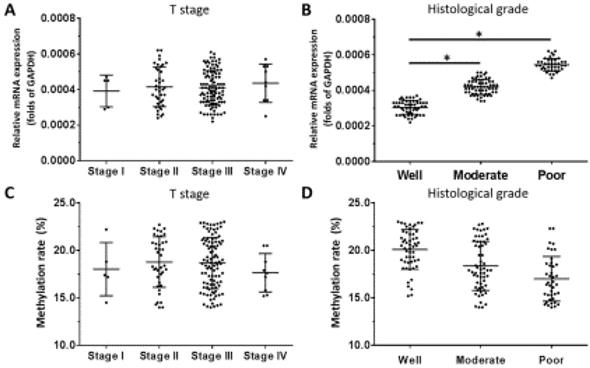
For OCT4, there was no relationship between mRNA level and T stage of ESCC (Figure 6A), although a positive association was observed with histologic grade (Figure 6B). OCT4 expression was higher in poorly differentiated ESCC compared to well- or moderately differentiated samples (Figure 6B). There was no association between the methylation status of the OCT4 gene promoter and T stage or histologic grade (Figure 6C, D).
OCT4 expression level and promoter methylation rate in ESCC. OCT4 level was detected by qPCR and OCT1 promoter methylation rate was determined by BSP and NGS. (A-D) Transcript level and promoter methylation rate of OCT4 in ESCC clinical specimens of different T stages (A, C) and histologic grades (B, D). *P < 0.05.
OCT1 regulates ESCC growth
We used ESCC cell lines to examine the function of OCT1 in ESCC. OCT1 was highly expressed in KYSE70, KYSE140, and KYSE450 ESCC cell lines and three patient-derived cell lines (Nos. 1-3). In contrast, Het-1A, non-tumor human esophageal epithelial cells, and two other patient-derived ESCC cell lines (Nos. 4 and 5) expressed a low level of endogenous OCT1. We used KYSE70, KYSE140, and KYSE450 cells and patient-derived ESCC cell line Nos. 1-3 for OCT1 knockdown and patient-derived ESCC cell line Nos. 4 and 5 for OCT1 overexpression experiments (Supplemental Figure 1).
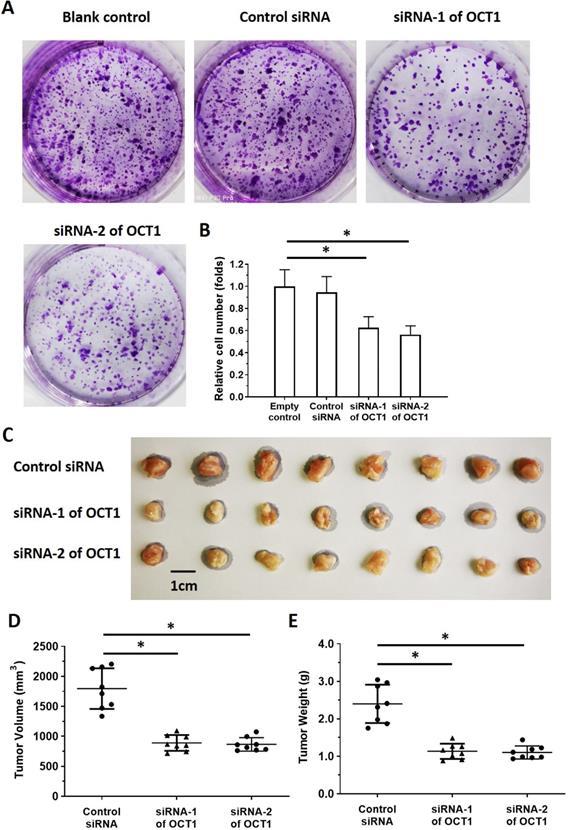
To clarify the role of OCT1 in ESCC cell survival, we knocked down OCT1 expression and examined cell growth in vitro using ESCC cell lines and patient-derived cells expressing high endogenous levels of OCT1 (Supplemental Table 4). Additionally, we overexpressed OCT1 in Het-1A cells and patient-derived cells (No. 4 and 5) with low endogenous OCT1 expression (Supplemental Figure 2). OCT1 knockdown decreased proliferation in KYSE70, KYSE140, and KYSE450 cells and patient-derived ESCC cell line Nos. 1-3 (Figure 7, Supplemental Table 4), whereas OCT1 overexpression in Het-1A cells and patient-derived ESCC cell line Nos. 4 and 5 had the opposite effect (Supplemental Figure 2).
OCT1 silencing inhibits proliferation in ESCC cells with high endogenous levels of OCT1. (A, B) KYSE70 ESCC cells were transfected with OCT1 siRNAs (siRNA-1 or siRNA-2) or a scrambled control siRNA, and colony formation was quantified. (C, D) Transfected cells were injected into nude mice and tumor volume (D) and weight (E) were recorded. Representative images of xenograft tumors are shown (C). *P < 0.05.
OCT1 silencing enhances the sensitivity of ESCC cells to antitumor agents
It was previously reported that OCT1 modulates drug resistance in prostate cancer cells. To test whether this extends to ESCC, we used a mouse xenograft model treated with the antitumor agents cisplatin, 5-FU, and paclitaxel. Drug treatment reduced ESCC cell colony formation in a dose-dependent manner, whereas OCT1 knockdown via siRNA-1 or siRNA-2 enhanced the antitumor effect of cisplatin (Supplemental Figure 3A, B and Table 2). The IC50 values for KYSE70, KYSE140, and KYSE450 cells and three patient-derived ESCC cell lines with high endogenous OCT1 expression are shown in Table 2.
The IC50 values of agents on ESCC cells' colony formation
| Cell lines | Agents | control siRNA | siRNA of OCT1 | siRNA-2 of OCT1 |
|---|---|---|---|---|
| IC50 values of agents (nmol/L) | ||||
| KYSE70 | Cisplatin | 186.33±12.75 | 54.35±7.70 | 60.30±11.25 |
| 5-Fu | 490.90±17.83 | 99.80±10.45 | 122.15±18.31 | |
| Paclitaxel | 31.92±2.74 | 2.90±0.88 | 13.92±7.50 | |
| KYSE140 | Cisplatin | 242.42±22.15 | 105.76±6.79 | 83.26±3.33 |
| 5-Fu | 1.17±0.48 (μmol/L) | 230.61±12.57 | 333.67±28.93 | |
| Paclitaxel | 120.07±14.49 | 20.58±5.44 | 35.42±6.03 | |
| KYSE450 | Cisplatin | 175.39±27.53 | 47.22±9.66 | 44.26±7.88 |
| 5-Fu | 412.99±26.75 | 12.36±3.50 | 75.62±10.36 | |
| Paclitaxel | 86.24±9.88 | 12.40±7.21 | 20.95±6.67 | |
| PDCs No. 1 | Cisplatin | 104.67±8.52 | 21.43±4.69 | 28.45±5.60 |
| 5-Fu | 226.99±45.21 | 76.19±6.54 | 65.47±5.14 | |
| Paclitaxel | 135.01±35.85 | 51.25±6.11 | 79.34±8.69 | |
| PDCs No. 2 | Cisplatin | 129.35±4.30 | 86.60±7.81 | 48.11±15.73 |
| 5-Fu | 728.95±38.21 | 320.88±46.67 | 239.85±71.70 | |
| Paclitaxel | 285.85±84.49 | 120.00±37.28 | 98.67±9.75 | |
| PDCs No. 3 | Cisplatin | 122.65±10.33 | 20.88±4.10 | 40.88±14.59 |
| 5-Fu | 374.48±72.76 | 59.33±33.48 | 92.68±20.72 | |
| Paclitaxel | 119.13±20.94 | 27.47±3.42 | 35.01±2.49 | |
PDCs: Patients-derived cells.
We next examined the in vivo activity of antitumor agents using a mouse xenograft tumor model. Treatment with cisplatin inhibited the growth of subcutaneous ESCC-cell derived tumors (Supplemental Figure 3C, D). On the other hand, tumors derived from OCT1-depleted cells showed enhanced the sensitivity to antitumor agents (Supplemental Figure 3C-E), as evidenced by the decreased IC50 values (Table 3).
The IC50 values of Cisplatin on ESCC cells' subcutaneous growth
| Cell lines | control siRNA | siRNA of OCT1 | |
|---|---|---|---|
| IC50 values of Cisplatin (mg/kg) | |||
| KYSE70 | Tumor volume | 0.43±0.03 | 0.16±0.06 |
| Tumor weights | 0.37±0.10 | 0.11±0.02 | |
| KYSE140 | Tumor volume | 0.38±0.05 | 0.10±0.01 |
| Tumor weights | 0.53±0.12 | 0.20±0.03 | |
| KYSE450 | Tumor volume | 0.70±0.20 | 0.24±0.04 |
| Tumor weights | 0.59±0.24 | 0.16±0.04 | |
| PDCs No. 1 | Tumor volume | 0.33±0.05 | 0.24±0.08 |
| Tumor weights | 0.30±0.01 | 0.18±0.02 | |
| PDCs No. 2 | Tumor volume | 0.60±0.12 | 0.20±0.06 |
| Tumor weights | 0.75±0.08 | 0.25±0.10 | |
| PDCs No. 3 | Tumor volume | 0.39±0.22 | 0.11±0.03 |
| Tumor weights | 0.52±0.101 | 0.28±0.14 | |
PDCs: Patients-derived cells.
To further examine the role of OCT1 in drug resistance in ESCC, patient-derived ESCC cell line Nos. 4 and 5 with low endogenous levels of OCT1 were transfected with an OCT1 overexpression construct and treated with cisplatin, 5-FU, and paclitaxel. OCT1 overexpression enhanced the resistance of ESCC cells to antitumor agents, as evidenced by increased IC50 values (Supplemental Table 5). Thus, the sensitivity of ESCC cells to antitumor agents is enhanced by OCT1 silencing whereas OCT1 overexpression has the opposite effect.
Discussion
ESCC is one of the most aggressive neoplasms and has poor clinical outcome [27, 28] that is partly attributable to the inherent resistance of ESCC cells to chemotherapy [29, 30]. It is important from a clinical standpoint to clarify the mechanisms underlying this resistance so that more effective treatments can be developed. In the present work, we determined that OCT1 was more highly expressed in ESCC relative to non-tumor tissue, whereas the opposite trend was observed for OCT4, OCT6, and OCT11. The results of the BSP and NGS experiments revealed that OCT1, OCT6, and OCT11 levels were negatively correlated with the methylation rate of their promoters, with a much lower rate observed for OCT1 than for OCT6 and OCT11. These results indicate that the altered methylation status may potentially participate in the dysregulated expression of these OCTs (OCT1, OCT6 or OCT11) in ESCC and the mechanism of OCT4's expression in ESCC needed for the further research. OCT1 may be a useful therapeutic target for ESCC treatment. However, functional redundancy among OCT proteins could contribute to the failure of single-target inhibitors; it is therefore worthwhile to determine the expression levels of all OCT family members.
There have been few studies to date investigating the role of OCT1 in ESCC [31, 32]. OCT1 was shown to act as a positive regulator of ESCC cells in conjunction with signal transducer and activator of transcription [31]. It was also suggested that high OCT1 expression enhances drug resistance in prostate cancer cells [32]. Therefore, OCT1 could function as an important regulator for cancer cells and the drug-resistance, however, the detailed of OCT1 function is still not very clearly. In prostate carcinoma cells, OCT1 could function by interacting with GATA binding protein 2 (GATA2), forkhead box A1 (FOXA1), or androgen receptor [32]. Moreover, OCTs transcription factors have been considered to participate in mediating the self-renew or the stemness features of cancerous cells [10]. In the present study, OCT1 overexpression increased proliferation in Het-1A cells whereas OCT1 knockdown in ESCC cell lines or patient-derived ESCC cells with high endogenous OCT1 expression had the opposite effect. Thus, modulating the expression of OCT1 either directly or indirectly by targeting its epigenetic modifiers is a potential strategy for overcoming the drug resistance of ESCC cells.
We previously demonstrated that OCT4 was expressed in ESCC clinical specimens and that OCT4 level was unrelated to T stage but was positively associated with histological grade of ESCC [10]. The results presented here are consistent with our earlier findings. Moreover, we found that OCT1 expression or promoter methylation was related to both T stage and histological grade. OCT transcription factors are key regulators of the proliferation, metastasis, and drug resistance of human cancer cells and are therefore promising targets of antitumor drugs.
Methylation of gene promoters is a regulatory mechanism that is typically associated with transcriptional repression [33-36]. For instance, hypermethylation of tumor suppressor gene promoters in tumor tissues results in the loss of gene expression, whereas hypomethylation of oncogene promoters leads to their aberrant activation [37-40]. Thus, the methylation status of genes promoters has clinical relevance in the context of cancer. In this study, we evaluated the methylation rate of OCT gene promoters directly by BSP and NGS. In contrast, traditional methylation-specific PCR can only detect the presence or absence of methyl marks at CpG sites in single clones [41-43]. Our method had greater efficiency as it allowed high-throughput screening of promoter regions. We also found that the rate of methylation of the OCT4 promoter was lower in ESCC compared to non-tumor tissue but that this was unrelated to transcript expression. Additional studies are needed to clarify the clinical significance of this observation.
Moreover, the previous studies mainly used existing current cell lines, but recent studies have shown that tumor cells are affected by tumor microenvironment and other factors in tumor tissues, which are different from current cell lines cultured in vitro for a long time [44]. The cell lines may not reflect the actual condition of the cells in the patient's tumor tissue [44]. A feasible strategy to solve this problem is to obtain and use PDCs, and there have been many reports on related studies [45-48]. Our research not only used three ESCC cell lines, but also established patient-derived cell lines as a supplement. This not only makes the results more credible, but also has guiding significance for related research.
Conclusion
Changes in promoter methylation status are responsible for the altered expression of OCT1, OCT6, and OCT11 in ESCC tissue. These results indicate that targeting these proteins or the factors regulating their methylation/demethylation - especially that of OCT1 - may be an effective strategy for the treatment of ESCC.
Abbreviations
OCTs, The Pit-Oct-Unt transcription factors/Octamer transcription factors; ESCC, esophageal squamous cell carcinoma; BSP, bisulfite genomic sequence; NGS, next generation sequencing; MSP, methylmion specific PCR.
Supplementary Material
Supplementary figures and tables.
Acknowledgements
This work was funded by “Foundation and Frontier Project of Henan Province (122300410101)”, “Science and Technology Research Project of Henan Health Department (201303021)” and “Special Research Foundation of Young Teachers” of Zhengzhou University (1421412089)”.
Author contributions
All authors made substantial contributions to the design and conception, acquisition, analysis, and interpretation of data. Authors took part in either drafting or revising the manuscript. At the same time, authors gave final approval of the version to be published and agree to be accountable for all aspects of the work in ensuring that questions related to the accuracy or integrity of any part of the work are appropriately investigated and resolved.
Competing Interests
The authors have declared that no competing interest exists.
References
1. Rudin CM, Poirier JT, Byers LA, Dive C, Dowlati A, George J. et al. Molecular subtypes of small cell lung cancer: a synthesis of human and mouse model data. Nat Rev Cancer. 2019;19:289-97
2. da Cunha FFM, Mugnol KCU, de Melo FM, Nascimento M, de Azevedo RA, Santos RTS. et al. Peptide R18H from BRN2 Transcription Factor POU Domain Displays Antitumor Activity In vitro and In vivo and Induces Apoptosis in B16F10-Nex2 Cells. Anticancer Agents Med Chem. 2019;19:389-401
3. Tang X, Zhao Y, Buchon N, Engstrom Y. The POU/Oct Transcription Factor Nubbin Controls the Balance of Intestinal Stem Cell Maintenance and Differentiation by Isoform-Specific Regulation. Stem Cell Reports. 2018;10:1565-78
4. Su D, Zhang D, Jin J, Ying L, Han M, Chen K. et al. Identification of predictors of drug sensitivity using patient-derived models of esophageal squamous cell carcinoma. Nat Commun. 2019;10:5076
5. Zhang Q, Zhao X, Zhang C, Wang W, Li F, Liu D. et al. Overexpressed PKMYT1 promotes tumor progression and associates with poor survival in esophageal squamous cell carcinoma. Cancer Manag Res. 2019;11:7813-24
6. Lagergren J, Smyth E, Cunningham D, Lagergren P. Oesophageal cancer. Lancet. 2017;390:2383-96
7. Zeng JD, Wu WKK, Wang HY, Li XX. Serine and one-carbon metabolism, a bridge that links mTOR signaling and DNA methylation in cancer. Pharmacol Res. 2019;149:104352
8. Raut N, Wicks SM, Lawal TO, Mahady GB. Epigenetic regulation of bone remodeling by natural compounds. Pharmacol Res. 2019;147:104350
9. Zhou X, Huang GR, Hu P. Over-expression of Oct4 in human esophageal squamous cell carcinoma. Mol Cells. 2011;32:39-45
10. He W, Li K, Wang F, Qin YR, Fan QX. Expression of OCT4 in human esophageal squamous cell carcinoma is significantly associated with poorer prognosis. World J Gastroenterol. 2012;18:712-9
11. Zhang Y, Li D, Jiang Q, Cao S, Sun H, Chai Y. et al. Novel ADAM-17 inhibitor ZLDI-8 enhances the in vitro and in vivo chemotherapeutic effects of Sorafenib on hepatocellular carcinoma cells. Cell Death Dis. 2018;9:743
12. Xie H, Tian S, Yu H, Yang X, Liu J, Wang H. et al. A new apatinib microcrystal formulation enhances the effect of radiofrequency ablation treatment on hepatocellular carcinoma. Onco Targets Ther. 2018;11:3257-65
13. Ma Y, Chai N, Jiang Q, Chang Z, Chai Y, Li X. et al. DNA methyltransferase mediates the hypermethylation of the microRNA 34a promoter and enhances the resistance of patient-derived pancreatic cancer cells to molecular targeting agents. Pharmacol Res. 2020;160:105071
14. Gao X, Chen H, Huang X, Li H, Liu Z, Bo X. ARQ-197 enhances the antitumor effect of sorafenib in hepatocellular carcinoma cells via decelerating its intracellular clearance. Onco Targets Ther. 2019;12:1629-40
15. Yang B, Wang C, Xie H, Wang Y, Huang J, Rong Y. et al. MicroRNA-3163 targets ADAM-17 and enhances the sensitivity of hepatocellular carcinoma cells to molecular targeted agents. Cell Death Dis. 2019;10:784
16. Yin F, Feng F, Wang L, Wang X, Li Z, Cao Y. SREBP-1 inhibitor Betulin enhances the antitumor effect of Sorafenib on hepatocellular carcinoma via restricting cellular glycolytic activity. Cell Death Dis. 2019;10:672
17. Feng Y, Xu X, Zhang Y, Ding J, Wang Y, Zhang X. et al. HPIP is upregulated in colorectal cancer and regulates colorectal cancer cell proliferation, apoptosis and invasion. Sci Rep. 2015;5:9429
18. Li F, Wei A, Bu L, Long L, Chen W, Wang C. et al. Procaspase-3-activating compound 1 stabilizes hypoxia-inducible factor 1alpha and induces DNA damage by sequestering ferrous iron. Cell Death Dis. 2018;9:1025
19. Guan F, Ding R, Zhang Q, Chen W, Li F, Long L. et al. WX-132-18B, a novel microtubule inhibitor, exhibits promising anti-tumor effects. Oncotarget. 2017;8:71782-96
20. Ma DB, Qin MM, Shi L, Ding XM. MicroRNA-6077 enhances the sensitivity of patients-derived lung adenocarcinoma cells to anlotinib by repressing the activation of glucose transporter 1 pathway. Cell Signal. 2019;64:109391
21. Ji Q, Xu X, Li L, Goodman SB, Bi W, Xu M. et al. miR-216a inhibits osteosarcoma cell proliferation, invasion and metastasis by targeting CDK14. Cell Death Dis. 2017;8:e3103
22. Liang Y, Xu X, Wang T, Li Y, You W, Fu J. et al. The EGFR/miR-338-3p/EYA2 axis controls breast tumor growth and lung metastasis. Cell Death Dis. 2017;8:e2928
23. Jia H, Yang Q, Wang T, Cao Y, Jiang QY, Ma HD. et al. Rhamnetin induces sensitization of hepatocellular carcinoma cells to a small molecular kinase inhibitor or chemotherapeutic agents. Biochim Biophys Acta. 2016;1860:1417-30
24. Wei L, Lun Y, Zhou X, He S, Gao L, Liu Y. et al. Novel urokinase-plasminogen activator inhibitor SPINK13 inhibits growth and metastasis of hepatocellular carcinoma in vivo. Pharmacol Res. 2019;143:73-85
25. Fan Z, Yang J, Zhang D, Zhang X, Ma X, Kang L. et al. The risk variant rs884225 within EGFR impairs miR-103a-3p's anti-tumourigenic function in non-small cell lung cancer. Oncogene. 2019;38:2291-304
26. Wang L, Zhao L, Jia X, Jiang L, Song Y, Ye Q. et al. Aminophenols increase proliferation of thyroid tumor cells by inducing the transcription factor activity of estrogen receptor alpha. Biomed Pharmacother. 2019;109:621-8
27. Li Z, Han C, Wang L, Zhu J, Yin Y, Li B. Prognostic Value of Texture Analysis Based on Pretreatment DWI-Weighted MRI for Esophageal Squamous Cell Carcinoma Patients Treated With Concurrent Chemo-Radiotherapy. Front Oncol. 2019;9:1057
28. Tang L, Liou YL, Wan ZR, Tang J, Zhou Y, Zhuang W. et al. Aberrant DNA methylation of PAX1, SOX1 and ZNF582 genes as potential biomarkers for esophageal squamous cell carcinoma. Biomed Pharmacother. 2019;120:109488
29. Zhang Z, Xiong R, Li C, Xu M, Guo M. LncRNA TUG1 promotes cisplatin resistance in esophageal squamous cell carcinoma cells by regulating Nrf2. Acta Biochim Biophys Sin (Shanghai). 2019;51:826-33
30. Yan T, Cui H, Zhou Y, Yang B, Kong P, Zhang Y. et al. Multi-region sequencing unveils novel actionable targets and spatial heterogeneity in esophageal squamous cell carcinoma. Nat Commun. 2019;10:1670
31. Wang Z, Zhu S, Shen M, Liu J, Wang M, Li C. et al. STAT3 is involved in esophageal carcinogenesis through regulation of Oct-1. Carcinogenesis. 2013;34:678-88
32. Yamamoto S, Takayama KI, Obinata D, Fujiwara K, Ashikari D, Takahashi S. et al. Identification of new octamer transcription factor 1-target genes upregulated in castration-resistant prostate cancer. Cancer Sci. 2019;110:3476-85
33. Li J, Hu WX, Luo SQ, Xiong DH, Sun S, Wang YP. et al. Promoter methylation induced epigenetic silencing of DAZAP2, a downstream effector of p38/MAPK pathway, in multiple myeloma cells. Cell Signal. 2019;60:136-45
34. Li S, Han Z, Zhao N, Zhu B, Zhang Q, Yang X. et al. Inhibition of DNMT suppresses the stemness of colorectal cancer cells through down-regulating Wnt signaling pathway. Cell Signal. 2018;47:79-87
35. Urbancic D, Kotar A, Smid A, Jukic M, Gobec S, Martensson LG. et al. Methylation of selenocysteine catalysed by thiopurine S-methyltransferase. Biochim Biophys Acta Gen Subj. 2019;1863:182-90
36. Shen Z, Zhou C, Li J, Ye D, Li Q, Wang J. et al. Promoter hypermethylation of miR-34a contributes to the risk, progression, metastasis and poor survival of laryngeal squamous cell carcinoma. Gene. 2016;593:272-6
37. Yoshida W, Terasaka M, Laddachote S, Karube I. Stabilization of G-quadruplex structure on vascular endothelial growth factor gene promoter depends on CpG methylation site and cation type. Biochim Biophys Acta Gen Subj. 2018;1862:1933-7
38. Wahl A, Kasela S, Carnero-Montoro E, van Iterson M, Stambuk J, Sharma S. et al. IgG glycosylation and DNA methylation are interconnected with smoking. Biochim Biophys Acta Gen Subj. 2018;1862:637-48
39. Wu R, Yan Y, Ma C, Chen H, Dong Z, Wang Y. et al. HMGB1 contributes to SASH1 methylation to attenuate astrocyte adhesion. Cell Death Dis. 2019;10:417
40. Gao XD, Qu JH, Chang XJ, Lu YY, Bai WL, Wang H. et al. Hypomethylation of long interspersed nuclear element-1 promoter is associated with poor outcomes for curative resected hepatocellular carcinoma. Liver Int. 2014;34:136-46
41. Shi L, Li X, Wu Z, Li X, Nie J, Guo M. et al. DNA methylation-mediated repression of miR-181a/135a/302c expression promotes the microsatellite-unstable colorectal cancer development and 5-FU resistance via targeting PLAG1. J Genet Genomics. 2018;45:205-14
42. Wang Y, He T, Herman JG, Linghu E, Yang Y, Fuks F. et al. Methylation of ZNF331 is an independent prognostic marker of colorectal cancer and promotes colorectal cancer growth. Clin Epigenetics. 2017;9:115
43. Wang Y, Zhang Y, Herman JG, Linghu E, Guo M. Epigenetic silencing of TMEM176A promotes esophageal squamous cell cancer development. Oncotarget. 2017;8:70035-48
44. Hou J, Hong Z, Feng F, Chai Y, Zhang Y, Jiang Q. et al. A novel chemotherapeutic sensitivity-testing system based on collagen gel droplet embedded 3D-culture methods for hepatocellular carcinoma. BMC Cancer. 2017;17:729
45. Li M, Ding X, Zhang Y, Li X, Zhou H, Yang L. et al. Antisense oligonucleotides targeting lncRNA AC104041.1 induces antitumor activity through Wnt2B/beta-catenin pathway in head and neck squamous cell carcinomas. Cell Death Dis. 2020;11:672
46. Sun H, Feng F, Xie H, Li X, Jiang Q, Chai Y. et al. Quantitative examination of the inhibitory activation of molecular targeting agents in hepatocellular carcinoma patient-derived cell invasion via a novel in vivo tumor model. Animal Model Exp Med. 2019;2:259-68
47. Yu C, Wang Y, Liu T, Sha K, Song Z, Zhao M. et al. The microRNA miR-3174 Suppresses the Expression of ADAM15 and Inhibits the Proliferation of Patient-Derived Bladder Cancer Cells. Onco Targets Ther. 2020;13:4157-68
48. Perello-Reus CM, Catala A, Caviedes-Cardenas L, Vega-Garcia N, Camos M, Perez-Torras S. et al. FMS-like tyrosine kinase 3 (FLT3) modulates key enzymes of nucleotide metabolism implicated in cytarabine responsiveness in pediatric acute leukemia. Pharmacol Res. 2020;151:104556
Author contact
![]() Corresponding author: Dr. and Prof. Wei He, Department of Oncology, the First Affiliated Hospital of Zhengzhou University, No. 1 of Jianshe Road, Er-Qi district, Zhengzhou City 450052, Henan province, China. Tel.: +86-371-66295953; Fax: +86-371-66295953; E-mail: hewei726edu.cn.
Corresponding author: Dr. and Prof. Wei He, Department of Oncology, the First Affiliated Hospital of Zhengzhou University, No. 1 of Jianshe Road, Er-Qi district, Zhengzhou City 450052, Henan province, China. Tel.: +86-371-66295953; Fax: +86-371-66295953; E-mail: hewei726edu.cn.