Impact Factor ISSN: 1837-9664

 Global reach, higher impact
J Cancer 2021; 12(5):1538-1547. doi:10.7150/jca.52320 This issue Cite
Research Paper
Plasma exosome-derived B-cell translation gene 1: a predictive marker for the prognosis in patients with non-small cell lung cancer
Lin Wan1#, Xiaochun Chen2#, Jun Deng3#, Shiliang Zhang4, Fan Tu4, Hao Pei4, Renjing Hu1 ![]() , Jun Liu4
, Jun Liu4 ![]() , Hao Yu3
, Hao Yu3 ![]()
1. Department of Laboratory Medicine, Wuxi Second People's Hospital, Wuxi214000, China
2. Department of Laboratory Medicine, Taizhou Second People's Hospital, Taizhou 225300, China
3. Department of Interventional Oncology, Wuxi Fifth People's Hospital, Wuxi214005, China
4. Department of Laboratory Medicine, Wuxi Fifth People's Hospital, Wuxi214005, China
#These authors contributed equally to this work.
Received 2020-8-24; Accepted 2020-12-4; Published 2021-1-5
Abstract

Objective: In this study, we wanted to investigate the plasma exosome-derived B-cell translocation gene 1 (BTG-1) level as a predictive marker for the prognosis in patients with Non-small cell lung cancer (NSCLC).
Patients and Methods: The expression of BTG-1 protein and BTG-1 mRNA in NSCLC tissues and adjacent tissues of 98 enrolled patients were detected by immunohistochemistry (IHC), and RT-PCR. Exosome-rich fractions were isolated from the plasma of 262 NSCLC patients. ELISA was used to detect plasma exosome-derived BTG-1 levels to evaluate the predictive value for the prognosis in patients with NSCLC.
Results: IHC staining showed that the positive expression rate of BTG-1 protein in NSCLC tissues was 58.16%, whereas that in adjacent tissues was 91.84%. RT-PCR showed that BTG-1 mRNA expression was significantly lower in NSCLC tissues than in adjacent tissues (52.04% vs 87.76%, P < 0.05). Moreover, low plasma exosome-derived BTG-1 levels were related to tumor diameter, stage, metastasis, the degree of tumor differentiation, and abnormal carcinoembryonic antigen (CEA) levels. Multivariate Cox regression analysis showed that both the disease-free survival (DFS) and overall survival (OS) were shorter in patients with low plasma exosome-derived BTG-1 level compared with patients with high plasma exosome-derived BTG-1 level.
The AUROC of plasma exosome-derived BTG-1 for 3-year DFS and 3-year OS were 0.94(95% CI; 0.91-0.98) and 0.94(95% CI: 0.90-0.98), respectively. For 3-year DFS, plasma exosome-derived BTG-1 had a sensitivity 91.0% and a specificity 82.3% for 3-year DFS, and a sensitivity 81.7% and a specificity 93.0% for 3-year OS, respectively.
Conclusions: Plasma exosome-derived BTG-1 may be a potential biomarker for the prognosis in patients with NSCLC.
Keywords: B-cell translocation gene 1, non-small cell lung cancer, exosomal, prognosis, biomarker
Introduction
Lung cancer is a major cause of cancer-related death worldwide [1,2], causing approximately 1.6 million deaths each year [3,4]. Non-small cell lung cancer (NSCLC) accounts for 85% of all primary lung cancers [5], and most patients already have advanced stage disease at the time of diagnosis, resulting in a poor prognosis [6,7]. In recent years, targeted therapies and immunotherapies have shown good results in the treatment of advanced NSCLC, effectively improving patient survival [8,9]. However, the presence of distant metastasis in most patients with NSCLC results in high mortality rates [10,11]. Approximately 40% of new NSCLC cases exhibit metastasis at the time of diagnosis, and most patients have low 5-year survival rates. Liu et al. [12] established radiomics nomogram is a noninvasive preoperative prediction tool for malignant pulmonary nodule diagnosis. However, there was still a lack of tumor markers for early diagnosis and prognostic evaluation of NSCLC. Hence, it is important to find noninvasive, readily available, and highly specific biomarkers in the early diagnosis and prognostic evaluation of patients with NSCLC.
Members of the B-cell translocation gene (BTG) family, including BTG-1-4, Tob1, and Tob2, regulate cell growth, promote cell differentiation and maturation, and inhibit apoptosis [13-16]. BTG-1 expression is regulated by p53 [17] and modulates cell proliferation and differentiation. When the cell enters the proliferation cycle, BTG-1 is downregulated [18]. Moreover, BTG-1 plays important roles in promoting apoptosis and suppressing the invasion and metastasis of tumor cells [19]. Several studies have shown that BTG-1 expression is reduced in many tumors, including breast [20], hepatocellular [21], and ovarian cancers [22], and is closely related to the growth, metastasis, and invasion of tumors. However, the expression of BTG-1 in NSCLC has not been reported.
Exosomes are vesicular structures, which are widely distributed in blood cells, dendritic cells, tumor cells and other cells [23, 24]. They can be released under physiological and pathological conditions. In recent years, a growing number of studies have reported that exocrine contains many important proteins, which can be used for early diagnosis or prognosis analysis of cancer patients [25, 26]. Thus, in this study, we aimed to evaluate the levels of plasma exosome-derived BTG-1 and determine its prognostic value in patients with NSCLC.
Materials and Methods
Patients & clinical samples
We collected blood samples and from 262 patients with NSCLC admitted to the Wuxi Second People's Hospital, Wuxi Fifth People's Hospital and the Taizhou Second People's Hospital from December 2015 to June 2019. Of all the 262 enrolled patients, the NSCLC tissues and adjacent tissues were obtained from 98 cases. All patients underwent surgical resection. The inclusion criteria for diagnosing NSCLC were as follows: (1) NSCLC was diagnosed clinically and pathologically; (2) paraffin specimens were available for analysis; (3) patients had not undergone pre-operative radiotherapy or chemotherapy; and (4) complete clinical data were available. The exclusion criteria were as follows: (1) complicated with other malignant tumors; (2) complicated with primary brain, kidney, heart, liver, or other organ dysfunction; (3) complicated with autoimmune diseases; (4) incomplete clinical data; and (5) lost to follow up.
The baseline clinical data were collected from medical records and included demographic features (age, sex, and smoking and drinking habits), tumor characteristics (tumor size, lymph node metastasis, TNM stage, and pathological differentiation [degree of differentiation of tumor tissues, defined as similarities to normal tissues with regard to morphology and function]), and tumor markers (carcinoembryonic antigen [CEA]; abnormal CEA was defined as a CEA level > 5 ng/mL). Tumor tissues and paired adjacent tissues were isolated during surgery, fixed in 10% neutral-buffered formalin, and embedded in paraffin wax, which were used for detection of BTG-1 expression.
Patients were followed up through December 30, 2019, with a median follow-up duration of 38.5 months (range: 12.0-49.0 months). The survival data were collected from follow-up records, and disease-free survival (DFS) and overall survival (OS) were calculated. DFS was defined as the duration from resection to disease recurrence, disease progression, or death. OS was defined as the time interval from resection to death. The follow-up results for the 262 patients enrolled in this study were obtained by medical records and telephone interviews. All specimens were collected after obtaining informed consent from the patients. The study was approved by the Ethics Committees of the Taizhou Second People's Hospital (identification nos. HMU [Ethics] 2017003).
Immunohistochemistry (IHC)
IHC was performed to detect the distribution of BTG-1 expression. An Envision and DAB chromogenic reagent kit (Antibody Diagnostic Inc., USA) was used for IHC analysis. Briefly, paraffin-embedded specimens were dewaxed in xylene and a graded series of ethanol concentrations (absolute, 95%, 85%, and 75%), and antigen retrieval was performed using citrate buffer. Next, specimens were incubated with 10% goat serum at room temperature for 30 min. The primary antibody was diluted 1:100 (sheep anti-human BTG-1 polyclonal antibodies) and was incubated with the sections for 60 min at room temperature. Sections were then incubated with secondary antibodies at room temperature for 1 h and washed with DAB solution (Jinqiao Company, China) at room temperature for 5 min. Counterstaining was performed using hematoxylin with 1% hydrochloric acid and ammonia water anti-blue for 20 s. The positive area was observed under an optical microscope, and the proportion of the positive area was calculated.
IHC results were assessed by two pathologists, and positively stained cells in NSCLC tissues and adjacent tissues were observed. Each section was randomly selected with 10 high-power fields, and 100 tumor cells were counted in each field. BTG-1 was localized in the nucleus under light microscopy. Staining scores were as follows: negative (-), there was no brown-yellow positive staining in tumors or glandular epithelial cells; weakly positive (+), the number of positive cells was less than 25%; positive (++), the number of positive cells ranged from 25% to 50%; strongly positive (+++), the number of positive cells was more than 50%. For the convenience of data statistical analysis, negative (-) and weakly positive (+) were defined as low expression, and positive (++) and strongly positive (+++) were defined as high expression.
Detection of BTG-1 mRNA expression by RT-PCR
Total RNA was isolated from tissue using Trizol method, and was quantificated by Nandrop spectrophotometer. Total RNA (10 μg per sample) was isolated and used to generate complementary DNA. Sequences of the primers used were as follows: BTG-1: Forward: 5'-CTGCAGACCTTCAGCCAGA-3', Reverse: 5'-CGAATACAACGGTAACCCGA-3'; β-actin: 5'-TTCCAGCCTTCCTTCCTGGG-3', Reverse: 5'-TTGCGCTCAGGAGGAGGAAT-3'. It was amplified by semi quantitative polymerase chain reaction with beta-actin as reference. Thermal cycling conditions were as follows: predenaturation at 60℃ for 2 min; 40 cycles of 94℃ for 10min, 94℃ for 15s, and 62℃ for 60s. Amplication of BTG-1 by PCR was examined agarose gel electrophoresis using a Quantity-One electrophoresis apparatus. The absorbance (a) value of the belt and the reference were read, and the results were expressed by the ratio (sample value/reference value).
Plasma exosome isolation
Remove the cells 1- 2ml human plasma (1×PBS should be diluted 5 times) with centrifuged at 500×g at 4℃ for 5 min. The supernatant, 2000×g, centrifuged at 4℃ for 10 min to remove cell debris. Large vesicles after centrifuged at 10 000×g at 4℃ for 30 min were removed. The large particles which may be mixed in the operation process was removed by filtering the supernatant with a 0.45 μm filter. The filtered supernatant was taken to the ultracentrifugation tube and 1 × PBS buffer solution was added to fill up the remaining volume to weigh and balance accurately. Put the tube on the rotor of the ultracentrifuge, centrifuge at 100000×g, 4℃ for 2 hours. The supernatant was discarded after centrifugation and at the bottom of the tube translucent sediment could be seen. The sediment was resuspended in 1×PBS buffer and centrifuged at 100 000×g at 4℃ for 80 min. 100-200 μl 1×PBS buffer was used to resuspend the exosomes which was transferred to 1.5 ml EP tube. downstream experiments can be carried out directly and stored at - 80℃ according to the requirements of follow-up experiments.
Transmission electron microscopy (TEM)
After centrifugation,100 μ l phosphate buffer (PBS) was used to resuspend the exosome precipitate. On the copper wire mesh 20 μ l of heavy suspension was loaded. At room temperature the sample was left standing for 2 min. From the side of the filter screen the liquid was carefully absorbed with filter paper. At room temperature 20 μ l of 3% phosphotungstic acid solution was dripped into the solution and dyed. The copper mesh was then washed with double distilled water for 5 times. The samples were observed and photographed by using transmission electron microscope (Thermo-Fischer, Waltham, MA, USA) after natural drying at room temperature.
Nanoparticle tracking analysis (NTA)
By using a pipette, the exosome suspension was evenly blown and with 1 × PBS buffer the exosome suspension was diluted 400-1000 times and at last the exosome suspension was filtered by 0.22 μ m filter to adjust to the optimal detection concentration (20-100 particals per field) of NanoSight NS300, and 1ml was injected into the instrument. The sample was irradiated with a laser (blue 488), and to record the movement of nanoparticles due to Brownian motion for 60 seconds the average frame rate of 20 frames per second was used. Each process is repeated three times. The data were output and the size distribution and particle concentration of exosomes was analyzed by NTA 3.3 software finally.
Western blotting
For obtaining total proteins, exosomes were isolated and added to sodium dodecyl sulfate (SDS) buffer. By using SDS-PAGE gel total protein was separated and transferred onto PVDF (polyvinylidene difluoride) membranes (Millipore, USA). Membranes was blocked in 5% non-fat milk for 1 h and then incubated overnight at 4 °C with the indicated primary antibodies, including an Annexin V, TSG101, CD9 and CD63 were obtained from Santa Cruz Biotechnology, Inc., (Texas, USA). Finally, membranes were incubated by using secondary antibodies for 1 h at room temperature.
ELISA
Residual cells were removed from the plasma sample and with 1 × PBS (1:500 dilution) cell fragments was diluted. On ice the exosomes were precipitated with 100 ml RIPA lysate for half an hour. PBS (1:3 dilution) was used to dilute the samples after shaking and mixing. The standard substance and blank control were added to the microplate and then coated with BTG-1 antibody. The diluted exosome samples were 100 μL. After incubated at 37 ℃ for 60 min, the liquid in the microplate was shook off and then pat dry the microplate, add liquid a, incubate at 37 ℃ for 60 min, wash the plate for 3 times. Add liquid B in the plate, incubate at 37 ℃ for 30 min, wash the plate for 5 times. Add 90 μL substrate and then the plate was incubated at 37 ℃ away from light for 15 min. Finally add 50 μ L of termination solution and immediately measured at 450 nm wavelength. The above methods were used to detect the level of plasma BTG-1 as a control group at the same time.
Statistical analysis
Statistical analyses were performed with SPSS 24.0 software (IBM). Data were presented as means ± standard deviations, medians (ranges), or counts (percentages). By using McNemar's test, the expression of BTG-1 in tumor tissue and paired adjacent tissue was compared. Chi square tests or Wilcoxon's rank-sum tests was used to perform the correlation analyses. Kaplan-Meier curves showed DFS and OS. Log-rank test was used to determine the differences in DFS and OS between groups. ROC curve analysis was used to assess the prognostic value of plasma exosome-derived BTG-1 levels in osteosarcoma. Result with P value < 0.05was deemed to consider significant.
Results
Baseline characteristics
Among the 262 patients with NSCLC enrolled in this study, 195 (74.43%) were men, and 67 (25.57%) were women. Eighty-six patients (32.82%) were less than 60 years of age, and 174 patients (67.18%) were 60 years of age or older (Table 1). The numbers of patients with high, moderate, and poor tumor differentiation were 48 (18.32%), 159 (60.69%), and 55 (20.99%), respectively. Tumor size was less than 5 cm in 89 cases (40.84%) and greater than 5 cm in 155 cases (59.16%). Moreover, 99 patients (37.79%) had lymph node metastasis. In addition, 136 patients (51.91%) and 95 patients (36.26%) had a history of smoking or drinking, respectively, and 83 (31.68%), 89 (33.97%), and 90 patients (34.35%) had TNM stages I, II, and III disease, respectively. The median CEA level was 6.0 (0.8-1850.6) ng/ml.
Baseline characteristics of enrolled NSCLC patients
| Characteristic | NSCLC patients (n = 262) |
|---|---|
| Gender | |
| Male | 195 (74.43) |
| Female | 67 (25.57) |
| Age (years) | |
| <60 | 86 (32.82) |
| ≥60 | 176 (67.18) |
| Tumor diameter (cm) | |
| <5 | 89 (40.84) |
| ≥5 | 155 (59.16) |
| The history of smoking and drinking | |
| Smoke, No (%) | 136 (51.91) |
| Drink, No (%) | 95 (36.26) |
| Degree of tumor differentiation | |
| high differentiation | 48 (18.32) |
| Moderate differentiation | 159 (60.69) |
| poor differentiation | 55(20.99) |
| Lymph node metastasis | |
| YES | 99 (37.79) |
| NO | 163 (62.21) |
| Tumor stage | |
| I | 83 (31.68) |
| II | 89 (33.97) |
| III | 90 (34.35) |
| CEA (ng/ml) | 6.0 (0.8-1850.6) |
BTG-1 protein and BTG1 mRNA expression in NSCLC tissues and adjacent tissues
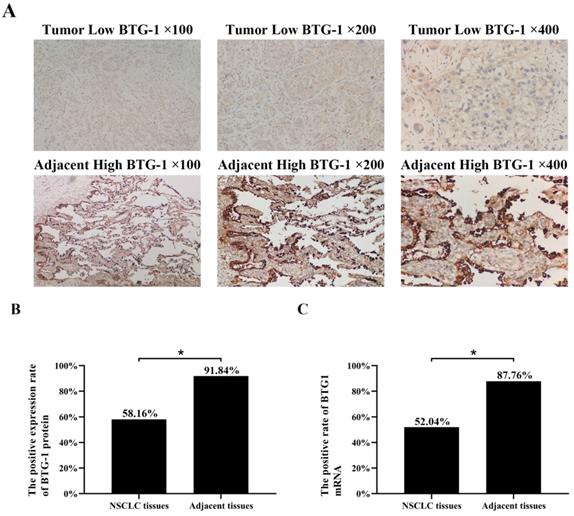
IHC was used to evaluate the expression of BTG-1 in NSCLC tissues and adjacent tissues. Notably, BTG-1 protein expression was significantly lower in NSCLC tissues than in adjacent tissues (Figure 1A). The positive expression rate of BTG-1 protein in NSCLC tissues was 58.16% (57/98), whereas that in adjacent tissues was 91.84% (90/98) (P < 0.05; Figure 1B). RT-PCR was used to detect the expression of BTG1 mRNA in the enrolled NSCLC tissues and adjacent tissues. The results showed that the positive rate of BTG1 mRNA in NSCLC was 52.04% (51/98), which was significantly lower than that in adjacent tissues 87.76% (86/98) (P < 0.05; Figure 1C).
BTG-1 protein and BTG-1 mRNA expression in NSCLC tissues and adjacent noncancerous tissues. (A)Low BTG-1 expression in NSCLC tissues at 100×, 200×, and 400× magnification; High BTG-1 expression in adjacent tissues at 100×, 200×, and 400× magnification; (B) The positive rate of BTG-1 protein expression in NSCLC cancer tissues and adjacent tissues;(C) The positive rate of BTG-1 mRNA expression in NSCLC cancer tissues and adjacent tissues.
Characterization of exosomes isolated from plasma
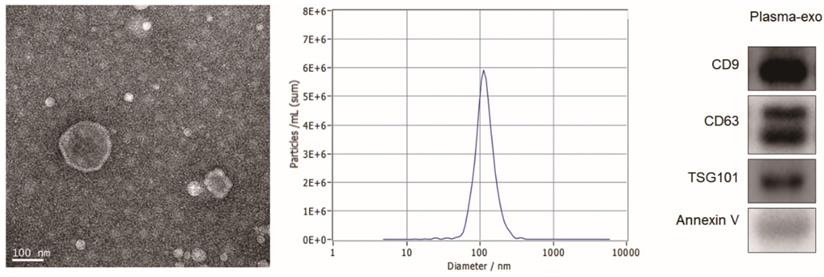
TEM, NTA and western blot analysis were used to confirm the exosome integrity and purification. The exosomes were obtained by gradient ultracentrifugation at low temperature and then fixed and stained. TEM images showed that the exosomes were round or quasi circular vesicles with a diameter of about 40-100 nm, with complete capsule and clear background (Figure 2A). The NTA data revealed that the diameter of plasma exosome-derived BTG-1 in patients with NSCLC mainly concentrated in 60 -110 nm, and the maximum distribution peak was 102.5 nm (Figure 2B). Western blot analysis showed that the expression of exosome markers including Annexin V, Tsg101, CD9 and CD63 were found in plasma exosomes (Figure 2C).
Patient exosome characterization. (A)TEM images showed that the exosomes were round or quasi circular vesicles with a diameter of about 40-100 nm, with complete capsule and clear background. (B)The NTA data revealed that the diameter of plasma exosome-derived BTG-1 in patients with NSCLC mainly concentrated in 60 -110 nm, and the maximum distribution peak was 102.5 nm. (C)Western blot analysis showed that the expression of exosome markers including Annexin V, Tsg101, CD9 and CD63 were found in plasma exosomes.
Relationship between plasma exosome-derived BTG-1 levels and tumor characteristics
Next, the correlations between plasma exosome-derived BTG-1 levels and tumor characteristics in patients with NSCLC were assessed. Single factor analysis showed that low plasma exosome-derived BTG-1 levels was not related to sex or age (both P > 0.05), but was related to tumor diameter, stage, tumor metastasis, the degree of tumor differentiation, and abnormal CEA levels (all P < 0.05; Table 2).
Correlation of low plasma exosome-derived BTG-1 levels with characteristics features in NSCLC patients
| Characteristic | n | Low plasma exosome-derived BTG-1 levels | x2 | P |
|---|---|---|---|---|
| Gender, No (%) | ||||
| Male | 195 | 117 (60.00) | 0.155 | 0.588 |
| Female | 67 | 35 (52.24) | ||
| Age (years), No (%) | ||||
| <60 | 86 | 46 (53.49) | 0.172 | 0.673 |
| ≥60 | 176 | 106 (60.23) | ||
| Tumor diameter (cm), No (%) | ||||
| <5 | 89 | 40 (44.94) | 0.147 | < 0.001 |
| ≥5 | 155 | 112 (72.26) | ||
| Degree of tumor differentiation, No (%) | ||||
| High differentiation | 48 | 12 (31.11) | 0.233 | < 0.001 |
| Moderate differentiation | 159 | 112 (70.44) | ||
| Poor differentiation | 55 | 28 (50.91) | ||
| Lymph node metastasis, No (%) | ||||
| YES | 99 | 65 (65.66) | 0.209 | 0.026 |
| NO | 163 | 87 (53.37) | ||
| Tumor stage, No (%) | ||||
| I | 83 | 28 (33.73) | 7.433 | < 0.001 |
| II | 89 | 49 (55.06) | ||
| III | 90 | 75 (83.33) | ||
| CEA (ng/ml), No (%) | ||||
| Normal | 77 | 30 (38.96) | 0.184 | < 0.001 |
| Abnormal | 185 | 122 (65.95) |
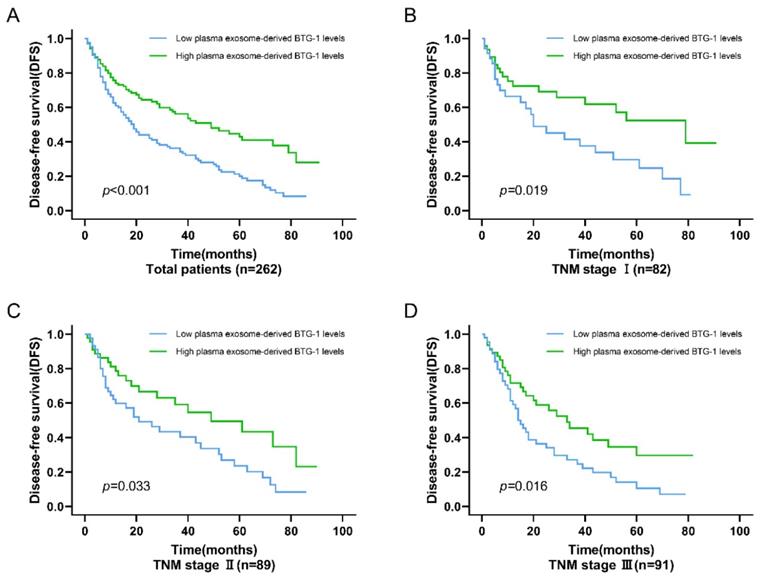
Among all patients with NSCLC, DFS was worse in patients who had low plasma exosome-derived BTG-1 levels compared with that in patients with high plasma exosome-derived BTG-1 levels (P < 0.001; Figure 3A). Moreover, in patients with distinct TNM stages, multivariate Cox's regression analysis showed that DFS was shorter in patients with low plasma exosome-derived BTG-1 levels than in patients with high plasma exosome-derived BTG-1 levels for those with TNM stage I (P = 0.019), II (P = 0.033), and III disease (P = 0.016; Figure 3B-D).
Association of plasma exosome-derived BTG-1 level with DFS in patients with NSCLC. (A) Among all patients with NSCLC, DFS was worse in patients who had low plasma exosome-derived BTG-1 levels compared with that in patients with high plasma exosome-derived BTG-1 levels (P < 0.001); (B) DFS was shorter in patients with low plasma exosome-derived BTG-1 levels than in patients with high plasma exosome-derived BTG-1 levels for those with TNM stage I (P = 0.019); (C) DFS was shorter in patients with low plasma exosome-derived BTG-1 levels than in patients with high plasma exosome-derived BTG-1 levels for those with TNM stage I II (P = 0.033); (D) DFS was shorter in patients with low plasma exosome-derived BTG-1 levels than in patients with high plasma exosome-derived BTG-1 levels for those with TNM stage III (P = 0.016).
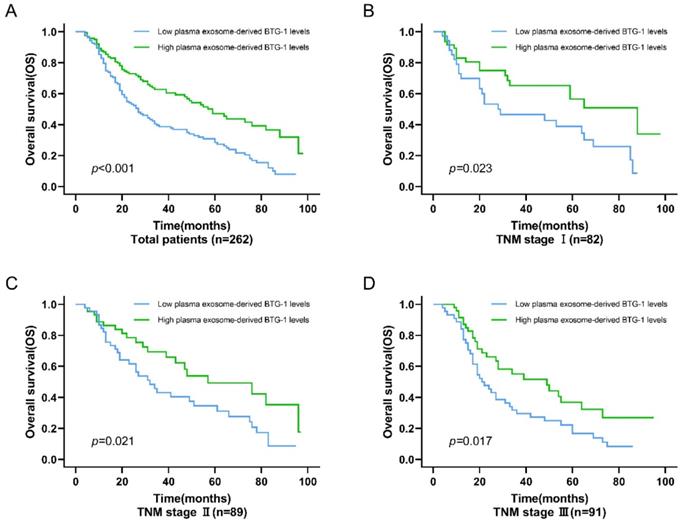
For OS, among all patients, the OS of patients with low plasma exosome-derived BTG-1 levels was shorter than that in patients with high plasma exosome-derived BTG-1 levels (P < 0.001; Figure 4A). Additionally, in patients with TNM stage I (P = 0.023; Figure 4B), II (P = 0.021), and III disease (P = 0.017; Figure 4C, D), OS was decreased in patients with low plasma exosome-derived BTG-1 levels compared with that in patients with high plasma exosome-derived BTG-1 levels.
Association of exosome-derived BTG-1 level with OS in patients with NSCLC. (A) Among all patients, the OS of patients with low plasma exosome-derived BTG-1 levels was shorter than that in patients with high plasma exosome-derived BTG-1 levels (P < 0.001); (B) OS was shorter in patients with low plasma exosome-derived BTG-1 levels than in patients with high plasma exosome-derived BTG-1 levels for those with TNM stage I (P = 0.023); (C) OS was shorter in patients with low plasma exosome-derived BTG-1 levels than in patients with high plasma exosome-derived BTG-1 levels for those with TNM stage I II (P = 0.021); (D) OS was shorter in patients with low plasma exosome-derived BTG-1 levels than in patients with high plasma exosome-derived BTG-1 levels for those with TNM stage III (P = 0.017).
Prognostic value of plasma exosome-derived BTG-1 levels in patients with NSCLC
We assessed the prognostic value of plasma exosome-derived BTG-1 using ROC curve analysis (Table 3). As shown (Figure 5A), the AUROC of plasma exosome-derived BTG-1, as 3-year DFS prediction biomarkers, was 0.94 (95% CI; 0.91-0.98), while the AUROC of plasma BTG-1 was 0.58 (95% CI; 0.48-0.67). With the cutoff value of 226.25, the positive predictive value, positive likelihood ratio of plasma exosome-derived BTG-1 were 81.3 (95%CI: 70.7-89.4), and 5.14 (95%CI: 3.2-8.3). The negative predictive value and negative likelihood ratio were 91.5 (95%CI: 82.5-96.8) and 0.11 (95%CI: 0.05-0.2) for prediction, with a sensitivity 91.0 (95%CI: 81.5-96.6) and a specificity 82.3 (95% CI: 72.1-90.0).
The prognostic value of plasma exosome-derived BTG-1 levels in NSCLC patients
| Variable | NSCLC patients (n = 262) |
|---|---|
| AUROC (3-year DFS) | 0.94(0.91-0.98) |
| Cutoff value (95%CI) | 226.25 |
| Sensitivity, % | 91.0(81.5-96.6) |
| Specificity, % | 82.3(72.1-90.0) |
| Positive predictive value, % | 81.3(70.7-89.4) |
| Negative predictive value, % | 91.5(82.5-96.8) |
| Positive likelihood ratio | 5.14(3.2-8.3) |
| Negative likelihood ratio | 0.11(0.05-0.2) |
| AUROC (3-year OS) | 0.94(0.90-0.98) |
| Cutoff value (95%CI) | 252.33 |
| Sensitivity, % | 81.7(69.6-90.5) |
| Specificity, % | 93.0(85.4-97.4) |
| Positive predictive value, % | 89.1(77.8-95.9) |
| Negative predictive value, % | 87.9(79.4-93.8) |
| Positive likelihood ratio | 11.71(5.4-25.6) |
| Negative likelihood ratio | 0.20(0.1-0.3) |
Diagnostic power of plasma exosome-derived BTG-1 levels for the prognosis in patients with NSCLC. (A) The AUROC of plasma exosome-derived BTG-1 for 3-year DFS was 0.94(95% CI; 0.91-0.98), while the AUROC of plasma BTG-1 was 0.58(95% CI; 0.48-0.67); (B) The AUROC of plasma exosome-derived BTG-1 for 3-year OS was 0.94(95% CI: 0.90-0.98), while the AUROC of plasma BTG-1 was 0.59(95% CI; 0.50-0.68).
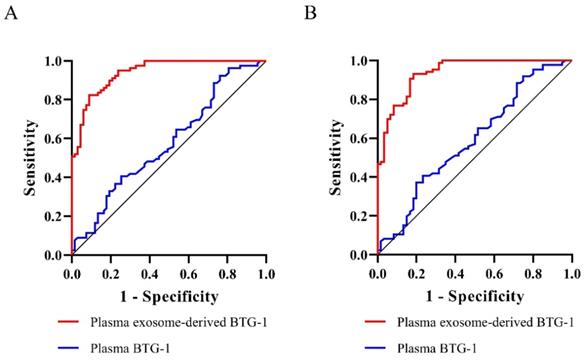
For 3-year OS, the AUROC of plasma exosome-derived BTG-1 was 0.94 (95% CI: 0.90-0.98), while the AUROC of plasma BTG-1 was 0.59 (95% CI; 0.50-0.68) (Figure 5B). With the cutoff value of 252.33, the positive predictive value, positive likelihood ratio of plasma exosome-derived BTG-1 were 89.1 (95% CI: 77.8-95.9), and 11.71 (95% CI: 5.4-25.6). The negative predictive value and negative likelihood ratio were 87.9 (95% CI: 79.4-93.8) and 0.20(95% CI: 0.1-0.3) for prediction, with a sensitivity 81.7 (95% CI: 69.6-90.5) and a specificity 93.0 (95% CI: 85.4-97.4).
Discussion
BTG-1 is a member of the BTG/Tob antiproliferation gene family [27,28] and has been shown to block the rate of cell proliferation [29,30] by modulating the cell cycle distribution. For example, when cells are in the G0/G1 phase, BTG-1 expression is high, which can promote neovascularization and cell differentiation [31]. The occurrence and development of tumors are related to unrestricted cell proliferation and reduced apoptosis rates [32]. Importantly, several studies have shown that BTG-1 may induce apoptosis in tumor cells, suggesting that BTG-1 may be a tumor-suppressor gene.
In previous studies, Sheng et al. [33] showed the expression of BTG-1 protein was significantly lower in breast cancer tissue than in normal tissue. Moreover, low BTG-1 expression was significantly related to tumor invasion, lymph node metastasis, clinical stage, and histological grade in patients with breast cancer, and the OS of patients with low BTG-1 expression was shortened, suggesting a relationship between low BTG-1 expression and poor prognosis. Zhao et al. [21] showed that BTG-1 overexpression inhibited the proliferation, metastasis, and invasion of tumor cells; induced the sensitivity of tumor cells to cisplatin; and promoted G1 phase arrest and apoptosis. Additionally, BTG-1 mRNA expression is negatively correlated with FIGO stage in ovarian cancer. However, the expression and biological roles of BTG-1 in NSCLC remain unclear, and also the expression and diagnosis values of BTG-1 for the prognosis in patients with NSCLC remain unclear. To date, this is the first study to examine the potential of plasma exosome-derived BTG-1 in NSCLC diagnosis.
In this study, we found that BTG-1 expression was lower in NSCLC tissues than in adjacent tissues. In order to study the role of plasma exosome-derived BTG-1 in patients with NSCLC, we extracted exosomes from the plasma of patients with NSCLC.
TEM, NTA and western blot analysis were used to confirm the exosome integrity and purification. TEM images showed that the exosomes were round or quasi circular vesicles with a diameter of about 40-100 nm, with complete capsule and clear background. The NTA data revealed that the diameter of plasma exosome-derived BTG-1 in patients with NSCLC mainly concentrated in 60 -110 nm, and the maximum distribution peak was 102.5 nm. Western blot analysis showed that the expression of exosome markers including Annexin V, Tsg101, CD9 and CD63 were found in plasma exosomes.
Next, the correlations between plasma exosome-derived BTG-1 levels and tumor characteristics in NSCLC patients were assessed. The results showed that plasma exosome-derived BTG-1 levels were related to tumor diameter, stage, tumor metastasis, the degree of tumor differentiation, and abnormal CEA levels, in accordance with previous findings for BTG-1 protein expression in other cancers. Low plasma exosome-derived BTG-1 levels were observed in the poor differentiation group and were associated with abnormal CEA levels, tumor diameter greater than or equal to 5 cm, stage III disease, and lymph node metastasis. Moreover, DFS and OS were shorter in patients with low plasma exosome-derived BTG-1 levels.
Finally, we assessed the prognostic value of plasma exosome-derived BTG-1 levels in patients with NSCLC. Plasma exosome-derived BTG-1 had higher accuracy in predicting 3-year DFS and 3-year OS. Both the sensitivity and specificity for them had good performances. For 3-year DFS, plasma exosome-derived BTG-1 had a sensitivity 91.0% and a specificity 82.3% for 3-year DFS, and a sensitivity 81.7% and a specificity 93.0% for 3-year OS, respectively. Of note, the performances of plasma exosome-derived BTG-1 were exceeded to plasma BTG-1 both in prediction for3-year DFS and 3-year OS.
This study also had several limitations which should be noted. First, although this was the largest study evaluating plasma exosome-derived BTG-1 levels in NSCLC to date, additional clinical patient validation is necessary to confirm the findings. Second, this study did not discuss plasma exosome-derived BTG-1 levels in patients with other types of lung cancer. Finally, we did not perform an assessment of the mechanisms of BTG-1 function, including up- and downstream genes, in NSCLC.
Conclusion
In summary, our study revealed that low plasma exosome-derived BTG-1 levels were closely related to the occurrence, development, and prognosis of NSCLC. These findings may facilitate the establishment of plasma exosome-derived BTG-1 level as a novel biomarker for 3-year DFS and 3-year OS in NSCLC patients.
Abbreviations
BTG-1: B‑cell translocation gene 1; NSCLC: non-small cell lung cancer; CEA: abnormal carcinoembryonic antigen; IHC: Immunohistochemistry; NTA: Nanoparticle tracking analysis; TEM: Transmission electron microscopy; DFS: disease-free survival; OS: overall survival.
Acknowledgements
Funding
This research was supported by the Youth Medical Talent of Jiangsu Province (grant no. QNRC2016163) and Wuxi Key Laboratory of science, education and health [grant no. CXPT(sys) 001].
Ethics approval and consent to participate
The study was approved by the Ethics Committees of the Taizhou Second People's Hospital (identification nos. HMU [Ethics] 2017003).
Consent for publication
All specimens were collected after obtaining informed consent from the patients.
Availability of data and materials
All data relevant to the study are included in the article.
Author Contributions
L.W. contributed to study concept and design; acquisition of data; analysis and interpretation of data; drafting of the manuscript; X.C. contributed to study concept, study supervision and critical revision of the manuscript; J.D. and F.T. contributed to study supervision and critical revision of the manuscript; S.Z. and H.P. contributed to statistical analysis; R.H., J.L., and H.Y. contributed to study concept and design, study supervision and critical revision of the manuscript.
Competing Interests
The authors have declared that no competing interest exists.
References
1. Whyte RI. Commentary: On-demand computed tomography screening for lung cancer-some surprising results. J Thorac Cardiovasc Surg. 2020;160:832-833
2. Ricciuti B, Lamberti G, Andrini E. et al. Antibody-drug conjugates for lung cancer in the era of personalized oncology. Semin Cancer Biol. doi:10.1016/j.semcancer.2019.12.024
3. Yoo JK, Lee JM, Kang SH. et al. The novel microRNA hsa-miR-CHA1 regulates cell proliferation and apoptosis in human lung cancer by targeting XIAP. Lung Cancer. 2019;132:99-106
4. Vainshelboim B, Lima RM, Edvardsen E. et al. Cardiorespiratory fitness, incidence and mortality of lung cancer in men: A prospective cohort study. J Sci Med Sport. 2019;22:403-407
5. Gubens MA, Sequist LV, Stevenson JP. et al. Pembrolizumab in combination with ipilimumab as second-line or later therapy for advanced non-small-cell lung cancer: KEYNOTE-021 cohorts D and H. Lung Cancer. 2019;130:59-66
6. Heilbroner SP, Xanthopoulos EP, Buono D. et al. Impact of estrogen monotherapy on survival in women with stage III-IV non-small cell lung cancer. Lung Cancer. 2019;129:8-15
7. Gemine RE, Ghosal R, Collier G. et al. Longitudinal study to assess impact of smoking at diagnosis and quitting on 1-year survival for people with non-small cell lung cancer. Lung Cancer. 2019;129:1-7
8. Sa H, Song P, Ma K. et al. Perioperative Targeted Therapy Or Immunotherapy In Non-Small-Cell Lung Cancer. Onco Targets Ther. 2019;12:8151-8159
9. Tomasini P, Mascaux C, Jao K. et al. Effect of Coexisting KRAS and TP53 Mutations in Patients Treated With Chemotherapy for Non-small-cell Lung Cancer. Clin Lung Cancer. 2019;20:e338-e345
10. Pacheco JM, Gao D, Smith D. et al. Natural History and Factors Associated with Overall Survival in Stage IV ALK-Rearranged Non-Small Cell Lung Cancer. J Thorac Oncol. 2019;14:691-700
11. Jia QZ, Wu W, Wang YQ. et al. Local mutational diversity drives intratumoral immune heterogeneity in non-small cell lung cancer. Nat Commun. 2018;9:5361
12. Liu AL, Wang ZH, Yang YC. et al. Preoperative diagnosis of malignant pulmonary nodules in lung cancer screening with a radiomics nomogram. Cancer Commun (Lond). 2020;40:16-24
13. Jiao YX, Tan SQ, Xiong JY. Proteomic changes of CD4/CD25/forkhead box p3 regulatory T cells in a 30-day rat model of sepsis survival. Exp Ther Med. 2017;14:5619-5628
14. Zhang SQ, Yang Z, Cai XL. et al. miR-511 promotes the proliferation of human hepatoma cells by targeting the 3'UTR of B cell translocation gene 1 (BTG1) mRNA. Acta Pharmacol Sin. 2017;38:1161-1170
15. Yan W, Li SX, Gao HY. et al. Identification of B-cell translocation gene 1-controlled gene networks in diffuse large B-cell lymphoma: A study based on bioinformatics analysis. Oncol Lett. 2019;17:2825-2835
16. Cho IJ, Lee AK, Lee SJ. et al. Repression by oxidative stress of iNOS and cytokine gene induction in macrophages results from AP-1 and NF-kappaB inhibition mediated by B cell translocation gene-1 activation. Free Radic Biol Med. 2005;39:1523-36
17. Prévôt D, Morel AP, Voeltzel T. et al. Relationships of the antiproliferative proteins BTG1 and BTG2 with CAF1, the human homolog of a component of the yeast CCR4 transcriptional complex: involvement in estrogen receptor alpha signaling pathway. J Biol Chem. 2001;276:9640-8
18. Fu YJ, Huang FG, Yuan T. et al. Molecular cloning, characterization and expression analysis of B cell translocation gene 1 in grass carp Ctenopharyngodon idella. J Fish Biol. 2012;80:669-78
19. Zhang JH, Dong WH. Expression of B Cell Translocation Gene 1 Protein in Colon Carcinoma and its Clinical Significance. Recent Pat Anticancer Drug Discov. 2020 doi:10.2174/1574892815666200109113114
20. Woo HY, DO SI, Kim SH. et al. Promoter Methylation Down-regulates B-cell Translocation Gene 1 Expression in Breast Carcinoma. Anticancer Res. 2019;39:5361-5367
21. Zhao X, Chen GQ, Cao GM. Abnormal expression and mechanism of miR-330-3p/BTG1 axis in hepatocellular carcinoma. Eur Rev Med Pharmacol Sci. 2019;23:6888-6898
22. An Q, Zhou Y, Han C. et al. BTG3 Overexpression Suppresses the Proliferation and Invasion in Epithelial Ovarian Cancer Cell by Regulating AKT/GSK3β/β-Catenin Signaling. Reprod Sci. 2017;24:1462-1468
23. Yu YY, Zhang WS, Guo YH. et al. Engineering of exosome-triggered enzyme-powered DNA motors for highly sensitive fluorescence detection of tumor-derived exosomes. Biosens Bioelectron. 2020;167:112482
24. Mishra R, Lata S, Ali A. et al. Dengue haemorrhagic fever: a job done via exosomes? Emerg Microbes Infect. 2019;8:1626-1635
25. Hua X, Long ZQ, Huang X. et al. The Value of Prognostic Nutritional Index (PNI) in Predicting Survival and Guiding Radiotherapy of Patients With T1-2N1 Breast Cancer. Front Oncol. 2019;9:1562
26. Li MZ, Xia B, Wang Y. et al. Potential Therapeutic Roles of Exosomes in Multiple Myeloma: A Systematic Review. J Cancer. 2019;10:6154-6160
27. Huang YF, Zheng JW, Tan T. et al. BTG1 low expression in pancreatic ductal adenocarcinoma is associated with a poorer prognosis. Int J Biol Markers. 2018;33:189-194
28. Bai YR, Qiao L, Xie N. et al. Expression and prognosis analyses of the Tob/BTG antiproliferative (APRO) protein family in human cancers. PLoS ONE. 2017;12:e0184902
29. Liu R, Cheng Q, Wang XD. et al. The B-cell translocation gene 1 (CgBTG1) identified in oyster Crassostrea gigas exhibit multiple functions in immune response. Fish Shellfish Immunol. 2017;61:68-78
30. Yuniati L, Scheijen B, Van ML. et al. Tumor suppressors BTG1 and BTG2: Beyond growth control. J Cell Physiol. 2019;234:5379-5389
31. Kooptiwut S, Kaewin S, Semprasert N. et al. Estradiol Prevents High Glucose-Induced β-cell Apoptosis by Decreased BTG2 Expression. Sci Rep. 2018;8:12256
32. Lang D, Horner A, Brehm E. et al. Early serum tumor marker dynamics predict progression-free and overall survival in single PD-1/PD-L1 inhibitor treated advanced NSCLC-A retrospective cohort study. Lung Cancer. 2019;134:59-65
33. Sheng SH, Zhao CM, Sun GG. BTG1 expression correlates with the pathogenesis and progression of breast carcinomas. Tumour Biol. 2014;35(4):3317-26
Author contact
![]() Corresponding authors: Renjing Hu, Department of Laboratory Medicine, Wuxi Second People's Hospital, 68 Zhongshan road, Wuxi214000, China; E-mail address: 1101058edu.cn; Jun Liu, Department of Laboratory Medicine, the Fifth People's Hospital of Wuxi Affiliated to Jiangnan University,1215 Guangrui Road, Wuxi, Jiangsu 214005, P.R. China, E-mail: 15949255828com; Hao Yu, Department of Interventional Oncology, the Fifth People's Hospital of Wuxi Affiliated to Jiangnan University,1215 Guangrui Road, Wuxi, Jiangsu 214005, P.R. China, E-mail: yuhao731117com
Corresponding authors: Renjing Hu, Department of Laboratory Medicine, Wuxi Second People's Hospital, 68 Zhongshan road, Wuxi214000, China; E-mail address: 1101058edu.cn; Jun Liu, Department of Laboratory Medicine, the Fifth People's Hospital of Wuxi Affiliated to Jiangnan University,1215 Guangrui Road, Wuxi, Jiangsu 214005, P.R. China, E-mail: 15949255828com; Hao Yu, Department of Interventional Oncology, the Fifth People's Hospital of Wuxi Affiliated to Jiangnan University,1215 Guangrui Road, Wuxi, Jiangsu 214005, P.R. China, E-mail: yuhao731117com