Impact Factor ISSN: 1837-9664

 Global reach, higher impact
J Cancer 2021; 12(5):1307-1317. doi:10.7150/jca.49702 This issue Cite
Research Paper
Identification of novel biomarkers and candidate small-molecule drugs in cutaneous melanoma by comprehensive gene microarrays analysis
Jilei Ma1 ![]() , Xin Cai2, Li Kang3, Songfeng Chen4, Hongjian Liu4
, Xin Cai2, Li Kang3, Songfeng Chen4, Hongjian Liu4 ![]()
1. Department of Clinical Laboratory, The First Affiliated Hospital of Zhengzhou University, Zhengzhou, Henan, 450052, China.
2. Department of Biotechnology and Food Engineering, Anyang Institute of Technology, Anyang, Henan 455000, PR China
3. Department of Human Anatomy and Histoembryology, Henan Vocational College of Nursing, Anyang, Henan, 400500, China.
4. Department of Orthopaedics, The First Affiliated Hospital of Zhengzhou University, Zhengzhou 450052, China.
Received 2020-6-19; Accepted 2020-12-4; Published 2021-1-1
Abstract

Background: Melanoma is a pernicious skin cancer with high aggressiveness. This study aimed to identify potential novel biomarkers associated with the prognosis and pathogenesis of cutaneous melanoma and to explore new targeted drugs for melanoma. Methods: Two Gene Expression Omnibus (GEO) microarray datasets, GSE3189 and GSE7553 were combined to analyze the differentially expressed genes (DEGs). To better understand the DEGs in the melanoma pathogenesis, we performed gene enrichment analyses and established a protein-protein interaction network (PPI). The survival analyses for key genes were conducted based on the GEPIA platform. Finally, we mined the CMap database to explore potential small-molecule drugs to target the obtained DEGs. Results: In short, we identified 500 DEGs between cutaneous melanoma samples and normal samples. The PPI network was established with 349 nodes and 1251 edges. Signaling pathway analysis showed that these genes play a vital role in ECM-receptor interactions, the PPAR signaling pathway and pathways in cancer. Eight DEGs with a relatively high degree of connectivity (CDC45, CENPF, DTL, FANCI, GINS2, HJURP, TPX2 and TRIP13) were selected as hub-genes that remarkably correlated to a poor survival rate. Based on 500 DEGs, 20 small-molecule drugs that potentially target genes with abnormal expression in cutaneous melanoma were obtained from the CMap database. Among these compounds, we found that menadione has the greatest therapeutic value for melanoma. Conclusions: In conclusion, we identified the 8 candidate biomarkers and potential key signaling pathways in cutaneous melanoma through comprehensive microarray analyses. The identified candidate drugs have provided several directive significances for the synthesis medicine for melanoma.
Keywords: cutaneous melanoma, novel biomarkers, candidate small molecules, prognostic factor
Introduction
Melanoma, which arises from melanocytes, usually occurs on the skin, with high aggressiveness and mortality. Up to 200,000 cases of malignant melanoma are registered each year based on WHO statistical data [1-4]. Although the majority of patients diagnosed with local melanoma have a good outcome, prognosis remains poor for those with high-risk or advanced metastatic melanoma [5]. Current therapeutic modalities include chemotherapy, immunotherapy, targeted therapy and surgical resection. In recent 10 years, a variety of therapeutic strategies have been developed for melanoma based on the identification of molecular factors associated with the pathogenesis and prognosis of melanoma.
Numerous genomic alterations in the PI3K and MAPK signal transduction pathways play vital roles in the molecular pathogenesis of melanoma. In addition, the microenvironment and immune system are significantly associated with the melanoma occurrence and development. For example, the BRAF V600 mutation in melanoma can result in the suppression of melanoma antigen and the reemergence of an immunosuppressive tumor microenvironment through constitutive activation of the MAPK pathway. Nowadays, some targeted therapeutic strategies, including BRAF and MEK inhibitors, have enhanced survival benefits for melanoma patients, but treatment failure caused by drug resistance remains an obstacle [6-10]. Therefore, identifying the potential novel biomarkers and exploring new targeted drugs for melanoma can help solve this problem.
Herein, we demonstrated the differentially expressed genes (DEGs) determined by computational bioinformatics analysis based on the profiles of GSE3189 and GSE7553 from the GEO database. Meanwhile, our work explored some candidate small molecules that may reverse gene expression in melanoma by mining the CMap database. The results of the present research provide new promising biomarkers that could help identify new therapeutic targets for melanoma.
Materials
Gene Microarray Data
From the Gene Expression Omnibus (GEO) database, we downloaded and analyzed two gene microarray datasets, GSE3189 dataset and GSE7553 dataset. GSE3189 was based on platform GPL96 and included 52 samples, containing 45 tumor samples and 7 normal samples. GSE7553 was based on platform GPL570 and contained 58 samples, including 54 tumor and 4 normal samples. Their clinical properties of them are shown in Table 1.
Clinical properties of cutaneous melanoma patients
| GEO ID | Platform | No. of samples | Death event | Ages (years) | Gender (male/ female) | Primary/Matastatic | adjuvant chemotherapy | Stage (I/II/III/IV) | |
|---|---|---|---|---|---|---|---|---|---|
| Melanoma Samples | GSE3189 | GPL96 | 45 | 39 | 66.63± 15.78 | 21/24 | 12/33 | 45 | 2/7/14/22 |
| GSE7553 | GPL570 | 54 | 47 | 72.03 ± 26.37 | 35/19 | 6/48 | 54 | 0/2/14/38 | |
| Normal Samples | GSE3189 | GPL96 | 7 | NA | 58.68 ± 17.49 | 3/4 | NA | NA | NA |
| GSE7553 | GPL570 | 4 | NA | 62.35 ± 16.50 | 2/2 | NA | NA | NA |
NA: Not Applicable
DGEs screening and enrichment analysis
The downloaded original CEL files were divided into melanoma group and normal control groups. The normalization of raw data was performed based on the affy package. We applied the Limma package to evaluate DEGs between two above groups [11]. The identification criteria for DEGs screening were P value < 0.01 and |logFC| > 1. To further explore the association between the obtained DEGs and the pathogenesis of melanoma, we conducted gene enrichment analyses including Gene Ontology (GO) and KEGG pathway analyses. Enriched GO analysis was performed to investigate the core biological processes (BP), cellular components (CC) and molecular functions (MF) using DAVID [12]. We performed KEGG enrichment analysis to elucidate the potential signaling pathways associated with overlapping DEGs. The statistically significance was defined as P< 0.05.
PPI network establishment and module analysis
All identified DEGs were submitted to the STRING database to construct their protein interactions [13]. An integrated value > 0.4 was deemed to be significant and then PPI networks were constructed according to the obtained values. Subsequently, significant modules were separated from the PPI network by Molecular Complex Detection (MCODE) [14]. We also performed enrichment analyses for these significant modules. We visualised the core biological process (BP) of hub genes using the BiNGO plugin of Cytoscape [15].
Survival analysis of hub genes
The UCSC Cancer Genomics Browser was used to construct hierarchical clustering of module genes. We then constructed a co-expression network of module genes via the cBioPortal platform [16]. To further verify our results, we explored the ability of hub genes to predict patients' prognosis using the GEPIA database [17]. We also calculated the hazard ratio (HR) of overall survival between high- and low- expression groups. The differences in the protein levels of hub genes between melanoma and normal tissues were evaluated using the human protein atlas database.
Small-molecule drug identification
Small-molecule drugs with potential value for treating cutaneous melanoma were identified using the CMap platform, which stores a large number of gene expression profiles induced by various small molecules [18]. We divided the gene expression of melanoma into high- and low-expression groups, and then submitted them to the CMap online platform. CMap eventually exhibits an enrichment score for each small molecule, and the closer the score is to -1, the greater its potential for treating melanoma.
Results
DEGs identification
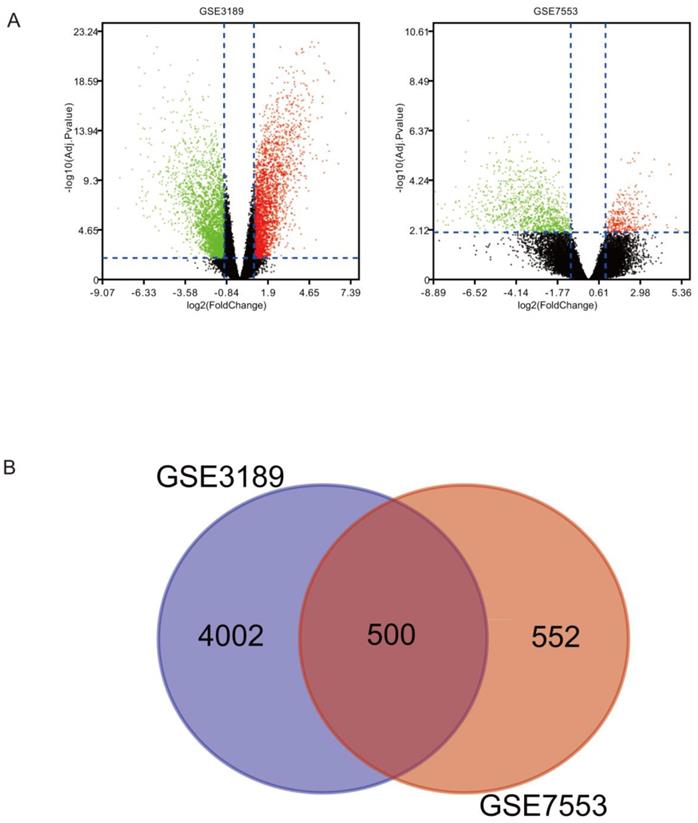
There were 500 overlapping DEGs identified via the Limma package in our study. Figure 1A shows s volcano plot of DEGs of melanoma. The Venn diagram shown in Figure 1B illustrates the 500 overlapping DEGs between the two datasets.
(A) DEGs between melanoma and normal tissues were identified via the Limma package, and visualized using a volcano plot. (B) Venn diagram revealing 500 overlapping DEGs from GSE3189 and GSE7553 datasets.
Enrichment analyses
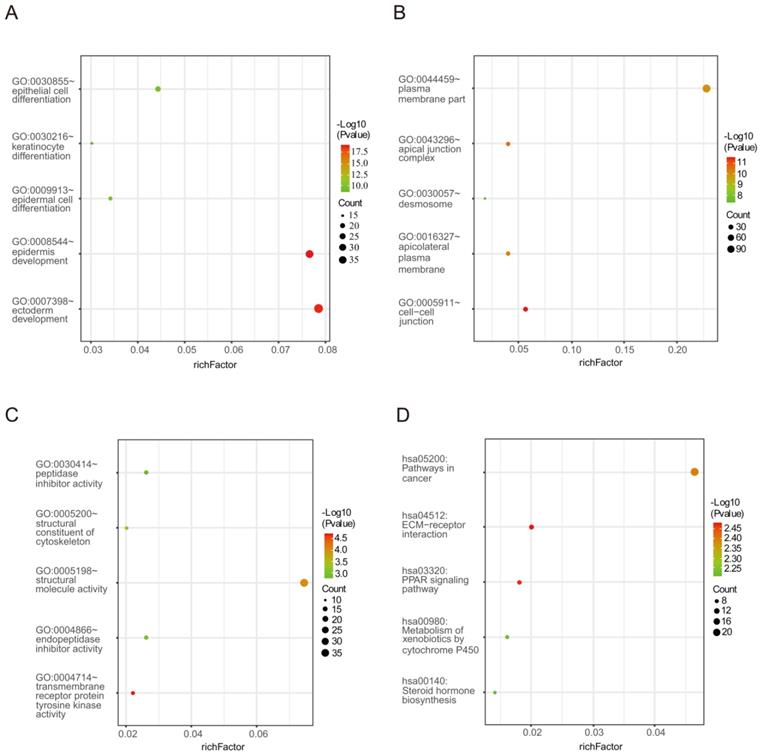
Biological process analysis revealed that the obtained DEGs were mainly enriched in epidermal cell differentiation, epidermis development, ectoderm development, epithelial cell differentiation and keratinocyte differentiation. Analysis of cellular components manifested that these DEGs were particularly relevant to cell-cell junction, the apical junction complex, apicolateral plasma membrane, plasma membrane part and desmosome. Similarly, variations in the molecular functions of DEGs were significantly enriched in transmembrane receptor protein tyrosine kinase activity, structural molecular activity, structural composition of the cytoskeleton, endopeptidase inhibitor activity and peptidase inhibitor activity. In addition, Figure 2 and Table 2 reveal that DEGs were mainly involved in signaling pathways including ECM-receptor interaction, the PPAR signaling pathway, pathways in cancer, metabolism of xenobiotics by cytochrome P450 and steroid hormone biosynthesis.
The enrichment analysis for DEGs including GO and KEGG pathway analyses. (A) Biological processes (B) Cellular components (C) Molecular functions (D) KEGG signaling pathway enrichment analyses.
Functional and pathway enrichment analysis of the overlap DEGs
| Category | Term | P value |
|---|---|---|
| GOTERM_BP_FAT | GO:0008544~epidermis development | 2.67E-20 |
| GOTERM_BP_FAT | GO:0007398~ectoderm development | 5.36E-20 |
| GOTERM_BP_FAT | GO:0009913~epidermal cell differentiation | 3.80E-10 |
| GOTERM_BP_FAT | GO:0030855~epithelial cell differentiation | 1.06E-09 |
| GOTERM_BP_FAT | GO:0030216~keratinocyte differentiation | 9.21E-09 |
| GOTERM_CC_FAT | GO:0005911~cell-cell junction | 5.65E-12 |
| GOTERM_CC_FAT | GO:0043296~apical junction complex | 4.18E-11 |
| GOTERM_CC_FAT | GO:0016327~apicolateral plasma membrane | 7.23E-11 |
| GOTERM_CC_FAT | GO:0044459~plasma membrane part | 1.64E-10 |
| GOTERM_CC_FAT | GO:0030057~desmosome | 3.99E-08 |
| GOTERM_MF_FAT | GO:0004714~transmembrane receptor protein tyrosine kinase activity | 2.35E-05 |
| GOTERM_MF_FAT | GO:0005198~structural molecule activity | 1.14E-04 |
| GOTERM_MF_FAT | GO:0005200~structural constituent of cytoskeleton | 3.01E-04 |
| GOTERM_MF_FAT | GO:0004866~endopeptidase inhibitor activity | 0.001161 |
| GOTERM_MF_FAT | GO:0030414~peptidase inhibitor activity | 0.001841 |
| KEGG_PATHWAY | hsa04512:ECM-receptor interaction | 0.003447 |
| KEGG_PATHWAY | hsa03320:PPAR signaling pathway | 0.003522 |
| KEGG_PATHWAY | hsa05200:Pathways in cancer | 0.0041 |
| KEGG_PATHWAY | hsa00980:Metabolism of xenobiotics by cytochrome P450 | 0.006031 |
| KEGG_PATHWAY | hsa00140:Steroid hormone biosynthesis | 0.006279 |
Construction of the PPI network and module analysis of DEGs
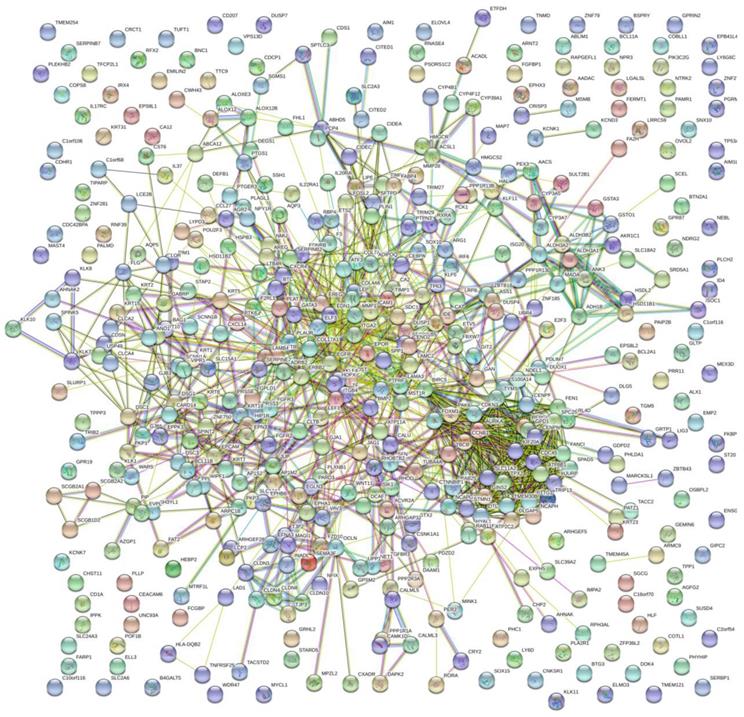
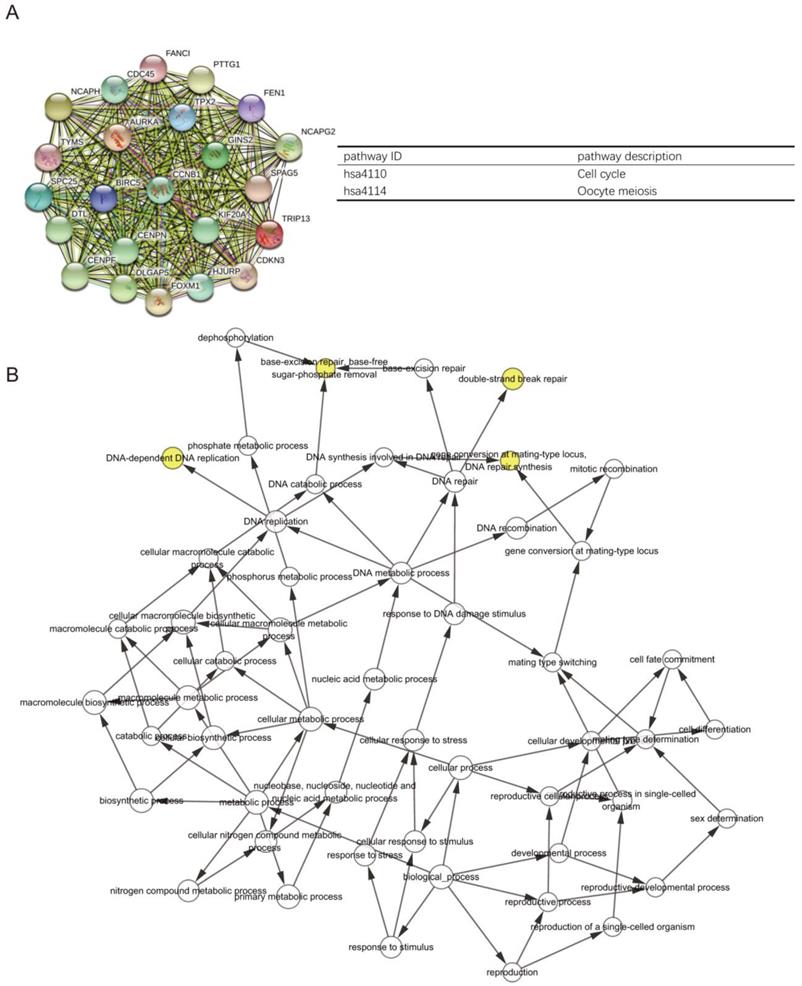
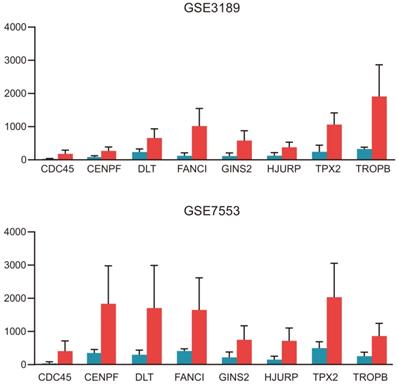
The PPI network of DEGs with 349 nodes and 1251 edges was constructed according to the STRING database (Figure 3). MCODE was adopted to extract the module with the highest node degree by screening the above PPI network. The pathways of cell cycle and ocyte meiosis were markedly associated with the module genes (Figure 4A). GO analysis by BinGo demonstrated that the module genes were markedly correlated with DNA-dependent DNA replication, base-free sugar-phosphate removal, base-excision repair and double-strand break repair (Figure 4B). Eight hub genes with high connectivity, CDC45, CENPF, DTL, FANCI, GINS2, HJURP, TPX2 and TRIP13, whose expression in melanoma was significantly up-regulated than in normal tissues, were selected for deeper analyses (Figure 5).
PPI network of DEGs with 349 nodes and 1251 edges was constructed according to the STRING database.
(A) PPI network construction revealed the most significant modules, and signaling pathway enrichment analyses were conducted for the module genes. (B) The BiNGO plugin of Cytoscape was used to explore the biological processes involved in module genes.
The significantly upregulated expression levels of CDC45, CENPF, DTL, FANCI, GINS2, HJURP, TPX2 and TRIP13 in melanoma tissues among each dataset.
Prognostic value of hub genes
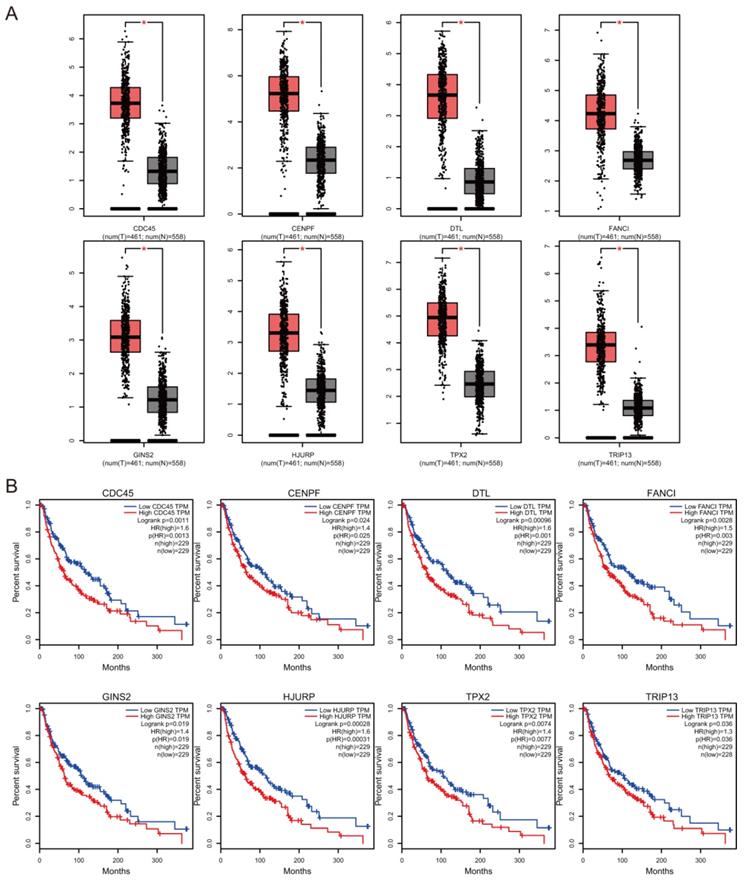
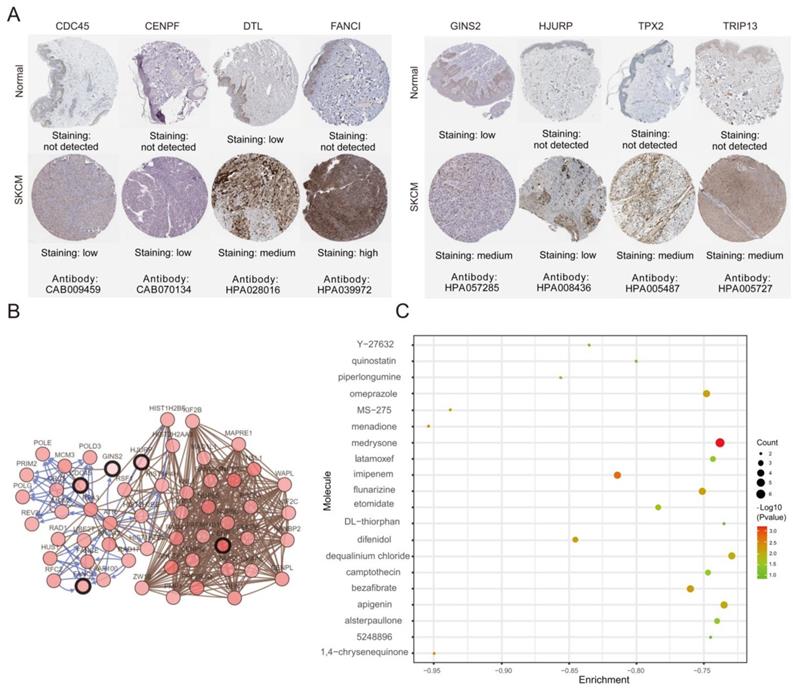
The association between hub genes expression and pathological features of melanoma was further confirmed by the HPA database and the cBioPortal. Based on GEPIA database analysis, the above hub genes exhibited obvious differences in expression between melanoma and control tissues. This difference validated again that these hub genes were highly expressed in melanoma tissues and closely associated with the onset of melanoma (Figure 6A). Overall survival (OS) analysis of total 458 melanoma patients was obtained from the GEPIA database, and the cancer patients were also divided into two groups according to median expression levels. It was found that upregulation of CDC45, CENPF, DTL, FANCI, GINS2, HJURP, TPX2 and TRIP13 was correlated with remarkably decreased OS in melanoma patients. (Figure 6B) The expression levels of CDC45, CENPF, DTL, FANCI, GINS2, HJURP, TPX2 and TRIP13 may be considered as crucial prognostic predictors of melanoma patients. HPA database analysis reconfirmed significantly higher expression levels of CDC45, CENPF, DTL, FANCI, GINS2, HJURP, TPX2 and TRIP13 in cancer tissues than in adjacent normal tissues at the protein level (Figure 7A). A co-expression network of the module genes was shown in Figure 7B.
The hub gene expression and their prognostic value were validated using GEPIA database. High expression levels of CDC45, CENPF, DTL, FANCI, GINS2, HJURP, TPX2 and TRIP13 were significantly correlated with lower overall survival for melanoma patients.
(A) The protein expression of hub genes was markedly upregulated in melanoma tissues compared to that in normal tissues. (B) A co-expression network of module genes was established via cBioPortal platform. Nodes with thick outlines correspond to hub genes; those with thin outlines indicate co-expression genes. (C) The CMap platform and the overlapping genes were utilized to predict small-molecule drugs with potential value in the treatment of cutaneous melanoma.
Potential small-molecule drugs identification
To identify potential small-molecule therapeutic candidates capable of reversing genetic changes in melanoma, we conducted the computational bioinformatics analysis of DEGs using the CMap database. An enrichment value closer to -1 indicated that the small molecules had a greater ability to reverse melanoma gene expression. The 20 most significant small molecules were identified, of which menadione and 1,4-chrysenequinone were the most likely to reverse the melanoma gene expression (Table 3 and Figure 7C). These candidate small-molecule drugs may ameliorate the tumor condition of melanoma; thus, they are potential new targeted drugs that may be explored for melanoma treatment. However, the role of the underlying molecular mechanisms of these candidate small molecules in melanoma should be clarified in the next work.
List of the 20 most significant small molecule drugs that can reverse the tumoral status of melanoma.
| Cmap name | Enrichment score | P value |
|---|---|---|
| menadione | -0.954 | 0.00453 |
| 1,4-chrysenequinone | -0.95 | 0.00545 |
| MS-275 | -0.938 | 0.00799 |
| piperlongumine | -0.856 | 0.04151 |
| difenidol | -0.845 | 0.00747 |
| Y-27632 | -0.835 | 0.05432 |
| imipenem | -0.814 | 0.00219 |
| quinostatin | -0.8 | 0.07859 |
| etomidate | -0.784 | 0.02063 |
| bezafibrate | -0.76 | 0.00684 |
| flunarizine | -0.751 | 0.00774 |
| omeprazole | -0.748 | 0.00808 |
| camptothecin | -0.747 | 0.03295 |
| 5248896 | -0.745 | 0.12913 |
| latamoxef | -0.743 | 0.03463 |
| alsterpaullone | -0.74 | 0.03591 |
| medrysone | -0.738 | 0.00066 |
| apigenin | -0.735 | 0.00985 |
| DL-thiorphan | -0.735 | 0.13957 |
| dequalinium chloride | -0.729 | 0.01104 |
Discussion
Recently, high-throughput sequencing technologies have been widely used to explore the key genetic or epigenetic changes in the malignant progression of melanoma. Moreover, integrated bioinformatics analysis has been widely used for screening novel biomarkers, hub node discovery from PPI networks and prognostic analysis [19]. Our study performed comprehensive microarray analyses to identify novel biomarkers for cutaneous melanoma, and to explore small-molecule drugs according to the melanoma gene expression profiles, with the aim of providing new therapeutic strategies for cutaneous melanoma.
The 500 overlapping DEGs identified were significantly associated with the occurrence and progression of melanoma. It is suggestive that these overlapping DEGs may be novel diagnostic, prognostic or personalized therapeutic biomarkers. GO enrichment analysis for these overlapping DEGs revealed the potential molecular mechanisms underlying melanoma pathogenesis. Epidermal cell differentiation, epidermal development, and ectodermal development were the three most important functions identified among the biological processes. Molecular function analysis indicated the involvement of DEGs in transmembrane receptor protein tyrosine kinase activity, structural constituents of the cytoskeleton, and structural molecule activity. Variations in cell components were mainly related with the apical junction complex, cell-cell junction, and apicolateral plasma membrane. Additionally, the main biological pathways with enriched overlapping DEGs included ECM-receptor interaction, the PPAR signaling pathway, pathways in cancer, metabolism of xenobiotics by cytochrome P450 and steroid hormone biosynthesis. It was previously reported that Twist2 transcriptionally regulates the ECM-receptor interaction pathway and contributes to kidney cancer cell proliferation and invasion [20]. The expression of β-catenin and its downstream effector, SOX9, can be suppressed by PPARγ [21]. In summary, our bioinformatics analysis results were supported by these previous reports.
The PPI network among the overlapping DEGs revealed the most significant network module. CDC45, CENPF, DTL, FANCI, GINS2, HJURP, TPX2 and TRIP13 with high connectivity in the network were finally defined as hub genes in our study. To verify the results of bioinformatics analysis, hub gene expression levels and their ability to predict patients' prognosis were determined using the GEPIA database. Mining of the GEPIA database further confirmed the same expression trend found in the GEO database and CDC45, CENPF, DTL, FANCI, GINS2, HJURP, TPX2 and TRIP13 expression had a significant influence on the prognosis of melanoma patients. High expression of CDC45, CENPF, DTL, FANCI, GINS2, HJURP, TPX2 and TRIP13 were significantly correlated with worse overall survival in melanoma patients. The immunohistochemical analysis from HPA database demonstrated that the expression of these eight hub genes was consistent with their protein content, thereby verifying the accuracy of our findings. Our work is the first to reveal the diagnostic, prognostic and therapeutic value of these eight hub genes in melanoma, which could provide new insights regarding melanoma.
Whether these eight key genes play a part in the initiation and progression of melanoma has not been reported before. To further explore the potential mechanism of CDC45, CENPF, DTL, FANCI, GINS2, HJURP, TPX2 and TRIP13 in the pathogenesis of melanoma and enhance our understanding of this multi-gene hereditary disease, we predicted potential transcription factors that may regulate their expression and constructed a molecular regulatory network of lncRNA-miRNA-mRNA for these genes. This genetic regulatory network will contribute to elucidating the relationship between hub genes and melanoma initiation and progression. Jing et al. demonstrated that CDC45 is upregulated in papillary thyroid carcinoma and that depletion of CDC45 can suppress tumor growth [22]. CENPF is closely associated with cell proliferation and is upregulated in multiple cancers, such as nasopharyngeal cancer, hepatocellular carcinoma, esophageal squamous cell carcinoma, gastrointestinal stromal tumors and breast cancer [23-25]. FANCI can prevent the replication stress of carcinogenic DNA through its role in DNA repair, and regulate the activity of the Akt oncogene by promoting the inhibitory function of PHLPP [26]. In mammals, HJURP has been confirmed as a crucial factor in DNA binding and phosphorylation, which promote chromosome segregation and cell mitosis [27]. Knockdown of TPX2 suppresses the invasion and proliferation of hepatocellular carcinoma cells via the deactivation of AKT signaling and suppression of MMP-2 and MMP-9 gene expression [28].
In addition, a series of small-molecule drugs with potential value for the treatment of cutaneous melanoma were identified via the CMap platform and the screened overlapping gene, which provided clues for identifying new targeted anti-tumor drugs for melanoma. The most significant small molecule, menadione (-0.954), which was highly associated with reversing the status of melanoma cells, has not been investigated for its efficacy and safety in melanoma. Meanwhile, the relationship between verteporfin 1,4-chrysenequinone (-0.95) and melanoma remains unknown. We hypothesized that these drugs might hinder the development of melanoma through the genome or transcriptome. Thus, it is absolutely necessary to investigate the value of the suggested small molecules for melanoma treatment, especially considering their ability to completely reverse the gene expression in melanoma. This will contribute to enhancing our understanding of the therapeutic mechanisms of these candidate small-molecule drugs for melanoma from the perspective of DEGs induced by melanoma.
Conclusion
In our work, we first conducted integrated microarray analysis to uncover eight key genes that enhance our understanding of the molecular pathogenesis of melanoma initiation and progression. Our results revealed several novel biomarkers and biological pathways that participate in the pathogenesis of cutaneous melanoma, and demonstrated the diagnostic and prognostic value of CDC45, CENPF, DTL, FANCI, GINS2, HJURP, TPX2 and TRIP13. In addition, the identified candidate small-molecule drugs will contribute to the development of novel gene anti-tumor drugs for melanoma. Taken together, we uncovered several promising novel biomarkers in melanoma and provided new insights into about cutaneous melanoma.
Funding
This study was supported by the Youth Innovation Fund of The First Affiliated Hospital of Zhengzhou University (Grant No. YNQN 2017053) and the Key R&D and Promotion Program of Henan Science and Technology Department (Grant No. 192102310111, 192102310118).
Competing Interests
The authors have declared that no competing interest exists.
References
1. Aris M, Barrio MM. Combining immunotherapy with oncogene-targeted therapy: a new road for melanoma treatment. Frontiers in immunology. 2015;6:46
2. Caers J, Fernandez de Larrea C, Leleu X, Heusschen R, Zojer N, Decaux O. et al. The Changing Landscape of Smoldering Multiple Myeloma: A European Perspective. The oncologist. 2016;21:333-42
3. Eggermont AM, Spatz A, Robert C. Cutaneous melanoma. Lancet. 2014;383:816-27
4. Faghfuri E, Faramarzi MA, Nikfar S, Abdollahi M. Nivolumab and pembrolizumab as immune-modulating monoclonal antibodies targeting the PD-1 receptor to treat melanoma. Expert review of anticancer therapy. 2015;15:981-93
5. Garbe C, Eigentler TK, Keilholz U, Hauschild A, Kirkwood JM. Systematic review of medical treatment in melanoma: current status and future prospects. The oncologist. 2011;16:5-24
6. Curtin JA, Fridlyand J, Kageshita T, Patel HN, Busam KJ, Kutzner H. et al. Distinct sets of genetic alterations in melanoma. The New England journal of medicine. 2005;353:2135-47
7. Davies H, Bignell GR, Cox C, Stephens P, Edkins S, Clegg S. et al. Mutations of the BRAF gene in human cancer. Nature. 2002;417:949-54
8. Postow MA, Hamid O, Carvajal RD. Mucosal melanoma: pathogenesis, clinical behavior, and management. Current oncology reports. 2012;14:441-8
9. Rizos H, Menzies AM, Pupo GM, Carlino MS, Fung C, Hyman J. et al. BRAF inhibitor resistance mechanisms in metastatic melanoma: spectrum and clinical impact. Clinical cancer research: an official journal of the American Association for Cancer Research. 2014;20:1965-77
10. Solus JF, Kraft S. Ras, Raf, and MAP kinase in melanoma. Advances in anatomic pathology. 2013;20:217-26
11. Ritchie ME, Phipson B, Wu D, Hu Y, Law CW, Shi W. et al. limma powers differential expression analyses for RNA-sequencing and microarray studies. Nucleic acids research. 2015;43:e47
12. Dennis G Jr, Sherman BT, Hosack DA, Yang J, Gao W, Lane HC. et al. DAVID: Database for Annotation, Visualization, and Integrated Discovery. Genome biology. 2003;4:P3
13. Szklarczyk D, Franceschini A, Wyder S, Forslund K, Heller D, Huerta-Cepas J. et al. STRING v10: protein-protein interaction networks, integrated over the tree of life. Nucleic acids research. 2015;43:D447-52
14. Bandettini WP, Kellman P, Mancini C, Booker OJ, Vasu S, Leung SW. et al. MultiContrast Delayed Enhancement (MCODE) improves detection of subendocardial myocardial infarction by late gadolinium enhancement cardiovascular magnetic resonance: a clinical validation study. Journal of cardiovascular magnetic resonance: official journal of the Society for Cardiovascular Magnetic Resonance. 2012;14:83
15. Maere S, Heymans K, Kuiper M. BiNGO: a Cytoscape plugin to assess overrepresentation of gene ontology categories in biological networks. Bioinformatics. 2005;21:3448-9
16. Cerami E, Gao J, Dogrusoz U, Gross BE, Sumer SO, Aksoy BA. et al. The cBio cancer genomics portal: an open platform for exploring multidimensional cancer genomics data. Cancer discovery. 2012;2:401-4
17. Tang Z, Li C, Kang B, Gao G, Li C, Zhang Z. GEPIA: a web server for cancer and normal gene expression profiling and interactive analyses. Nucleic acids research. 2017;45:W98-W102
18. Lamb J, Crawford ED, Peck D, Modell JW, Blat IC, Wrobel MJ. et al. The Connectivity Map: using gene-expression signatures to connect small molecules, genes, and disease. Science. 2006;313:1929-35
19. Kulasingam V, Diamandis EP. Strategies for discovering novel cancer biomarkers through utilization of emerging technologies. Nature clinical practice Oncology. 2008;5:588-99
20. Zhang HJ, Tao J, Sheng L, Hu X, Rong RM, Xu M. et al. Twist2 promotes kidney cancer cell proliferation and invasion by regulating ITGA6 and CD44 expression in the ECM-receptor interaction pathway. OncoTargets and therapy. 2016;9:1801-12
21. Ren X, Zheng D, Guo F, Liu J, Zhang B, Li H. et al. PPARgamma suppressed Wnt/beta-catenin signaling pathway and its downstream effector SOX9 expression in gastric cancer cells. Medical oncology. 2015;32:91
22. Sun J, Shi R, Zhao S, Li X, Lu S, Bu H. et al. Cell division cycle 45 promotes papillary thyroid cancer progression via regulating cell cycle. Tumour biology: the journal of the International Society for Oncodevelopmental Biology and Medicine. 2017;39:1010428317705342
23. Cao JY, Liu L, Chen SP, Zhang X, Mi YJ, Liu ZG. et al. Prognostic significance and therapeutic implications of centromere protein F expression in human nasopharyngeal carcinoma. Molecular cancer. 2010;9:237
24. Dai Y, Liu L, Zeng T, Zhu YH, Li J, Chen L. et al. Characterization of the oncogenic function of centromere protein F in hepatocellular carcinoma. Biochemical and biophysical research communications. 2013;436:711-8
25. O'Brien SL, Fagan A, Fox EJ, Millikan RC, Culhane AC, Brennan DJ. et al. CENP-F expression is associated with poor prognosis and chromosomal instability in patients with primary breast cancer. International journal of cancer. 2007;120:1434-43
26. Zhang X, Lu X, Akhter S, Georgescu MM, Legerski RJ. FANCI is a negative regulator of Akt activation. Cell cycle. 2016;15:1134-43
27. Chen T, Huang H, Zhou Y, Geng L, Shen T, Yin S. et al. HJURP promotes hepatocellular carcinoma proliferation by destabilizing p21 via the MAPK/ERK1/2 and AKT/GSK3beta signaling pathways. Journal of experimental & clinical cancer research: CR. 2018;37:193
28. Liu Q, Yang P, Tu K, Zhang H, Zheng X, Yao Y. et al. TPX2 knockdown suppressed hepatocellular carcinoma cell invasion via inactivating AKT signaling and inhibiting MMP2 and MMP9 expression. Chinese journal of cancer research = Chung-kuo yen cheng yen chiu. 2014;26:410-7
Author contact
![]() Corresponding author: Jilei Ma, Department of Clinical Laboratory, The First Affiliated Hospital of Zhengzhou University, 450052, Zhengzhou, Henan, China. E-mail: 20170034edu.cn. Hongjian Liu, Department of Orthopaedic Surgery, The First Affiliated Hospital of Zhengzhou University, Zhengzhou 450052, China. E-mail: fccliuhjedu.cn
Corresponding author: Jilei Ma, Department of Clinical Laboratory, The First Affiliated Hospital of Zhengzhou University, 450052, Zhengzhou, Henan, China. E-mail: 20170034edu.cn. Hongjian Liu, Department of Orthopaedic Surgery, The First Affiliated Hospital of Zhengzhou University, Zhengzhou 450052, China. E-mail: fccliuhjedu.cn