Impact Factor ISSN: 1837-9664

 Global reach, higher impact
J Cancer 2021; 12(3):899-911. doi:10.7150/jca.50443 This issue Cite
Research Paper
Six Novel Biomarkers for Diagnosis and Prognosis of Esophageal squamous cell carcinoma: validated by scRNA-seq and qPCR
Liuhai Zheng1, Linzhi Li1, Jun Xie1, Hai Jin2 ![]() , Naishuo Zhu1
, Naishuo Zhu1 ![]()
1. Laboratory of Molecular Immunology, State Key Laboratory of Genetic Engineering, School of Life Sciences, Fudan University, Shanghai, China.
2. Department of Thoracic Surgery, Changhai Hospital, Second Military Medical University, Shanghai, China.
Received 2020-7-8; Accepted 2020-11-16; Published 2021-1-1
Abstract
Esophageal squamous cell carcinoma (ESCC) is one of the most common cancers worldwide. ESCC has a generally poor prognosis and there is a lack of available biomarkers for diagnosis and prognosis. The aim of the study was to identify novel biomarkers for ESCC. We screened the overlapping differentially expressed genes (DEGs) acquired from six Gene Expression Omnibus (GEO) ESCC datasets and The Cancer Genome Atlas (TCGA) ESCC datasets. Subsequently, protein-protein interaction network analysis was performed to identify the key hub genes. Then, Kaplan Meier survival and receiver operating curve (ROC) analysis were utilized to clarify the diagnostic and prognostic role of these hub genes. The UALCAN database, single cell RNA sequencing (scRNA-seq) and real-time quantitative PCR (qPCR) were performed to confirm the expression levels of identified hub genes. Finally, immune infiltration analysis was conducted to investigate the role of these genes in the pathogenesis of ESCC. The results showed that PBK, KIF2C, NUF2, KIF20A, RAD51AP1, and DEPDC1 effectively distinguish ESCC tissues from normal samples, and all of them were significantly correlated with overall survival. The results of scRNA-seq and qPCR indicated that the expression levels of hub genes in ESCC were significantly higher than in normal cells or tissues. Further immune infiltration analysis showed that infiltration of dendritic cells was significantly negatively correlated with PBK, KIF2C, NUF2, RAD51AP1, and DEPDC1 expression levels. In conclusion, our results suggest that PBK, KIF2C, NUF2, KIF20A, RAD51AP1 and DEPDC1 are all potential biomarkers for ESCC diagnosis and prognosis may also be potential therapeutic targets for ESCC.
Keywords: ESCC, biomarkers, diagnostic, poor prognosis, therapeutic targets
Introduction
Esophageal cancer was the seventh most common cancer and the sixth leading cause of cancer death worldwide in 2018, with around 572,000 new cases and 509,000 deaths annually [1]. As the predominant subtype of esophageal cancer, esophageal squamous cell carcinoma (ESCC) comprises over 90% of all esophageal cancer cases in parts of Asia [2]. Many patients with ESCC are diagnosed at an advanced stage due to the lack of effective biomarkers, and often at this stage distant metastases have already occurred resulting in poor prognosis. At present, there is no effective treatment strategy together with the lack of effective diagnosis and prognosis biomarkers, the 5-year survival rate of ESCC patients is less than 30% [2]. Moreover, ESCC patients at the advanced stage are always suffering great pains, such as difficulty eating and breathing, which are usually refractory to treatment. Therefore, there is an urgent need to identify more effective biomarkers for ESCC, which will increase the efficiency of diagnosis and treatment, and even improve our understanding of the pathogenesis mechanisms.
In recent years, as high-throughput microarray platforms have been widely used in medical research, a large number of high-throughput data available in many databases, and re-analysis of these data has become an effective and low-cost method to discover biomarkers for many diseases. The Cancer Genome Atlas (TCGA) is the largest database for storing cancer related high-throughput data, including 33 cancer types with more than 20,000 primary cancers and matched normal samples. The Gene Expression Omnibus (GEO) database is a comprehensive repository of high-throughput experimental data in the National Center for Biotechnology Information (NCBI) which is one of the world's largest database of biochips. To date, the GEO database contains > 40000 microarray gene expression datasets and > 2000 items containing the keywords “esophageal cancer”. Currently, these two databases are widely used for data mining due to their large sample size and complete clinical information. Many studies have identified various biomarkers for ESCC based on TCGA and GEO databases [3-9]. For example, Mao et al. identified a seven-lncRNA signature to predict overall survival in ESCC, which displayed better prognostic predict ability than tumor-node-metastasis (TNM) stage. Song et al. identified PDLIM2 as a novel prognostic predictor for ESCC, which also associated with nodal invasion. These studies have promoted our understanding of the development of new diagnostic and prognostic biomarkers for ESCC. However, biomarkers related to ESCC diagnosis and prognosis was usually identified independently, which may hinder our understanding of the process from initiation to deterioration. More importantly, most previous studies were mainly depended on one or two datasets, while individual dataset often can be unreliable due to bias introduced by sample processing and insufficient samples [10]. Therefore, to obtain more convincing results, more datasets from multiple platforms are needed. What's more, most previous studies based on TCGA or GEO data analysis mainly focused on bioinformatics analysis, and few studies further verified on clinical samples. As we all know, there are certain technical errors in both microarray and next-generation sequencing data. Therefore, to eliminate technical errors, experimental confirmation is required. Finally, as the traditional bulk profiles represents the average expression levels of the constituent cells (malignant, immune and stromal cells), it does not reflect the true condition of cancer cells. Thus, verifying the identified differential expression genes (DEGs) at the single cell resolution will increase the authenticity and reliability of the analysis results, and even improve our understanding of the underlying mechanism. As far as we know, there is no relevant research to verify the identified biomarkers at the single cell levels.
In the present study, we combined six GEO microarray datasets to screen the DEGs in at least two different ESCC datasets, and further integrated with TCGA ESCC dataset to screen the possible biomarkers associated with diagnosis and prognosis for ESCC. We discovered that PBK, KIF2C, NUF2, KIF20A, RAD51AP1, DEPDC1 are possible diagnostic and prognostic biomarkers for ESCC. Then, UALCAN database, scRNA-seq and qPCR were conducted to validate the expression levels of identified genes. Furthermore, we performed immune infiltration analysis to gain a better understanding of the function of these genes. Our study could provide novel biomarkers for ESCC diagnosis and prognosis, and potential targets for ESCC therapy.
Materials and Methods
Data collection
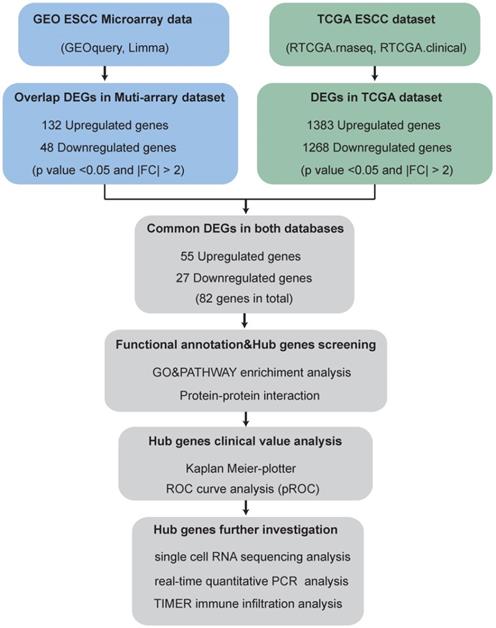
The brief flowchart for screening novel biomarkers for ESCC is showed in Fig. 1.
Flowchart for screening novel biomarkers in ESCC.
ESCC-related GEO datasets with primary tumor tissues and matched normal tissues, principal component analysis (PCA) analysis can well distinguish tumor samples from normal samples, expression profiling by array were enrolled into the present study. Thus, the datasets for ESCC (GSE17351, GSE20347, GSE23400, GSE100942, GSE38129 and GSE77861) were downloaded from the GEO (https://www.ncbi.nlm.nih.gov/geo/) database by R ×64 3.6.0 with the “GEOquery” R package [11]. The details of these datasets are listed in Table 1. TCGA-ESCC samples with RNA-seq data and matched clinical metadata (including 11 normal and 78 tumor samples) were downloaded from the GDC database (https://portal.gdc.cancer.gov/). The detailed clinical characteristics of the enrolled patients in TCGA are shown in Table 2.
Details of ESCC datasets from the GEO and TCGA database
| GSE | Publication | Upregulated DEG | Downregulated DEG | Platform | Sample size |
|---|---|---|---|---|---|
| GSE17351 | Carcinogenesis | 266 | 426 | GPL570 | Tumor: 5 |
| Normal: 5 | |||||
| GSE20347 | BMC Genomics | 69 | 183 | GPL571 | Tumor: 17 |
| Normal: 17 | |||||
| GSE23400 | Clin Cancer Res | 14 | 37 | GPL96 | Tumor: 53 |
| Normal: 53 | |||||
| GSE100942 | Theranostics | 46 | 83 | GPL570 | Tumor: 4 |
| Normal: 4 | |||||
| GSE38129 | BMC Genomics | 74 | 93 | GPL571 | Tumor: 30 |
| Normal: 30 | |||||
| GSE77861 | BMC Cancer | 88 | 123 | GPL570 | Tumor: 7 |
| Normal: 7 | |||||
| TCGA | 1268 | 1383 | IlluminaHiSeq | Tumor: 78 | |
| Normal: 11 |
Clinical characteristics of the enrolled patients in TCGA
| Characteristics | Number of sample size (%) |
|---|---|
| Age (years) | |
| <50 | 15 (18.5) |
| ≥50 | 66 (81.5) |
| Gender | |
| Female | 12 (14.8) |
| Male | 69 (85.2) |
| Stage | |
| IA | 3 (3.7) |
| IB | 4 (4.9) |
| IIA | 35 (43.2) |
| IIB | 13 (16.1) |
| III | 9 (11.1) |
| IIIA | 8 (9.9) |
| IIIB | 3 (3.7) |
| IV | 5 (6.2) |
| NA | 1 (1.2) |
| T classification | |
| T1 | 8 (9.9) |
| T2 | 28 (34.6) |
| T3 | 40 (49.4) |
| T4 | 5 (6.1) |
| N classification | |
| N0 | 46 (56.8) |
| N1 | 25 (30.9) |
| N2 | 5 (6.2) |
| N3 | 1 (1.2) |
| Nx | 4 (4.9) |
| M classification | |
| M0 | 71 (87.6) |
| M1 | 5 (6.2) |
| Mx | 5 (6.2) |
| Radiotherapy | |
| Yes | 37 (45.7) |
| No | 44 (54.3) |
| Chemotherapy | |
| Yes | 29 (35.8) |
| No | 52 (64.2) |
| Vital status | |
| Dead | 16 (19.8) |
| Alive | 65 (80.2) |
Abbreviation: NA, not available.
Ethics approval and consent to participate
The ethics committee at the changhai hospital, Second Military Medical University approved this study, and written informed consent on the use of clinical specimens from all participants. Six patients with ESCC who underwent surgical resection of tumor tissues without any treatment were enrolled for qPCR assay. Paired adjacent nontumor tissues from the proximal resection margins (>5 cm away from the ESCC sample) were also collected for RNA extraction and qPCR assay. The detailed clinic parameters of these participants are listed in Table 3.
Clinic parameters of enrolled patients in the current study for qPCR assay
| ESCC01 | ESCC02 | ESCC03 | ESCC04 | ESCC05 | ESCC06 | |
|---|---|---|---|---|---|---|
| TNM | T3N0Mx | T3N0Mx | T3N0Mx | T3N0Mx | T3N1Mx | T3N3Mx |
| Stage | IIA | IIA | IIA | IIA | IIIB | IIIC |
| Gender | Female | Male | Male | Male | Male | Male |
| Age | 66 | 70 | 61 | 56 | 64 | 71 |
| Sampling Method | Surgical | Surgical | Surgical | Surgical | Surgical | Surgical |
| Sampling Time | 2018.05.31 | 2018.08.24 | 2019.01.03 | 2019.06.27 | 2019.07.09 | 2019.07.11 |
| Treatment | Surgery | Surgery | Surgery | Surgery | Surgery | Surgery |
| Vital Status | Alive | Alive | Alive | Alive | Alive | Alive |
Overlapping DEG analysis
The GEO datasets (GSE17351, GSE20347, GSE23400, GSE100942, GSE38129 and GSE77861) and TCGA datasets were processed using the “Limma” R package [12]. A P‐value < 0.05 and |FC| > 2 were used as the threshold to identify DEGs. Next, we used an online tool, jvenn (http://jvenn.toulouse.inra.fr/app/index.html) to find overlapping DEGs in at least two of the GEO datasets [13]. Finally, the overlapping DEGs were analyzed to identify the most commonly deregulated genes across datasets.
Functional annotation and hub genes screening
STRING (https://string‐db.org/) was used for Gene ontology (GO), pathway enrichment and protein‑protein interaction (PPI) analysis [14]. The PPI information was downloaded and imputed into Cytoscape software (Cytoscape_v3.7.2) to construct a PPI network. In addition, cytoHubba (integrated into Cytoscape software) was applied to screen hub genes using the Maximal Clique Centrality (MCC) method [15].
Hub gene clinical value analysis
To evaluate the prognostic significance of identified hub genes, a Kaplan Meier survival analysis was carried out using Kaplan Meier-plotter (https://kmplot.com/analysis/) [16]. A receiver operating curve (ROC) analysis was conducted using the “pROC” R package to explore the diagnostic value of these hub genes [17].
Hub genes mRNA expression validation
UALCAN (http://ualcan.path.uab.edu/), which contains TCGA and MET500 transcriptome sequencing data, was used to validate mRNA expression of the hub genes [18].
The scRNA-seq data (SRP119465) which contains three ESCC patients and 208 single cells were downloaded from the Sequence Read Archive (https://www.ncbi.nlm.nih.gov/sra) [19]. The detailed clinical characteristics are shown in Table 4. Subsequently, Trimmomatic tool were used to remove low quality and adapter reads, and then mapped to the human genome GRCh38 transcriptome using Bowtie. Cell cluster analysis was performed using the “Seurat” R package. Based on the clustering of cell subsets and characteristic gene expression, we annotated the cell subsets and displayed the expression levels of hub genes in all cell subsets.
Clinic parameters of enrolled patients in scRNA-seq dataset
| ESCC01 | ESCC02 | ESCC03 | |
|---|---|---|---|
| TNM | T3N0M0 | T3N1M0 | T3N1M0 |
| Stage | IIA | IIIB | IIIB |
| Gender | Male | Male | Female |
| Sampling Method | Biopsy | Biopsy | Surgical |
| Sampling Time | 2015.10.28 | 2015.10.22 | 2015.07.30 |
| Treatment | Radiotherapy | Radiotherapy | Surgery |
| Vital Status | Alive | Alive | Alive |
To detect the mRNA expression of hub genes, qPCR was conducted on the LightCycler® 480 II real-time PCR system (Roche Molecular Diagnostics Inc., South Branchburg, NJ, USA). Briefly, total RNA was extracted from 6 ESCC tissues and adjacent normal tissues using the Trizol reagent (Thermo Fisher Scientific, USA). Single strand complementary DNA (cDNA) was synthesized from 0.5 μg of total RNA using the transcriptor first strand cDNA synthesis kit (Roche Molecular Diagnostics Inc., South Branchburg, NJ, USA). qPCR was performed to quantify the hub genes mRNA expression level using the LightCycler® 480 SYBR Green I Master kit (Roche Molecular Diagnostics Inc., South Branchburg, NJ, USA). The primers used are listed in Table 5. Then, the following cycling conditions were applied: 95°C for 5 minutes, followed by 40 cycles of 95°C for 10 seconds and 62°C for 30 seconds. GAPDH served as an internal control to normalize the expression. The 2-ΔΔCt method was employed to calculate the relative expression level.
Prime sequences
| Target | Accession | Orientation | Primers sequence (5′-3′) |
|---|---|---|---|
| gene | number | ||
| GAPDH | NM_001256799 | Forward | GGAGCGAGATCCCTCCAAAAT |
| Reverse | GGCTGTTGTCATACTTCTCATGG | ||
| PBK | NM_018492 | Forward | TAGGAGTCTCTCTACCACTGGA |
| Reverse | TCCCACAAAGTAAGGCCAAAG | ||
| KIF2C | NM_006845 | Forward | CTCAGTTCGGAGGAAATCATGTC |
| Reverse | TGCTCTTCGATAGGATCAGTCA | ||
| NUF2 | NM_031423 | Forward | TGTTAAGCAATACAAACGCACAG |
| Reverse | TGCCTTTTCAATACCGTCGTG | ||
| KIF20A | NM_005733 | Forward | TTGAGGGTTAGGCCCTTGTTA |
| Reverse | GTCCTTGGGTGCTTGTAGAAC | ||
| RAD51AP1 | NM_001130862 | Forward | TGGTGGTGTTCAAGGGAAAAG |
| Reverse | AGGTGCAAAGTCTGGTTCAGT | ||
| DEPDC1 | NM_001114120 | Forward | ATGCGTATGATTTCCCGAATGAG |
| Reverse | CACAGCATAACACACATCGAGAA |
Immune infiltration analysis
The correlation of hub gene expression with immune infiltration level was performed using the Tumor Immune Estimation Resource (TIMER, https://cistrome.shinyapps.io/timer/) [20]. The TIMER database incorporates 32 cancer types and six immune cell types (B cell, CD4 T cell, CD8 T cell, neutrophil, macrophage, and dendritic cell).
Results
Data preprocessing
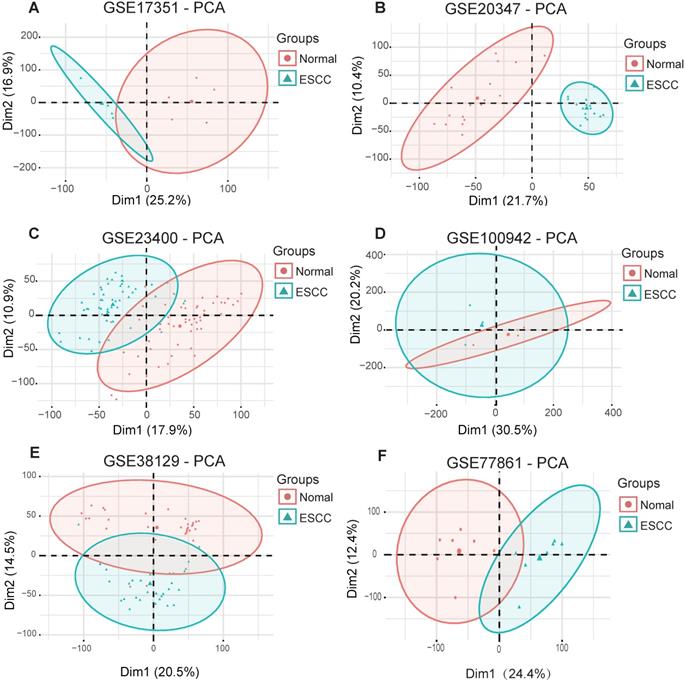
To obtain biological changes in gene expression in ESCC, all data were pre-processed. Firstly, we used the “Limma” R package to standardize the data and eliminate the effects of experimental techniques on gene expression. Next, the “factoMineR” and “factoextra” R package were used for principal component analysis (PCA) for quality control. The results showed that all samples (GSE17351, GSE20347, GSE23400, GSE100942, GSE38129 and GSE77861) were clearly divided into normal and tumor groups, except for dataset GSE23400, where four normal samples (GSM573926, GSM573867, GSM573888 and GSM573889) and three tumor samples (GSM573926, GSM573935 and GSM573944) showed no difference between normal tissue and tumors; therefore, these were removed from further analyses (Fig. 2A-F).
Principal component analysis for ESCC datasets from the GEO database. (A) GSE17351. (B) GSE20347. (C) GSE234300. (D) GSE100942. (E) GSE38129. (F) GSE77861.
Common DEGs in GEO and TCGA datasets
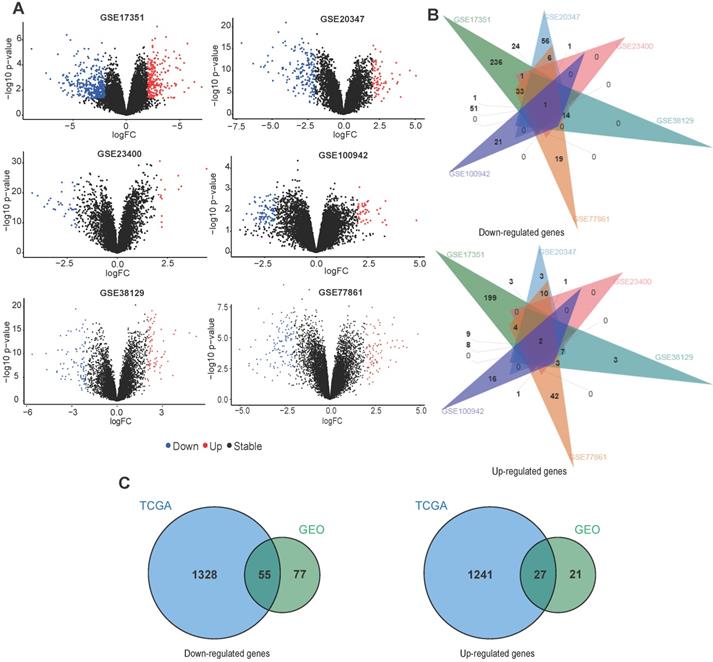
For GEO datasets, each set of DEGs was screened separately. The ggplot2 package was used to display the DEGs identified from each dataset (Fig. 3A). Table 1 describes details of the DEGs in each dataset. Next, an online tool (jvenn) was used to identify overlapping DEGs in at least two GEO datasets. We found 132 downregulated and 48 upregulated genes (Fig. 3B), which were used for identifying common DEGs within the TCGA data. For TCGA datasets, we found 1383 downregulated and 1268 upregulated genes (Table 1). Fig. 3C shows a venn diagram demonstrating the common DEGs between the GEO and TCGA datasets, 55 downregulated and 27 upregulated genes were found.
Overlap between DEGs across different ESCC datasets. (A) The volcano plots of DEGs obtained from GEO datasets. (B) Venn diagram demonstrating the overlap between DEGs in the different GEO datasets. (C) Venn diagram displaying the overlap between DEGs from the GEO and TCGA datasets.
Functional annotation and PPI analysis
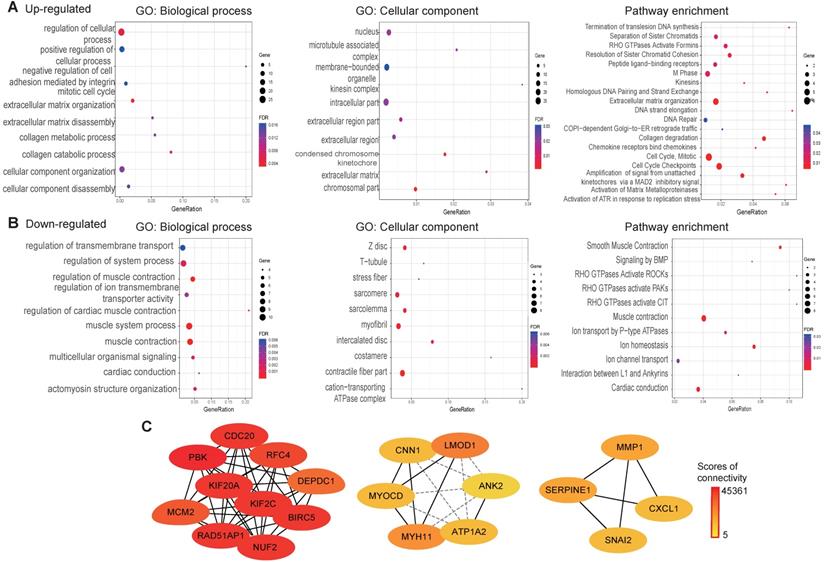
To explore the function of the common DEGs, GO, pathway enrichment and PPI analysis were conducted using the STRING database. The results revealed that most of the upregulated genes are found in the nucleus, as membrane-bounded organelles and in the intracellular compartment. The upregulated genes were mainly involved in positive regulation of cellular process, the mitotic cell cycle and collagen metabolic processes. Pathway enrichment analysis revealed that the upregulated genes were mainly involved in the cell cycle extracellular matrix organization and DNA repair (Fig. 4A). Cellular component analysis of the downregulated genes showed association with contractile fibers, myofibrils, and intercalated discs. With regard to biological processes, the downregulated genes were associated with muscle system processes, regulation of ion transmembrane transporter activity and actomyosin structure organization. As for pathway enrichment, muscle contraction, ion homeostasis and rho GTPases activation was enriched (Fig. 4B). A PPI network was constructed to screen hub genes using the STRING database. Subsequently, the PPI network information was imported into Cytoscape and the MCC method in cytoHubba was applied to screen hub genes. The results showed that PBK, CDC20, KIF2C, BIRC5, NUF2, KIF20A, RAD51AP1, RFC4, MCM2, and DEPDC1 interact with each other with high scores for connectivity (Fig. 4C).
GO, pathways enrichment, and PPI of overlap DEGs in ESCC. (A) GO and pathway enrichment results for up-regulated DEGs. (B) GO and pathway enrichment results for down‑regulated DEGs. (C) PPI network of overlap DEGs from GEO data and TCGA datasets.
Kaplan Meier survival and ROC analysis
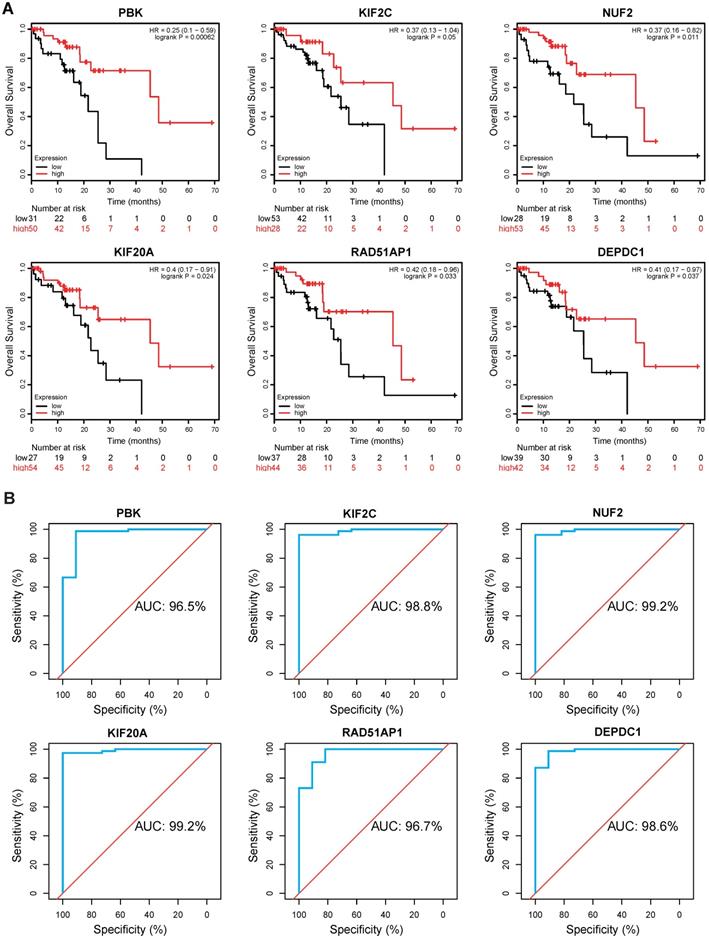
To evaluate the clinical value of these hub genes in ESCC, Kaplan-Meier survival analysis was performed using Kaplan Meier-plotter. Of the 10 genes, we found that PBK (hazard ratio [HR]=0.25, logrank P= 0.00062), KIF2C (HR=0.37, logrank P= 0.05), NUF2 (HR=0.37, logrank P= 0.011), KIF20A (HR=0.4, logrank P= 0.024), RAD51AP1 (HR=0.42, logrank P= 0.033), and DEPDC1 (HR=0.41, logrank P= 0.037) were significantly correlated with overall survival (Fig. 5A). ESCC patients with low expression levels of these genes generally have worse survival. Thereafter, a ROC analysis was conducted to investigate diagnostic value. The results showed PBK (area under the curve [AUC]= 96.5%), KIF2C (AUC= 98.8%), NUF2 (AUC= 99.2%), KIF20A (AUC= 99.2%), RAD51AP1 (AUC= 96.7%), and DEPDC1 (AUC= 98.6%) effectively distinguish ESCC tissues from normal samples (Fig. 5B).
Kaplan-Meier survival and ROC analysis. (A) Kaplan Meier survival analysis of PBK, KIF2C, NUF2, KIF20A, RAD51AP1 and DEPDC1 in ESCC. HR: Hazard Ratio. (B) ROC analysis of hub genes in ESCC. AUC: area under the curve.
Hub gene expression levels validation
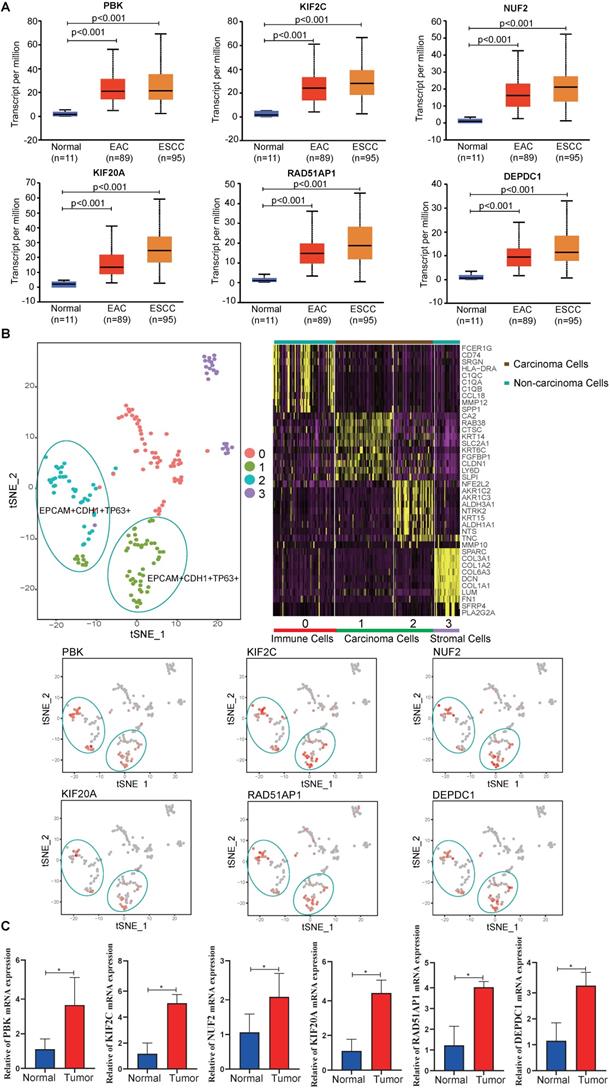
To validate the hub gene expression levels, UALCAN ESCA data, which contains 11 normal, 89 esophageal adenocarcinoma (EAC) and 95 ESCC samples, was used for analysis. The results showed that the mRNA expression levels of hub genes (PBK, KIF2C, NUF2, KIF20A, RAD51AP1 and DEPDC1) in tumor samples (EAC, ESCC) were significantly higher than in normal samples (P < 0.05) (Fig. 6A). In addition, the scRNA-seq analysis showed that the hub genes were mainly expressed on carcinoma cells, indicating that the identified differentially expressed genes were caused by cancer cells (Fig. 6B). To eliminate errors caused by sequencing, qPCR was performed. We found that all hub genes mRNA expression levels were significantly elevated in tumor tissues compared to adjacent normal tissues (P < 0.05) (Fig. 6C).
Expression levels of hub genes. (A) Expression levels of PBK, KIF2C, NUF2, KIF20A, RAD51AP1 and DEPDC1 in UALCAN database. (B) scRNA-seq analysis of hub genes in ESCC. (C) The relative mRNA expression of PBK, KIF2C, NUF2, KIF20A, RAD51AP1 and DEPDC1 were confirmed by qPCR (n=6). Data are presented as the means ± SEM. *P < 0.05 represent significant differences between the indicated groups.
Immune infiltration analysis
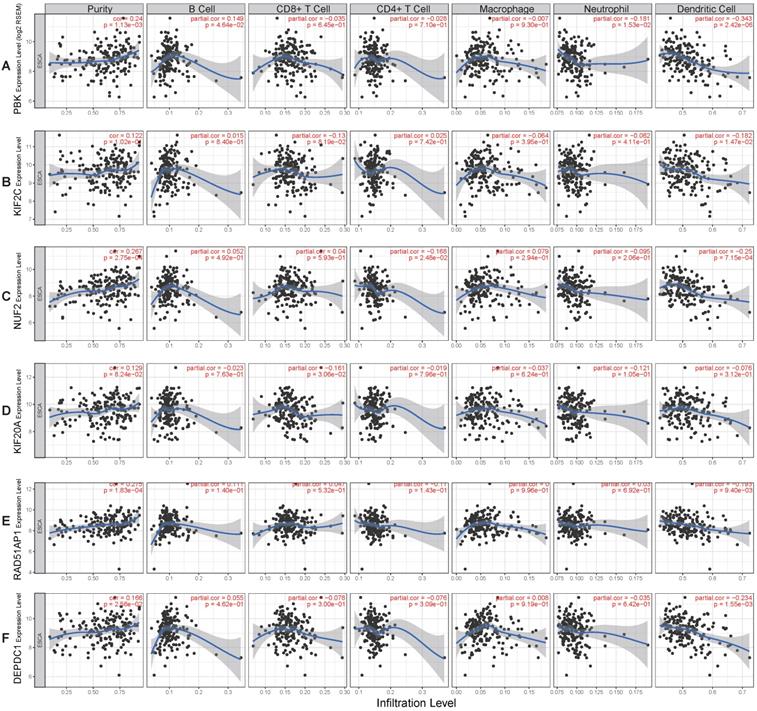
To better understand the function of these genes (PBK, KIF2C, NUF2, KIF20A, RAD51AP1, DEPDC1), the relationship between their expression and immune infiltration was performed. The results indicated that tumor purity significantly and positively correlated with PBK (R= 0.24, P= 1.13e-03), NUF2 (R= 0.267, P= 2.75e-04), RAD51AP1 (R= 0.275, P= 1.83e-04), and DEPDC1 (R= 0.166, P= 2.56e-02) expression. Infiltration of dendritic cells was significantly negatively correlated with PBK (R= -0.343, P= 2.42e-06), KIF2C (R= -0.182, P= 1.47e-02), NUF2 (R= -0.25, P= 7.15e-04), RAD51AP1 (R= -0.193, P= 9.4e-03), and DEPDC1 (R= -0.234, P= 1.55e-03) expression levels. However, their expression had no obvious correlation with infiltration of other immune cells (B cell, CD4 T cell, CD8 T cell, neutrophil, macrophage) (Fig. 7A-F).
Correlation of hub genes expression levels with immune infiltration of B cell, CD4 T cell, CD8 T cell, neutrophil, macrophage, and dendritic cell in ESCC. (A) PBK. (B) KIF2C. (C) NUF2. (D) KIF20A. (E) RAD51AP1. (F) DEPDC1.
Discussion
ESCC is the predominant type of esophageal carcinoma worldwide. In China, ESCC is the fourth leading cause of cancer-related death [21]. Despite recent improvements in diagnosis and treatment, ESCC's prognosis is still poor. The 5-year survival rate of ESCC patients is less than 30% [2]. Although several biomarkers for ESCC have been identified, the clinical value of most of them has not been confirmed. Thus, screening for more efficient biomarkers for ESCC diagnosis and prognosis is urgently required.
Integrating multiple datasets is considered to be a better method to improve the reliability of the results than individual dataset analysis. In our study, we integrated six GEO microarray datasets with TCGA ESCC dataset to screen the possible biomarkers for ESCC. In addition, in order to improve the reliability of the results, scRNA-seq and qPCR were performed to confirm the expression level of the identified genes. We identified six novel biomarkers (PBK, KIF2C, NUF2, KIF20A, RAD51AP1, DEPDC1) that are related to the diagnosis and prognosis of ESCC.
PBK is a serine-threonine kinase that was reported upregulated in breast cancer, and server as a therapy target for breast cancer [22]. Moreover, PBK was also overexpressed in oral cancer, and is known to be a favorable prognostic indicator for oral cancer [23]. Ohashi et al found that PBK overexpressed is associated with worse outcomes in ESCC [24]. However, our results revealed that high PBK expression significantly correlated with better outcomes (HR=0.25, logrank P= 0.00062). The contradictory result may be due to bias in individual cohort studies. The detailed reasons need to be further validated. In addition, ROC analysis also showed that PBK can effectively distinguish ESCC tissues from normal samples (AUC= 96.5%), indicating that PBK could be an independent diagnostic biomarker for ESCC.
KIF2C, a member of the motor proteins family, functions as a microtubule-dependent molecular motor [25]. Previous studies have demonstrated that high KIF2C expression can serve as an independent marker of poor prognosis in several tumors, including glioma, colorectal cancer, and gastric cancer [26-28]. In contrast, our study showed that low expression levels of KIF2C correlated with worse survival (HR=0.37, logrank P= 0.05). The diagnostic role of KIF2C in ESCC has not been previously reported. Our study revealed that KIF2C could be a useful diagnostic biomarker for ESCC (AUC= 98.8%).
NUF2 is a component of a protein complex associated with the centromere that plays an important role in chromosome segregation [29]. Previous studies have shown that NUF2 is an effective prognostic molecule for hepatocellular carcinoma [30], and silencing NUF2 can suppress human hepatocellular carcinoma tumor growth and induce apoptosis [31]. In addition, NUF2 overexpression is also related to poor prognosis in pancreatic cancer [32]. However, the role of NUF2 in ESCC still unknown. Our results revealed that low expression in ESCC is associated with worse outcomes, and NUF2 can efficiently distinguish tumor tissues from normal tissue (AUC= 99.2%), suggesting its diagnostic value for ESCC.
KIF20A (also named RAB6KIFL), has been reported overexpressed in many cancers including pancreatic cancer, melanoma, breast cancer, and glioma [33-37]. Moreover, KIF20A was also reported as a prognostic indicator for cervical squamous cell carcinoma, ovarian clear‑cell carcinoma, and glioma [37-39]. However, the role of KIF20A in ESCC has never been reported. In the present study, we found that KIF20A is overexpressed in ESCC, and low expression was associated with poor prognosis. ROC analysis revealed KIF20A is a promising diagnostic biomarker for ESCC (AUC= 99.2%).
RAD51AP1 is a DNA-binding protein, which plays a key role in homologous recombination and DNA repair [40]. Upregulated RAD51AP1 has been reported to be associated with poor prognosis in ovarian and lung cancers [41, 42]. In the present study, we found that RAD51AP1 is an effective diagnostic biomarker for ESCC (AUC= 96.7%). Moreover, silencing of RAD51AP1 can inhibit epithelial-mesenchymal transition and metastasis in non-small cell lung cancer [41, 42]. Therefore, high expression of RAD51AP1 may be implicated in ESCC development.
DEPDC1 is a novel cancer-related gene that was reported to be overexpressed in many tumors including bladder cancer, multiple myeloma, breast cancer, colorectal cancer, and hepatocellular carcinoma [43-47], and is known to be a poor prognostic indicator for these tumors. However, its role in ESCC has never been reported. Herein, our results revealed that DEPDC1 is a promising diagnostic and prognostic biomarker for ESCC.
So far, a great number of potential biomarkers have been identified. However, there is still a great gap to put these findings into clinical application. The major reason is that the poor reproducibility, small overlap between studies, and low sensitivity and specificity for diagnosis and prognosis of ESCC. For example, Takeshita et al. found that the sensitivity and specificity of serum miR-1246 for the diagnosis of ESCC were 71.3% and 73.9%, respectively [48]. The specificity and sensitivity of miR-146a for diagnosis of ESCC were 68.6% and 85.7% [49]. Additionally, Adams et al. speculated that the four indicators of AHRR, p16INK4a, MT1G and CLDN3 can be combined to improve the sensitivity and specificity for the diagnosis of ESCC. However, in clinical applications, the sensitivity and specificity of the combined index in the diagnosis of ESCC were only 50% and 68%, respectively [50]. In our present study, we found that PBK (area under the curve [AUC]= 96.5%), KIF2C (AUC= 98.8%), NUF2 (AUC= 99.2%), KIF20A (AUC= 99.2%), RAD51AP1 (AUC= 96.7%), and DEPDC1 (AUC= 98.6%) all with a high sensitivity and specificity for the diagnosis of ESCC. However, future work focusing on the in vitro and in vivo validation before clinical application is still needed.
Conclusions
In conclusion, our study identified six novel biomarkers (PBK, KIF2C, NUF2, KIF20A, RAD51AP1 and DEPDC1) for ESCC. Notably, all of them could be independent diagnostic and prognostic indicators for ESCC. In addition, scRNA-seq results showed that the hub genes is mainly expressed on carcinoma cells, and qPCR results also indicated that the expression of the hub genes in tumor tissues is significantly higher than normal tissues. All these results confirmed the reliability of the analysis. Moreover, their expression levels were significantly positively correlated with tumor purity, and negatively correlated with the infiltration of DCs. DCs are the most important antigen presenting cells, which play a key role in connecting innate immunity with acquired immunity. Reducing the infiltration of DCs may affect the presentation of antigens, resulting in the inability of the host immune response to effectively kill tumor cells. This may be one of the underlying molecular mechanisms in the tumorigenesis of ESCC. Our results indicate that these genes may also be potential targets for ESCC therapy. Further experiments are required to confirm these findings.
Abbreviations
DEGs: differentially expressed genes; EAC: esophageal adenocarcinoma; ESCC: Esophageal squamous cell carcinoma; GEO: Gene Expression Omnibus; GO: Gene ontology; MCC: Maximal Clique Centrality; NCBI: National Center for Biotechnology Information; PCA: principal component analysis; PPI: protein‑protein interaction; qPCR: real-time quantitative PCR; scRNA-seq: single cell RNA sequencing; TCGA: The Cancer Genome Atlas; ROC: receiver operating curve; TIMER: Tumor Immune Estimation Resource.
Acknowledgements
This work was supported by the National Natural Science Foundation of China (grant no. 30571650 and 31370927).
Ethics Committee Approval and Patient Consent
The ethics committee at the Changhai Hospital, Second Military Medical University approved this study, and written informed consent on the use of clinical specimens from all participants.
Competing Interests
The authors have declared that no competing interest exists.
References
1. Bray F, Ferlay J, Soerjomataram I, Siegel RL, Torre LA, Jemal A. Global cancer statistics 2018: GLOBOCAN estimates of incidence and mortality worldwide for 36 cancers in 185 countries. CA Cancer J Clin. 2018;68(6):394-424
2. Pennathur A, Gibson MK, Jobe BA, Luketich JD. Oesophageal carcinoma. Lancet. 2013;381(9864):400-412
3. Mao Y, Fu Z, Zhang Y. et al. A seven-lncRNA signature predicts overall survival in esophageal squamous cell carcinoma. Sci Rep. 2018;8(1):8823
4. Wang C, Pu W, Zhao D. et al. Identification of Hyper-Methylated Tumor Suppressor Genes-Based Diagnostic Panel for Esophageal Squamous Cell Carcinoma (ESCC) in a Chinese Han Population. Front Genet. 2018;9:356
5. Li CY, Zhang WW, Xiang JL, Wang XH, Wang JL, Li J. Integrated analysis highlights multiple long non-coding RNAs and their potential roles in the progression of human esophageal squamous cell carcinoma. Oncol Rep. 2019;42(6):2583-2599
6. Li HM, Yang H, Wen DY. et al. Overexpression of LncRNA HOTAIR is Associated with Poor Prognosis in Thyroid Carcinoma: A Study Based on TCGA and GEO Data. Horm Metab Res. 2017;49(05):388-399
7. Song G, Xu J, He L. et al. Systematic profiling identifies PDLIM2 as a novel prognostic predictor for oesophageal squamous cell carcinoma (ESCC). J Cell Mol Med. 2019;23(8):5751-5761
8. Pu W, Wang C, Chen S. et al. Targeted bisulfite sequencing identified a panel of DNA methylation-based biomarkers for esophageal squamous cell carcinoma(ESCC). Clin Epigenetics. 2017;9:129
9. Lu T, Chen D, Wang Y. et al. Identification of DNA methylation-driven genes in esophageal squamous cell carcinoma: a study based on The Cancer Genome Atlas. Cancer Cell Int. 2019;19(1):52
10. Kulasingam V, Diamandis EP. Strategies for discovering novel cancer biomarkers through utilization of emerging technologies. Nat Clin Pract Oncol. 2008;5(10):588-599
11. Sean D, Meltzer PS. GEOquery: a bridge between the Gene Expression Omnibus (GEO) and BioConductor. Bioinformatics. 2007(14):14
12. Ritchie ME, Belinda P, Di W. et al. limma powers differential expression analyses for RNA-sequencing and microarray studies. Nucleic Acids Res. 2015;43(7):e47
13. Bardou P, Mariette J, Escudié F, Djemiel C, Klopp C. jvenn: an interactive Venn diagram viewer. BMC Bioinformatics. 2014;15(1):293
14. Szklarczyk D, Morris JH, Cook H. et al. The STRING database in 2017: quality-controlled protein-protein association networks, made broadly accessible. Nucleic Acids Res. 2017;45(D1):D362-D368
15. Chin CH, Chen SH, Wu HH, Ho CW, Ko MT, Lin CY. cytoHubba:identifying hub objects and sub-networks from complex interactome. BMC Syst Biol. 2014;8(Suppl4):S11
16. Ádám N, András L, Otília M, Balázs Gr. Validation of miRNA prognostic power in hepatocellular carcinoma using expression data of independent datasets. Sci Rep. 2018;8(1):9227
17. Robin X, Turck N, Hainard A. et al. pROC: an open-source package for R and S+ to analyze and compare ROC curves. BMC Bioinformatics. 2011;12(1):77-70
18. Chandrashekar DS, Bashel B, Balasubramanya SAH, Creighton CJ, Varambally S. UALCAN: A Portal for Facilitating Tumor Subgroup Gene Expression and Survival Analyses. Neoplasia. 2017;19(8):649-658
19. Wu H, Yu J, Li Y. et al. Single-cell RNA sequencing reveals diverse intratumoral heterogeneities and gene signatures of two types of esophageal cancers. Cancer Lett. 2018;438:133-143
20. Li T, Fan J, Wang B. et al. TIMER: A Web Server for Comprehensive Analysis of Tumor-Infiltrating Immune Cells. Cancer Res. 2017;77(21):e108-e110
21. Chen W, Zheng R, Zeng H, Zhang S. The incidence and mortality of major cancers in China, 2012. Chin J Cancer. 2016;35(1):73
22. Park JH, Lin ML, Nishidate T, Nakamura Y, Katagiri T. PDZ-binding kinase/T-LAK cell-originated protein kinase (PBK/TOPK) as a molecular target for breast cancer therapy. Cancer Res. 2006;66(18):9186-95
23. Chang CF, Chen SL, Sung WW. et al. PBK/TOPK Expression Predicts Prognosis in Oral Cancer. Int J Mol Sci. 2016 17(7). pii: E1007
24. Ohashi T, Komatsu S, Ichikawa D. et al. Overexpression of PBK/TOPK Contributes to Tumor Development and Poor Outcome of Esophageal Squamous Cell Carcinoma. Anticancer Res. 2016;36(12):6457-6466
25. Manning AL, Ganem NJ, Bakhoum SF, Wagenbach M, Wordeman L, Compton DA. The kinesin-13 proteins Kif2a, Kif2b, and Kif2c/MCAK have distinct roles during mitosis in human cells. Mol Biol Cell. 2007;18(8):2970-2979
26. Bie L, Zhao G, Wang YP, Zhang B. Kinesin family member 2C (KIF2C/MCAK) is a novel marker for prognosis in human gliomas. Clin Neurol Neurosurg. 2012;114(4):356-60
27. Ishikawa K, Kamohara Y, Tanaka F. et al. Mitotic centromere-associated kinesin is a novel marker for prognosis and lymph node metastasis in colorectal cancer. Br J Cancer. 2008;98(11):1824-9
28. Nakamura Y, Tanaka F, Haraguchi N. et al. Clinicopathological and biological significance of mitotic centromere-associated kinesin overexpression in human gastric cancer. Br J Cancer. 2007;97(4):543-549
29. DeLuca JG, Moree B, Hickey JM, Kilmartin JV, Salmon ED. hNuf2 inhibition blocks stable kinetochore-microtubule attachment and induces mitotic cell death in HeLa cells. J Cell Biol. 2002;159(4):549-555
30. Wang Y, Tan PY, Handoko YA. et al. NUF2 is a valuable prognostic biomarker to predict early recurrence of hepatocellular carcinoma after surgical resection. Int J Cancer. 2019;145(3):662-670
31. Liu Q, Dai SJ, Li H, Dong L, Peng YP. Silencing of NUF2 inhibits tumor growth and induces apoptosis in human hepatocellular carcinomas. Asian Pac J Cancer Prev. 2014;15(20):8623-8629
32. Hu P, Shangguan J, Zhang L. Downregulation of NUF2 inhibits tumor growth and induces apoptosis by regulating IncRNA AF339813. Int J Clin Exp Pathol. 2015;8(3):2638-2648
33. Imai K, Hirata S, Irie A, Senju S, Nishimura Y. Identification of HLA-A2-restricted CTL epitopes of a novel tumour-associated antigen, KIF20A, overexpressed in pancreatic cancer. Br J Cancer. 2011;104(2):300-307
34. Yamashita J, Fukushima S, Jinnin M. et al. Kinesin Family Member 20A is a Novel Melanoma-associated Antigen. Acta Derm Venereol. 2012;92(6):593-597
35. Khongkow P, Gomes AR, Gong C. et al. Paclitaxel targets FOXM1 to regulate KIF20A in mitotic catastrophe and breast cancer paclitaxel resistance. Oncogene. 2016;35(8):990-1002
36. Zou JX, Duan Z, Wang J. et al. Kinesin Family Deregulation Coordinated by Bromodomain Protein ANCCA and Histone Methyltransferase MLL for Breast Cancer Cell Growth, Survival, and Tamoxifen Resistance. Mol Cancer Res. 2014;12(4):539-549
37. Duan J, Huang W, Shi H. Positive expression of KIF20A indicates poor prognosis of glioma patients. Onco Targets Ther. 2016;9:6741-6749
38. Zhang W, He W, Shi Y. et al. High Expression of KIF20A Is Associated with Poor Overall Survival and Tumor Progression in Early-Stage Cervical Squamous Cell Carcinoma. PLoS One. 2016;11(12):e0167449
39. Kawai Y, Shibata K, Sakata J. et al. KIF20A expression as a prognostic indicator and its possible involvement in the proliferation of ovarian clearcell carcinoma cells. Oncol Rep. 2018;40(1):195-205
40. Pires E, Sung P, Wiese C. Role of RAD51AP1 in homologous recombination DNA repair and carcinogenesis. DNA Repair (Amst). 2017;59:76-81
41. Chudasama D, Bo V, Hall M, Anikin V, Karteris E. Identification of novel cancer biomarkers of prognostic value using specific gene regulatory networks (GRN): a novel role of RAD51AP1 for ovarian and lung cancers. Carcinogenesis. 2018;39(3):407-417
42. Li S, Xuan Y, Gao B, Sun X, Miao S. Identification of an eight-gene prognostic signature for lung adenocarcinoma. Cancer Manag Res. 2018;10:3383-3392
43. Kanehira M, Harada Y, Takata R. et al. Involvement of upregulation of DEPDC1 (DEP domain containing 1) in bladder carcinogenesis. Oncogene. 2007;26(44):6448-6455
44. Kassambara A, Schoenhals M, Moreaux J. et al. Inhibition of DEPDC1A, a Bad Prognostic Marker in Multiple Myeloma, Delays Growth and Induces Mature Plasma Cell Markers in Malignant Plasma Cells. Plos One. 2013;8(4):e62752
45. Zhao H, Yu M, Sui L. et al. High Expression of DEPDC1 Promotes Malignant Phenotypes of Breast Cancer Cells and Predicts Poor Prognosis in Patients With Breast Cancer. Front Oncol. 2019;9:262
46. Yukinaga M, Kenichi K, Tomoko N. et al. Clinicopathological significance and prognostic value of Wilms' tumor gene expression in colorectal cancer. Cancer Biomarker. 2015;15(6):789-797
47. Yuan SG, Liao WJ, Yang JJ, Huang GJ, Huang ZQ. DEP Domain Containing 1 is a Novel Diagnostic Marker and Prognostic Predictor for Hepatocellular Carcinoma. Asian Pac J Cancer Prev. 2014;15(24):10917-10922
48. Takeshita N, Hoshino I, Mori M. et al. Serum microRNA expression profile: miR-1246 as a novel diagnostic and prognostic biomarker for oesophageal squamous cell carcinoma. Br J Cancer. 2013;108(3):644-652
49. Wang C, Guan S, Liu F. et al. Prognostic and diagnostic potential of miR-146a in oesophageal squamous cell carcinoma. Br J Cancer. 2016;114(3):290-7
50. Adams L, Roth MJ, Abnet CC. et al. Promoter methylation in cytology specimens as an early detection marker for esophageal squamous dysplasia and early esophageal squamous cell carcinoma. Cancer Prev Res (Phila). 2008;1(5):357-61
Author contact
![]() Corresponding authors: Hai Jin, E-mail: projinhaicom; Naishuo Zhu, E-mail: nzhuedu.cn. Postal address: No. 2005 Songhu Road, Yangpu District, Shanghai, China.
Corresponding authors: Hai Jin, E-mail: projinhaicom; Naishuo Zhu, E-mail: nzhuedu.cn. Postal address: No. 2005 Songhu Road, Yangpu District, Shanghai, China.