Impact Factor ISSN: 1837-9664

 Global reach, higher impact
J Cancer 2021; 12(3):740-753. doi:10.7150/jca.48245 This issue Cite
Research Paper
Identification of Seven Cell Cycle-Related Genes with Unfavorable Prognosis and Construction of their TF-miRNA-mRNA regulatory network in Breast Cancer
Zhipeng Hong1,2,3*, Qinglan Wang1*, Chengye Hong1*, Meimei Liu1, Pengqin Qiu1, Rongrong Lin1, Xiaolan Lin1, Fangfang Chen1, Qiuhuang Li1, Lingling Liu1, Chuan Wang2,3 ![]() , Debo Chen1
, Debo Chen1 ![]()
1. Department of Breast Surgery, Affiliated Quanzhou First Hospital of Fujian Medical University, Quanzhou, Fujian Province, 362000, P. R. China.
2. Department of Breast Surgery and General Surgery, The Affiliated Union Hospital of Fujian Medical University, Fuzhou, Fujian Province, 350001, P. R. China.
3. Breast Cancer Institute, Fujian Medical University, Fuzhou, Fujian Province, 350001, P.R. China.
*These authors contributed equally to this work.
Received 2020-5-26; Accepted 2020-11-4; Published 2021-1-1
Abstract
Breast cancer (BC), with complex tumorigenesis and progression, remains the most common malignancy in women. We aimed to explore some novel and significant genes with unfavorable prognoses and potential pathways involved in BC initiation and progression via bioinformatics methods. BC tissue-specific microarray datasets of GSE42568, GSE45827 and GSE54002, which included a total of 651 BC tissues and 44 normal breast tissues, were obtained from the Gene Expression Omnibus (GEO) database, and 124 differentially expressed genes (DEGs) were identified between BC tissues and normal breast tissues via R software and an online Venn diagram tool. Database for Annotation, Visualization and Integration Discovery (DAVID) software showed that 65 upregulated DEGs were mainly enriched in the regulation of the cell cycle, and Search Tool for the Retrieval of Interacting Genes (STRING) software identified the 39 closest associated upregulated DEGs in protein-protein interactions (PPIs), which validated the high expression of genes in BC tissues by the Gene Expression Profiling Interactive Analysis (GEPIA) tool. In addition, 36 out of 39 BC patients showed significantly worse outcomes by Kaplan-Meier plotter (KM plotter), and an additional Kyoto Encyclopedia of Genes and Genomes (KEGG) enrichment analysis revealed that seven genes (cyclin E2 (CCNE2), cyclin B1 (CCNB1), cyclin B2 (CCNB2), mitotic checkpoint serine/threonine kinase B (BUB1B), dual-specificity protein kinase (TTK), cell division cycle 20 (CDC20), and pituitary tumor transforming gene 1 (PTTG1)) were markedly enriched in the cell cycle pathway. Analysis of the clinicopathological characteristics of hub genes revealed that seven cell cycle-related genes (CCRGs) were significantly highly expressed in four BC subtypes (luminal A, luminal B, HER2-positive and triple-negative (TNBC)), and except for the CCNE2 gene, high expression levels were significantly associated with tumor pathological grade and stage and metastatic events of BC. Furthermore, genetic mutation analysis indicated that genetic alterations of CCRGs could also significantly affect BC patients' prognosis. A quantitative real-time polymerase chain reaction (qRT-PCR) assay found that the seven CCRGs were significantly differentially expressed in BC cell lines. Integration of published multilevel expression data and a bioinformatics computational approach were used to predict and construct a regulation mechanism: a transcription factor (TF)-microRNA (miRNA)-messenger RNA (mRNA) regulation network. The present work is the first to construct a regulatory network of TF-miRNA-mRNA in BC for CCRGs and provides new insights into the molecular mechanism of BC.
Keywords: bioinformatics analysis, microarray dataset, breast cancer, differentially expressed gene, cell cycle, TF-miRNA-mRNA
Introduction
Based on the biennial update of the American Cancer Society on female breast cancer (BC) statistics in the United States, BC is still the most commonly diagnosed malignant disease and the second most common cause of cancer-related death among women after lung cancer [1]. In 2018, the number of new diagnoses of female BC cancers worldwide was approximately 2.1 million, leading to approximately 1 in 4 cancer deaths [2]. Currently, the main screening methods for BC are limited to traditional mammography, ultrasound, and tumor markers in blood samples, such as carcinoembryonic antigen and carcinoma antigen 15-3 [3]. In addition, surgical resection, chemotherapy, radiotherapy and hormone therapy are the most commonly chosen treatment strategies in clinical practice. However, there is no doubt that the diagnostic methods and treatment strategies are not precise enough, especially in the current era of precision medicine. Therefore, pursuing more novel and precise therapeutic agents is urgently needed in clinical practice to obtain a more satisfactory prognosis for BC patients.
The tumorigenesis and progression of BC at the molecular level, particularly the genes and pathways involved, are still unknown, and these are helpful for acknowledging tumor behavior and exploring novel targets or strategies for cancer diagnosis or treatment. Excitingly, the rapid expansion of biological microarray analysis greatly promotes the understanding of driver genes and functional pathways in BC by screening DEGs between tumor and normal tissues in the gene expression profiles of tumors [4]. Increasing data in various cancers have led to the identification of specific genes or pathways that play important roles in the biology and prognosis of tumors via the use of microarrays and bioinformatics methods [5-8]. Although significant expression of DEGs in BC has been reported in some previous studies [9-12], those individual studies provide a relatively limited amount of data regarding carcinogenesis. Hence, integrating multiple sets of BC gene expression data across microarrays to identify significant DEGs via bioinformatics analysis is a promising approach to demonstrate the potential driver genes, associated pathways and interaction networks underlying BC.
In the present study, a cross-tissue gene expression comparison in BC was conducted by integrating three BC gene expression datasets, which contained stroma samples from invasive ductal carcinoma and breast tissues. Differential analysis, enrichment analysis, protein-protein interaction (PPI) network analysis, RNA sequencing expression analysis, survival analysis, clinicopathological characteristics analysis, mutation analysis and quantitative real-time polymerase chain reaction assay were performed to identify hub genes associated with BC and to further construct a transcription factor (TF)-microRNA (miRNA)-messenger RNA (mRNA) regulatory network. While revealing the potential molecular mechanism of BC occurrence, these findings may provide a basis for developing potential therapeutic targets for BC.
Materials and Methods
Collection of microarray data information from GEO datasets
The Gene Expression Omnibus (GEO; https://www.ncbi.nlm.nih.gov/geo/) is known as a public functional genomics data repository containing array- and sequence-based data, which allows users to search, browse and download gene expression profiles. After careful review and comparison, we obtained three gene expression profiles of BC and normal breast tissues, namely, GSE42568, GSE45827 and GSE54002. Microarray datasets of GSE42568, GSE45827 and GSE54002 were all processed on the GPL570 platform ([HG-U133_Plus_2] Affymetrix Human Genome U133 Plus 2.0 Array) and contained 104 BC tissues and 17 normal breast tissues, 130 BC tissues and 11 normal breast tissues, and 417 BC tissues and 16 breast tissues, respectively.
Data processing and differential analysis
We detected and removed batch effects in each dataset (Supplementary Figure S1) and then classified the BC specimens and normal breast specimens in three microarray datasets using R software (version 3.4.4) packages edgeR and limma to identify DEGs. The cutoff criteria were |log2FC| >2 and adjusted p value <0.05. Next, DEGs in each dataset were exported to an online Venn diagram tool (http://bioinformatics.psb.ugent.be/webtools/Venn/) to identify the intersecting DEGs among the three datasets. Finally, the intersecting DEGs with log2FC>2 were deemed to be upregulated genes, and those with log2FC<-2 were considered downregulated genes.
Functional and pathway enrichment analyses
Gene Ontology (GO) analysis [13] and Kyoto Encyclopedia of Genes and Genomes (KEGG) pathway enrichment analysis [14] were performed on the intersecting DEGs using Database for Annotation, Visualization and Integration Discovery (DAVID) version 6.8 [15]. DEGs enriched in biological processes (BPs), cellular components (CCs) and molecular functions (MFs) were included in the GO analysis (p<0.05).
PPI network construction and module analysis
A PPI network of intersecting DEGs was constructed by an online tool, Search Tool for the Retrieval of Interacting Genes (STRING) [16] version 11.0, to evaluate the protein functions and cellular regulatory mechanisms of DEGs at the molecular level. The Molecular Complex Detection (MCODE) app was a plugin in Cytoscape [17] version 3.7.2 and was applied to check modules of the PPI network. The module with the highest MCODE score is our interesting target.
Validation of RNA sequencing expression of central genes
Gene Expression Profiling Interactive Analysis (GEPIA; http://gepia.cancer-pku.cn/index.html) and GEPIA2 (http://gepia2.cancer-pku.cn/#index) were the functional tools for analyzing the prevalence and expression of a gene signature in the Cancer Genome Atlas (TCGA) and Genotype-Tissue Expression (GTEx) samples [18]. To further validate the intersecting DEGs, GEPIA and GEPIA2 were used to probe the RNA sequencing expression between BC and normal breast tissues. P<0.05 was considered significant.
Survival analysis of central genes
The Kaplan-Meier plotter (KM plotter) system contained gene ChIP and RNA-seq data sources from the TCGA, European Genome-phenome Archive (EGA) and GEO and was generally used for survival analysis and survival biomarker validation [19]. In our study, KM plotter was applied to assess the effect of hub genes and miRNAs on survival in BC. The log-rank p value and hazard ratio (HR) with 95% confidence intervals were automatically determined and displayed on the plot. A log-rank p value <0.05 was considered significant.
Oncomine™ analysis
Oncomine™ is a web-based data-mining platform consisting of multiple integrated cancer microarray databases and additional clinicopathological data [20]. The hub gene-related clinical pathological data of tumors were searched for in this platform to explore the relationship between hub genes and aggressive biological behavior of tumors and analyzed in GraphPad Prism 8. Transcriptional expression of hub genes in 20 different types of cancer diseases was explored in Oncomine™ databases. Differences in transcriptional expression were compared by Student's t-test. The cutoff p value was 0.01; the cutoff fold change was 1.5; the gene rank was 10%, and data type was mRNA. Tumor pathological grade and stage of BC were investigated via the Curtis breast dataset (2136 cases), and metastatic event status of BC was studied via the Desmedt breast dataset (198 cases). The threshold of the p value was set as 1E-4, and the fold change was 2 in the dataset filter.
cBioPortal analysis
cBioPortal (www.cbioportal.org) is an open source platform for exploring, visualizing, and analyzing multidimensional cancer genomics and clinical data [21]. The dataset we explored is BC (METABRIC, Nature 2012 & Nat Commun 2016) with a total of 2509 samples, among which 1904 samples with complete mutation and copy number alterations were built to analyze the genomic profiles of hub genes. Genetic mutations in hub genes and their association with overall survival (OS) of BC patients were displayed as Kaplan-Meier plots, and the log-rank test was performed to identify the significance of the differences between the survival curves. When a p value <0.05, the difference was considered statistically significant.
Cell culture
A mammary gland epithelial cell line MCF-10A and BC cell lines MCF-7 and MDA-MB-231 were purchased from the Cell Resource Center of the Shanghai Institutes for Biological Sciences. MCF-10A cells were grown in complete growth medium consisting of a 1:1 mixture of Dulbecco's modified Eagle's medium (DMEM) and Ham's F12 medium supplemented with 5% (v/v) horse serum, 10 µg/ml insulin, 100 ng/ml cholera toxin, 20 ng/ml recombinant human epidermal growth factor, 0.5 µg/ml hydrocortisone and 1 unit (U)/ml penicillin/streptomycin. MCF-7 cells and MDA-MB-231 cells were cultured in DMEM (Gibco, Carlsbad, CA, United States) containing 10% fetal bovine serum (Gibco), 1% penicillin (100 U/ml) and 1% streptomycin (100 U/ml). The cells were all incubated in a humidified incubator at 37°C with 5% CO2.
qRT-PCR
Total RNA of the target gene was extracted from the cultured cells using TRIzol reagent (Invitrogen; Thermo Fisher Scientific, Inc.) and quantified using an Ultra-micro UV analyzer Q6000Uv (Quawell Technology, Inc.). The first cDNA strand specific to each gene was synthesized from total RNA using the Bestar™ qPCR RT Kit (cat. no. 2220; DBI Bioscience) on a PCR Amplifier (product no. K960; Hangzhou Jingge Scientific Instrument Co., Ltd.). Real‑time PCR was conducted using Stratagene Mx3000P (Agilent Technologies, Inc.) and by applying Bestar™ qPCR Master Mix (cat. no. 2043; DBI Bioscience). GAPDH was used as an endogenous control and analyzed with the 2-ΔΔCq method. The assay was conducted in triplicate. The primer sequences for each gene are listed in Supplementary Table S1.
IHC analysis
The Human Protein Atlas (http://www.proteinatlas.org) is a large-scale protein research project, and its main purpose is to map the location of proteins encoded by genes and their expression in human tissues and cells. Each immunohistochemistry (IHC) image in this database has been evaluated by specially educated personnel. We explored the IHC and RNA expression of genes with prognostic value in normal mammary tissues and BC tissues from the Human Protein Atlas.
Construction of a regulatory network
We generated an miRNA-mRNA regulatory network by using the intersecting DEGs from TarBase version 8 (http://carolina.imis.athena-innovation.gr/diana_tools/web/index.php?r=tarbasev8%2Findex) and miRTarBase (http://mirtarbase.cuhk.edu.cn/php/index.php). The curated TF-miRNA regulations were derived from the TransmiR version 2.0 database (http://www.cuilab.cn/transmir) [22]. The following parameters were selected to reduce false positives during processing: (i) number of supporting experiments ≥1 means that at least one high-throughput sequencing of RNA isolated by crosslinking immunoprecipitation (CLIP-Seq) experiment supported the predicted miRNA target site; (ii) up- or downregulated expression patterns between miRNA and mRNA were included; and (iii) level 1 or 2 evidence for supporting the predicted TF in breast tissue was included, and the prediction of literature evidence was excluded. The above interaction information was imported into Cytoscape software version 3.7.2 to construct the TF-miRNA-mRNA regulatory network.
Statistical analysis
GraphPad Prism 8 (GraphPad Software, Inc.) was used for statistical analyses. The results are expressed as the mean ± standard deviation (SD). One-way analysis of variance and Tukey's post hoc test were used to analyze the differences among three or more groups. A p value < 0.05 was considered to indicate a statistically significant difference.
Results
Identification of DEGs in BC
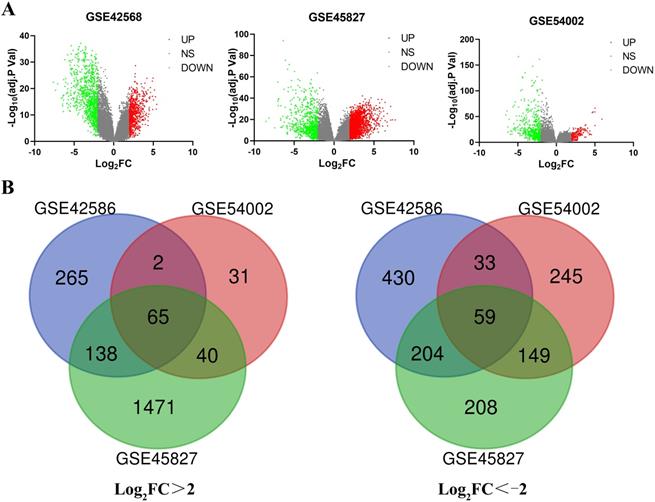
A total of 651 BC tissues and 44 normal breast tissues were included in our study. The series from each chip, or sample, was separately analyzed via R software, resulting in the list of DEGs. GSE42568, GSE45827 and GSE54002 chips were screened, resulting in 1196 (470 upregulated and 726 downregulated), 2334 (1714 upregulated and 620 downregulated) and 624 (138 upregulated and 486 downregulated) DEGs, respectively (Figure 1A). After using an online Venn diagram software, a total of 65 upregulated DEGs (logFC>2) and 59 downregulated DEGs (logFC<-2) that overlapped in the BC tissues were extracted and identified from these three chips (Figure 1B and Supplementary Table S2).
Identification of the DEGs in three datasets (GSE42568, GSE45827 and GSE54002). (A) The volcano map for each dataset; red dots indicate upregulated DEGs; green dots represent downregulated DEGs; and gray dots indicate nonsignificant (NS) DEGs. (B) A total of 124 common DEGs were identified in an online Venn diagram tool. Different colors represent different datasets. Sixty-five overlapping upregulated DEGs in the three datasets (log2FC > 2) and 59 overlapping downregulated DEGs in the three datasets (log2FC < -2) were identified.
GO function and KEGG pathway enrichment analyses of DEGs
All 124 overlapping DEGs were further used to explore the biological functions via DAVID software. The BP results suggested that upregulated DEGs were significantly enriched in collagen fibril organization, regulation of cell cycle, mitotic sister chromatid segregation and mitotic cytokinesis (Supplementary Figure S2A), and downregulated DEGs were mainly enriched in negative regulation of anoikis, insulin receptor signaling pathway, cellular response to starvation and positive regulation of cell proliferation (Supplementary Figure S2B). MF analysis indicated that upregulated DEGs were significantly enriched in proteinaceous extracellular matrix, midbody, spindle microtubule, cytoplasm and nucleus (Supplementary Figure S2C), and downregulated DEGs were mainly enriched in extracellular space, membrane raft, extracellular region, focal adhesion and proteinaceous extracellular matrix (Supplementary Figure S2D). CC results revealed that upregulated DEGs were significantly enriched in ATP binding, heparin binding, extracellular matrix structural constituent and microtubule motor activity (Supplementary Figure S2E), and downregulated DEGs were mainly enriched in heparin binding, signal transducer activity, protein binding, bridging and metalloendopeptidase activity (Supplementary Figure S2F).
KEGG pathway analysis showed that upregulated DEGs were significantly enriched in cell cycle, extracellular matrix (ECM)-receptor interaction, oocyte meiosis, p53 signaling pathway and protein digestion and absorption (p<0.05), while downregulated DEGs displayed no significantly enriched signaling pathways (Supplementary Table S3).
PPI network construction and modular analysis
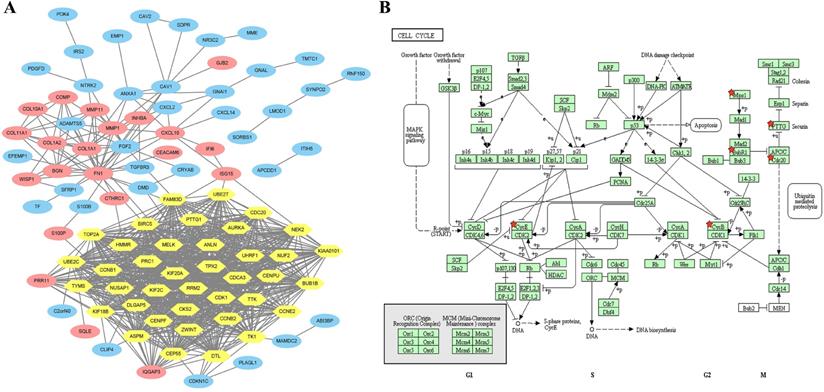
A total of 124 overlapping DEGs were mapped with STRING to explore potential interactions of the DEGs at the protein level. Ninety-seven nodes and 881 edges were constructed and represented in the PPI network with a PPI enrichment p value <1.0E-16 and included 60 upregulated and 37 downregulated DEGs (Figure 2A). A significant module was subsequently applied and constructed with 39 nodes and 709 edges, which gained the highest score in MCODE (yellow part in Figure 2A). Interestingly, the 39 central nodes were all upregulated genes in BC tissues.
Overlapping DEGs constructed from the PPI network by STRING and MCODE plugin app were analyzed again with the KEGG enrichment pathway. (A) A total of 97 DEGs are involved in the PPI network complex. The nodes represent proteins, and the edges indicate the interaction of proteins. Blue circles represent downregulated DEGs, and red and yellow circles represent upregulated DEGs. Yellow circles are identified with the highest score by MCODE module analysis (degree cutoff= 2, node score cutoff= 0.2, k-core = 2, and max. depth = 100). (B) Seven genes (CCNE2, CCNB1, CCNB2, BUB1B, TTK, CDC20 and PTTG1, labeled with a red star) were significantly enriched in the cell cycle pathway, especially in G2/M phases. Mps1 represents TTK; BubR1 represents BUB1B; CycB represents both CCNB1 and CCNB2; and CycE represents CCNE2.
Expression analysis of core genes via GEPIA and survival analysis via KM plotter
The 39 core genes were imported into the online GEPIA analysis tool with |log2FC| cutoff value=1 and p value cutoff value=0.01. The results showed that these 39 core genes were all significantly expressed in BC patients compared with patients with normal breast tissue (Supplementary Figure S3 and Supplementary Table S4). To further clarify the significance of these 39 core genes for BC survival, KM plotter was applied for analysis. It turned out that 36 out of the 39 upregulated genes showed a markedly worse survival (p<0.05, Supplementary Figure S3 and Supplementary Table S5).
KEGG pathway enrichment of the 36 selected core genes
A total of 36 selected core genes were analyzed again using KEGG pathway enrichment analysis by DAVID to explore the vital functions driving tumorigenesis in BC. The results indicated that seven hub genes (cyclin E2 (CCNE2), cyclin B1 (CCNB1), cyclin B2 (CCNB2), mitotic checkpoint serine/threonine kinase B (BUB1B), dual-specificity protein kinase (TTK), cell division cycle 20 (CDC20), and pituitary tumor transforming gene 1 (PTTG1)) were significantly enriched in the cell cycle pathway (p=1.42E-07, Figure 2B and Supplementary Table S6).
Transcripts and survival analysis of hub genes
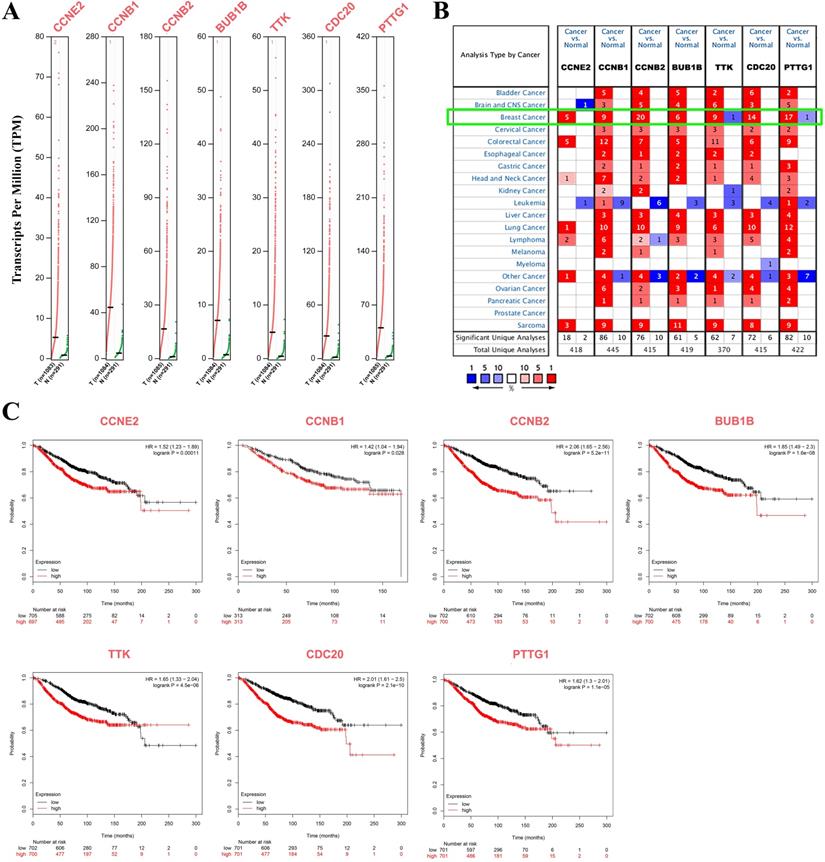
Seven cell cycle-related genes (CCRGs) were explored again at the transcript level via GEPIA and confirmed via the Oncomine™ database. The results showed that CCNE2, CCNB1, CCNB2, BUB1B, TTK, CDC20 and PTTG1 were significantly highly expressed in BC patients (p<0.05, Figure 3A) and confirmed that the transcriptional expression of these seven CCRGs was significantly higher in the BC population (p<0.01, green frame, Figure 3B) than in the normal population. KM plotter analysis indicated that high expression of these seven CCRGs led to an unfavorable prognosis (p<0.05, Figure 3C).
Transcription and survival analysis of hub genes. (A) Transcription levels of seven cell cycle-related hub genes via GEPIA (p<0.05); red dots represent BC samples, and green dots represent normal tissue samples. (B) Transcriptional expression of seven CCRGs was significantly high in BC (p<0.01, green frame, Oncomine™ database). Numbers represent the significantly differential expression datasets. (C) Survival analysis of seven CCRGs via KM plotter (p<0.05); the red line represents high expression, and the dark line represents low expression in BC patients.
Analysis of clinicopathological characteristics of hub genes
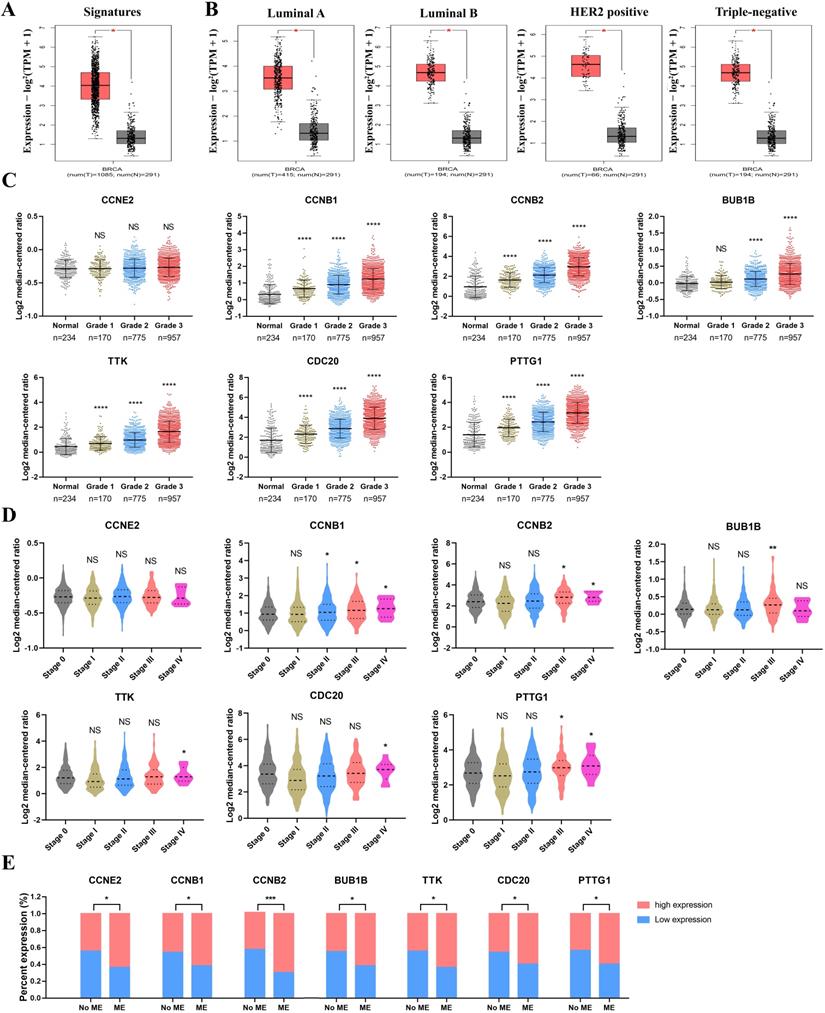
Seven CCRG signatures were processed as a CCRG set, and correlation analysis of BC subtypes and stages between BC and normal patients was performed via GEPIA2. As shown in Figure 4A, the expression level of the CCRG set was obviously high in BC patients, and the difference was statistically significant (p<0.05). Similarly, analysis of the BC subgroups demonstrated that the CCRG set was significantly highly expressed in the four BC subtypes (luminal A, luminal B, HER2-positive and triple-negative (TNBC)) (p<0.05, Figure 4B). High expression of CCRGs was significantly associated with tumor pathological grade (p<0.05), indicating that a higher grade accompanied higher expression of CCRGs, except for the CCNE2 gene (Figure 4C). In the clinical tumor stage study, the worse prognosis of stage III and IV tumors was associated with higher expression of CCRGs (p<0.05, respectively), except for the CCNE2 gene (Figure 4D). Metastatic event analysis showed that an elevated expression level of CCRGs was significantly related to the metastasis event (p<0.05, Figure 4E).
Analysis of the clinicopathological characteristics of hub genes. (A) The expression level of the CCRG set in BC and normal patients; the red box represents tumor tissues, and the gray box represents normal tissues. (B) The expression level of the CCRG set in four BC subtypes (luminal A, luminal B, HER2-positive and TNBC); the red box represents tumor tissues, and the gray box represents normal tissues. (C) The relation between CCRGs and pathological grade. (D) The relation of CCRGs and tumor stages; n=492, 372, 579, 90 and 10 in stages 0, I, II, III and IV; (E) the relation between the expression level of seven CCRGs and metastatic events (MEs). NS means nonsignificant, *p<0.05, **p<0.01, ***p<0.001 and ****p<0.0001.
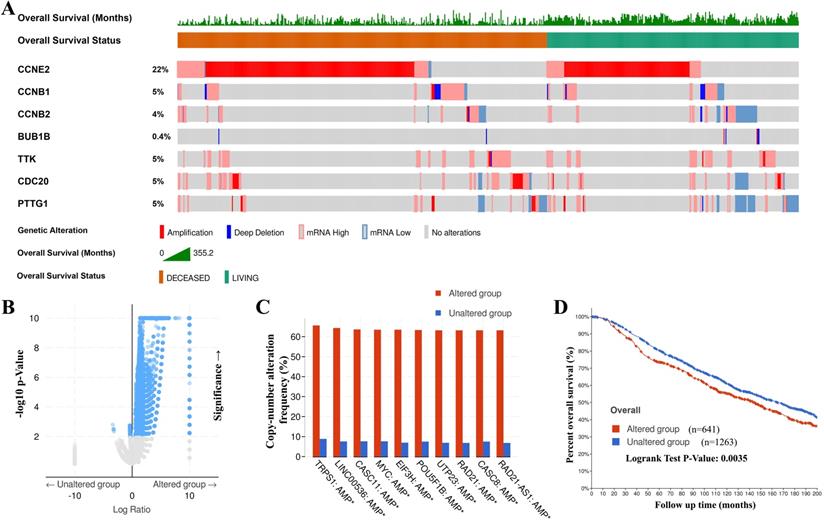
Genetic mutations in CCRGs and their association with copy number alteration frequency and OS of BC patients
The genetic alteration in CCRGs and their association with copy number alteration frequency and OS of BC patients were probed via cBioPortal. As shown in Figure 5A, a high mutation rate of CCRGs was observed in BC patients. In 1904 gene sequences with complete information for BC patients, genetic alterations were found in 641 BC patients, and the mutation rate was 34%. CCNE2 was ranked as the gene with the highest number of genetic alterations, and the mutation rate was 22%. Then, genetic alterations of CCRGs in 641 patients were classified as the altered group, and the remaining 1263 patients were classified as the unaltered group. Further study revealed that more genetic mutations synergistically occurred in the altered group (Figure 5B), and the top 10 genes with the highest alteration frequency were markedly enriched in the altered group (Figure 5C). Kaplan-Meier plots and log-rank tests showed that genetic alterations in CCRGs were associated with shorter OS (Figure 5D, p=0.0035) in BC patients. These results implied that genetic alteration of CCRGs could also significantly affect BC patients' prognosis.
Genetic mutations in CCRGs and their associations with copy number alteration frequency and OS of BC patients (cBioPortal). (A) A high mutation rate (43%, 641/1904) of CCRGs was observed in BC patients. CCNE2 was ranked as the gene with the highest number of genetic alterations, with a 22% mutation rate. (B) Putative DNA copy number alterations showed more genes with copy number alterations clustered in the altered group, and (C) the top 10 genes with the highest alteration frequencies were markedly enriched in the altered group. (D) Genetic alterations in CCRGs were associated with shorter OS in BC patients.
Expression levels of CCRGs in BC cell lines
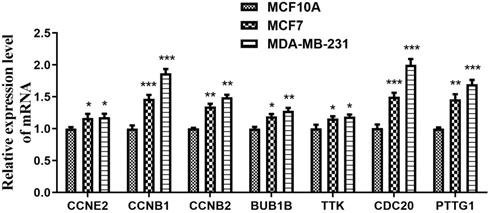
Next, qRT-PCR assays were performed to detect the expression levels of the seven CCRGs in the MCF-10A, MCF-7 and MDA-MB-231 cell lines. The results shown in Figure 6 indicated that CCNE2, CCNB1, CCNB2, BUB1B, TTK, CDC20 and PTTG1 were all highly expressed in BC cell lines (MCF-7 and MDA-MB-231), and there were significant differences (p<0.05) when compared to the MCF-10A cell line.
Expression of seven hub genes in the mammary gland epithelial cell line and BC cell lines. The expression levels of CCNE2, CCNB1, CCNB2, BUB1B, TTK, CDC20 and PTTG1 were significantly higher in the BC cell lines (MCF-7 and MDA-MB-231) than in the MCF-10A cell line. *p<0.05, **p<0.01 and ***p<0.001.
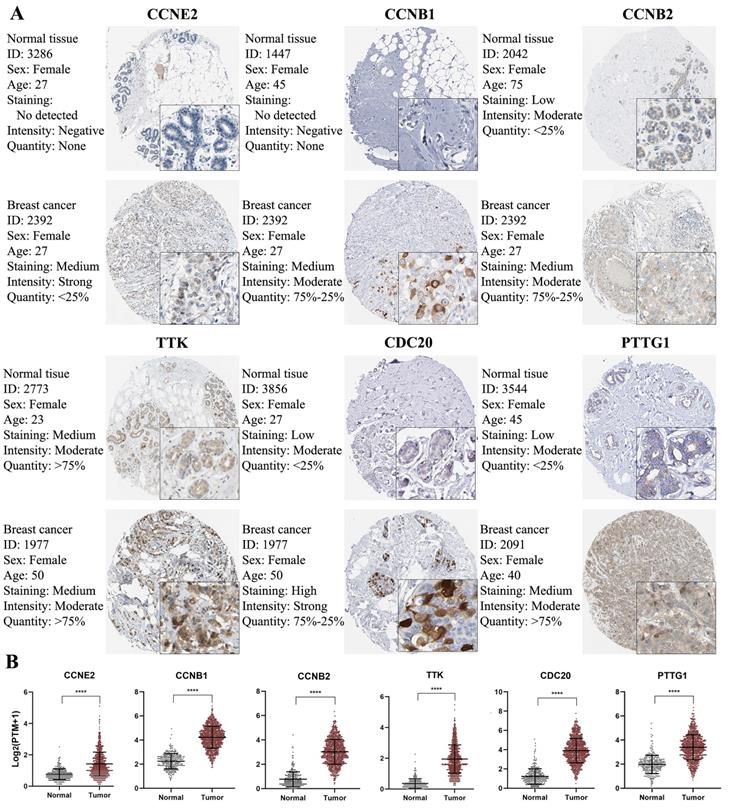
Validation of CCRGs in clinical tissue samples
To further confirm the protein expression of CCRGs in BC, we used IHC to compare the protein expression between normal mammary tissues and BC tissues via the Human Protein Atlas database. The IHC map of CCRGs is shown in Figure 7 and confirmed that CCNE2, CCNB1, CCNB2, TTK, CDC20 and PTTG1 were significantly overexpressed in BC tissues compared with normal mammary tissues (p<0.05); however, BUB1B was not confirmed to be significantly overexpressed in BC tissues due to the lack of data available in the Human Protein Atlas.
IHC analysis and RNA expression analysis of genes with prognostic values. (A) Differentially expressed proteins of genes with prognostic values in normal and BC tissues in the Human Protein Atlas database. (B) RNA expression of genes with prognostic values between normal and BC tissues in the Human Protein Atlas database. Significance was tested by the Student's t‑test (****p < 0.0001; number of normal samples and tumor samples were 290 and 1075, respectively).
TF-miRNA-mRNA regulatory network
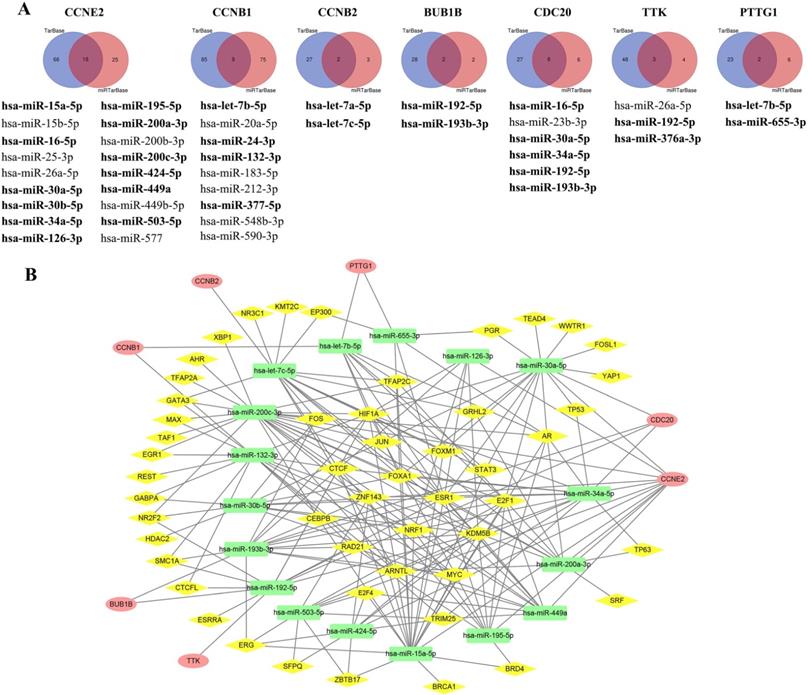
Using the KM plotter, we obtained a total of 34 predicted miRNAs targeted to CCRGs (Figure 8A) and confirmed that the expression of 22 out of 34 miRNAs significantly affected BC patient survival (bold miRNAs in Figure 8A and Supplementary Figure S5). Of these, 17 miRNAs with TF binding sites were used to construct the miRNA-mRNA regulatory network (Figure 8B, Supplementary Table S7). The top ten regulating TFs were KDM5B, ARNTL, E2F1, HIF1A, ESR1, FOXA1, CTCF, NRF1, MYC and AR.
Identification of predicted miRNAs targeted to CCRGs and construction of the TF-miRNA-mRNA regulatory network. (A) Using the intersecting DEGs from TarBase and miRTarBase to select predicted miRNAs and confirm significant expression of miRNAs via the KM plotter (bold miRNAs). (B) Construction of the TF-miRNA-mRNA regulation network via the integration of published multilevel expression data and a bioinformatics computational approach; red oval indicates mRNA of CCRGs, yellow diamond represents TF and green rectangle means miRNA.
Discussion
Numerous studies have revealed that specific genes involved in the cell cycle may play a critical role in the biology of BC and may be of clinical relevance in BC, knowledge which should assist in improving disease prognoses and therapy [23]. In our present work, seven potentially prognostic biomarker genes (CCNB2, CCNB1, CDC20, PTTG1, BUB1B, TTK and CCNE2) that were remarkably enriched in the cell cycle pathway and significantly associated with BC prognosis were screened and evaluated via bioinformatics methods. These genes were confirmed and further analyzed in the OncomineTM platform, indicating that the high expression of seven CCRGs was significantly related to the aggressive biological behavior of tumors, which manifested as a higher level of pathological grade and stage and were more prone to metastasis. Genetic mutation analysis revealed that genetic alteration of CCRGs could also contribute to poor prognosis of BC patients. Verification by qRT-PCR assay in BC cell lines and by IHC in clinical tissue samples further supports the bioinformatics results. Construction of the TF-miRNA-mRNA regulatory network reveals the potential mechanism of CCRGs participating in tumorigenesis and indicates that targeting cell cycle treatment would be a potentially effective choice for BC patients to have a more satisfactory prognosis.
CCNB2, a member of the cyclin family of proteins, which cyclin B1 and cyclin B2, binds to cyclin-dependent kinases (CDKs) and regulates the activity of CDKs and different cyclin functions in specific phases of the cell cycle [24]. Abnormal expression of CCNB2 leads to G2/M checkpoint failure during the cell cycle, which may create gene mutations and carcinogenesis [25]. CCNB1, a highly conserved member of the cyclin family of proteins, is expressed in almost all tissues of the human body [26] and is a key monitoring protein in controlling cell cycle progression from the G2 phase to mitosis by regulating cyclin dependent kinase 1 (CDK1) [27, 28]. Studies have indicated that CCNB1 is also involved in some biological behaviors, such as apoptosis, chemoresistance, and epithelial-mesenchymal transition of tumor cells [29, 30]. CDC20 is an essential cell cycle regulator that drives mitosis from metaphase to anaphase by activating the anaphase-promoting complex [31]. A study revealed that CDC20 mutations blocked cell division and stopped cell cycle progression toward anaphase and chromosome segregation [32]. Some reports have indicated that CDC20 plays an oncogenic role in human tumorigenesis and that genetic ablation of CDC20 blocks in vivo tumorigenesis [33, 34]. PTTG1, also known as securin, is located on chromosome 5 (5q35.1) and is involved in regulating sister chromatid separation and the transition from metaphase to anaphase [35, 36]. In-depth research indicated that PTTG1 acts as an oncogene and plays an important role in promoting cell cycle progression, sustaining chromosomal stability, and modulating transformation in vitro and tumorigenesis in vivo [37-39]. BUB1B is essential for controlling mitotic timing, and its main functions in mitosis include activation, maintenance, and silencing of the spindle assembly checkpoint protein as well as regulating chromosome-spindle attachment [40, 41]. BUB1B was reported to interact with CDC20 directly and activate the anaphase-promoting complex/cyclosome by inhibiting CDC20 activity to ensure proper chromosome segregation by blocking the initiation of anaphase [42]. TTK, also known as monopolar spindle 1 (Mps1), is crucial for the mitotic checkpoint and ensures exact chromosome segregation and proper attachments [43-45]. A higher abundance of mitotic checkpoint genes in cancer cells is markedly associated with increased genome instability and is even correlated with tumor cell spread and cancer metastasis [46, 47]. CCNE2 is a member of the cyclin family of proteins and plays a role in the cell cycle by regulating the G1 to S phase transition to ensure cell division [48]. Upregulated CCNE2 in various cancers was shown to be correlated with tumorigenesis and tumor proliferation, invasion, and migration by affecting tumor cell viability and apoptosis [49].
The cell cycle, also known as the cell-division cycle, is a series of processes that occur in cell progression, resulting in genome duplication and cell division to produce two daughter cells [23]; several checkpoints are required to maintain genomic stability and decrease the possibility of tumorigenesis. Cyclins and CDKs are involved in and run through the whole cell cycle, and their expression levels and effects occur across specific phases [23, 50]. Ignoring the many safeguards and checkpoints of the cell cycle, cancer cells start to exhibit limited proliferation regardless of their aneuploidy and other cellular defects. This phenotype is achieved through alterations of various genetic and epigenetic molecules that hyperactivate or inactivate key components of the cell cycle [51]. Different subtypes of BC display different molecular alterations and dependencies on the cell cycle and its checkpoints [52]; for example, multiple studies have revealed that TNBC tumors are dependent on the spindle assembly checkpoint and showed high expression levels of mitotic checkpoint genes (e.g., TTK and BUB1B) [53, 54]. Given that dysregulation of the cell cycle by aberrant activation of cyclins or other mitotic checkpoint genes is essential for cancer cell proliferation, targeting the cell cycle is a promising anticancer therapeutic strategy [55].
Accumulating evidence has demonstrated that genetic mutations are associated with the occurrence and prognosis of tumors [56-58]. In the present study, it was identified that mutations in CCRGs were associated with the biological features of BC. Mutations in CCRGs were identified to affect OS. Notably, these genes may represent potential novel biomarkers for assessing the prognosis of patients with BC and may be considered potential targets for treating BC.
MiRNAs, a type of noncoding RNA with 21-25 nucleotides, play a critical role in regulating the expression of mRNAs by forming the RNA-induced silencing complex (RISC) to inhibit the translation or degrade the mRNA directly. Seventeen miRNAs targeting CCRGs were identified and may be a part of the mechanism by which CCRGs participate in tumor aggressive BPs. Studies have revealed that miRNA expression is related to transcriptional TFs [59,60]. However, the involvement of several miRNAs and TFs in the transcriptional regulation of mRNA and miRNAs has rarely been reported in BC. Therefore, we firstly constructed a TF-miRNA-mRNA regulatory network in BC, which consists of CCRGs. This study provides new insight into the molecular mechanism of BC.
Abundant studies and our results have demonstrated that seven CCRGs contribute to the aggressive biological behavior of tumors. Some of these CCRGs have been suggested to be significantly related to poor prognosis in BC based on clinical research; however, some of these CCRGs, namely, PTTG1, TTK and CCNE2, have not. In addition, some of these CCRGs have been used as antitumor targets or suggested to be related to therapeutic resistance in BC; however, some of them, including CCNB2, CDC20, PTTG1 and BUB1B, have not yet been determined as antitumor targets or to be related to therapeutic resistance in BC. Furthermore, the expression level of seven CCRG mRNAs was significantly high in BC cell lines via qRT-PCR, suggesting that they might be effective agents for BC treatment. We attempted to reveal the potential mechanism driving the CCRG-induced uncontrolled cell cycle in BC by constructing a TF-mRNA-mRNA regulatory network. However, further in-depth studies are still urgently needed. Our data could theoretically lay the foundation and provide a significant direction for future investigations of these seven CCRGs to investigate the aggressive biological behavior of tumors and target cell cycle treatments in BC.
Conclusion
In summary, this bioinformatics analysis study determined seven CCRGs (CCNB2, CCNB1, CDC20, PTTG1, BUB1B, TTK and CCNE2) with poor prognosis in BC based on tissue-specific microarray datasets. The results indicated that these seven CCRGs all played a part in the aggressive biological behavior of tumors by regulating the cell cycle, and this study is the first to construct a TF-miRNA-mRNA regulatory network for CCRGs in BC. This study provides new insights into the molecular mechanism of BC.
Supplementary Material
Supplementary figures and tables.
Acknowledgements
This research was supported by Natural Science Foundation of Fujian Province, PRC (No.2019J01599).
Author Contributions
Z.-P.H. coordinated the project, explored the clinicopathological characteristics in the OncomineTM platform, performed cell culture, qRT-PCR and statistical analyses, constructed the regulatory network and wrote the manuscript; Q.-L.W. and C.-Y.H. searched, collected and processed the GEO datasets, constructed the PPI network, mapped IHC experiments and investigated the mutation and copy number of genes via cBioPortal; M.-M.L. conducted the Venn diagram and GEPIA analyses; P.-Q.Q., R.-R.L. and X.-L.L. built the volcano map and used DAVID tools for the enrichment analysis; F.-F.C., Q.-H.L. and L.-L.L. performed the survival analysis. C.W. and D.-B.C. designed the experiments and edited the manuscript. All authors contributed valuable discussions and have read and approved the final manuscript.
Competing Interests
The authors have declared that no competing interest exists.
References
1. DeSantis CE, Ma J, Gaudet MM. et al. Breast cancer statistics, 2019. CA Cancer J Clin. 2019;69(6):438-451
2. Bray F, Ferlay J, Soerjomataram I. et al. Global Cancer statistics 2018: GLOBOCAN estimates of incidence and mortality worldwide for 36 cancers in 185mcountries. CA Cancer J Clin. 2018;68(6):394-424
3. Uehara M, Kinoshita T, Hojo T. et al. Long-term prognostic study of carcinoembryonic antigen (CEA) and carbohydrate antigen 15-3 (CA 15-3) in breast cancer. Int J Clin Oncol. 2008;13(5):447-451
4. Vogelstein B, Papadopoulos N, Velculescu VE. et al. Cancer genome landscapes. Science. 2013;339(6127):1546-1558
5. Long X, Deng Z, Li G. et al. Identification of critical genes to predict recurrence and death in colon cancer: integrating gene expression and bioinformatics analysis. Cancer Cell Int. 2018;18:139
6. Gu W, Sun Y, Zheng X. et al. Identification of Gastric Cancer-Related Circular RNA through Microarray Analysis and Bioinformatics Analysis. Biomed Res Int. 2018;2018:2381680
7. Wang J, Yuan L, Liu X. et al. Bioinformatics and functional analyses of key genes and pathways in human clear cell renal cell carcinoma. Oncol Lett. 2018;15(6):9133-9141
8. Mao Y, Shen J, Lu Y. et al. RNA sequencing analyses reveal novel differentially expressed genes and pathways in pancreatic cancer. Oncotarget. 2017;8(26):42537-42547
9. Luo J, Ellis MJ. Microarray data analysis in neoadjuvant biomarker studies in estrogen receptor-positive breast cancer. Breast Cancer Res. 2010;12(4):112
10. Chen C, Li Z, Yang Y. et al. Microarray expression profiling of dysregulated long non-coding RNAs in triple-negative breast cancer. Cancer Biol Ther. 2015;16(6):856-865
11. Makoukji J, Makhoul NJ, Khalil M. et al. Gene expression profiling of breast cancer in Lebanese women. Sci Rep. 2016;6:36639
12. Wang Y, Zhang Y, Huang Q. et al. Integrated bioinformatics analysis reveals key candidate genes and pathways in breast cancer. Mol Med Rep. 2018;17(6):8091-8100
13. Ashburner M, Ball CA, Blake JA. et al. Gene ontology: tool for the unification of biology. The Gene Ontology Consortium. Nat Genet. 2000;25(1):25-29
14. Kanehisa M, Goto S. KEGG: Kyoto encyclopedia of genes and genomes. Nucleic Acids Res. 2000;28(1):27-30
15. Sherman BT, da Huang W, Tan Q. et al. DAVID Knowledgebase: a gene-centered database integrating heterogeneous gene annotation resources to facilitate high-throughput gene functional analysis. BMC Bioinformatics. 2007;8:426
16. Szklarczyk D, Franceschini A, Wyder S. et al. STRING v10: protein-protein interaction networks, integrated over the tree of life. Nucleic Acids Res. 2015;43(Database issue):D447-D452
17. Shannon P, Markiel A, Ozier O. et al. Cytoscape: a software environment for integrated models of biomolecular interaction networks. Genome Res. 2003;13(11):2498-2504
18. Tang Z, Li C, Kang B. et al. GEPIA: a web server for cancer and normal gene expression profiling and interactive analyses. Nucleic Acids Res. 2017;45(W1):W98-W102
19. Szasz AM, Lanczky A, Nagy A. et al. Crossvalidation of survival associated biomarkers in gastric cancer using transcriptomic data of 1,065 patients. Oncotarget. 2016;7(31):49322-49333
20. Rhodes DR, Yu J, Shanker K. et al. Oncomine™: A cancer microarray database and integrated data-mining platform. Neoplasia. 2004;6(1):1-6
21. Gao J, Aksoy BA, Dogrusoz U, Dresdner G, Gross B, Sumer SO, Sun Y, Jacobsen A, Sinha R, Larsson E, Cerami E, Sander C, Schultz N. Integrative analysis of complex cancer genomics and clinical profiles using the cBioPortal. Sci Signal. 2013;6(269):pl1
22. Thu KL, Soria-Bretones I, Mak TW. et al. Targeting the cell cycle in breast cancer: towards the next phase. Cell Cycle. 2018;17(15):1871-1885
23. Tong Z, Cui Q, Wang J. et al. TransmiR v2.0: an updated transcription factor-microRNA regulation database. Nucleic Acids Res. 2019;47(D1):D253-D258
24. Marcos M, Mariano B. Cell cycle, CDKs and cancer: a changing paradigm. Nat Rev Cancer. 2009;9(3):153-66
25. Wu T, Zhang X, Huang X. et al. Regulation of cyclin B2 expression and cell cycle G2/m transition by menin. J Biol Chem. 2010;285(24):18291-18300
26. Miyazaki T, Arai S. Two distinct controls of mitotic cdk1/cyclin B1 activity requisite for cell growth prior to cell division. Cell Cycle. 2007;6(12):1419-1425
27. Pines J, Hunter T. Human cyclin A is adenovirus E1A-associated protein p60 and behaves differently from cyclin B. Nature. 1990;346(6286):760-763
28. Smits VA, Medema RH. Checking out the G(2)/M transition. Biochim Biophys Acta. 2001;1519(1-2):1-12
29. Song Y, Zhao C, Dong L. et al. Overexpression of cyclin B1 in human esophageal squamous cell carcinoma cells induces tumor cell invasive growth and metastasis. Carcinogenesis. 2008;29(2):307-315
30. Matthess Y, Raab M, Sanhaji M. et al. Cdk1/ cyclin B1 controls Fas-mediated apoptosis by regulating caspase-8 activity. Mol Cell Biol. 2010;30(24):5726-5740
31. Weinstein J, Jacobsen FW, Hsu-Chen J. et al. A novel mammalian protein, p55CDC, present in dividing cells is associated with protein kinase activity and has homology to the Saccharomyces cerevisiae cell division cycle proteins Cdc20 and Cdc4. Mol Cell Biol. 1994;14(5):3350-3363
32. Hartwell LH, Culotti J, Reid B. Genetic control of the cell-division cycle in yeast. I. Detection of mutants. Proc Natl Acad Sci USA. 1970;66(2):352-359
33. Kidokoro T, Tanikawa C, Furukawa Y. et al. CDC20, a potential cancer therapeutic target, is negatively regulated by p53. Oncogene. 2008;27(11):1562-1571
34. Manchado E, Guillamot M, de Carcer G. et al. Targeting mitotic exit leads to tumor regression in vivo: Modulation by Cdk1, Mastl, and the PP2A/B55alpha, delta phosphatase. Cancer Cell. 2010;18(6):641-654
35. Pei L, Melmed S. Isolation and characterization of a pituitary tumor transforming gene (PTTG). Mol Endocrinol. 1997;11(4):433-441
36. Yu R, Ren SG, Horwitz GA. et al. Pituitary tumor transforming gene (pttg) regulates placental jeg-3 cell division and survival: Evidence from live cell imaging. Mol Endocrinol. 2000;14(8):1137-1146
37. Caporali S, Alvino E, Levati L. et al. Down-regulation of the pttg1 proto-oncogene contributes to the melanoma suppressive effects of the cyclin-dependent kinase inhibitor pha-848125. Biochem Pharmacol. 2012;84(5):598-611
38. Vlotides G, Eigler T, Melmed S. Pituitary tumor-transforming gene: Physiology and implications for tumorigenesis. Endocr Rev. 2007;28(2):165-186
39. Tfelt-Hansen J, Kanuparthi D, Chattopadhyay N. The emerging role of pituitary tumor transforming gene in tumorigenesis. Clin Med Res. 2006;4(2):130-137
40. Bolanos-Garcia VM, Lischetti T, Matak-Vinkovic D. et al. Structure of a Blinkin-BUBR1 complex reveals an interaction crucial for kinetochore-mitotic checkpoint regulation via an unanticipated binding site. Structure. 2011;19(11):1691-700
41. Chao WC, Kulkarni K, Zhang Z. et al. Structure of the mitotic checkpoint complex. Nature. 2012;484(7393):208-213
42. Tian W, Li B, Warrington R. et al. Structural analysis of human Cdc20 supports multisite degron recognition by APC/C. Proc Natl Acad Sci USA. 2012;109(45):18419-18424
43. Jelluma N, Brenkman AB, van den Broek NJ. et al. Mps1 phosphorylates Borealin to control Aurora B activity and chromosome alignment. Cell. 2008;132(2):233-246
44. Hiruma Y, Sacristan C, Pachis ST. et al. CELL DIVISION CYCLE. Competition between MPS1 and microtubules at kinetochores regulates spindle checkpoint signaling. Science. 2015;348(6240):1264-1267
45. Ji Z, Gao H, Jia L. et al. A sequential multi-target Mps1 phosphorylation cascade promotes spindle checkpoint signaling. Elife. 2017;6:e22513
46. Salvatore G, Nappi TC, Salerno P. et al. A cell proliferation and chromosomal instability signature in anaplastic thyroid carcinoma. Cancer Res. 2007;67(21):10148-10158
47. Hudler P, Britovsek NK, Grazio SF. et al. Association between polymorphisms in segregation genes BUB1B and TTK and gastric cancer risk. Radiol Oncol. 2016;50(3):297-307
48. Caldon CE, Sergio CM, Kang J. et al. Cyclin E2 overexpression is associated with endocrine resistance but not insensitivity to CDK2 inhibition in human breast cancer cells. Mol Cancer Ther. 2012;11(7):1488-1499
49. Chen D, Guo W, Qiu Z. et al. MicroRNA-30d-5p inhibits tumour cell proliferation and motility by directly targeting CCNE2 in non-small cell lung cancer. Cancer Lett. 2015;362(2):208-217
50. Malumbres M. Cyclin-dependent kinases. Genome Biol. 2014;15(6):122
51. Thu KL, Soria-Bretones I, Mak TW. et al. Targeting the cell cycle in breast cancer: towards the next phase. Cell Cycle. 2018;17(15):1871-1885
52. Cancer Genome Atlas Network. Comprehensive molecular portraits of human breast tumours. Nature. 2012;490(7418):61-70
53. Daniel J, Coulter J, Woo J-H. et al. High levels of the Mps1 checkpoint protein are protective of aneuploidy in breast cancer cells. Proc Natl Acad Sci USA. 2011;108(13):5384-5389
54. Patel N, Weekes D, Drosopoulos K. et al. Integrated genomics and functional validation identifies malignant cell specific dependencies in triple negative breast cancer. Nat Commun. 2018;9(1):1044
55. Dominguez-Brauer C, Thu KL, Mason JM. et al. Targeting mitosis in cancer: emerging strategies. Mol Cell. 2015;60(4):524-536
56. Bahrami A, Hesari A, Khazaei M. et al. The therapeutic potential of targeting the BRAF mutation in patients with colorectal cancer. J Cell Physiol. 2018;233(3):2162-2169
57. Vietsch EE, Graham GT, McCutcheon JN. et al. Circulating cell-free DNA mutation patterns in early and late stage colon and pancreatic cancer. Cancer Genet. 2017;218-219:39-50
58. Zhang K, Zhou J, Zhu X. et al. Germline mutations of PALB2 gene in a sequential series of Chinese patients with breast cancer. Breast Cancer Res Treat. 2017;166(3):865-873
59. Martinez NJ, Ow MC, Barrasa MI. et al. A C. elegans genome-scale microRNA network contains composite feedback motifs with high flux capacity. Genes Dev. 2008;22(18):2535-2549
60. Martinez N J, Walhout A J M. The interplay between transcription factors and microRNAs in genome-scale regulatory networks. Bioessays. 2009;31(4):435-445
Author contact
![]() Corresponding authors: Dr. Wang Chuan, Department of Breast Surgery, The Affiliated Union Hospital of Fujian Medical University, Fuzhou, Fujian Province, 350001, P. R. China. E-mail: chuanwang1968com; Dr. Chen Debo, Department of Breast Surgery, Affiliated Quanzhou First Hospital of Fujian Medical University, Quanzhou, Fujian Province, 362000, P. R. China. E-mail: deboqzcom.
Corresponding authors: Dr. Wang Chuan, Department of Breast Surgery, The Affiliated Union Hospital of Fujian Medical University, Fuzhou, Fujian Province, 350001, P. R. China. E-mail: chuanwang1968com; Dr. Chen Debo, Department of Breast Surgery, Affiliated Quanzhou First Hospital of Fujian Medical University, Quanzhou, Fujian Province, 362000, P. R. China. E-mail: deboqzcom.