Impact Factor ISSN: 1837-9664

 Global reach, higher impact
J Cancer 2021; 12(2):562-570. doi:10.7150/jca.45899 This issue Cite
Research Paper
18F-FDG PET/CT Scans Can Identify Sub-Groups of NSCLC Patients with High Glucose Uptake in the Majority of Their Tumor Lesions
Anne M. Hendriks1, Adrienne H. Brouwers2, Panagiotis Giannopoulos1, Joop D. Lefrandt3, Wim Timens4, Harry J.M. Groen5, Geertruida H. de Bock6, Mathilde Jalving1 ![]()
1. University Medical Center Groningen, University of Groningen, Hanzeplein 1, 9713 GZ, Groningen, the Netherlands. Department of Medical Oncology.
2. University Medical Center Groningen, University of Groningen, Hanzeplein 1, 9713 GZ, Groningen, the Netherlands. Department of Nuclear Medicine and Molecular Imaging.
3. University Medical Center Groningen, University of Groningen, Hanzeplein 1, 9713 GZ, Groningen, the Netherlands. Department of Internal Medicine.
4. University Medical Center Groningen, University of Groningen, Hanzeplein 1, 9713 GZ, Groningen, the Netherlands. Department of Pathology.
5. University Medical Center Groningen, University of Groningen, Hanzeplein 1, 9713 GZ, Groningen, the Netherlands. Department of Pulmonary Diseases.
6. University Medical Center Groningen, University of Groningen, Hanzeplein 1, 9713 GZ, Groningen, the Netherlands. Department of Epidemiology.
Received 2020-3-11; Accepted 2020-8-9; Published 2021-1-1
Abstract
Background: Reprogrammed glucose metabolism is a hallmark of cancer making it an attractive therapeutic target, especially in cancers with high glucose uptake such as non-small cell lung cancer (NSCLC). Tools to select patients with high glucose uptake in the majority of tumor lesions are essential in the development of anti-cancer drugs targeting glucose metabolism. Type 2 diabetes mellitus (T2DM) patients may have tumors highly dependent on glucose uptake. Surprisingly, this has not been systematically studied. Therefore, we aimed to determine which patient and tumor characteristics, including concurrent T2DM, are related to high glucose uptake in the majority of tumor lesions in NSCLC patients as measured by 2-deoxy-2-[fluorine-18]fluoro-D-glucose (18F-FDG) positron emission tomography (PET)/computed tomography (CT) scans.
Methods: Routine primary diagnostic 18F-FDG PET/CT scans of consecutive NSCLC patients were included. Mean standardized uptake value (SUVmean) of 18F-FDG was determined for all evaluable tumor lesions and corrected for serum glucose levels according to the European Association of Nuclear Medicine Research Ltd guidelines. Patient characteristics potentially determining degree of tumor lesion glucose uptake in the majority of tumor lesions per patient were investigated.
Results: The cohort consisted of 102 patients, 28 with T2DM and 74 without T2DM. The median SUVmean per patient ranged from 0.8 to 35.2 (median 4.2). T2DM patients had higher median glucose uptake in individual tumor lesions and per patient compared to non-diabetic NSCLC patients (SUVmean 4.3 vs 2.8, P < 0.001 and SUVmean 5.4 vs 3.7, P = 0.009, respectively). However, in multivariable analysis, high tumor lesion glucose uptake was only independently determined by number of tumor lesions ≥1 mL per patient (odds ratio 0.8, 95% confidence interval 0.7-0.9).
Conclusions: 18F-FDG PET/CT scans can identify sub-groups of NSCLC patients with high glucose uptake in the majority of their tumor lesions. T2DM patients had higher tumor lesion glucose uptake than non-diabetic patients. However, this was not independent of other factors such as the histological subtype and number of tumor lesions per patient.
Keywords: 18F-FDG PET/CT, non-small cell lung cancer, glycolysis, type 2 diabetes mellitus
Introduction
Reprogrammed energy metabolism is a hallmark of cancer, of which the most well-known example is the so-called Warburg effect or aerobic glycolysis describing high glycolysis rates even in the presence of sufficient oxygen and functional mitochondria [1]. This phenomenon is essential for production of biomass and maintaining redox balance which benefits cancer cell growth and division [1]. Therefore, glycolysis is a potentially attractive therapeutic target, particularly in tumor types with especially high glucose uptake such as non-small cell lung cancer (NSCLC). Targeting glycolysis can, at least in preclinical models, reduce cancer cell growth and enhance effectiveness of chemotherapy, immunotherapy and radiation therapy [2,3]. Drugs targeting various glycolytic enzymes are in clinical development, however, no clear efficacy signals have emerged and toxicity is a problem at higher doses [4]. Clinical trials have, so far, not been enriched for patients with tumors highly dependent on glucose uptake and have excluded patients with concurrent type 2 diabetes mellitus (T2DM) [5-11]. T2DM is characterized by insulin resistance of liver, muscle and fat tissue resulting in hyperinsulinemia and hyperglycemia, which are both associated with increased cancer risk and cancer-related mortality [12,13]. Insulin resistance does not occur in epithelial cells, of which many types of cancer are derived, resulting in relatively high insulin and glucose exposure of cancer cells in T2DM patients [12,13]. Therefore, patients with T2DM may be especially likely to have tumors highly dependent on glycolysis.
There is an unmet need for methods to enrich study populations for patients with highly glucose dependent tumors. An obvious candidate, which has not been explored for use as a predictive biomarker in this manner, is the 2-deoxy-2-[fluorine-18]fluoro-D-glucose (18F-FDG) positron emission tomography (PET)/computed tomography (CT) scan. 18F-FDG is phosphorylated to 18F-FDG-6-phosphate but cannot be further metabolized and therefore accumulates in cells. In this way, 18F accumulation reflects the amount of glucose entering the cell and glucose phosphorylation, and can therefore be considered as an indirect measure of the rate of glycolysis.
18F-FDG PET/CT scans are part of the routine diagnostic work-up in NSCLC [14-16]. In NSCLC patients, high 18F-FDG uptake rates correlate with increased immunohistochemical expression of the glucose transporter 1 (GLUT-1) and upregulation of the rate-determining glycolytic enzyme hexokinase 1 [17]. Furthermore, high tumor lesion glucose uptake as measured using 18F-FDG-based parameters, such as tumor lesion 18F-FDG uptake and metabolic tumor volume (MTV), are associated with worse prognosis in NSCLC patients [17-19]. Patients with NSCLC have an increased risk of concurrent T2DM due to overlapping risk factors of these two diseases [20-22]. Therefore, in NSCLC patients, we retrospectively studied whether 18F-FDG PET/CT scans can be used to identify patients with high 18F-FDG uptake in the majority of tumor lesions. Furthermore, we used 18F-FDG PET/CT scans to investigate whether specific characteristics of NSCLC patients, including concurrent T2DM, relate to high glucose uptake in the majority of tumor lesions per patient.
Methods
Study design and patient selection
This was a cohort study including a consecutive series of patients diagnosed with NSCLC. The main outcome was 18F-FDG tumor lesion uptake. The main variables considered were diabetic state, age, sex, stage of disease, histological subtypes, number of tumor lesions and MTV.
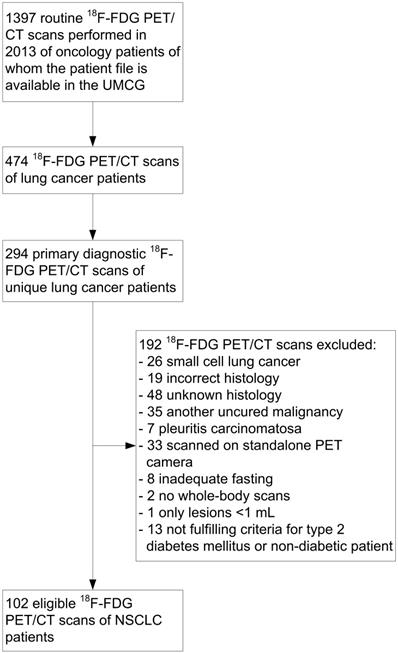
All 18F-FDG PET/CT scans performed at the University Medical Center Groningen in NSCLC patients in 2013 were selected (Fig. 1). The routine primary diagnostic scans of these patients were identified and included. Primary diagnostic 18F-FDG PET/CT scans were defined as scans used for the pre-treatment diagnosis of NSCLC or for the detection of recurrence at least 1 year after the last anti-cancer therapy. Only 18F-FDG PET/CT scans of patients with a pathologically confirmed diagnosis of NSCLC with adenocarcinoma, squamous cell carcinoma, adenosquamous carcinoma or large cell carcinoma histology were included. Patients diagnosed with another uncured malignancy were excluded. Patients with pleuritis carcinomatosa or only low-volume tumor lesions (<1 mL) were also excluded, since accurate tumor delineation on a PET image is not possible in these cases.
CONSORT diagram of 2-deoxy-2-[fluorine-18]fluoro-D-glucose (18F-FDG) positron emission tomography (PET)/computed tomography (CT) scans in non-small cell lung cancer (NSCLC) patients. UMCG: University Medical Center Groningen.
Patients previously diagnosed with T2DM, on oral anti-diabetic treatment or with fasting serum glucose levels ≥7.0 mmol/L were defined as T2DM patients [23]. Patients with a fasting serum glucose level ≤6.4 mmol/L, not previously diagnosed with diabetes and not on any diabetes medication were defined as non-diabetic. The cohort did not contain type 1 diabetes mellitus (T1DM) patients.
Data obtained from patient records and scans were anonymously stored using study-specific patient codes in a password-protected database. Institutional review board approval for this study was obtained and the need for informed consent was waived (Medical Ethical Committee number: 2018/508).
PET/CT imaging technique
18F-FDG PET/CT scanning was performed according to the European Association of Nuclear Medicine Research Ltd (EARL) guidelines version 1.0 [24] and additional local protocols, most of which have become standard of care with the EARL guidelines version 2.0 [25]. 18F-FDG PET/CT scans were performed using a mCT scanner (Siemens/CTI, Knoxville, TN). A protocol with 3 dimensional mode, 1-3 min emission time per bed position dependent on patient weight, 2 mm spatial resolution and a non-contrast enhanced low dose CT scan for attenuation correction were used. Reconstruction was performed using a Gaussian filter of 6.5 mm in full width at half maximum and iterative reconstruction methods with 3 iterations and 21 subsets.
The non-diabetic patients fasted for at least 6 h before intravenous administration of 18F-FDG. Known insulin-independent T2DM patients complied with the standard fasting protocol and continued oral anti-diabetic drugs. Known insulin-dependent T2DM patients had a meal and their normal insulin dose at least 4 h before 18F-FDG administration and then fasted until the end of the procedure.
Before injecting 18F-FDG, the fasting serum glucose level was measured by calibrated venous blood sampling (Accu-Chek Inform II, Roche, Basel, Switzerland). These fasting serum glucose levels and the patient records were available for all patients. Scans were rescheduled in cases when the patient's fasting serum glucose level was >11 mmol/L. Patients were injected with 3 MBq/kg 18F-FDG 60 min before scanning.
18F-FDG uptake measurements
A nuclear medicine physician assessed all scans for routine care at the time they were performed. All 18F-FDG avid tumor lesions were reassessed by three investigators (AMH, AHB, PG). A region of interest (ROI) was drawn around each visible 18F-FDG avid tumor lesion. In case of doubt whether an 18F-FDG avid tumor lesion was malignant, the images were reviewed together with the corresponding CT images. Based on the threshold method, the tumor lesion's 18F-FDG uptake was determined based on all voxels with an uptake higher than 40% of the maximum measured standardized uptake value (SUVmax) in the ROI [26]. The mean of all SUVs measured in these voxels (SUVmean) was used as the parameter for tumor lesion glucose uptake per ROI. SUVmean was chosen since it represents the overall uptake value in the measured area, instead of SUVmax which represents just one voxel [27]. SUVmean values were corrected for patients' serum glucose levels according to the EARL guidelines (SUVcorrected = SUVmeasured × (fasting serum glucose level (mmol/L) / 5)) [24,25]. These corrected SUVmean values were used for all analyses unless indicated otherwise. The volume of the area on the PET image in which the SUVmean was determined was defined as the MTV [28].
The analysis of glucose uptake was only performed for tumor lesions with a MTV ≥1 mL to avoid underestimation of SUVs in smaller tumor lesions due to partial volume effects (PVE). PVE refers to factors influencing the measured amount of radioactivity within a volume of interest (e.g. tumor), such as the spatial resolution of the imaging system, the size and shape of the tumor lesions, and reconstruction procedures followed after acquisition of the images [29]. The cut-off value of 1 mL was chosen based on the resolution of the camera used. For determining the sum of the MTV measured in all tumor lesions per patient (MTVpatient), tumor lesions with a MTV <1 mL were taken into account to minimize underestimation of the total volume. The range of all measured SUVmean values in a patient was used as a measure for intra-patient heterogeneity and was defined as the highest minus the lowest SUVmean value measured in all tumor lesions per patient. Since no studies have been performed to determine cut-off values for high 18F-FDG uptake using SUVmean, cut-off values were chosen based on published SUVmax data. High tumor glucose uptake was defined as a SUVmean >5 and very high glucose uptake as a SUVmean >8 [30-34].
18F-FDG uptake in the ROIs and the associated volumes were calculated using AMIDE software, which provides raw non-smoothed data, as described in the supplemental methods.
Statistical analysis
The cohort was described, overall and stratified by T2DM status. The Mann-Whitney U test was used to compare differences between the lowest and highest SUVmean value per patient, differences in number of tumor lesions, differences in fasting serum glucose levels and to compare median glucose uptake in individual tumor lesions and per patient among subgroups of patients. Subsequently, we evaluated the association between patient characteristics and high tumor lesion glucose uptake. For analyses including histology, only histological subtypes that occur in >5% of patients were included. Diabetic state was evaluated as the main factor. The effects of age, sex, stage of disease, histology, number of tumor lesions ≥1 mL per patient, and MTVpatient were also evaluated by univariable and multivariable logistic regression analyses using the enter method. High tumor lesion glucose uptake (SUVmean >5) in at least half of the tumor lesions per patient was used as dependent variable for these analyses to estimate odds ratios (ORs) and 95% confidence intervals (95% CI). A cut-off of at least half of the tumor lesions per patient was chosen because it is clinically relevant to be able to select patients of whom the majority of tumor lesions may be sensitive to anti-glycolytic treatment. The median MTVpatient of patients included in logistic regression analyses was used to categorize MTVpatient to determine ORs. P values <0.05 were considered statistically significant. IBM SPSS Statistics 23 was used for all statistical analyses.
Results
18F-FDG tumor lesion uptake is heterogeneous in the total NSCLC cohort
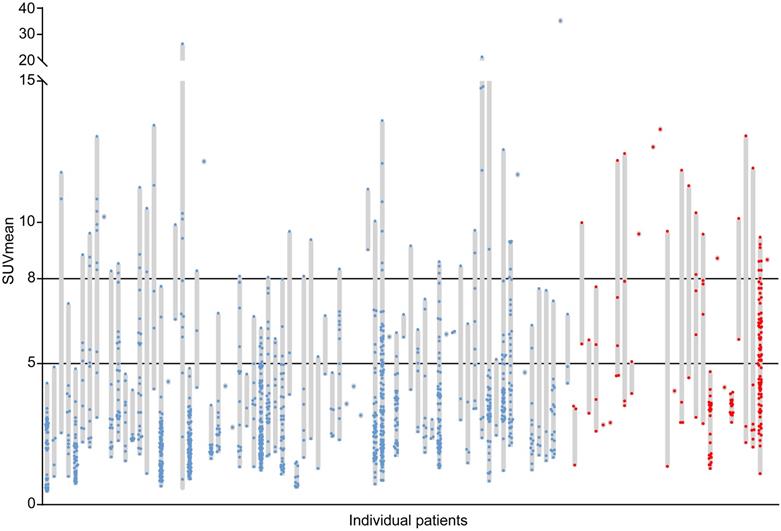
The cohort consisted of 102 NSCLC patients. Table 1 shows the patient and tumor characteristics. The relatively high incidence of T2DM in this cohort reflects the high incidence of T2DM in the Northern Netherlands and the overlapping behavioral risk factors for T2DM and NSCLC. A large inter-patient heterogeneity in tumor lesion glucose uptake was found with median SUVmean values per patient ranging from 0.8 to 35.2 (median 4.2) (Fig. 2). In addition, a large intra-patient heterogeneity in tumor lesion glucose uptake was found, with differences between the lowest and highest SUVmean value per patient ranging from 0.1 to 25.5 (median 5.8) in patients with more than one tumor lesion (N = 79) (Fig. 2). In 42% of patients high (SUVmean >5) and in 22% very high (SUVmean >8) glucose uptake in at least half of the tumor lesions was found (Fig. 2).
Tumor and patient characteristics of the total non-small cell lung cancer (NSCLC) patients' cohort and stratified for the non-diabetic and type 2 diabetes mellitus (T2DM) patients
| Characteristics | All patients | Non-diabetic | T2DM |
|---|---|---|---|
| Patients, N | 102 | 74 | 28 |
| Age in years, median (range) | 65 (32-89) | 63 (32-89) | 67 (48-80) |
| Male, N (%) | 58 (57%) | 35 (47%) | 23 (82%) |
| Fasting serum glucose level (mmol/L), median (range) | 5.6 (3.1-10.2) | 5.3 (3.9-6.4) | 7.3 (3.1-10.2) |
| Stage of disease, N (%) | |||
| 1 | 15 (15%) | 8 (11%) | 7 (25%) |
| 2 | 7 (7%) | 5 (7%) | 2 (7%) |
| 3 | 34 (33%) | 19 (25%) | 15 (54%) |
| 4 | 46 (45%) | 42 (57%) | 4 (14%) |
| Histology, N (%) | |||
| Adenocarcinoma | 60 (59%) | 49 (66%) | 11 (39%) |
| Squamous cell carcinoma | 36 (35%) | 22 (30%) | 14 (50%) |
| Adenosquamous carcinoma | 3 (3%) | 1 (1%) | 2 (7%) |
| Large cell carcinoma | 3 (3%) | 2 (3%) | 1 (4%) |
| Tumor lesions per patient, median (range) | |||
| All tumor lesions | 4.5 (1-145) | 7 (1-145) | 2 (1-94) |
| Tumor lesions ≥ 1 mL | 4 (1-116) | 6.5 (1-116) | 2 (1-89) |
| Total tumor lesions, N | |||
| All tumor lesions | 1550 | 1354 | 196 |
| Tumors ≥ 1 mL | 1394 | 1205 | 189 |
| MTV per tumor lesion (mL), median (range) | 2.9 (1.0-588.0) | 2.8 (1.0-588.0) | 4.4 (1.1-203.4) |
| MTV per patient (mL), median (range) | 72.3 (1.7-1666.4) | 79.8 (1.7-1666.4) | 34.6 (2.0-743.6) |
MTV, metabolic tumor volume; MTV per patient is the sum of the MTV measured in all tumor lesions per patient; N, number.
Inter-patient and intra-patient heterogeneity in tumor lesion glucose uptake. Each grey bar represents an individual patient. The length of the grey bars represents the range of the mean standardized uptake values (SUVmean) measured in all tumor lesions (dots) with a volume ≥1 mL visible on the primary diagnostic 18F-FDG PET/CT scans of the patients. Blue dots represent tumor lesions of non-diabetic patients with non-small cell lung cancer (N=74, Nlesions=1205). Red dots represent tumor lesions of non-small cell lung cancer patients with concurrent type 2 diabetes mellitus (N=28, Nlesions=189).
T2DM patients had higher 18F-FDG tumor lesion uptake than non-diabetic patients
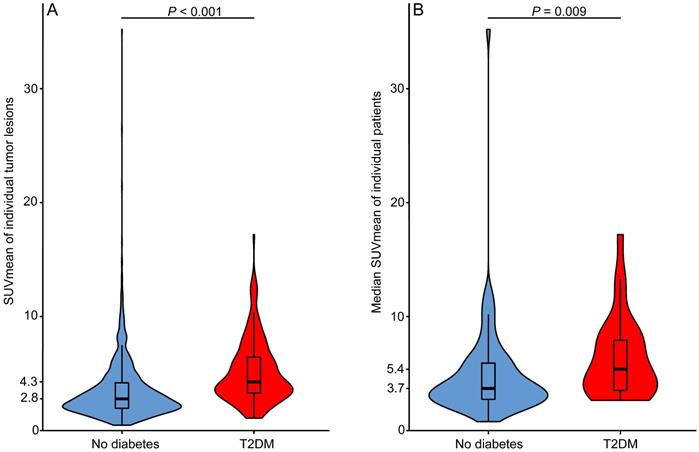
Table 1 shows the tumor and patient characteristics stratified for T2DM and non-diabetic patients. T2DM patients had higher fasting serum glucose levels than non-diabetic NSCLC patients (P < 0.001). In patients with more than one tumor lesion, the difference between the lowest and highest SUVmean value per patient ranged in T2DM patients (N = 18) from 1.1 to 10.9 (median 6.8) and in non-diabetic patients (N = 61) from 0.1 to 25.5 (median 5.0) (P = 0.615). The median glucose uptake was higher in tumor lesions of NSCLC patients with T2DM than in tumor lesions of non-diabetic NSCLC patients (SUVmean 4.3 vs. 2.8, P < 0.001) (Fig. 3A). Median tumor lesion glucose uptake per patient was also higher for T2DM than for non-diabetic patients (SUVmean 5.4 vs 3.7, P = 0.009) (Fig. 3B). Univariable logistic regression showed that T2DM patients are more likely to have high tumor lesion glucose uptake (SUVmean >5) in at least half of the tumor lesions than non-diabetic NSCLC patients (OR 2.9, 95% CI 1.1-7.5) (Table 2). Six patients were on insulin treatment, the distribution of 18F-FDG tumor lesion uptake in these patients did not differ from the distribution in the T2DM patients not on insulin treatment (Fig. S1).
Median tumor lesion glucose uptake is higher in type 2 diabetes mellitus (T2DM) than in non-diabetic patients. A) Violin plot of all mean standardized uptake values (SUVmean) measured in all tumor lesions with a volume ≥1 mL visible on the primary diagnostic 18F-FDG PET/CT scans of non-diabetic (Nlesions=1205) and type 2 diabetes mellitus (T2DM) (Nlesions=189) non-small cell lung cancer (NSCLC) patients. B) Violin plot of the median SUVmean value per patient plotted for non-diabetic (N=74) and T2DM (N=28) NSCLC patients. Box plots showing the median (horizontal bar), the first and third quartile.
Univariable and multivariable associations between patient characteristics and high tumor lesion glucose uptake (SUVmean >5) in at least half of the tumor lesions per patient
| Variable | Reference variable | Univariable analysis | Multivariable analysis | ||
|---|---|---|---|---|---|
| OR (95% CI) | P-value | OR (95% CI) | P-value | ||
| T2DM patient | Non-diabetic patient | 2.9 (1.1 - 7.5) | 0.025 | 1.3 (0.4 - 3.7) | 0.661 |
| Age (years) | 1.0 (1.0 - 1.1) | 0.056 | |||
| Male | Female | 1.6 (0.7 - 3.7) | 0.266 | ||
| Stage 3-4 disease | Stage 1-2 disease | 0.7 (0.3 - 1.8) | 0.462 | ||
| Squamous cell carcinoma | Adenocarcinoma | 4.0 (1.7 - 9.5) | 0.002 | 2.1 (0.8 - 5.6) | 0.128 |
| Number of tumor lesions ≥ 1 mL per patient | 0.8 (0.7 - 0.9) | 0.001 | 0.8 (0.7 - 0.9) | 0.004 | |
| MTVpatient > median | MTVpatient < median | 0.5 (0.2 - 1.1) | 0.091 | ||
Only patients with adenocarcinoma and squamous cell carcinoma histology were included in this analysis (N=96). 95% CI, 95% confidence interval; MTVpatient, sum of the metabolic tumor volume measured in all tumor lesions per patient; T2DM, type 2 diabetes mellitus; OR, odds ratio.
T2DM is not the main determinant of increased 18F-FDG uptake in the majority of tumor lesions
To determine whether T2DM was independently associated with high tumor lesion glucose uptake, univariable logistic regression was used to determine the OR of other potentially relevant patient characteristics on high tumor lesion glucose uptake. Squamous cell carcinoma histology (OR 4.0, 95% CI 1.7-9.5) and low number of tumor lesions ≥1 mL per patient (OR 0.8, 95% CI 0.7-0.9) were shown to be also associated with high tumor lesion glucose uptake (SUVmean >5) in at least half of the tumor lesions (Table 2). The variables that were significantly associated with high tumor lesion glucose uptake in univariable analyses were included in multivariable logistic regression analysis. Based on this analysis, low number of tumor lesions ≥1 mL per patient was shown to be independently associated with high 18F-FDG uptake in the majority of tumor lesions (OR 0.8, 95% CI 0.7-0.9) (Table 2).
Discussion
In this study cohort, a large inter-patient and intra-patient heterogeneity in tumor lesion glucose uptake was found in NSCLC patients. 18F-FDG PET/CT scans could identify sub-groups of NSCLC patients with high (SUVmean >5) glucose uptake in the majority (≥ 50%) of their tumor lesions. T2DM NSCLC patients had higher median glucose uptake in individual tumor lesions and per patient compared to non-diabetic NSCLC patients. However, this was not independent of other factors such as the histological subtype and number of tumor lesions per patient.
The relationship between mean 18F-FDG tumor lesion uptake and concurrent T2DM has not previously been systematically studied in well-selected metastatic lung cancer patients with and without T2DM. In other studies comparing diabetic and non-diabetic cancer patients, 18F-FDG PET/CT scans were not performed according to EARL standards for glucose correction, performed at unclear time points during anti-tumor therapy and used SUVmax or SUVpeak instead of SUVmean to determine tumor lesion 18F-FDG uptake [35-40]. In addition, four of these studies only measured 18F-FDG uptake in one tumor lesion per patient and only one study clearly defined whether only T2DM or also T1DM patients were included [35-40]. Two of the previous studies were conducted in lung cancer patients, one reporting reduced tumor lesion glucose uptake in diabetic patients [35] and one reporting no difference between diabetic and non-diabetic patients [37]. However, both of these studies did not perform multivariable analysis, one of these studies included only five diabetic patients and various histological subtypes including small cell lung cancer [35], whereas the other study did not specify which histological subtypes were included [37]. The other four previous studies were conducted in various cancer types reporting both reduced and equal tumor lesion glucose uptake in diabetic compared to non-diabetic patients [36,38-40]. In vitro data support the hypothesis that tumor metabolism differs between T2DM and non-diabetic patients. Hyperglycemia and hyperinsulinemia, both characteristics of T2DM, have been shown to promote cancer cell proliferation, survival and migration in preclinical models [12,13]. Expression of insulin-like growth factor 1 receptor, which stimulates glucose uptake, is higher in NSCLC tumors from diabetic patients than in tumors from non-diabetic patients [41]. Evidence exists that increased cellular glucose uptake may increase the sensitivity of drugs targeting glycolysis. Stimulation of glucose uptake in colorectal cancer cell lines by insulin enhanced cytotoxicity induced by the glycolysis inhibitor 2-deoxyglucose (2-DG) [42]. Furthermore, 2-DG treatment enhanced effects of radiation therapy in highly versus normally glycolytic cancer cell lines [43].
T2DM, squamous cell carcinoma histology and low number of tumor lesions ≥1 mL per patient were associated with high tumor lesion glucose uptake in the majority of tumor lesions per patient in univariable analyses. However, this was not the case in multivariable analysis where only low number of tumor lesions remained significant. Since patients with a higher number of tumor lesions had a higher frequency of smaller tumor lesions (Figure S2), the association between number of tumor lesions and 18F-FDG tumor lesion uptake may be explained by PVE. In smaller lesions there is greater risk of SUV underestimation due to PVE [29]. In a phantom study according to EARL guidelines and the delineation method we used, SUVmean values are underestimated by at least 40% in a sphere of 1.15 mL, 27% in a sphere of 2.57 mL and 11% in a sphere of 26.53 mL [44,45]. The median number of tumor lesions was lower in T2DM than in non-diabetic patients and also lower in patients with squamous cell carcinoma than in those with adenocarcinoma histology (Figure S3). The lower number of tumor lesions in T2DM patients may be explained by detection bias [46]. Regular T2DM-related medical check-ups could lead to diagnosis of cancer at an earlier time point with lower numbers of tumor lesions, as has been previously reported for colorectal cancer [47]. Higher tumor lesion glucose uptake in squamous cell carcinoma as compared to adenocarcinoma histology has been previously reported and may be caused by high GLUT-1 expression [30,48-50]. More frequent occurrence of squamous cell carcinoma compared to adenocarcinoma histology in T2DM compared to non-diabetic NSCLC patients, as we demonstrated, has not been described previously. This result is in line with data showing that tobacco smokers with NSCLC are more likely to have squamous histology, and that life-style habits of smokers, such as dietary habits, put them at risk for T2DM [21,51].
We show a large inter-patient and intra-patient heterogeneity in tumor lesion glucose uptake in NSCLC patients measured as SUVmean, representing the average amount of 18F-FDG uptake in a tumor lesion. Previous smaller studies have only investigated the maximum 18F-FDG uptake measured in NSCLC tumor lesions, which gives a less accurate estimate of the actual glucose uptake in the entire tumor lesion [30,52-54]. Furthermore, these studies did not show how large the variation in tumor lesion glucose uptake can be within a single patient [30,52-54]. At this time no validated predictive biomarkers for patient selection for drugs targeting glycolysis are available. A potential tool for such purpose is using 18F-FDG PET/CT scans as described in this study, to identify patients with high glucose uptake defined as SUVmean >5 in the majority (≥50%) of tumor lesions. Prospective clinical studies testing drugs targeting glycolysis, such as 2-DG, may consider incorporation of baseline 18F-FDG PET/CT scans to investigate suitability as a potential predictive biomarker.
A limitation of the current study is that no data was available regarding treatment of T2DM patients with oral blood glucose lowering agents due to the retrospective design. Metformin, the most prescribed oral anti-diabetic drug, is known to increase bowel 18F-FDG uptake [55], but it is not yet understood whether metformin influences tumor 18F-FDG uptake [56,57]. A small prospective randomized controlled trial showed no influence of metformin on 18F-FDG uptake in tumors, liver, heart, bone marrow and skeletal muscle [55]. In accordance with previous retrospective studies [39,58], we demonstrated that insulin treatment of T2DM patients did not influence the distribution of 18F-FDG uptake in NSCLC tumor lesions. Missed tumor lesions during assessment of the 18F-FDG PET/CT scans is unlikely since sub-types of NSCLC known for low 18F-FDG uptake, such as bronchioloalveolar carcinoma [59], were excluded during patient selection.
In conclusion, a large inter-patient and intra-patient heterogeneity in tumor lesion glucose uptake was found in NSCLC patients. 18F-FDG PET/CT scans could identify sub-groups of NSCLC patients with high glucose uptake (SUV mean >5) in the majority (≥ 50%) of their tumor lesions. T2DM patients had higher median glucose uptake in individual tumor lesions and per patient than non-diabetic NSCLC patients. Although this was not independent of other factors such as the histological subtype and number of tumor lesions per patient, our data may suggest that tumors from T2DM NSCLC patients have a different biology than tumors from non-diabetic NSCLC patients. A prospective study is required to elucidate the underlying biology and determine the potential for 18F-FDG PET/CT as a tool to select patients for metabolically targeted anti-cancer therapies.
Abbreviations
2-DG: 2-deoxyglucose; 95% CI: 95% confidence interval; CT: computed tomography; EARL: European Association of Nuclear Medicine Research Ltd; 18F-FDG: 2-deoxy-2-[fluorine-18]fluoro-D-glucose; GLUT-1: glucose transporter 1; MTV: metabolic tumor volume; MTVpatient: sum of the metabolic tumor volume measured in all tumor lesions per patient; NSCLC: non-small cell lung cancer; OR: odds ratio; PET: positron emission tomography; PVE: partial volume effect; ROI: region of interest; SUVmax: maximum measured standardized uptake value; SUVmean: mean standardized uptake value; T1DM: type 1 diabetes mellitus; T2DM: type 2 diabetes mellitus.
Supplementary Material
Supplementary figures.
Acknowledgements
The authors thank J. de Jong, F. Bensch, M. Smeenk, P. van Snick and T.S. Stutvoet for technical assistance. The authors thank W.J. Sluiter for his contribution to the analysis plan.
Competing Interests
All authors have made substantial contributions to conducting the study and drafting, revising and approving the manuscript. All authors have declared that no competing interest exists that might interfere with the objective presentation of the research findings contained in the submitted study. The authors received no financial support for the research, authorship, and/or publication of this manuscript.
References
1. Hanahan D, Weinberg RA. Hallmarks of cancer: The next generation. Cell. 2011;144:646-74
2. Ganapathy-Kanniappan S, Geschwind J-FH. Tumor glycolysis as a target for cancer therapy: progress and prospects. Mol Cancer. 2013;12:152
3. Martinez-Outschoorn UE, Peiris-Pagés M, Pestell RG, Sotgia F, Lisanti MP. Cancer metabolism: A therapeutic perspective. Nat Rev Clin Oncol. 2017;14:11-31
4. Abdel-Wahab AF, Mahmoud W, Al-Harizy RM. Targeting glucose metabolism to suppress cancer progression: prospective of anti-glycolytic cancer therapy. Pharmacol Res. 2019;150:104511
5. Raez LE, Papadopoulos K, Ricart AD. et al. A phase I dose-escalation trial of 2-deoxy-D-glucose alone or combined with docetaxel in patients with advanced solid tumors. Cancer Chemother Pharmacol. 2013;71:523-30
6. Stein M, Lin H, Jeyamohan C. et al. Targeting tumor metabolism with 2-deoxyglucose in patients with castrate-resistant prostate cancer and advanced malignancies. Prostate. 2010;70:1388-94
7. Singh D, Banerji AK, Dwarakanath BS. et al. Optimizing cancer radiotherapy with 2-deoxy-D-glucose: Dose escalation studies in patients with glioblastoma multiforme. Strahlenther Onkol. 2005;181:507-14
8. Mohanti B, Nat P. Improving cancer radiotherapy with 2-deoxy-D-glucose: Phase I/II clinical trials on human cerebral gliomas. Int J Radiat Oncol Biol Phys. 1996;35:103-11
9. Venkataramanaa N, Venkatesh P, Dwarakanath B, Vani S. Protective effect on normal brain tissue during a combinational therapy of 2-deoxy-D-glucose and hypofractionated irradiation in malignant gliomas. Asian J Neurosurg. 2013;8:9-14
10. Papaldo P, Lopez M, Cortesi E. et al. Addition of either lonidamine or granulocyte colony-stimulating factor does not improve survival in early breast cancer patients treated with high-dose epirubicin and cyclophosphamide. J Clin Oncol. 2003;21:3462-8
11. Oudard S, Carpentier A, Banu E. et al. Phase II study of lonidamine and diazepam in the treatment of recurrent glioblastoma multiforme. J Neurooncol. 2003;63:81-6
12. Jalving M, Gietema JA, Lefrandt JD. et al. Metformin: Taking away the candy for cancer? Eur J Cancer. 2010;46:2369-80
13. Ariaans G, de Jong S, Gietema JA, Lefrandt JD, de Vries EG, Jalving M. Cancer-drug induced insulin resistance: Innocent bystander or unusual suspect. Cancer Treat Rev. 2015;41:376-84
14. Volpi S, Ali JM, Tasker A, Peryt A, Aresu G, Coonar AS. The role of positron emission tomography in the diagnosis, staging and response assessment of non-small cell lung cancer. Ann Transl Med. 2018;6:95-103
15. Postmus PE, Kerr KM, Oudkerk M. et al. Early and locally advanced non-small-cell lung cancer (NSCLC): ESMO Clinical Practice Guidelines for diagnosis, treatment and follow-up. Ann Oncol. 2017;28:iv1-21
16. Planchard D, Popat S, Kerr K. et al. Metastatic non-small cell lung cancer: ESMO Clinical Practice Guidelines for diagnosis, treatment and follow-up. Ann Oncol. 2018;29:iv192-237
17. Kaira K, Serizawa M, Koh Y. et al. Biological significance of 18F-FDG uptake on PET in patients with non-small-cell lung cancer. Lung Cancer. 2014;83:197-204
18. Grootjans W, De Geus-Oei LF, Troost EGC, Visser EP, Oyen WJG, Bussink J. PET in the management of locally advanced and metastatic NSCLC. Nat Rev Clin Oncol. 2015;12:395-407
19. Kaira K, Yamamoto N, Kenmotsu H. et al. Prognostic impact of 18F-FDG uptake on PET in non-small cell lung cancer patients with postoperative recurrence following platinum-based chemotherapy. Respir Investig. 2014;52:121-8
20. Cho NH, Chan JCN, Jang HC, Lim S, Kim HL, Choi SH. Cigarette smoking is an independent risk factor for type 2 diabetes: A four-year community-based prospective study. Clin Endocrinol (Oxf). 2009;71:679-85
21. Janssen-Heijnen ML, Schipper RM, Razenberg PP, Crommelin M a, Coebergh JW. Prevalence of co-morbidity in lung cancer patients and its relationship with treatment: A population-based study. Lung Cancer. 1998;21:105-13
22. Margetts BM, Jackson AA. Interactions between people's diet and their smoking habits: The dietary and nutritional survey of British adults. BMJ. 1993;307:1381-4
23. American Diabetes Association. Classification and diagnosis of diabetes: Standards of medical care in diabetes. Diabetes Care. 2018;41:S13-27
24. Boellaard R, O'Doherty MJ, Weber WA. et al. FDG PET and PET/CT: EANM procedure guidelines for tumour PET imaging: Version 1.0. Eur J Nucl Med Mol Imaging. 2010;37:181-200
25. Boellaard R, Delgado-Bolton R, Oyen WJG. et al. FDG PET/CT: EANM procedure guidelines for tumour imaging: Version 2.0. Eur J Nucl Med Mol Imaging. 2015;42:328-54
26. Yu J, Li X, Xing L. et al. Comparison of tumor volumes as determined by pathologic examination and FDG-PET/CT images of non-small cell lung cancer: A pilot study. Int J Radiat Oncol Biol Phys. 2009;75:1468-74
27. van Velden FHP, Kramer GM, Frings V. et al. Repeatability of Radiomic Features in Non-Small-Cell Lung Cancer [18F]FDG-PET/CT Studies: Impact of Reconstruction and Delineation. Mol Imaging Biol. 2016;18:788-95
28. Liao S, Penney BC, Wroblewski K. et al. Prognostic value of metabolic tumor burden on 18F-FDG PET in non-surgical patients with non-small cell lung cancer. Eur J Nucl Med Mol Imaging. 2012;39:27-38
29. Soret M, Bacharach SL, Buvat I. Partial-volume effect in PET tumor imaging. J Nucl Med. 2007;48:932-45
30. Casali C, Cucca M, Rossi G. et al. The variation of prognostic significance of maximum standardized uptake value of [18F]-fluoro-2-deoxy-glucose positron emission tomography in different histological subtypes and pathological stages of surgically resected non-small cell lung car. Lung Cancer. 2010;69:187-93
31. Cistaro A, Quartuccio N, Mojtahedi A. et al. Prediction of 2 years-survival in patients with stage I and II non-small cell lung cancer utilizing 18F-FDG PET/CT SUV quantification. Radiol Oncol. 2013;47:219-23
32. Vansteenkiste BJF, Stroobants SG, Dupont PJ. et al. Prognostic importance of the standardized uptake value on 18F-fluoro-2-deoxy-glucose-positron emission tomography scan in non-small-cell lung cancer: An analysis of 125 cases. J Clin Oncol. 2019;17:3201-6
33. Dong M, Liu J, Sun X, Xing L. Prognositc significance of SUVmax on pretreatment 18F-FDG PET/CT in early-stage non-small cell lung cancer treated with stereotactic body radiotherapy: A meta-analysis. J Med Imaging Radiat Oncol. 2017;61:652-9
34. Nappi A, Gallicchio R, Simeon V. et al. [F-18] FDG-PET/CT parameters as predictors of outcome in inoperable NSCLC patients. Radiol Oncol. 2015;49:320-6
35. Torizuka T, Zasadny KR, Wahl RL. Diabetes decreases FDG accumulation in primary lung cancer. Clin Positron Imaging. 1999;2:281-7
36. Oh DY, Kim BG, Kim M. et al. Does diabetes mellitus influence standardized uptake values of fluorodeoxyglucose positron emission tomography in colorectal cancer? Intest Res. 2014;12:146-52
37. Gorenberg M, Hallett WA, O'Doherty MJ. Does diabetes affect [18F]FDG standardised uptake values in lung cancer? Eur J Nucl Med. 2002;29:1324-7
38. Chung KH, Park JK, Lee SH. et al. Lower maximum standardized uptake value of fluorine-18 fluorodeoxyglucose positron emission tomography coupled with computed tomography imaging in pancreatic ductal adenocarcinoma patients with diabetes. Am J Surg. 2015;209:709-16
39. Büsing KA, Schönberg SO, Brade J, Wasser K. Impact of blood glucose, diabetes, insulin, and obesity on standardized uptake values in tumors and healthy organs on 18F-FDG PET/CT. Nucl Med Biol. 2013;40:206-13
40. Haley M, Konski A, Li T. et al. Influence of diabetes on the interpretation of PET scans in patients with esophageal cancer. Gastrointest Cancer Res. 2010;3:149-52
41. Yang X, Liu Y, Mani H. et al. Biologic evaluation of diabetes and local recurrence in non-small cell lung cancer. Pathol Oncol Res. 2017;23:73-7
42. Zhang D, Fei Q, Li J. et al. 2-Deoxyglucose reverses the promoting effect of insulin on colorectal cancer cells in vitro. PLoS One. 2016;11:e0151115
43. Dwarkanath BS, Zolzer F, Chandana S. et al. Heterogeneity in 2-deoxy-D-glucose-induced modifications in energetics and radiation responses of human tumor cell lines. Int J Radiat Oncol Biol Phys. 2001;50:1051-61
44. Kaalep A, Sera T, Rijnsdorp S. et al. Feasibility of state of the art PET/CT systems performance harmonisation. Eur J Nucl Med Mol Imaging. 2018;45:1344-61
45. Boellaard R. EANM FDG PET/CT accrediation specifcations for SUV recovery coefficients. 2017; [cited 28 January 2020]. Available at:. http://earl.eanm.org/cms/website.php?id=/en/projects/fdg_pet_ct_accreditation/accreditation_specifications.htm
46. De Bruijn KMJ, Ruiter R, de Keyser CE, Hofman A, Stricker BH, van Eijck CHJ. Detection bias may be the main cause of increased cancer incidence among diabetics: results from the Rotterdam Study. Eur J Cancer. 2014;50:2449-55
47. Nagel JM, Bücker S, Wood M. et al. Less advanced stages of colon cancer in patients with type 2 diabetes mellitus: An unexpected finding? Exp Clin Endocrinol Diabetes. 2012;120:224-8
48. Suzawa N, Ito M, Qiao S. et al. Assessment of factors influencing FDG uptake in non-small cell lung cancer on PET/CT by investigating histological differences in expression of glucose transporters 1 and 3 and tumour size. Lung Cancer. 2011;72:191-8
49. Schuurbiers OCJ, Meijer TWH, Kaanders JHAM. et al. Glucose metabolism in NSCLC is histology-specific and diverges the prognostic potential of 18FDG-PET for adenocarcinoma and squamous cell carcinoma. J Thorac Oncol. 2014;9:1485-93
50. Del Gobbo A, Pellegrinelli A, Gaudioso G. et al. Analysis of NSCLC tumour heterogeneity, proliferative and 18F-FDG PET indices reveals Ki67 prognostic role in adenocarcinomas. Histopathology. 2016;68:746-51
51. Kenfield SA, Wei EK, Stampfer MJ, Rosner BA, Colditz GA. Comparison of aspects of smoking among the four histological types of lung cancer. Tob Control. 2008;17:198-204
52. Kosaka N, T T, Tsuji K, Shimizu K, H K. Standardized uptake value differences between primary and metastatic lesions in 18F-FDG PET/CT of patients with lung cancer. Acta Radiol. 2015;56:1329-35
53. Algan O, Confer M, Algan S. et al. Quantitative evaluation of correlation of dose and FDG-PET uptake value with clinical chest wall complications in patients with lung cancer treated with stereotactic body radiation therapy. J Xray Sci Technol. 2015;23:727-36
54. Pahk K, Chung JH, Yi E, Kim S, Lee SH. Metabolic tumor heterogeneity analysis by F-18 FDG PET/CT predicts mediastinal lymph node metastasis in non-small cell lung cancer patients with clinically suspected N2. Eur J Radiol. 2018;106:145-9
55. Hamidizadeh R, Eftekhari A, Wiley EA, Wilson D, Alden T, Bénard F. Metformin discontinuation prior to FDG PET/CT: A randomized controlled study to compare 24- and 48-hour bowel activity. Radiology. 2018;289:418-25
56. Capitanio S, Marini C, Sambuceti G, Morbelli S. Metformin and cancer: Technical and clinical implications for FDG-PET imaging. World J Radiol. 2017;7:57-60
57. Surasi DS, Bhambhvani P, Baldwin JA, Almodovar SE, O'Malley JP. 18F-FDG PET and PET/CT patient preparation: A review of the literature. J Nucl Med Technol. 2014;42:5-13
58. Roy F-N, Beaulieu S, Boucher L, Bourdeau I, Cohade C. Impact of intravenous insulin on 18F-FDG PET in diabetic cancer patients. J Nucl Med. 2009;50:178-83
59. Chang JM, Lee HJ, Goo JM. et al. False positive and false negative FDG-PET scans in various thoracic diseases. Korean J Radiol. 2006;7:57-69
Author contact
![]() Corresponding author: M. Jalving, MD, PhD, Department of Medical Oncology, University Medical Center Groningen, Hanzeplein 1, Postbus 30.001, 9700 RB Groningen, The Netherlands. Phone: 00 31 50 3612821, Fax: 00 31 50 3614862, E-mail: m.jalvingnl.
Corresponding author: M. Jalving, MD, PhD, Department of Medical Oncology, University Medical Center Groningen, Hanzeplein 1, Postbus 30.001, 9700 RB Groningen, The Netherlands. Phone: 00 31 50 3612821, Fax: 00 31 50 3614862, E-mail: m.jalvingnl.