Impact Factor ISSN: 1837-9664

 Global reach, higher impact
J Cancer 2021; 12(2):539-552. doi:10.7150/jca.51218 This issue Cite
Research Paper
Can Patients with Pancreatic Cancer and Liver Metastases Obtain Survival Benefit from Surgery? A Population-Based Study
Bing-Bing Su1*, Dou-Sheng Bai1*, Jiang-Quan Yu2, Chi Zhang1, Sheng-Jie Jin1, Bao-Huan Zhou1, Guo-Qing Jiang1 ![]()
1. Department of Hepatobiliary Surgery, Clinical Medical College, Yangzhou University, Yangzhou 225001, China.
2. Department of Intensive Care Unit, Clinical Medical College, Yangzhou University, Yangzhou 225001, China.
*These authors contributed equally to this work.
Received 2020-7-28; Accepted 2020-10-29; Published 2021-1-1
Abstract
Background: Surgery for pancreatic cancer with liver metastases (PCL) is not recommended in the international guidelines, and investigation of its clinical significance in patients with PCL is very limited. This study explored whether surgery, especially synchronous resection of the primary tumor and liver metastases (SPL), could improve survival in PCL.
Methods: Data of 14,248 patients with PCL from Surveillance, Epidemiology, and End Results database was analyzed. Patients were divided into following groups: SPL, synchronous primary site, and other resection (SPO), single resection of the primary site (SPS), and no resection (NR).
Results: In this study, only 93 (0.7%) underwent SPL, 88 (0.6%) for SPO, and 232 (1.6%) for SPS. Multivariate Cox analysis showed surgical procedures of both the primary site and other sites were independent protective prognostic factors for pancreatic cancer cause-specific survival (PCSS) (all P < 0.001). Patients in the SPL group showed the most survival benefit, with a significant and gradually increased difference as compared with the SPO, SPS, and NR groups (median survival: 54, 34, 15, and 3 months, respectively, all P < 0.001). Compared with the NR group, mortalities were significant and gradually declining in the SPS, SPO, and SPL groups, with hazard ratio 0.329 (95% confidence interval [CI], 0.281 to 0.386), 0.220 (95% CI, 0.164 to 0.294), and 0.162 (95% CI, 0.118 to 0.222), respectively (all P < 0.001).
Conclusions: Surgical procedures for both primary site and other sites improved survival. SPL, particularly, showed a considerable survival benefit in well-selected patients with PCL.
Keywords: Pancreatic cancer, metastases, surgical procedures, survival, SEER
Introduction
Pancreatic cancer (PC) remains one of the most aggressive malignant tumors. Although the mortality from most cancers is declining, PC moved from the fourth leading cause of cancer-related death to the third in 2016 [1]. Despite of many efforts, this rate has not improved much over the last 30 years, with a persistently low 5-year survival rate of 8% [2,3]. Compared with stages I-III, the overall survival (OS) of patients with stage IV metastatic disease (M1) was worse [4-6]. The median survival of locally advanced PC is only 6-10 months, and just 3-6 months in M1 PC [7]. Surgery is regarded as the only potentially curative method. However, once distant metastases are identified, surgery is not recommended in the guidelines [8,9].
For other malignant tumors, such as colorectal cancer, gastric cancer, and even sarcoma, there is increasing evidence that simultaneous metastasectomy can improve survival in appropriately selected patients who are in good general health and if the surgical procedures are performed carefully [10-12]. The question arises whether all patients with M1 PC should face the presently dismal outcomes. Yet, it remains controversial whether there is a survival benefit from synchronous resection of both the primary tumor as well as metastases in patients with M1 PC.
A few studies including data from six European pancreas centers have all shown a significant survival benefit, with acceptable morbidity and mortality in patients with PC and liver metastases (PCL) who underwent synchronous resection of the primary tumor and liver metastases (SPL), in comparison with patients with PCL who did not undergo resection [13,14]. Conversely, other studies have found no significant difference in survival between patients with PCL who underwent SPL and palliative bypass alone [15,16].
Up to the present, the sample sizes of patients undergoing SPL in previous studies have all been very small [13-16], with the largest sample including 69 patients in a collaboration study of six high-volume centers in Europe [14]. To reach more robust conclusions, the present study aimed to use data from a larger patient sample to investigate the clinical significance of surgery, especially SPL, in patients with PCL. We extracted data from the Surveillance, Epidemiology, and End Results (SEER) cancer registry to systematically analyze the effect of surgery, especially SPL, on PC cause-specific survival (PCSS) in patients with PCL.
Materials and Methods
Patient selection in the SEER database
The SEER Cancer Statistics Review, which comprises the most recent statistics on cancer incidence, mortality, survival, prevalence, and lifetime risk, is published annually by the Data Analysis and Interpretation Branch of the National Cancer Institute in the United States (US). The current SEER database derives from 18 population-based cancer registries in the US [17]. It contains no identifiers and is publicly available for studies of cancer-based epidemiology. We used SEER*Stat 8.3.5 software to identify patients with a histopathologic diagnosis of PC from January 1, 2010, through December 31, 2015, with follow-up through December 31, 2017.
SEER registry patients with PC who were eligible for our study cohort included those with the following histologic type, according to the International Classification of Diseases for Oncology, Third Edition: adenocarcinoma (8140, 8141, 8144, 8210, 8211, 8255, 8260, 8263, 8310, 8401, 8440, 8450, 8470, 8480, 8481, 8503, 8574, 8576), neuroendocrine carcinoma (8246) and others (8000, 8001, 8004, 8010, 8012, 8013, 8014, 8020, 8021, 8022, 8031, 8032, 8033, 8035, 8041, 8046, 8070, 8071, 8072, 8120, 8150, 8151, 8152, 8153, 8154, 8160, 8162, 8170, 8240, 8244, 8249, 8430, 8452, 8453, 8490, 8500, 8507, 8523, 8550, 8560, and 8980).
We extracted the following data: sex, race, age at diagnosis, year of diagnosis, primary site, pathological grade, histologic type, T stage, N stage, tumor size, insurance status, marital status, county percentage with a bachelor's degree, county percentage unemployed, county-level median household income, residential area, surgical procedure for the primary site, surgical procedure for other sites, radiotherapy, chemotherapy, SEER cause-specific death classification, SEER other cause of death classification, survival months, and vital status.
In this analysis, we included only adult patients with PC and liver metastases, with TNM stage IV, according to the criteria described in the American Joint Committee on Cancer Staging Manual (7th edition). We excluded patients as follows: those with bone metastasis, lung metastasis, brain metastasis, other primary cancer, unknown surgical history, unknown bachelor's degree status, and cause of death missing/unknown or attributable to causes other than PC.
Statistical analysis
The primary endpoint of this study was PCSS. PCSS was defined as the time from the date of diagnosis to the date of death owing to PC. Baseline patient demographics and tumor characteristics were compared using the chi-square test. The PC survival rate was compared between subgroups using Kaplan-Meier analysis. All prognostic factors with P < 0.1 in Kaplan-Meier analysis were investigated using multivariate Cox analysis to identify predictors of PCSS. All statistical analyses were performed using IBM SPSS, version 22 (IBM Corp, Armonk, NY, USA). Statistical significance was set at two-sided P <0.05.
All patients were categorized as those receiving surgery for the primary site (PSP), those who were recommended but did not undergo surgery for the primary site (RN-PSP) group, and those who were not recommended and did not have surgery for the primary site (NRN-PSP). The PSP group was divided into the SPL group, synchronous primary tumor, and other resection (SPO) groups, and no synchronous resection for other sites group also called single resection of the primary site (SPS). A surgical procedure of other sites was defined as any of the following: (1) non-primary surgical procedure for liver; (2) non-primary surgical procedure for other regional sites; (3) non-primary surgical procedure for distant lymph node(s); (4) any combination of surgical procedures for other regional sites, distant lymph node(s), and/or liver; and (5) non-primary surgical procedure performed without detail information. Apart from non-primary surgical procedures for the liver, the remaining surgical procedures for other sites were defined as other resection.
Results
Baseline patient characteristics
We identified a total of 14,248 eligible patients with PCL between 2010 and 2015, with 7,711 male and 6,537 female patients. Of these, 93 (0.7%) underwent SPL, 88 (0.6%) received SPO, 232 (1.6%) received SPS, 414 (2.9%) PSP, 320 (2.3%) RN-PSP, 13,514 (94.8%) NRN-PSP and 13,503 (94.8%) patients received no resection (NR). Mean ages of patients were 58.5 ± 12.4 (range: 25-82) years in the SPL group, 55.7 ± 13.2 (range: 20-87) years in the SPO group, 60.6 ± 12.5 (range: 20-93) years in the SPS group, and 67.5 ± 12.1 (range: 20-103) years in the NR group.
In within-group comparisons, the SPL group had the highest proportion (53.8%) of body/tail site, greater frequency (36.0%) of well/moderately differentiated pathology grade, highest prevalence (41.9%) of neuroendocrine carcinoma, a greater proportion (72.0%) of T3 stage, and less (33.3%) chemotherapy, which were all statistically significant (P < 0.001). Baseline patient demographics and tumor characteristics according to different surgical procedures are described in Table 1.
Baseline demographic and tumor characteristics of different surgical procedures for pancreatic cancer with liver metastases in the SEER database
| Characteristic | SPL, N (%)(n = 93) | SPO, N (%)(n = 88) | SPS, N (%)(n = 232) | NR, N (%)(n = 13503) | P |
|---|---|---|---|---|---|
| Sex | 0.525 | ||||
| Male | 52 (55.9) | 41 (46.6) | 128 (55.2) | 7312 (54.2) | |
| Female | 41 (44.1) | 47 (53.4) | 104 (44.8) | 6191 (45.8) | |
| Race | 0.572 | ||||
| White | 76 (81.7) | 76 (86.4) | 182 (78.4) | 10608 (78.6) | |
| Black | 10 (10.8) | 6 (6.8) | 30 (12.9) | 1847 (13.7) | |
| Other* | 7 (7.5) | 6 (6.8) | 20 (8.6) | 1048 (7.8) | |
| Age | <0.001 | ||||
| <65 | 64 (68.8) | 68 (77.3) | 137 (59.1) | 5552 (41.1) | |
| ≥65 | 29 (31.2) | 20 (22.7) | 95 (40.9) | 7951 (58.9) | |
| Year of diagnosis | 0.539 | ||||
| 2010-2011 | 26 (28.0) | 27 (30.7) | 69 (29.7) | 4096 (30.3) | |
| 2012-2013 | 29 (31.2) | 36 (40.9) | 84 (36.2) | 4468 (33.1) | |
| 2014-2015 | 38 (40.9) | 25 (28.4) | 79 (34.1) | 4939 (36.6) | |
| Primary Site | <0.001 | ||||
| Head | 32 (34.4) | 25 (28.4) | 123 (53.0) | 4899 (36.3) | |
| Body/Tail | 50 (53.8) | 45 (51.1) | 70 (30.2) | 4856 (36.0) | |
| Other | 11 (11.8) | 18 (20.5) | 39 (16.8) | 3748 (27.8) | |
| Grade | <0.001 | ||||
| Well/Moderate | 56 (60.2) | 50 (56.8) | 116 (50.0) | 1040 (7.7) | |
| Poor/Anaplastic | 21 (22.6) | 28 (31.8) | 71 (30.6) | 1431 (10.6) | |
| Other | 16 (17.2) | 10 (11.4) | 45 (19.4) | 11032 (81.7) | |
| Histology | <0.001 | ||||
| Adenocarcinoma | 20 (21.5) | 22 (25.0) | 86 (37.1) | 9845 (72.9) | |
| Neuroendocrine carcinoma | 39 (41.9) | 32 (36.4) | 41 (17.7) | 546 (4.0) | |
| Other | 34 (36.6) | 34 (38.6) | 105 (45.3) | 3112 (23.0) | |
| T stage | <0.001 | ||||
| T0 | 0 (0.0) | 0 (0.0) | 0 (0.0) | 119 (0.9) | |
| T1 | 4 (4.3) | 3 (3.4) | 10 (4.3) | 337 (2.5) | |
| T2 | 17 (18.3) | 15 (17.0) | 41 (17.7) | 3848 (28.5) | |
| T3 | 67 (72.0) | 58 (65.9) | 146 (62.9) | 3280 (24.3) | |
| T4 | 4 (4.3) | 10 (11.4) | 16 (6.9) | 2216 (16.4) | |
| TX | 1 (1.1) | 2 (2.3) | 19 (8.2) | 3703 (27.4) | |
| N stage | <0.001 | ||||
| N0 | 32 (34.4) | 24 (27.3) | 90 (38.8) | 7173 (53.1) | |
| N1 | 60 (64.5) | 60 (68.2) | 132 (56.9) | 3904 (28.9) | |
| NX | 1 (1.1) | 4 (4.5) | 10 (4.3) | 2426 (18.0) | |
| Tumor Size | <0.001 | ||||
| ≤2 cm | 7 (7.5) | 5 (5.7) | 19 (8.2) | 714 (5.3) | |
| 2-4 cm | 37 (39.8) | 34 (38.6) | 99 (42.7) | 4600 (34.1) | |
| >4 cm | 45 (48.4) | 45 (51.1) | 98 (42.2) | 5367 (39.7) | |
| Unknown | 4 (4.3) | 4 (4.5) | 16 (6.9) | 2822 (20.9) | |
| Insurance status | 0.073 | ||||
| Insured | 82 (88.2) | 73 (83.0) | 204 (87.9) | 10999 (81.5) | |
| Medicaid | 7 (7.5) | 9 (10.2) | 21 (9.1) | 1790 (13.3) | |
| Uninsured/Unknown | 4 (4.3) | 6 (6.8) | 7 (3.0) | 714 (5.3) | |
| Marital status | <0.001 | ||||
| Married | 59 (63.4) | 52 (59.1) | 156 (67.2) | 7210 (53.4) | |
| Unmarried | 30 (32.3) | 32 (36.4) | 66 (28.4) | 5662 (41.9) | |
| Unknown | 4 (4.3) | 4 (4.5) | 10 (4.3) | 631 (4.7) | |
| County % with bachelor degree | 0.511 | ||||
| Below median | 37 (39.8) | 40 (45.5) | 90 (38.8) | 5815 (43.1) | |
| Above median | 56 (60.2) | 48 (54.5) | 142 (61.2) | 7688 (56.9) | |
| County % with unemployed | 0.779 | ||||
| Below median | 40 (43.0) | 43 (48.9) | 107 (46.1) | 6443 (47.7) | |
| Above median | 53 (57.0) | 45 (51.1) | 125 (53.9) | 7060 (52.3) | |
| County-level median household income | 0.039 | ||||
| Below median | 41 (44.1) | 41 (46.6) | 91 (39.2) | 6532 (48.4) | |
| Above median | 52 (55.9) | 47 (53.4) | 141 (60.8) | 6971 (51.6) | |
| Residence area | 0.301 | ||||
| Metropolitan | 88 (94.6) | 80 (90.9) | 215 (92.7) | 12054 (89.3) | |
| Urban/rural | 5 (5.4) | 8 (9.1) | 17 (7.3) | 1433 (10.6) | |
| Missing | 0 (0.0) | 0 (0.0) | 0 (0.0) | 16 (0.1) | |
| Radiotherapy | <0.001 | ||||
| Yes | 7 (7.5) | 8 (9.1) | 11 (4.7) | 367 (2.7) | |
| No/Unknown | 86 (92.5) | 80 (90.9) | 221 (95.3) | 13136 (97.3) | |
| Chemotherapy | <0.001 | ||||
| Yes | 31 (33.3) | 49 (55.7) | 133 (57.3) | 6671 (49.4) | |
| No/Unknown | 62 (66.7) | 39 (44.3) | 99 (42.7) | 6832 (50.6) | |
*, Other includes American Indian/Alaska Native, Asian/Pacific Islander, and unknown. SPL: synchronous resection of the primary tumor and liver metastases; SPO: synchronous primary tumor and other resection; SPS: single resection of the primary site; NR: no resection.
Effect on PCSS of surgical procedures for primary and other sites
Patients who underwent PSP had better survival (n = 13,834, 97.1%) than those who did not undergo surgery for the primary site (5-year PCSS: 33.4% vs. 0.19%, median survival: 24 vs. 3 months, P < 0.001). Five-year PCSS was 33.4% in the PSP group, 4.0% in the RN-PSP group, and 1.8% in the NRN-PSP group; survival was significantly different in Kaplan-Meier analysis (median survival: 24, 2, 3 months, respectively, P < 0.001). Surprisingly, the median survival of the RN-PSP group was significantly shorter than that of the NRN-PSP group (P < 0.001). Moreover, for surgical procedures of other sites, 5-year PCSS was 17.5% in the liver resection group, 16.9% in the other resection group, and 2.4% in the NR group; survival was also significantly different in Kaplan-Meier analysis (median survival: 8, 11, 3 months, respectively, P < 0.001).
As shown in Table 2, after univariate analysis and multivariate Cox analysis, surgical procedures of the primary site, surgical procedures of other sites, radiotherapy, and chemotherapy were all validated as independent protective prognostic factors for survival (all P < 0.001).
Univariate and multivariate Cox analysis to identify predictors of pancreatic cancer cause-specific survival
| Variable | Total (n=14248) | 2-year PCSS | 5-year PCSS | Univariate analysis | Multivariate Cox analysis | |
|---|---|---|---|---|---|---|
| P | HR (95%CI) | P | ||||
| Sex | 0.392 | NI | ||||
| Male | 7711 | 0.071 | 0.032 | |||
| Female | 6537 | 0.070 | 0.026 | |||
| Race | <0.001 | 0.018 | ||||
| White | 11204 | 0.073 | 0.030 | Reference | ||
| Black | 1946 | 0.055 | 0.021 | 1.061 (1.008-1.116) | 0.023 | |
| Other* | 1098 | 0.073 | 0.032 | 0.954 (0.894-1.019) | 0.161 | |
| Age | <0.001 | <0.001 | ||||
| <65 | 5991 | 0.112 | 0.047 | Reference | ||
| ≥65 | 8257 | 0.041 | 0.017 | 1.306 (1.260-1.355) | ||
| Year of diagnosis | <0.001 | <0.001 | ||||
| 2010-2011 | 4335 | 0.059 | 0.22 | Reference | ||
| 2012-2013 | 4729 | 0.076 | NA | 0.955 (0.916-0.997) | 0.034 | |
| 2014-2015 | 5184 | 0.076 | NA | 0.915 (0.878-0.955) | <0.001 | |
| Primary Site | <0.001 | 0.016 | ||||
| Head | 5236 | 0.065 | 0.024 | Reference | ||
| Body/Tail | 5113 | 0.080 | 0.036 | 1.054 (1.012-1.098) | 0.011 | |
| Other | 3899 | 0.066 | 0.028 | 1.045 (0.998-1.094) | 0.020 | |
| Grade | <0.001 | <0.001 | ||||
| Well/Moderate | 1301 | 0.252 | 0.126 | Reference | ||
| Poor/Anaplastic | 1592 | 0.055 | 0.021 | 1.776 (1.639-1.925) | <0.001 | |
| Other | 11355 | 0.052 | 0.019 | 1.525 (1.427-1.630) | <0.001 | |
| Histology | <0.001 | <0.001 | ||||
| Adenocarcinoma | 10248 | 0.039 | 0.008 | Reference | ||
| Neuroendocrine carcinoma | 683 | 0.294 | 0.247 | 0.292 (0.265-0.322) | <0.001 | |
| Other | 3317 | 0.084 | 0.047 | 0.893 (0.855-0.931) | <0.001 | |
| T stage | <0.001 | 0.004 | ||||
| T0 | 123 | 0.065 | NA | Reference | ||
| T1 | 360 | 0.092 | 0.038 | 0.829 (0.670-10.26) | 0.085 | |
| T2 | 3993 | 0.069 | 0.029 | 0.819 (0.654-1.026) | 0.082 | |
| T3 | 3656 | 0.098 | 0.041 | 0.769 (0.615-0.961) | 0.021 | |
| T4 | 2314 | 0.060 | 0.023 | 0.781 (0.624-0.977) | 0.031 | |
| TX | 3802 | 0.052 | 0.021 | 0.838 (0.670-1.046) | 0.118 | |
| N stage | <0.001 | 0.100 | ||||
| N0 | 7514 | 0.070 | 0.026 | Reference | ||
| N1 | 4257 | 0.084 | 0.041 | 1.044 (1.003-1.087) | 0.034 | |
| NX | 2477 | 0.050 | 0.018 | 1.007 (0.958-1.058) | 0.794 | |
| Tumor size | <0.001 | <0.001 | ||||
| ≤2 cm | 765 | 0.087 | 0.041 | Reference | ||
| 2-4 cm | 4890 | 0.072 | 0.024 | 1.093 (0.962-1.242) | 0.170 | |
| >4 cm | 5664 | 0.076 | 0.036 | 1.214 (1.069-1.379) | 0.003 | |
| Unknown | 2929 | 0.054 | 0.020 | 1.185 (1.040-1.350) | 0.011 | |
| Insurance status | <0.001 | <0.001 | ||||
| Insured | 11627 | 0.075 | 0.032 | Reference | ||
| Medicaid | 1871 | 0.049 | 0.021 | 1.098 (1.041-1.157) | <0.001 | |
| Uninsured/Unknown | 750 | 0.051 | 0.010 | 1.181 (1.091-1.278) | <0.001 | |
| Marital status | <0.001 | <0.001 | ||||
| Married | 7658 | 0.088 | 0.035 | Reference | ||
| Unmarried | 5920 | 0.048 | 0.020 | 1.122 (1.081-1.163) | <0.001 | |
| Unknown | 670 | 0.080 | 0.044 | 0.982 (0.904-1.067) | 0.671 | |
| County % with bachelor degree | <0.001 | 0.002 | ||||
| Below median | 6146 | 0.066 | 0.024 | Reference | ||
| Above median | 8102 | 0.075 | 0.034 | 0.939 (0.902-0.977) | ||
| County % with unemployed | 0.007 | 0.738 | ||||
| Below median | 6788 | 0.076 | 0.034 | Reference | ||
| Above median | 7460 | 0.066 | 0.025 | 0.994 (0.958-1.031) | ||
| County-level median household income | <0.001 | 0.110 | ||||
| Below median | 6905 | 0.064 | 0.024 | Reference | ||
| Above median | 7343 | 0.077 | 0.034 | 0.967 (0.929-1.007) | ||
| Residence area | 0.183 | NI | ||||
| Metropolitan | 12718 | 0.072 | 0.028 | |||
| Urban/rural | 1514 | 0.063 | 0.035 | |||
| Missing | 16 | 0.125 | NA | |||
| Surgical procedure of primary site | <0.001 | <0.001 | ||||
| Not recommended | 13514 | 0.058 | 0.018 | Reference | ||
| Performed | 414 | 0.492 | 0.334 | 0.390 (0.339-0.448) | <0.001 | |
| Recommended but not Performed | 320 | 0.049 | 0.040 | 0.910 (0.811-1.021) | 0.107 | |
| Surgical procedure of other sites | <0.001 | <0.001 | ||||
| No resection | 13735 | 0.062 | 0.024 | Reference | ||
| Liver resection | 288 | 0.298 | 0.175 | 0.714 (0.622-0.818) | <0.001 | |
| Other resection | 218 | 0.286 | 0.169 | 0.772 (0.660-0.904) | 0.001 | |
| Unknown | 7 | NA | NA | 1.261 (0.599-2.652) | 0.541 | |
| Radiotherapy | <0.001 | <0.001 | ||||
| Yes | 405 | 0.132 | 0.027 | Reference | ||
| No/Unknown | 13843 | 0.069 | 0.029 | 1.303 (1.174-1.447) | ||
| Chemotherapy | <0.001 | <0.001 | ||||
| Yes | 7079 | 0.096 | 0.030 | Reference | ||
| No/Unknown | 7169 | 0.046 | 0.028 | 2.477 (2.384-2.573) | ||
*, Other includes American Indian/Alaska Native, Asian/Pacific Islander, and unknown. PCSS: pancreatic cancer cause-specific survival; HR: hazard ratio; CI: confidence interval; NA: not applicable; NI: not included in multivariate survival analysis.
Effect on PCSS of synchronous surgical procedure for primary and other sites
Among patients with PSP, only one had unknown surgery status for other sites; this patient was omitted from the following analyses. The 181 (43.8%) patients who received surgical procedures for other sites had better survival than the 232 (56.2%) patients who did not (5-year PCSS: 44.5% vs. 24.6%, median survival: 43 vs. 15 months, P < 0.001). As shown in Table 3, after univariate and multivariate Cox analyses, the synchronous surgical procedure of other sites was validated as an independent prognostic positive factor for survival (P < 0.001). Notably, radiotherapy and chemotherapy were not independent prognostic factors for survival in patients with PSP (Table 3).
Univariate and multivariate Cox analyses to identify predictors of pancreatic cancer cause-specific survival in patients undergoing surgical procedures of the primary site
| Variable | Total (n=413) | 2-year PCSS | 5-year PCSS | Univariate analysis | Multivariate Cox analysis | |
|---|---|---|---|---|---|---|
| P | HR (95%CI) | P | ||||
| Sex | 0.858 | NI | ||||
| Male | 221 | 0.050 | 0.344 | |||
| Female | 192 | 0.485 | 0.324 | |||
| Race | 0.782 | NI | ||||
| White | 334 | 0.494 | 0.334 | |||
| Black | 46 | 0.485 | 0.304 | |||
| Other* | 33 | 0.498 | 0.409 | |||
| Age | <0.001 | 0.014 | ||||
| <65 | 269 | 0.579 | 0.405 | Reference | ||
| ≥65 | 144 | 0.335 | 0.210 | 1.406 (1.071-1.846) | ||
| Year of diagnosis | 0.394 | NI | ||||
| 2010-2011 | 122 | 0.466 | 0.287 | |||
| 2012-2013 | 149 | 0.499 | NA | |||
| 2014-2015 | 142 | 0.515 | NA | |||
| Primary Site | <0.001 | 0.019 | ||||
| Head | 180 | 0.324 | 0.210 | Reference | ||
| Body/Tail | 165 | 0.633 | 0.405 | 0.697 (0.503-0.967) | 0.031 | |
| Other | 68 | 0.586 | 0.487 | 0.566 (0.357-0.897) | 0.016 | |
| Grade | <0.001 | <0.001 | ||||
| Well/Moderate | 222 | 0.673 | 0.476 | Reference | ||
| Poor/Anaplastic | 120 | 0.272 | 0.174 | 2.425 (1.774-3.313) | <0.001 | |
| Other | 71 | 0.320 | 0.188 | 1.772 (1.190-2.639) | 0.005 | |
| Histology | <0.001 | <0.001 | ||||
| Adenocarcinoma | 128 | 0.237 | 0.097 | Reference | ||
| Neuroendocrine carcinoma | 112 | 0.833 | 0.457 | 0.252 (0.161-0.394) | <0.001 | |
| Other | 173 | 0.691 | 0.328 | 0.541 (0.392-0.747) | <0.001 | |
| T stage | 0.002 | 0.471 | ||||
| T0 | 0 | NA | NA | |||
| T1 | 17 | 0.635 | 0.635 | Reference | ||
| T2 | 73 | 0.478 | 0.298 | 1.054 (0.330-3.362) | 0.930 | |
| T3 | 271 | 0.512 | 0.352 | 1.026 (0.336-3.134) | 0.965 | |
| T4 | 30 | 0.527 | 0.287 | 0.926 (0.273-3.145) | 0.902 | |
| TX | 22 | 0.156 | 0.104 | 2.195 (0.578-8.339) | 0.248 | |
| N stage | 0.067 | 0.162 | ||||
| N0 | 146 | 0.505 | 0.357 | Reference | ||
| N1 | 252 | 0.501 | 0.332 | 1.174 (0.864-1.597) | 0.305 | |
| NX | 15 | 0.240 | 0.160 | 1.870 (0.940-3.721) | 0.075 | |
| Tumor Size | 0.001 | 0.343 | ||||
| ≤2 cm | 31 | 0.562 | 0.515 | Reference | ||
| 2-4 cm | 170 | 0.430 | 0.280 | 1.866 (0.885-3.934) | 0.101 | |
| >4 cm | 188 | 0.573 | 0.384 | 1.863 (0.869-3.996) | 0.110 | |
| Unknown | 24 | 0.231 | 0.116 | 1.254 (0.460-3.421) | 0.658 | |
| Insurance status | 0.236 | NI | ||||
| Insured | 359 | 0.505 | 0.347 | |||
| Medicaid | 37 | 0.392 | 0.281 | |||
| Uninsured/Unknown | 17 | 0.463 | NA | |||
| Marital status | 0.051 | 0.041 | ||||
| Married | 267 | 0.497 | 0.340 | Reference | ||
| Unmarried | 128 | 0.448 | 0.281 | 1.173 (0.885-1.556) | 0.267 | |
| Unknown | 18 | 0.769 | 0.684 | 0.351 (0.134-0.922) | 0.034 | |
| County % with bachelor degree | 0.042 | 0.080 | ||||
| Below median | 167 | 0.448 | 0.285 | Reference | ||
| Above median | 246 | 0.524 | 0.371 | 0.767 (0.570-1.033) | ||
| County % with unemployed | 0.040 | 0.439 | ||||
| Below median | 190 | 0.522 | 0.409 | Reference | ||
| Above median | 223 | 0.468 | 0.268 | 1.129 (0.830-1.537) | ||
| County-level median household income | 0.002 | 0.034 | ||||
| Below median | 173 | 0.428 | 0.268 | Reference | ||
| Above median | 240 | 0.540 | 0.386 | 0.709 (0.516-0.975) | ||
| Residence area | 0.104 | NI | ||||
| Metropolitan | 383 | 0.507 | 0.339 | |||
| Urban/rural | 30 | 0.323 | 0.277 | |||
| Synchronous surgical procedure | <0.001 | 0.011 | ||||
| SPS | 232 | 0.392 | 0.246 | Reference | ||
| SPL | 93 | 0.683 | 0.497 | 0.544 (0.373-0.793) | 0.009 | |
| SPO | 88 | 0.551 | 0.391 | 0.656 (0.461-0.934) | 0.033 | |
| Radiotherapy | 0.513 | NI | ||||
| Yes | 26 | 0.498 | 0.249 | |||
| No/Unknown | 387 | 0.491 | 0.337 | |||
| Chemotherapy | 0.001 | 0.056 | ||||
| Yes | 213 | 0.414 | 0.228 | Reference | ||
| No/Unknown | 200 | 0.580 | 0.451 | 1.365 (0.992-1.878) | ||
*, Other includes American Indian/Alaska Native, Asian/Pacific Islander, and unknown. PCSS: pancreatic cancer cause-specific survival; HR: hazard ratio; CI: confidence interval; SPL: synchronous resection of the primary tumor and liver metastases; SPO: synchronous primary tumor and other resection; SPS: single resection of the primary site; NA: not applicable; NI: not included in multivariate survival analysis.
Effect of radiotherapy/chemotherapy on PCSS in patients without surgery
The 367 (2.7%) patients without surgery who received radiotherapy (WSR) had better survival than the 13,136 (97.3%) patients without surgery who received no/unknown radiotherapy (N-WSR) (2-year PCSS: 11.2% vs. 5.5%, median survival: 6 vs. 2 months, P < 0.001) (Table 4). The 6671 (49.4%) patients without surgery who received chemotherapy (WSC) had better survival than the 6832 (50.6%) patients without surgery who received no/unknown chemotherapy (N-WSC) (2-year PCSS: 8.4% vs. 3.0%, median survival: 6 vs. 1 months, P < 0.001) (Table 4).
Univariate and multivariate Cox analyses to identify predictors of pancreatic cancer cause-specific survival in patients receiving no resection
| Variable | Total (n=13503) | 2-year PCSS | 5-year PCSS | Univariate analysis | Multivariate Cox analysis | |
|---|---|---|---|---|---|---|
| P | HR (95%CI) | P | ||||
| Sex | 0.298 | NI | ||||
| Male | 7312 | 0.057 | 0.022 | |||
| Female | 6191 | 0.056 | 0.016 | |||
| Race | 0.004 | 0.019 | ||||
| White | 10608 | 0.059 | 0.021 | Reference | ||
| Black | 1847 | 0.045 | 0.013 | 1.059 (1.006-1.116) | 0.030 | |
| Other* | 1048 | 0.059 | 0.019 | 0.950 (0.889-1.016) | 0.133 | |
| Age | <0.001 | <0.001 | ||||
| <65 | 5552 | 0.088 | 0.029 | Reference | ||
| ≥65 | 7951 | 0.035 | 0.013 | 1.295 (1.247-1.344) | ||
| Year of diagnosis | <0.001 | 0.001 | ||||
| 2010-2011 | 4096 | 0.046 | 0.014 | Reference | ||
| 2012-2013 | 4468 | 0.061 | NA | 0.962 (0.921-1.004) | 0.077 | |
| 2014-2015 | 4939 | 0.062 | NA | 0.922 (0.883-0.963) | <0.001 | |
| Primary Site | <0.001 | 0.004 | ||||
| Head | 4899 | 0.054 | 0.016 | Reference | ||
| Body/Tail | 4856 | 0.061 | 0.023 | 1.062 (1.019-1.107) | 0.005 | |
| Other | 3748 | 0.050 | 0.019 | 1.069 (1.020-1.121) | 0.005 | |
| Grade | <0.001 | <0.001 | ||||
| Well/Moderate | 1040 | 0.163 | 0.055 | Reference | ||
| Poor/Anaplastic | 1431 | 0.034 | 0.008 | 1.708 (1.569-1.859) | <0.001 | |
| Other | 11032 | 0.050 | 0.018 | 1.476 (1.379-1.581) | <0.001 | |
| Histology | <0.001 | <0.001 | ||||
| Adenocarcinoma | 9845 | 0.036 | 0.007 | Reference | ||
| Neuroendocrine carcinoma | 546 | 0.391 | 0.062 | 0.298 (0.269-0.330) | <0.001 | |
| Other | 3112 | 0.172 | 0.030 | 0.911(0.872-0.951) | <0.001 | |
| T stage | <0.001 | 0.006 | ||||
| T0 | 119 | 0.060 | NA | Reference | ||
| T1 | 337 | 0.064 | 0.012 | 0.855 (0.689-1.064) | 0.156 | |
| T2 | 3848 | 0.059 | 0.025 | 0.809 (0.643-1.018) | 0.070 | |
| T3 | 3280 | 0.063 | 0.016 | 0.761 (0.606-0.956) | 0.019 | |
| T4 | 2216 | 0.052 | 0.018 | 0.769 (0.612-0.968) | 0.025 | |
| TX | 3703 | 0.050 | 0.021 | 0.829 (0.660-1.040) | 0.106 | |
| N stage | <0.001 | 0.183 | ||||
| N0 | 7173 | 0.060 | 0.019 | Reference | ||
| N1 | 3904 | 0.056 | 0.022 | 1.037 (0.996-1.081) | 0.079 | |
| NX | 2426 | 0.048 | 0.017 | 0.998 (0.949-1.050) | 0.950 | |
| Tumor Size | <0.001 | <0.001 | ||||
| ≤2 cm | 714 | 0.065 | 0.021 | Reference | ||
| 2-4 cm | 4600 | 0.058 | 0.014 | 1.102 (0.966-1.258) | 0.148 | |
| >4 cm | 5367 | 0.058 | 0.024 | 1.228 (1.076-1.400) | 0.002 | |
| Unknown | 2822 | 0.052 | 0.020 | 1.183 (1.033-1.354) | 0.015 | |
| Insurance status | <0.001 | <0.001 | ||||
| Insured | 10999 | 0.060 | 0.021 | Reference | ||
| Medicaid | 1790 | 0.041 | 0.015 | 1.094 (1.036-1.154) | 0.001 | |
| Uninsured/Unknown | 714 | 0.043 | 0.007 | 1.164 (1.074-1.262) | <0.001 | |
| Marital status | <0.001 | <0.001 | ||||
| Married | 7210 | 0.071 | 0.024 | Reference | ||
| Unmarried | 5662 | 0.038 | 0.014 | 1.116 (1.075-1.158) | <0.001 | |
| Unknown | 631 | 0.061 | 0.025 | 1.000 (0.919-1.089) | 0.997 | |
| County % with bachelor degree | <0.001 | 0.003 | ||||
| Below median | 5815 | 0.053 | 0.016 | Reference | ||
| Above median | 7688 | 0.060 | 0.023 | 0.941 (0.903-0.980) | ||
| County % with unemployed | 0.008 | 0.688 | ||||
| Below median | 6443 | 0.062 | 0.023 | Reference | ||
| Above median | 7060 | 0.052 | 0.017 | 0.992 (0.956-1.030) | ||
| County-level median household income | <0.001 | 0.182 | ||||
| Below median | 6532 | 0.053 | 0.018 | Reference | ||
| Above median | 6971 | 0.060 | 0.022 | 0.972 (0.932-1.013) | ||
| Residence area | 0.696 | NI | ||||
| Metropolitan | 12054 | 0.056 | 0.018 | |||
| Urban/rural | 1433 | 0.058 | 0.030 | |||
| Missing | 16 | 0.125 | NA | |||
| Radiotherapy | <0.001 | <0.001 | ||||
| Yes | 367 | 0.112 | 0.009 | Reference | ||
| No/Unknown | 13136 | 0.055 | 0.020 | 1.330 (1.194-1.483) | ||
| Chemotherapy | <0.001 | <0.001 | ||||
| Yes | 6671 | 0.084 | 0.024 | Reference | ||
| No/Unknown | 6832 | 0.030 | 0.014 | 2.509 (2.413-2.608) | ||
*, Other includes American Indian/Alaska Native, Asian/Pacific Islander, and unknown. PCSS: pancreatic cancer cause-specific survival; HR: hazard ratio; CI: confidence interval; NA: not applicable; NI: not included in multivariate survival analysis.
As shown in Table 4, after univariate analysis and multivariate Cox analyses, radiotherapy and chemotherapy were validated as independent positive predictors of survival in patients without surgery (all P < 0.001).
Subgroup analysis of the effect on PCSS of surgical procedures for the primary site, according to the primary site
As shown in Table 5, Kaplan-Meier analysis and multivariate Cox analyses showed that at each primary site, including the pancreatic head, body/tail, and other sites, patients receiving PSP had better survival than those receiving RN-PSP and NRN-PSP (all P < 0.001).
Univariate and multivariate Cox analyses of pancreatic cancer cause-specific survival according to primary site
| Variable | Total | Median survival (months) | 2-year PCSS | 5-year PCSS | Univariate analysis | Multivariate Cox analysis | |
|---|---|---|---|---|---|---|---|
| P | HR (95%CI) | P | |||||
| Surgical procedure of primary site | |||||||
| Primary Site: | |||||||
| Head | 5236 | 3 | <0.001 | <0.001 | |||
| Performed | 181 | 13 | 0.322 | 0.209 | Reference | ||
| Recommended but not performed | 95 | 2 | 0.037 | NA | <0.001 | 3.615 (2.759-4.737) | <0.001 |
| Not recommended | 4960 | 3 | 0.056 | 0.016 | <0.001 | 2.681 (2.249-3.197) | <0.001 |
| Body/Tail | 5113 | 3 | <0.001 | <0.001 | |||
| Performed | 165 | 38 | 0.633 | 0.405 | Reference | ||
| Recommended but not performed | 100 | 2 | 0.061 | 0.037 | <0.001 | 5.749 (4.275-7.730) | <0.001 |
| Not recommended | 4848 | 3 | 0.061 | 0.022 | <0.001 | 4.926 (3.952-6.141) | <0.001 |
| Other | 3899 | 2 | <0.001 | <0.001 | |||
| Performed | 68 | 53 | 0.586 | 0.487 | Reference | ||
| Recommended but not performed | 125 | 1 | 0.050 | NA | <0.001 | 5.872 (3.947-8.735) | <0.001 |
| Not recommended | 3706 | 2 | 0.057 | 0.019 | <0.001 | 5.197 (3.644-7.414) | <0.001 |
| Surgical Procedure of Other Sites | |||||||
| Primary Site: | |||||||
| Heada | 5235 | 3 | <0.001 | <0.001 | |||
| Not performed | 5022 | 3 | 0.058 | 0.019 | Reference | ||
| Liver resection | 125 | 8 | 0.239 | 0.140 | <0.001 | 0.519 (0.426-0.633) | <0.001 |
| Other resection | 88 | 8 | 0.196 | 0.103 | <0.001 | 0.549 (0.436-0.691) | <0.001 |
| Body/Tailb | 5111 | 3 | <0.001 | <0.001 | |||
| Not performed | 4926 | 3 | 0.069 | 0.028 | Reference | ||
| Liver resection | 106 | 11 | 0.372 | 0.229 | <0.001 | 0.395 (0.314-0.497) | <0.001 |
| Other resection | 79 | 13 | 0.382 | 0.245 | <0.001 | 0.376 (0.287-0.492) | <0.001 |
| Otherc | 3895 | 2 | <0.001 | <0.001 | |||
| Not performed | 3787 | 2 | 0.060 | 0.024 | Reference | ||
| Liver resection | 57 | 7 | 0.283 | 0.136 | <0.001 | 0.513 (0.383-0.687) | <0.001 |
| Other resection | 51 | 11 | 0.298 | 0.201 | <0.001 | 0.413 (0.299-0.568) | <0.001 |
| Radiotherapyd | |||||||
| Primary Site: | |||||||
| Head | 4899 | 3 | <0.001 | <0.001 | |||
| Yes | 173 | 6 | 0.103 | NA | Reference | ||
| No/Unknown | 4726 | 3 | 0.052 | 0.018 | 1.431 (1.225-1.673) | ||
| Body/Tail | 4856 | 3 | <0.001 | <0.001 | |||
| Yes | 111 | 5 | 0.122 | 0.030 | Reference | ||
| No/Unknown | 4745 | 2 | 0.060 | 0.023 | 1.439 (1.184-1.750) | ||
| Other | 3748 | 2 | <0.001 | <0.001 | |||
| Yes | 83 | 8 | 0.121 | NA | Reference | ||
| No/Unknown | 3665 | 2 | 0.053 | 0.019 | 1.736 (1.377-2.190) | ||
| Chemotherapyd | |||||||
| Primary Site: | |||||||
| Head | 4899 | 3 | <0.001 | <0.001 | |||
| Yes | 2453 | 7 | 0.077 | 0.018 | Reference | ||
| No/Unknown | 2446 | 1 | 0.031 | 0.014 | 2.572 (2.422-2.731) | ||
| Body/Tail | 4856 | 3 | <0.001 | <0.001 | |||
| Yes | 2579 | 6 | 0.088 | 0.028 | Reference | ||
| No/Unknown | 2277 | 1 | 0.031 | 0.017 | 2.540 (2.390-2.699) | ||
| Other | 3748 | 2 | <0.001 | <0.001 | |||
| Yes | 1639 | 6 | 0.089 | 0.029 | Reference | ||
| No/Unknown | 2109 | 1 | 0.027 | 0.012 | 2.456 (2.291-2.632) | ||
a, Excluding one patient in whom surgical procedures of other sites was unknown. b, Excluding two patients in whom surgical procedures of other sites was unknown. c, Excluding four patients in whom surgical procedures of other sites was unknown. d, Patients who did not undergo resection. PCSS: pancreatic cancer cause-specific survival; HR: hazard ratio; CI: confidence interval; NA: not applicable.
Subgroup analysis of the effect on PCSS of surgical procedures for other sites, according to the primary site
As shown in Table 5, Kaplan-Meier and multivariate Cox analyses showed that at each primary site, including the pancreatic head, body/tail, and other sites, patients receiving NR had a worse survival than those in the liver resection and other resection groups (all P < 0.001).
Subgroup analysis of the effect on PCSS of radiotherapy in patients without surgery, according to the primary site
As shown in Table 5, Kaplan-Meier and multivariate Cox analyses all showed that at each primary site, including the pancreatic head, body/tail, and other sites, patients receiving WSR had better survival than those with N-WSR (all P < 0.001).
Subgroup analysis of the effect on PCSS of chemotherapy in patients without surgery, according to the primary site
As shown in Table 5, Kaplan-Meier and multivariate Cox analyses all showed that at each primary site, including the pancreatic head, body/tail, and other sites, patients receiving WSC had better survival than those with N-WSC (all P < 0.001).
Subgroup analysis of the effect on PCSS of histology
As seen in Table 6, the 5-year PCSS was significantly different and gradually declined in the following groups: 49.7% in the SPL group, 39.1% in the SPO group, 24.6% in the SPS group, and 1.9% in the NR group (P < 0.001) (Figure 1A). The SPS, SPO, and SPL groups showed significantly and gradually longer median survival of 15, 34, and 54 months, respectively, compared with 3 months for the NR group (all P < 0.001) (Table 6). Compared with the NR group, mortalities were significantly and gradually declining in the SPS, SPO, and SPL groups, with hazard ratio (HR) 0.329 (95% confidence interval [CI], 0.281-0.386), 0.220 (95% CI, 0.164-0.294), and 0.162 (95% CI, 0.118-0.222), respectively (all P < 0.001) (Table 6).
Univariate and multivariate Cox analyses to evaluate pancreatic cancer cause-specific survival with histology and combined therapies
| Variable | Total | Median survival (months) | 2-year PCSS | 5-year PCSS | Univariate analysis | Multivariate Cox analysis | |
|---|---|---|---|---|---|---|---|
| P | HR (95%CI) | P | |||||
| Total | 13916 | 3 | <0.001 | <0.001 | |||
| No resection | 13503 | 3 | 0.057 | 0.019 | Reference | ||
| SPS | 232 | 15 | 0.392 | 0.246 | <0.001 | 0.329 (0.281-0.386) | <0.001 |
| SPL | 93 | 54 | 0.683 | 0.497 | <0.001 | 0.162 (0.118-0.222) | <0.001 |
| SPO | 88 | 34 | 0.551 | 0.391 | <0.001 | 0.220 (0.164-0.294) | <0.001 |
| Histology | |||||||
| Adenocarcinoma | 9973 | 3 | <0.001 | <0.001 | |||
| No resection | 9845 | 3 | 0.036 | 0.006 | Reference | ||
| SPS | 86 | 9 | 0.191 | 0.065 | <0.001 | 0.495 (0.394-0.621) | <0.001 |
| SPL | 20 | 8 | 0.343 | NA | <0.001 | 0.360 (0.215-0.614) | <0.001 |
| SPO | 22 | 11 | 0.333 | 0.133 | <0.001 | 0.361 (0.224-0.581) | <0.001 |
| Neuroendocrine carcinoma | 658 | 21 | <0.001 | <0.001 | |||
| No resection | 546 | 15 | 0.391 | 0.172 | Reference | ||
| SPS | 41 | NA | 0.863 | 0.549 | <0.001 | 0.290 (0.173-0.486) | <0.001 |
| SPL | 39 | NA | 0.873 | 0.665 | <0.001 | 0.193 (0.103-0.363) | <0.001 |
| SPO | 32 | NA | 0.746 | 0.607 | <0.001 | 0.278 (0.152-0.506) | <0.001 |
| Other | 3285 | 1 | <0.001 | <0.001 | |||
| No resection | 3112 | 1 | 0.062 | 0.030 | Reference | ||
| SPS | 105 | 15 | 0.367 | 0.283 | <0.001 | 0.312 (0.244-0.398) | <0.001 |
| SPL | 34 | 43 | 0.673 | 0.443 | <0.001 | 0.191 (0.115-0.318) | <0.001 |
| SPO | 34 | 24 | 0.486 | 0.312 | <0.001 | 0.251 (0.158-0.400) | <0.001 |
| SPS | 232 | 15 | 0.472a | 0.705 | |||
| No/Unknown | 97 | 15 | 0.420 | 0.352 | Reference | ||
| Chemoradiotherapy | 9 | 18 | 0.444 | NA | 0.839 | 1.084 (0.493-2.382) | 0.841 |
| Chemotherapy* | 124 | 15 | 0.362 | 0.178 | 0.423 | 1.152 (0.826-1.607) | 0.403 |
| Radiotherapy# | 2 | - | - | - | |||
| SPL | 93 | 54 | 0.182b | 0.198 | |||
| No/Unknown | 60 | NA | 0.749 | 0.589 | Reference | ||
| Chemoradiotherapy | 5 | 23 | 0.400 | NA | 0.615 | 1.480 (0.342-6.401) | 0.600 |
| Chemotherapy* | 26 | 42 | 0.321 | NA | 0.071 | 1.838 (0.945-3.576) | 0.073 |
| Radiotherapy# | 2 | - | - | - | |||
| SPO | 88 | 33 | 0.340c | 0.353 | |||
| No/Unknown | 38 | 53 | 0.673 | 0.438 | Reference | ||
| Chemoradiotherapy | 7 | 34 | 0.536 | 0.357 | 0.662 | 1.266 (0.426-3.768) | 0.671 |
| Chemotherapy* | 42 | 16 | 0.436 | 0.355 | 0.145 | 1.577 (0.849-2.929) | 0.149 |
| Radiotherapy# | 1 | - | - | - | |||
| No resection | 13503 | 3 | <0.001 | <0.001 | |||
| No/Unknown | 6736 | 1 | 0.029 | 0.015 | Reference | ||
| Chemoradiotherapy | 271 | 8 | 0.119 | 0.011 | <0.001 | 0.332 (0.292-0.377) | <0.001 |
| Chemotherapy* | 6400 | 6 | 0.083 | 0.025 | <0.001 | 0.394 (0.379-0.408) | <0.001 |
| Radiotherapy# | 96 | 3 | 0.091 | NA | <0.001 | 0.569 (0.462-0.699) | <0.001 |
*, No/unknown radiotherapy. #, No/unknown chemotherapy. a, Analysis did not include the radiotherapy group because there were only two patients who received radiotherapy. b, Analysis did not include the radiotherapy group because there were only two patients who received radiotherapy. c, Analysis did not include the radiotherapy group because there was only one patient who received radiotherapy. PCSS: pancreatic cancer cause-specific survival; HR: hazard ratio; CI: confidence interval; SPL: synchronous resection of the primary tumor and liver metastases; SPO: synchronous primary tumor and other resection; SPS: single resection of the primary site; NA: not applicable.
Survival curves in patients with pancreatic cancer and liver metastases treated with different surgical procedures. (A) Overall: χ2 = 113.429, P < 0.001; (B) Adenocarcinoma: Log rank χ2 = 84.148, P < 0.001; (C) Neuroendocrine carcinoma: Log rank χ2 = 74.889, P < 0.001; (D) Other: Log rank χ2 = 220.033, P < 0.001. SPL: synchronous resection of the primary tumor and liver metastases; SPO: synchronous primary tumor and other resection; SPS: single resection of the primary site; NR: no resection.
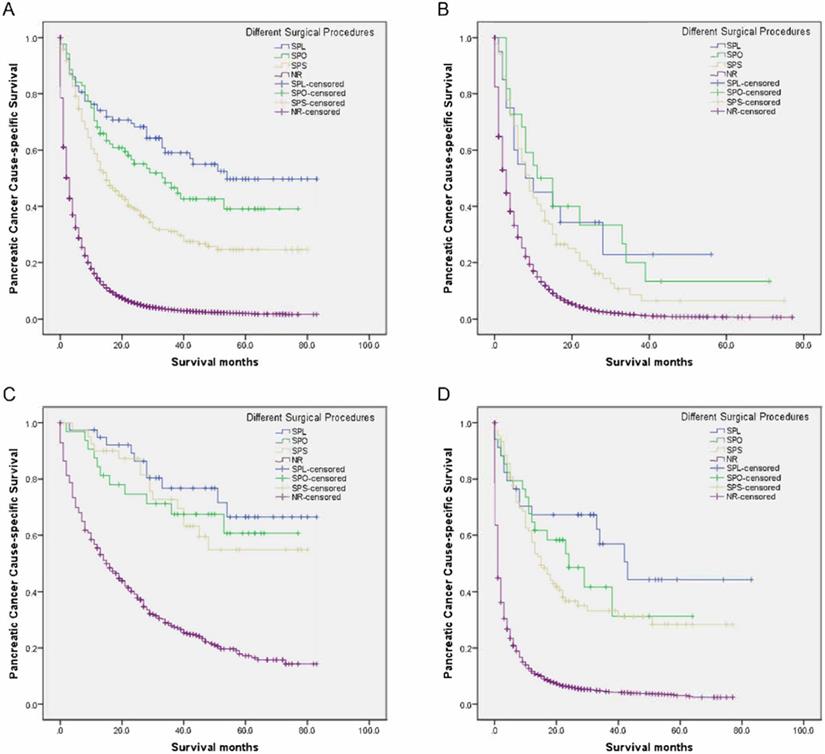
Compared with the NR group, there had increasingly improved survival benefits of 2-year PCSS for SPS, SPO, and SPL among adenocarcinoma, neuroendocrine carcinoma, or other groups (all P < 0.05) (Table 6, Figure 1B-D). Moreover, compared with the NR group, mortalities were significantly and gradually declining for SPS, SPO, and SPL among the adenocarcinoma, neuroendocrine carcinoma, or other groups (all P < 0.05) (Table 6).
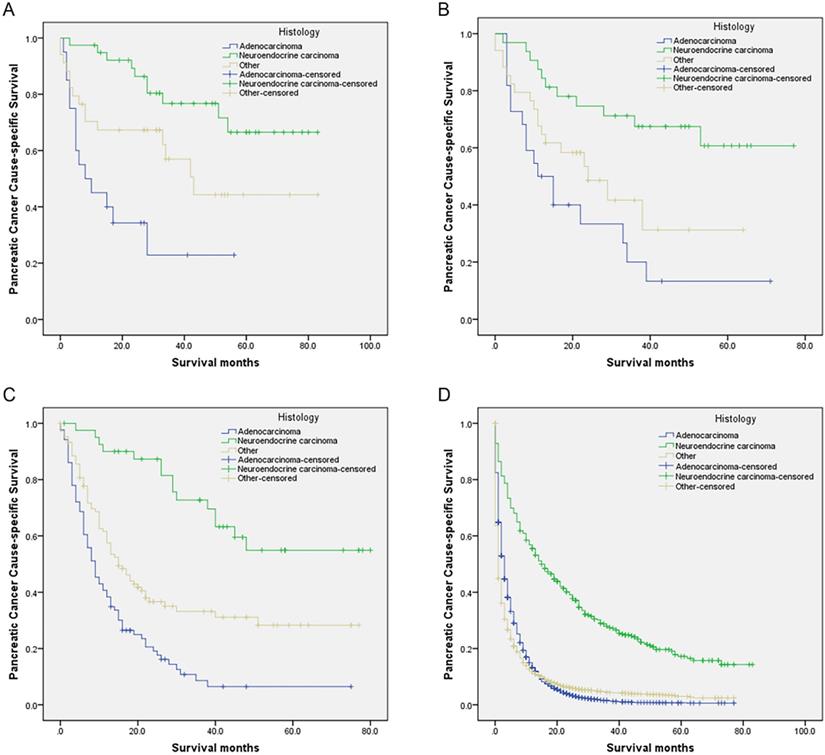
Compared with the neuroendocrine carcinoma group, those who receiving SPS, SPO, SPL, or NR all had gradually worse PCSS for other histology and adenocarcinoma groups (all P < 0.05) (Table 6, Figure 2A-D). Moreover, compared with the neuroendocrine carcinoma group, mortalities were all significantly and gradually increased for other histology and adenocarcinoma groups receiving SPS, SPO, SPL, or NR (all P < 0.05) (Table 6).
Survival curves in patients with pancreatic cancer and liver metastases treated with different histology. (A) SPL: χ2 = 19.873, P < 0.001; (B) SPO: Log rank χ2 = 14.658, P < 0.001; (C) SPS: Log rank χ2 = 47.873, P < 0.001; (D) NR: Log rank χ2 = 634.958, P < 0.001. Abbreviations: SPL: synchronous resection of the primary tumor and liver metastases; SPO: synchronous primary tumor and other resection; SPS: single resection of the primary site; NR: no resection.
Subgroup analysis of the effect on PCSS of combined surgery and adjuvant therapy
Compared with patients receiving no/unknown adjuvant therapy, there were no significant differences in survival for chemoradiotherapy and chemotherapy with no/unknown radiotherapy among the SPL, SPO, or SPS groups in Kaplan-Meier and multivariate analyses with Cox regression (all P > 0.05) (Table 6).
Compared with patients receiving no/unknown adjuvant therapy, those with NR had increasingly improved survival benefits for radiotherapy with no/unknown chemotherapy, chemotherapy with no/unknown radiotherapy, and chemoradiotherapy (median survival: 1, 3, 6, and 8 months, respectively, all P < 0.001) (Table 6). Moreover, compared with patients receiving no/unknown adjuvant therapy, mortalities was significantly and gradually declining for the radiotherapy with no/unknown chemotherapy, chemotherapy with no/unknown radiotherapy, and chemoradiotherapy groups, with HR 0.569 (95% CI, 0.462-0.699, P < 0.001), 0.394 (95% CI, 0.379-0.408, P < 0.001), and 0.332 (95% CI, 0.292-0.377, P < 0.001), respectively (Table 6).
Discussion
Current therapeutic approaches for patients with M1 PC are palliative and mainly based on tumor cell targeting. Some palliative chemotherapies' for patients with M1 PC have recently been established, such as the use of fluorouracil, leucovorin, irinotecan, and oxaliplatin (FOLFIRINOX) or gemcitabine with nab-paclitaxel, which have shown an increased median OS of 11 and 8.5 months, respectively, compared with 6.7-7 months for single gemcitabine [5]; nevertheless, the survival outcome of patients with M1 PC remains poor.
Palliative resection for advanced pancreatic cancer is controversial. Tachezy et al. deemed that palliative resection for M1 PC was not advisable because of its lack of survival benefit (5.1 months [n = 22] vs. 5.8 months [n = 46]) and higher surgery-related morbidity (59% vs. 33%, P = 0.035) and mortality (27% vs. 7%, P = 0.049), compared with bypass surgery [18]. Macroscopically complete resection has been demonstrated to be one of the most important and protective prognostic factors for survival; however, the performance of additional vessel resections and/or synchronous metastasis resections should be carefully weighed to avoid increasing morbidity and mortality caused by these surgical procedures [19-21].
International guidelines do not recommend surgery for PC when distant metastasis has occurred [1,9]. Our outcomes showed that SPS was associated with significantly improved survival compared with no resection. The present rationale for proposing SPS in patients with PC and metastatic disease has been revisited in subgroup analyses. McKenzie et al. revealed significant survival benefits of 4.7 months in patients with M1 PC receiving SPS (median survival: 6.3 months, n = 92) compared with those who did not receive surgical resection (median survival: 1.6 months, n = 2606) [22].
Likewise, although synchronous resection for patients with PC and oligometastatic disease is controversial and not recommended in the international guidelines [1,9], with the increasing surgical safety of pancreatic and liver resection and unceasing pursuit for better survival in patients with M1 PC, SPL in carefully selected patients with PCL is being increasingly considered. Small studies, including case reports, have described the use of aggressive “curative” SPL in selected patients with PCL [10,23,24].
Two studies showed no survival benefit in PCL patients who underwent SPL, as compared with palliative bypass alone (median survival: 5.9 [n = 22] vs. 5.6 [n = 66] months; median survival: 6 [n = 11] vs. 4 [n = 22] months; all P > 0.05, respectively) [15,16].
Conversely, a previous study revealed significant survival benefits of 5.5 months in PCL patients who received SPL as compared with NR (median survival: 11.4 [n = 11] vs. 5.9 [n = 118] months; P = 0.0384) [13]. A retrospective multicentral analysis in six European pancreas centers reported that the median OS of patients after SPL tended to be significantly longer than in those with NR (median survival: 14.5 [n = 69] vs. 7.5 [n = 69] months; P < 0.001) [14].
This study showed that surgical procedures of both the primary site and other sites were independent positive prognostic factors for survival. On the one hand, a good survival effect was seen in this study in that the SPS group had a 12-month increase in median survival compared with the NR group (P < 0.001). On the other hand, the median survival of the liver resection and other resection groups had 5- and 6-month increased survival in comparison with the NR group, respectively (all P < 0.001). Furthermore, regardless of whether the primary site was at the head, body/tail, or another location, resection of both the primary site and of other sites all significantly improved survival as compared with the NR group.
In this study, the SPL group showed the best survival benefit, with a significant and gradual increase in median survival of 20, 39, and 51 months, respectively, compared with the SPO, SPS, and NR groups (all P < 0.001). The mortality risk in the NR group was the highest, over six times that of the SPL group, nearly five times that of the SPO group, and over three times that of the SPS group. The median survival of the SPL group in this study was superior to that of the abovementioned studies [13-16]. This difference may be owing to many factors including patients' performance status, surgical skills, perioperative management, management of operative indications, and in this study high rate of neuroendocrine carcinoma patients.
This study found that, among different histology groups, the neuroendocrine carcinoma group had the best survival for those who receiving SPS, SPO, SPL, or NR. On the contrary, the adenocarcinoma group had the worst survival. On the other hand, patients receiving SPL had a 29.7%, 42.4%, and 48.2% gradual increase in 2-year PCSS compared with whose receiving NR in adenocarcinoma, other histology, and neuroendocrine carcinoma groups respectively. In the study, we identified a total of 683 eligible PCL patients with neuroendocrine carcinoma. Fortunately, some of them, 112 (16.4%) received surgery, 39 (5.7%) underwent SPL, 32 (4.7%) received SPO, and 41 (6.0%) had SPS. PCL patients with neuroendocrine carcinoma after SPS, SPO, SPL were associated with gradual improved 5-year PCSS (54.9%, 60.7%, and 66.5%, respectively).
Another interesting finding of our study is that survival also improved in the other resection group. The median survival of the SPO group showed a 31-month increase compared with that of the NR group (P < 0.001). This finding is similar to a report by Shrikhande et al. that synchronous resection of interaortocaval lymph nodes (n = 9) and peritoneal metastases (n = 9) showed 7- and 21.1-month increase of median survival, respectively, compared with NR (n = 118) [13]. Because of improved survival owing to adjuvant therapy, this is recommended for patients who have PC with or without surgical resection in the international guidelines [1,9]; however, it is not mentioned as a treatment regimen for patients with M1 PC who receive synchronous multivisceral resection. Furthermore, clinical studies concerning the curative effect of adjuvant therapy in patients with M1 PC who receive synchronous multivisceral resection is very limited. Reportedly, postoperative chemotherapy and radiotherapy have no apparent influence on survival in patients with M1 PC who undergo synchronous multivisceral resection [19,22]. The conclusions of this study were consistent with the abovementioned outcomes; even chemoradiotherapy did not significantly prolong postoperative survival. It is worth investigating why the addition of adjuvant therapy in patients with M1 PC who receive synchronous multivisceral resection is not associated with improved prognosis.
We found that the RN-PSP group had an even worse survival than the NRN-PSP group. This may be owing to patients' heavy psychological burden, rejecting surgery, or a lack of palliative therapy.
Our study had several limitations. First, surgery-related morbidity and mortality are not included in the SEER database. Second, recurrence data were unknown. Third, the data for radiation or chemotherapy were denoted “No/Unknown”; this is somewhat unclear and means that in the analysis, we did not have a patient group that did not receive either therapy. Fourth, it is clear that all patients had liver metastasis without metastasis to other common sites, such as bone, lung, and brain; however, whether patients had an uncommon metastatic disease is unknown. Fifth, the sequence concerning chemotherapy and surgery was unavailable. Sixth, details of chemotherapy including medications and dosage were not provided. Finally, detailed information on liver metastases was unavailable, including tumor size, number, and site.
To our best knowledge, the sample sizes of patients with PCL who underwent SPL, SPO, and SPS in this study may be the largest to date. We revealed that surgical procedures of both the primary site and other sites were independent protective predictors for survival in patients with PCL. Among the different treatment regimens, SPL in particular provided a considerable survival benefit. Besides, adjuvant therapies were not associated with improved postoperative survival in patients with PCL.
According to recent evidence, several guiding principles should be followed when performing SPL in patients with PCL. Surgical procedures should be carried out at a high-volume PC center by a multi-disciplinary team including surgeons experienced in procedures involving the pancreas, liver, and so on; also, patients should have good performance status, no invasion of the adjacent vessels, and resectability in limited liver metastases.
Further studies may be required, to develop qualification criteria for which PC center is qualified to perform SPL and operative indications for which patients with PCL are appropriate for SPL. In this population-based study, among 14,248 patients with PCL, only 93 (0.7%) received SPL, with a satisfactory 5-year PCSS (49.7%). In the future, it can be expected that increasingly more well-selected patients could benefit from SPL.
Abbreviations
PC: pancreatic cancer; PCL: pancreatic cancer with liver metastases; SPL: synchronous resection of the primary tumor and liver metastases; SPO: synchronous primary tumor and other resection; SPS: single resection of the primary site; NR: no resection; PCSS: pancreatic cancer cause-specific survival; PSP: receiving surgery for the primary site; RN-PSP: recommended but did not undergo surgery for the primary site; NRN-PSP: not recommended and did not have surgery for the primary site; WSR: without surgery who received radiotherapy; N-WSR: without surgery who received no/unknown radiotherapy; WSC: without surgery who received chemotherapy; N-WSC: received no/unknown chemotherapy; SEER: Surveillance, Epidemiology, and End Results; HR: hazard ratio; CI: confidence interval; OS: overall survival; NA: not applicable; NI: not included in multivariate survival analysis.
Acknowledgements
The authors acknowledge the efforts of the SEER program in the creation of the SEER database.
Funding
This work was supported by the Project of Invigorating Health Care through Science, Technology and Education: Jiangsu Provincial Medical Youth Talent (QNRC2016331) and Yangzhou Social Development Project (YZ2018075).
Competing Interests
The authors have declared that no competing interest exists.
References
1. Tempero MA. NCCN Guidelines Updates: Pancreatic Cancer. J Natl Compr Canc Netw. 2019;17:603-5
2. Siegel RL, Miller KD, Jemal A. Cancer statistics, 2017. CA Cancer J Clin. 2017;67:7-30
3. Silverberg E, Lubera J. Cancer statistics, 1987. CA Cancer J Clin. 1987;37:2-19
4. Heinemann V, Haas M, Boeck S. Systemic treatment of advanced pancreatic cancer. Cancer Treat Rev. 2012;38:843-53
5. Conroy T, Desseigne F, Ychou M. et al. FOLFIRINOX versus gemcitabine for metastatic pancreatic cancer. N Engl J Med. 2011;364:1817-25
6. Moore MJ, Goldstein D, Hamm J. et al. Erlotinib plus gemcitabine compared with gemcitabine alone in patients with advanced pancreatic cancer: a phase III trial of the National Cancer Institute of Canada Clinical Trials Group. J Clin Oncol. 2007;25:1960-6
7. Allendorf JD, Lauerman M, Bill A. et al. Neoadjuvant chemotherapy and radiation for patients with locally unresectable pancreatic adenocarcinoma: feasibility, efficacy, and survival. J Gastrointest Surg. 2008;12:91-100
8. Seufferlein T, Porzner M, Becker T. et al. S3-guideline exocrine pancreatic cancer. Z Gastroenterol. 2013;51:1395-440
9. Tempero MA, Malafa MP, Behrman SW. et al. Pancreatic adenocarcinoma, version 2.2014: featured updates to the NCCN guidelines. J Natl Compr Canc Netw. 2014;12:1083-93
10. Klein F, Puhl G, Guckelberger O. et al. The impact of simultaneous liver resection for occult liver metastases of pancreatic adenocarcinoma. Gastroenterol Res Pract. 2012;2012:939350
11. Stein A, Bokemeyer C. How to select the optimal treatment for first line metastatic colorectal cancer. World J Gastroenterol. 2014;20:899-07
12. Pawlik TM, Vauthey JN, Abdalla EK. et al. Results of a single-center experience with resection and ablation for sarcoma metastatic to the liver. Arch Surg. 2006;141:537-543
13. Shrikhande SV, Kleeff J, Reiser C. et al. Pancreatic resection for M1 pancreatic ductal adenocarcinoma. Ann Surg Oncol. 2007;14:118-27
14. Tachezy M, Gebauer F, Janot M. et al. Synchronous resections of hepatic oligometastatic pancreatic cancer: disputing a principle in a time of safe pancreatic operations in a retrospective multicenter analysis. Surgery. 2016;160:136-44
15. Gleisner AL, Assumpcao L, Cameron JL. et al. Is resection of periampullary or pancreatic adenocarcinoma with synchronous hepatic metastasis justified? Cancer. 2007;110:2484-92
16. Takada T, Yasuda H, Amano H. et al. Simultaneous hepatic resection with pancreato-duodenectomy for metastatic pancreatic head carcinoma: does it improve survival? Hepatogastroenterology. 1997;44:567-73
17. Surveillance, Epidemiology, and End Results (SEER) Program (www.seer.cancer.gov) SEER*Stat Database: Incidence - SEER 18 Regs Custom Data (with additional treatment fields), Nov 2018 Sub (1975-2016 varying) - Linked To County Attributes - Total U.S, 1969-2017 Counties, National Cancer Institute, DCCPS, Surveillance Research Program, released April 2019, based on the November 2018 submission
18. Tachezy M, Bockhorn M, Gebauer F. et al. Bypass surgery versus intentionally incomplete resection in palliation of pancreatic cancer: is resection the lesser evil? J Gastrointest Surg. 2011;15:829-35
19. Burdelski CM, Reeh M, Bogoevski D. et al. Multivisceral resections in pancreatic cancer: identification of risk factors. World J Surg. 2011;35:2756-63
20. Bockhorn M, Burdelski C, Bogoevski D. et al. Arterial en bloc resection for pancreatic carcinoma. Br J Surg. 2011;98:86-92
21. Bockhorn M, Cataldegirmen G, Kutup A. et al. Crossing the Rubicon: when pancreatic resection with curative intent ends in an R2 status. Impact of “desmoplastic pseudo-pancreatitis” and anatomical site of irresectability. Ann Surg Oncol. 2009;16:1212-21
22. McKenzie S, Mailey B, Artinyan A. et al. The incidence and outcomes of pancreatectomy in patients with metastatic pancreatic adenocarcinoma. JOP. 2010;11:341-7
23. Michalski CW, Erkan M, Hüser N. et al. Resection of primary pancreatic cancer and liver metastasis: a systematic review. Dig Surg. 2008;25:473-80
24. Dünschede F, Will L, von Langsdorf C. et al. Treatment of metachronous and simultaneous liver metastases of pancreatic cancer. Eur Surg Res. 2010;44:209-13
Author contact
![]() Corresponding author: Guo-Qing Jiang, Department of Hepatobiliary Surgery, Clinical Medical College, Yangzhou University, 98 West Nantong Rd, Yangzhou 225000, China. Tel: +86-514-87373382; E-mail: jgqing2003com.
Corresponding author: Guo-Qing Jiang, Department of Hepatobiliary Surgery, Clinical Medical College, Yangzhou University, 98 West Nantong Rd, Yangzhou 225000, China. Tel: +86-514-87373382; E-mail: jgqing2003com.