Impact Factor ISSN: 1837-9664

 Global reach, higher impact
J Cancer 2020; 11(22):6727-6736. doi:10.7150/jca.46871 This issue Cite
Research Paper
Personalizing prognostic prediction in early-onset Colorectal Cancer
Jian Liu, Zhengru Liu, Jiao Li, Shan Tian, Weiguo Dong ![]()
Department of Gastroenterology, Renmin Hospital of Wuhan University, Wuhan University, Wuhan, Hubei, 430060, China.
Received 2020-4-10; Accepted 2020-9-1; Published 2020-9-25
Abstract
Accurately estimating prognosis based on clinicopathologic variables could improve risk stratification for patients with early-onset colorectal cancer (EOCRC). Our primary goal was to create and validate a survival nomogram with adequate performance for predicting overall survival (OS) in patients with EOCRC. Least absolute shrinkage and selection operator (LASSO) Cox regression analysis was applied to identify clinical features statistically related to OS. Then we established and internally validated a survival nomogram based on surveillance, epidemiology and end results (SEER) database (N=23813). A cohort of 77 patients with EOCRC from Renmin Hospital of Wuhan University (RHWU) was employed to detect the external validity of the survival nomogram. Moreover, we compared the predictive accuracy of survival nomogram with TNM stage, and also compared the OS between endoscopy and surgery groups before and after propensity score matching (PSM) among EOCRC patients with early stage (Tis-T1N0M0). We selected seven informative indexes (N stage, M stage, perineural invasion, chemotherapy, surgery primary site, summary stage and tumor grade) for the construction of the survival nomogram. Then the survival nomogram exhibited good discrimination with C-index of 0.829, 0.841 and 0.796 in the SEER training, SEER validation and RHWU validation sets, respectively. Calibration curves showed good concordance between the survival nomogram predictions and actual outcomes for 1-year, 3-year and 5-year OS. Furthermore, the survival nomogram was superior to risk stratification by TNM stage in predicting OS among patients with EOCRC. Early-stage patients treated with endoscopy showed similar survival to those with surgery before and after PSM. We proposed a survival nomogram based on the extensively used parameters to precisely predict OS in EOCRC patients. This survival nomogram will contribute to aid oncologists better risk stratification and prognostication for patients with EOCRC.
Keywords: Early-onset colorectal cancer, Nomogram, TNM stage, Prognosis, Overall survival
Introduction
Colorectal cancer (CRC) has become the second most common cause of cancer-related death in the United States [1]. About 147,950 individuals will be newly diagnosed with CRC and 53,200 patients will die from CRC in 2020 [1]. The overall morbidity and mortality trends of CRC have evolved dramatically in recent years [2,3]. Due to the early detection of CRC with stool-based tests or colonoscopy, the incidence and mortality rates decreased among patients over the age of 50 [4,5]. However, recent studies have drawn attention to a slight increase both in the incidence and mortality rates of CRC in patients earlier than 50 years [6,7]. The incidence of CRC in younger patients increased from 0.01% in 2004 to 0.013% in 2016, and its mortality rate rose from 2.53 per 100,000 in 2004 to 2.97 per 100,000 in 2016 [6]. Moreover, the incidence of CRC in young patients is predicted to increase by as much as 142% by 2030 [8,9]. Unfortunately, there is no simple explanation for such an increase both in the incidence and mortality rates among younger patients with CRC [10].
Early-onset colorectal cancer (EOCRC) is a special subtype of CRC and our knowledge related to the etiology and mechanism of this subtype is far from being comprehensive [10-14]. EOCRC is defined as CRC diagnosed under the age of 50 with certain hereditary predisposition, which has distinct clinicopathological and molecular features compared with traditional CRC [15,16]. Mounting evidence [9,11,15,16] has demonstrated that EOCRC presents at a later TNM stage and possess a more aggressive histopathology. Most studies focused on the rising incidence of EOCRC from the Surveillance Epidemiology and End Results (SEER) database, but no current study focused attention on the potential factors affecting survival of EOCRC. Accurate estimation of survival among patients with cancer is always difficult, even for some experienced physicians [17]. A more precise estimation of survival tailored to individual patient with EOCRC is a potentially practical tool for clinicians. Nomogram is a kind of statistic tool that combines all significant prognostic indexes and represents with a simple graphical model [18,19]. Hence, creating a survival nomogram based on the key clinical parameters with good discrimination and calibration abilities is critical to improve the prognosis of patients with EOCRC.
In this present study, we aimed to establish and verify a survival nomogram integrating the accessible clinical features to improve prognostication for patients with EOCRC in clinical practice. We initially used LASSO Cox regression to screen variables showing both statistical and clinical significance in the SEER training set. Subsequently, the informative parameters were further integrated into the establishment of survival nomogram, and concordance index (C-index) was employed to evaluate the predictability of this nomogram in the SEER training and validation sets. Then, the predictive value of the survival nomogram was also validated in Renmin Hospital of Wuhan University (RHWU) validation set. Finally, we compared the predictive performance of the prognostic nomogram with TNM staging system which is extensively applied for accurate prognostication in clinical practice.
Materials and Methods
Study population
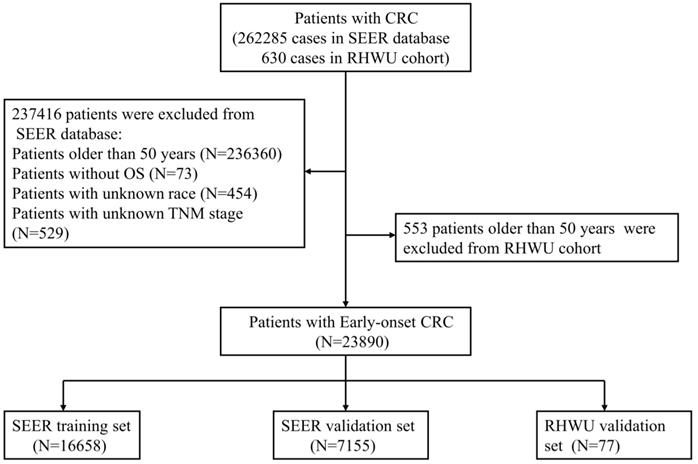
All patients with EOCRC from SEER database between 2010 and 2016 were retrospectively screened. A total of 262285 cases of CRC patients from SEER database were initially reviewed and 23813 patients with EOCRC were finally included into this study. The included patients were randomly assigned to SEER training set and SEER validation set according to the ratio of 7:3. Furthermore, patients' with EOCRC from RHWU was used as an external validation set to detect the generalizability of the survival nomogram. A total of 630 cases of CRC diagnosed between January 2015 and January 2020 were initially screened from RHWU and only 77 patients with EOCRC were finally incorporated into the RHWU validation set. The detailed selection process of EOCRC patients in both databases is shown in Figure 1. This study plan was checked before the initiation of the study by clinical institutional ethics board of our hospital.
The detailed selection process of patients with EOCRC.
Inclusion criteria
- Confirmed to be diagnosed with CRC according to histopathology;
- Under the age of 50;
- Patients with overall survival (OS) data.
Exclusion criteria
- Younger than 18 years old;
- Complicated with other malignant tumors;
- Loss of vital clinical and survival information.
Data collection
As our primary goal was to construct a survival nomogram with great practicability, so we retrospectively collected variables that were easily obtained in SEER database and our hospital. The following information of EOCRC patients was abstracted from databases: age, gender, primary tumor site, race, tumor grade, summary stage, TNM stage, T stage, N stage, M stage, tumor size and perineural invasion. Furthermore, we also obtained the therapeutic and survival data of the included patients, such as the surgery for primary site, radiotherapy, chemotherapy, OS.
Construction and validation of the survival nomogram
SEER training (N=16658) set was employed to create a survival nomogram. LASSO Cox regression analyses were applied to screen clinical features significantly related to OS. Statistically significant features by LASSO regression and clinically informative variables were required for final inclusion into the survival nomogram. Based on the final results of LASSO Cox regression, a survival nomogram including all the independent prognostic parameters was developed for prediction of 1-year, 3-year and 5-year OS. C‐index and calibration curves were exploited to evaluate the discriminative and calibration abilities of the survival nomogram. Time-dependent receiver operating characteristic (tdROC) analyses were performed to assess the predictive accuracy of the survival nomogram, and decision curve analysis (DCA) curve was plotted to further evaluate its clinical utility. SEER and RHWU validation sets were used to determine the internal and external validities of the survival nomogram. In order to compare the predictive performance of the survival nomogram with TNM stage, we divided the patients from SEER database into four groups based on the quartiles of predicted probability [20].
Statistical analysis
All statistical analyses were implemented with SPSS 22.0 and R 3.4.3 software. The categorical data were represented as number with percentage and tested with Chi-square, while continues variables were expressed as mean with standard deviation and examined by variance analysis. In addition, for the comparison of endoscopic treatment and surgical resection in early-stage (Tis-T1N0M0) patients with EOCRC, propensity score matching [21] (PSM) was performed to balance the basic features between two groups. P value less than 0.05 at two sides was viewed as statistically significant.
Results
Patients' baseline features
As displayed in Figure 1, a total of 23813 patients with EOCRC meeting the inclusion criteria from SEER database were identified into this analysis and randomly divided into the SEER training set (N=16658) and SEER validation set (N=7155). Moreover, 77 cases of patients with EOCRC from our hospital were included and used as an external validation set. As shown in Table 1, the mean age of EOCRC patients was 42.4 ± 6.2 (years) in the SEER training set, 42.4 ± 6.2 (years) in the SEER validation set, 43.2 ± 4.9 (years) in the RHWU validation set, and no significant differences were observed among the three sets as detected by analysis of variance (P=0.396). Moreover, the median survival time was 27.0 (12.0, 50.1) months in the SEER training set, 27.1 (12.0, 50.0) months in the SEER validation set and 45.0 (40.0, 47.0) months in the RHWU validation set. Other clinical and pathological features were listed in Table 1.
Clinical features of EOCRC patients in SEER and RHWU sets
| Characteristics | SEER training set (n=16658) | SEER validation set (n=7155) | RHWU validation set (n=77) | P value |
|---|---|---|---|---|
| Age (years) | 42.4±6.2 | 42.4±6.2 | 43.2±4.9 | 0.396 |
| Sex, male | 8826 (53.0%) | 3725 (52.1%) | 34 (44.2%) | 0.138 |
| Race | 0.011 | |||
| White | 12327 (74.0%) | 5328 (74.5%) | 47 (61.0%) | |
| Black | 2385 (14.3%) | 981 (13.7%) | 13 (16.9%) | |
| Others | 1946 (11.7%) | 846 (11.8%) | 17 (22.1%) | |
| Primary site | 0.429 | |||
| Colon | 10717 (64.3%) | 4600 (64.3%) | 55 (71.4%) | |
| Rectum | 5941 (35.7%) | 2555 (35.7%) | 22 (28.6%) | |
| Grade | 0.670 | |||
| Grade I/II | 13978 (83.9%) | 5971 (83.5%) | 65 (84.4%) | |
| Grade III/IV | 2680 (16.1%) | 1184 (16.5%) | 12 (15.2%) | |
| Summary stage | 0.216 | |||
| Localized | 5680 (34.1%) | 2457 (34.3%) | 31 (40.3%) | |
| Regional | 6483 (38.9%) | 2837 (39.7%) | 30 (39.0%) | |
| Distant | 4495 (27.0%) | 1861 (26.0%) | 16 (20.8%) | |
| TNM stage | 0.724 | |||
| Stage I | 4221 (25.3%) | 1782 (24.9%) | 11 (14.3%) | |
| Stage II | 2992 (18.0%) | 1333 (18.6%) | 20 (26.0%) | |
| Stage III | 5130 (30.8%) | 2243 (31.3%) | 30 (39.0%) | |
| Stage IV | 4315 (25.9%) | 1797 (25.1%) | 16 (20.8%) | |
| T stage | <0.001 | |||
| T0/Tis/T1/T2 | 6645 (39.9%) | 2820 (39.4%) | 12 (15.6%) | |
| T3/T4 | 10013 (60.1%) | 4335 (60.6%) | 65 (84.4%) | |
| N stage | <0.001 | |||
| N0/N1 | 13796 (82.8%) | 5907 (82.6%) | 31 (40.3%) | |
| N2/N3 | 2862 (17.2%) | 1248 (17.4%) | 46 (59.7%) | |
| M stage | 0.208 | |||
| M0 | 12344 (74.1%) | 5358 (74.9%) | 55 (80.5%) | |
| M1 | 4314 (25.9%) | 1797 (25.1%) | 22 (19.5%) | |
| Tumor size | <0.001 | |||
| <1 cm | 15810 (94.9%) | 6797 (95.0%) | 41 (53.2%) | |
| ≥1 cm | 848 (5.1%) | 358 (5.0%) | 36 (46.8%) | |
| Surgery for primary site | 13642 (81.9%) | 5966 (83.4%) | 67 (87.0%) | 0.012 |
| Radiotherapy | 4086 (24.5%) | 1775 (24.8%) | 1 (1.3%) | <0.001 |
| Chemotherapy | 10219 (61.3%) | 4361 (61.0%) | 7 (9.1%) | <0.001 |
| Perineural invasion | 1845 (11.1%) | 796 (11.1%) | 13 (16.9%) | 0.270 |
| Survival months median (IQR) | 27.0 (12.0, 50.1) | 27.1 (12.0, 50.0) | 45.0 (40.0, 47.0) | 0.156 |
EOCRC: early-onset colorectal cancer; TNM: tumor-node-metastasis; IQR: interquartile range.
Construction and verification of the survival nomogram in SEER database
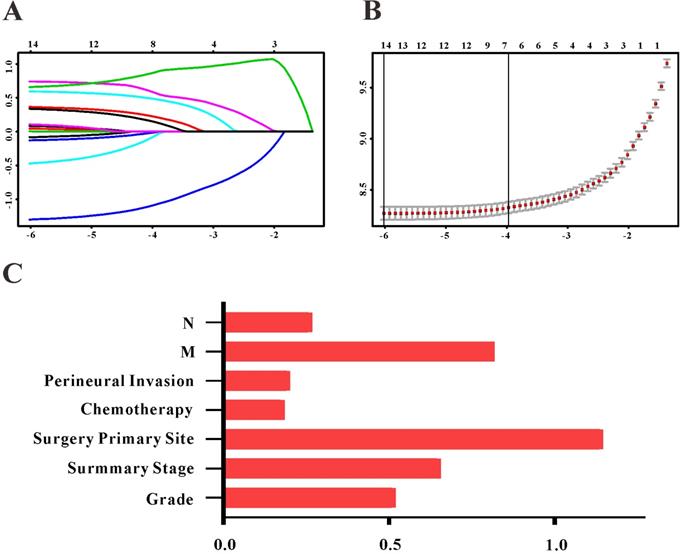
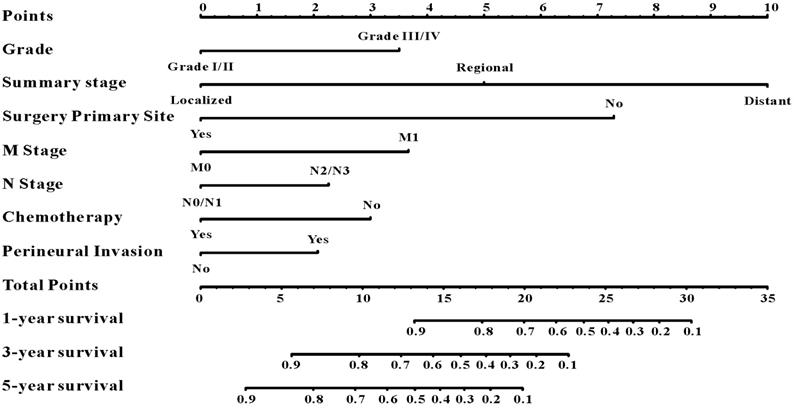
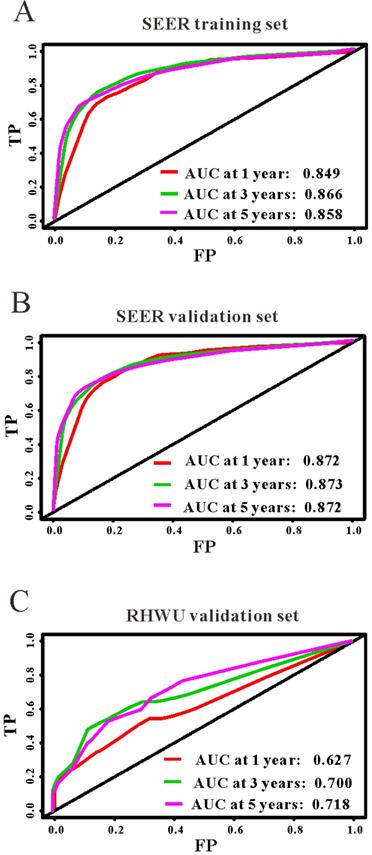
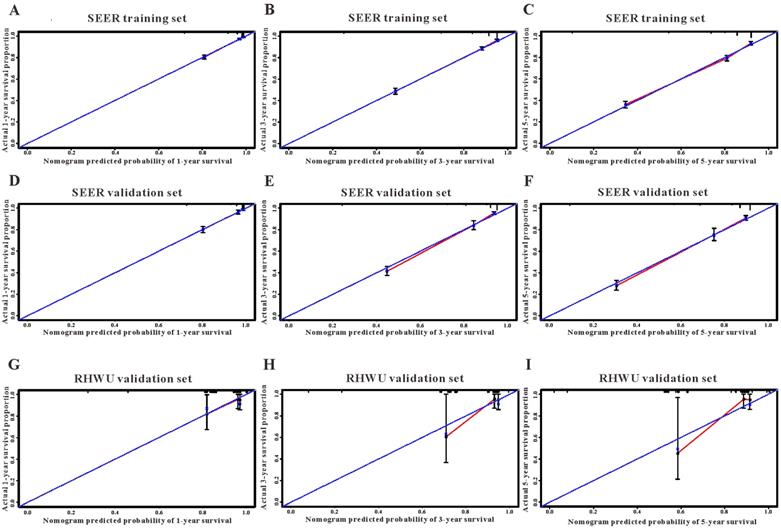
Based on the results of LASSO regression (Figure 2), seven features (N stage, M stage, perineural invasion, chemotherapy, surgery primary site, summary stage and tumor grade) statistically associated with OS were finally incorporated into the development of a survival nomogram in the SEER training set. As displayed in Figure 3, this survival nomogram was very intuitive to predict the 1-year, 3-year and 5-year survival rates of patients with EOCRC. In the SEER training set, the predictive ability of the survival nomogram as measured by C‐index to predict OS was 0.829 (95% CI, 0.821-0.837). More specifically, tdROC analyses (Figure 4A) revealed that the survival nomogram could accurately predicted the 1-year (AUC=0.849), 3-year (AUC=0.866) and 5-year (AUC=0.858) survival rates in patients with EOCRC. Figure 5A-C exhibited the calibration curves of the survival nomogram; plots were very close to the 45‐degree line, indicating that the survival nomogram was well calibrated in the SEER training set. DCA curve also demonstrated that the survival nomogram derived from the SEER training set was clinically useful (Figure 6A).
Selection of informative features using LASSO binary Cox regression model. (A) Profiles of LASSO coefficient for clinical and pathological features. (B) Identification of tuning parameter (λ) in the LASSO Cox model. (C) Each horizontal line represents a factor selection result for overall survival. Histogram shows the coefficients of individual features that contribute to the survival nomogram.
A survival nomogram for predicting 1-year, 3-year and 5-year survival rates of EOCRC patients.
The predictive performances of the survival nomogram for predicting 1-year, 3-year and 5-year overall survival in EOCRC. ROC curves displayed that this survival nomogram discriminated well in SEER training set (A), SEER validation set (B) and RHWU validation set (C).
The calibration curves for predicting overall survival in SEER and RHWU sets. (A-C) Calibration plots of 1-year, 3-year and 5-year mortality in SEER training cohort; (D-F) calibration plots of 1-year, 3-year and 5-year mortality in SEER validation cohort; (G-I) calibration plots of 1-year, 3-year and 5-year mortality in RHWU validation cohort.
Decision curves analysis (DCA) for the survival nomogram and TNM stage to predict overall survival. (A) The DCA of nomogram and TNM stage for overall survival in SEER training cohort; (B) the DCA of nomogram and TNM stage for overall survival in SEER validation cohort; (C) the DCA of the survival nomogram and TNM stage for overall survival in RHWU validation cohort.
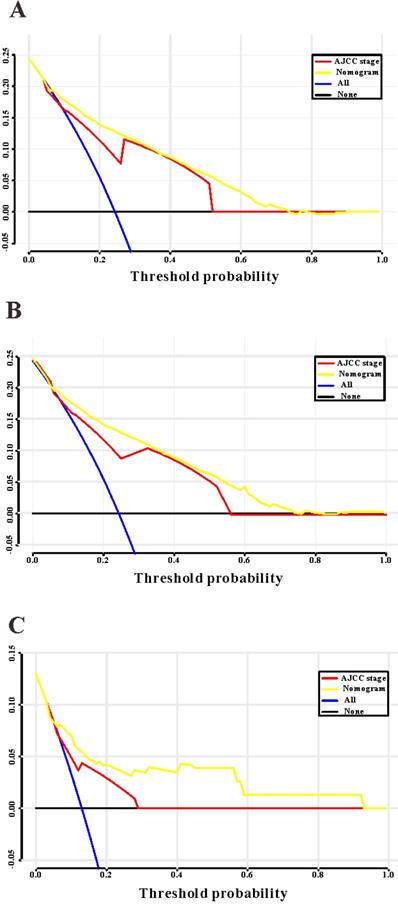
Similarly, the survival nomogram also obtained good discrimination as demonstrated by C-index of 0.841 (95%CI=0.829-0.853) to predict OS in patients with EOCRC in the SEER validation set. Specifically, tdROC curves (Figure 4B) displayed that the survival nomogram possessed excellent predictive performances for 1-year, 3-year and 5-year survival, as reflected by an AUC of 0.872, 0.873 and 0.872, respectively. To evaluate the calibration of the survival nomogram, we compared the predicted 1-year, 3-year and 5-year survival probabilities with the correspondingly actual observations. As shown in Figure 5D-F, the calibration curves of the survival nomogram exhibited good concordance between the predicted probabilities and actual outcomes. Additionally, our DCA curve from the SEER validation set also proved that the survival nomogram was clinical utility (Figure 6B).
External validation of the survival nomogram with RHWU cohort
To detect the external validity of the survival nomogram, a cohort of 77 patients with EOCRC from our hospital served as RHWU validation set. The survival nomogram demonstrated an acceptable accuracy with the C-index of 0.796 (95%CI=0.621-0.970) in predicting OS among EOCRC patients. Moreover, tdROC curves (Figure 4C) were plotted to evaluate predictability of the survival nomogram at different time pints and the results were also encouraging. Subsequently, the high-quality calibration curves (Figure 5G-I) showed that the 1-year, 3-year and 5-year survival rates calculated by the survival nomogram were very consistent with the actual observations. The DCA results also demonstrated that the survival nomogram exhibited a favorable clinical applicability (Figure 6C).
Comparison of the survival nomogram with TNM stage
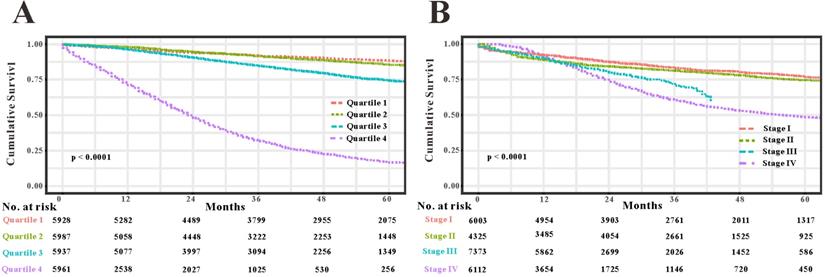
As TNM stage was commonly applied in clinical practice to estimate the prognosis in patients with CRC, so we compared predictability of the survival nomogram with TNM stage. TNM stage obtained acceptable predictive performances as indicated by C-index of 0.774 (95%CI=0.765-0.783) in the SEER training set, 0.777 (95%CI=0.764-0.800) in the SEER validation set and 0.693 (95%CI=0.507-0.808) in the RHWU validation set, respectively. Based on the C-index, we could conclude that the survival nomogram possessed significantly higher C-index than TNM stage. Furthermore, we used the quantiles of predicted probability in SEER database as the cutoff value to divide the patients with EOCRC into four groups. Kaplan‐Meier survival curves were generated to assess differences among the quantiles (Figure 7A) and each TNM stage (Figure 7B). Subsequently, integrated discrimination improvement (IDI) together with net reclassification index (NRI) were introduced into our analysis to compare the prediction efficiency of the survival nomogram and TNM stage in the SEER training set. As illustrated in Table 2, the addition of the survival nomogram could greatly improve the risk reclassification of OS over TNM stage. Taken together, we confirmed that discrimination ability of the survival nomogram was superior to TNM stage in predicting the prognosis of patients with EOCRC.
Compare the predictive accuracy of the survival nomogram with TNM stage. (A) Kaplan-Meier curves of the quartiles of EOCRC patients stratified by the survival nomogram predicted probabilities in SEER database. (B) Kaplan-Meier curves of four groups divided by each TNM stage.
Risk reclassification of overall survival by IDI and NRI in SEER training set
| Outcome | AUC | IDI | Total continuous NRI | |||||
|---|---|---|---|---|---|---|---|---|
| Biomaker | Biomaker+clinical model | Clinical modela | P valueb | Value (95%CI) | P Value | Value (95%CI) | P Value | |
| Nomogram | 0.829 | 0.831 | 0.573 | <0.001 | 0.399 (0.382-0.415) | <0.001 | 0.573 (0.554-0.595) | <0.001 |
| TNM Stage | 0.774 | 0.786 | - | <0.001 | 0.333 (0.314-0.351) | <0.001 | 0.488 (0.461-0.510) | <0.001 |
| Nomogram +TNM | 0.834 | 0.837 | - | <0.001 | 0.463 (0.425-0.517) | 0.002 | 0.604 (0.587-0.622) | <0.001 |
AUC, area under the receiver-operating characteristic curve; IDI, integrated discrimination improvement; NRI, net reclassification index; OS, overall survival; TNM, tumor-node-metastasis;aThe clinical model for predicting OS are composed of age, gender, race, primary site, T stage, radiation and tumor size;
bBiomarker +clinical model versus clinical model.
Endoscopic treatment versus surgery for early-stage patients with EOCRC
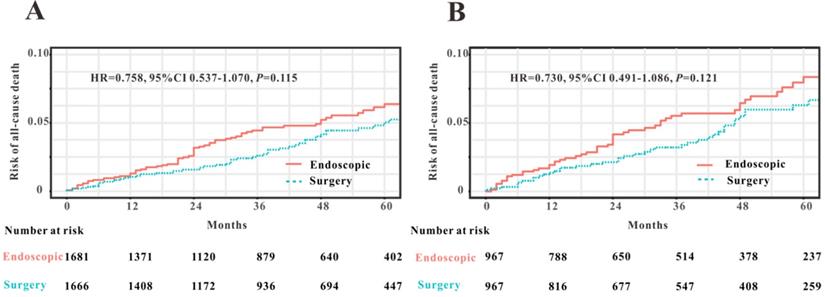
To compare the efficacy of endoscopy and surgical resection for the treatment of early-stage patients with EOCRC from SEER database, we initially applied PSM analysis to balance the clinical features between endoscopy versus surgery groups. A total of 3591 EOCRC patients with early stage (Tis-T1N0M0) were initially screened and 3347 early-stage patients with EOCRC were finally included into this PSM analysis. Four variables were selected for PSM, including age, gender, race and primary site. We found that all the clinical variables were not statistically different between two groups (Table 3). Then Kaplan-Meier plotters were drew to assess the association between two therapy methods and OS (Figure 8). However, the log rank test revealed that no significant association between two therapy methods and OS was observed before PSM (HR=0.758, P=0.115) and after PSM (HR=0.730, P=0.121). Hence, we could conclude that endoscopic resection possessed comparable OS for the treatment of EOCRC patients with early stage (Tis and T1N0M0) to those treated by surgical resection.
Characteristics of early-stage patients with EOCRC before and after matching
| Characteristics | Before matching | After matching | ||||
|---|---|---|---|---|---|---|
| Surgical resection | Endoscopy | P value | Surgical resection | Endoscopy | P value | |
| No. of patients | 1666 | 1681 | - | 967 | 967 | - |
| Age at diagnosis | 42.8±6.0 | 41.8±6.8 | <0.001 | 42.4±6.6 | 42.6±6.3 | 0.371 |
| Sex | 0.790 | 0.237 | ||||
| Male | 806 (48.4) | 821 (48.8) | 464 (48.0) | 490 (50.7) | ||
| Female | 960 (51.6) | 860 (51.2) | 503 (52.0) | 477 (49.3) | ||
| Race | <0.001 | 0.641 | ||||
| White | 1281 (76.9) | 1153 (68.6) | 737 (76.2) | 715 (73.9) | ||
| Black | 213 (12.8) | 300 (17.8) | 99 (10.2) | 157 (16.2) | ||
| Others | 172 (10.3) | 228 (13.6) | 131 (13.5) | 95 (9.8) | ||
| Origin recode | 0.165 | 0.136 | ||||
| Hispanic or Latino | 255 (15.3) | 287 (17.1) | 166 (17.2) | 142 (14.7) | ||
| Not Hispanic or Latino | 1411 (84.7) | 1394 (82.9) | 801 (82.8) | 825 (85.3) | ||
| Primary site | <0.001 | 0.290 | ||||
| Colon | 1204 (72.3) | 588 (35.0) | 544 (56.3) | 567 (58.6) | ||
| Rectum | 462 (27.7) | 1093 (65.0) | 423 (43.7) | 400 (41.4) | ||
| Grade | <0.001 | 0.058 | ||||
| G1/G2 | 1550 (93.0) | 1628 (96.8) | 902 (93.3) | 920 (95.1) | ||
| G3/G4 | 116 (7.0) | 53 (3.2) | 65 (6.7) | 47 (4.9) | ||
| T stage | 0.001 | 0.651 | ||||
| Tis | 205 (12.3) | 339 (20.2) | 194 (20.1) | 230 (23.8) | ||
| T1A | 1298 (77.9) | 1149 (68.4) | 689 (71.3) | 628 (64.9) | ||
| T1B | 163 (9.8) | 193 (11.5) | 84 (8.7) | 109 (11.3) | ||
| Tumor size | 0.001 | 0.057 | ||||
| <1 cm | 1635 (98.1) | 1671 (99.4) | 948 (98.0) | 958 (99.1) | ||
| ≥1 cm | 31 (1.9) | 10 (0.6) | 19 (2.0) | 9 (0.9) | ||
| Radiation | <0.001 | 0.071 | ||||
| Yes | 112 (6.7) | 39 (2.3) | 55 (5.7) | 38 (3.9) | ||
| No/unknown | 1554 (93.3) | 1642 (97.7) | 912 (94.3) | 929 (96.1) | ||
| Chemotherapy | <0.001 | 0.079 | ||||
| Yes | 143 (8.6) | 50 (3.0) | 68 (7.0) | 49 (5.1) | ||
| No/unknown | 1523 (91.4) | 1631 (97.0) | 899 (93.0) | 918 (94.9) | ||
| Perineural Invasion | 0.093 | 0.414 | ||||
| Yes | 7 (0.4) | 2 (0.1) | 4 (0.4) | 2 (0.2) | ||
| No/unknown | 1659 (99.6) | 1679 (99.9) | 963 (99.6) | 965 (99.8) | ||
| Survival months | 41.0 (20.0, 61.0) | 37.0 (17.0, 58.0) | 0.008 | 41.0 (20.0, 61.0) | 38.0 (17.0, 59.0) | 0.066 |
| Death | 58 (3.5) | 73 (4.3) | 0.199 | 43 (4.4) | 56 (5.8) | 0.180 |
Comparison of overall survival in early-stage patients with EOCRC undergoing endoscopic resection and surgery before PSM (A) and after PSM (B).
Discussion
In this study, we identified seven clinical variables significantly related to OS. We constructed and internally validated a survival nomogram based on SEER database, and this nomogram exhibited good discrimination and calibration capabilities in predicting OS of patients with EOCRC. Moreover, RHWU cohort was used as an external validation set and our nomogram also performed well in predicting OS in this population. Finally, this survival nomogram outperformed TNM stage in prediction of OS, implying that our nomogram could facilitate the clinical evaluation of prognosis among EOCRC patients. As far as we concerned, this survival nomogram is the first reported in the literature for accurately predicting OS with good calibration ability in patients with EOCRC.
Although patients with EOCRC possess poor histology and tumor-metastasis predisposition [22], there is no definite conclusion whether patients with EOCRC display worse prognosis compared with traditional CRC patients. Andrea et al. [22] proposed that EOCRC patients exhibited a lower risk of CRC-specific death than patients with late-onset CRC after adjusting for certain clinical features. While, a comparative study [23] based on SEER database from 1991 to 1999 revealed that patients with EOCRC had similar 5-year CRC-specific survival in contrast to patients with late-onset CRC. Abdelsattar et al. [24] undertook a retrospective cohort study based on SEER database from 1999 to 2011 and they found that patients with EOCRC achieved more favorable CRC-specific survival than those with late-onset CRC. However, no study has specifically focused on the independent risk factors of OS in patients with EOCRC. Hence, we undertook this clinical study based on SEER database from 2010-2016, and identified seven informative features significantly associated with OS of patients with EOCRC. More importantly, we created and verified the first survival nomogram devoted to accurately predict OS in patients with EOCRC. In addition, our survival nomogram exhibited good predictive ability for OS in EOCRC patients (C-index of 0.829, 0.841 and 0.796 in the SEER training, SEER validation and RHWU validation sets, respectively), which was much higher than predictive value (C-index less than 0.75) of the nomogram for OS in traditional CRC patients [25-28].
TNM stage is a most commonly used staging system for CRC [29-31], and thus we compared some predictive indexes of the survival nomogram in the SEER database and RHWU cohort with that of TNM stage. We observed that the survival nomogram achieved better predictive efficiency as measured by C-indexes, IDI and NRI than TNM stage. Furthermore, we divided the patients with EOCRC in SEER database into four groups according to the predicted probabilities. Unsurprisingly, Kaplan-Meier curves displayed that the differences among four groups divided by the nomogram were more significant compared with that by TNM stage. It is reasonable that the survival nomogram fared better in predicting OS than TNM stage. Previous studies [32-34] reported that some clinical features, such as demographic features, tumor histopathology, therapeutic regimens also played an important role in the evaluation of prognosis in patients with CRC. However, TNM stage did not take these informative factors into account. To the contrary, our survival nomogram integrated seven prognostic factors and could make more personalized prediction for patients with EOCRC.
Unlike other studies related to EOCRC [16,23,24], perineural invasion was first identified as an essential prognostic factor in patients with EOCRC. Perineural invasion refers to the tumor cells surround and infiltrate the nerve by more than 33% [35]. Perineural invasion can occur independently when there is no blood or lymph invasion, and sometimes may be the sole metastasis way for CRC [36]. Perineural invasion is a clinical sign of cancer metastasis and thus signifies the unfavorable prognosis of patients with CRC [37,38]. However, this clinical factor with great prognostic significance has never been explored in patients with EOCRC. This study revealed that the incidence of perineural invasion was 11.1% in patients with EOCRC from the SEER cohort and 16.9% in EOCRC patients from our cohort. More importantly, the LASSO regression analysis demonstrated the important prognostic role in patients with EOCRC.
In this study, we used RHWU cohort as an external validation set to verify the survival nomogram derived from SEER database. External validation is an indispensable step which integrates the nomogram into the different study population [39]. External validation could detect the generalizability of the survival nomogram and ultimately avoid poor goodness-of-fit [40]. The survival nomogram obtained an acceptable predictive performance in RHWU validation set, indicating that our nomogram possessed favorable generalizability.
Several limitations still exist in the present study. First, the sample size of RHWU validation set in our analysis was relatively small, which limited the generalizability of our survival nomogram. The small sample size of RHWU validation set led to the acceptable rather than excellent predictive performance. Moreover, both the SEER database and RHWU cohort were retrospective studies, and thus inherent biases were more or less unavoidable. Then, some clinical features, such as serum CEA and microsatellite state, are also important in the estimation of survival of EOCRC. Unfortunately, these variables were not accessible from SEER database, which might discount the accuracy of our survival nomogram. Therefore, prospective researches with large study population from multiple hospitals are further necessary to provide more convincing evidences in the future.
Conclusions
The survival nomogram based on the most accessible clinical features could precisely predict the survival of individual patients with EOCRC, highly outperforming the predictive accuracy of TNM stage. This survival nomogram will contribute to aid oncologists better risk stratification and prognostication for patients with EOCRC.
Abbreviations
EOCRC: early-onset colorectal cancer; LASSO: least absolute shrinkage and selection operator; OS: overall survival; SEER: surveillance, epidemiology and end results; TNM: tumor-node-metastasis; IQR: interquartile range; AUC: area under the curve; IDI: integrated discrimination improvement; NRI: net reclassification index.
Acknowledgements
We would like to thank Dr. Vikash for English language editing.
Competing Interests
The authors have declared that no competing interest exists.
References
1. Siegel RL, Miller KD, Goding Sauer A. et al. Colorectal cancer statistics, 2020. CA: a cancer journal for clinicians. 2020:10-3322
2. Ferlay J, Colombet M, Soerjomataram I. et al. Estimating the global cancer incidence and mortality in 2018: GLOBOCAN sources and methods. Int J cancer. 2019;144(8):1941-1953
3. Murphy CC, Singal AG. Establishing a research agenda for early-onset colorectal cancer. Plos Med. 2018;15(6):e1002577
4. Murphy CC, Sandler RS, Sanoff HK. et al. Decrease in Incidence of Colorectal Cancer Among Individuals 50 Years or Older After Recommendations for Population-based Screening. Clinical gastroenterology and hepatology. 2017;15(6):903-909
5. Meester RGS, Doubeni CA, Lansdorp-Vogelaar I. et al. Colorectal cancer deaths attributable to nonuse of screening in the United States. Ann Epidemiol. 2015;25(3):208-213
6. Doubeni CA. Early-onset colorectal cancer: What reported statistics can and cannot tell us and their implications. Cancer. 2019;125(21):3706-3708
7. Siegel RL, Medhanie GA, Fedewa SA. et al. State Variation in Early-Onset Colorectal Cancer in the United States, 1995-2015. Journal of the National Cancer Institute. 2019;111(10):1104-1106
8. Bailey CE, Hu C, You YN. et al. Increasing disparities in the age-related incidences of colon and rectal cancers in the United States, 1975-2010. JAMA Surg. 2015;150(1):17-22
9. Cavestro GM, Mannucci A, Zuppardo RA. et al. Early onset sporadic colorectal cancer: Worrisome trends and oncogenic features. Digestive and liver disease. 2018;50(6):521-532
10. Cavestro GM, Zuppardo RA, Mannucci A. Early-onset colorectal cancer: trends and challenges. The lancet. Gastroenterology & hepatology. 2019;4(7):491-492
11. Silla IO, Rueda D, Rodríguez Y. et al. Early-onset colorectal cancer: a separate subset of colorectal cancer. World J Gastroentero. 2014;20(46):17288-17296
12. Hofseth LJ, Hebert JR, Chanda A. et al. Early-onset colorectal cancer: initial clues and current views. Nature reviews. Gastroenterology & hepatology. 2020:10-1038
13. Zhang Q, Berger FG, Love B. et al. Maternal stress and early-onset colorectal cancer. Med hypotheses. 2018;121:152-159
14. Liu P, Wu K, Ng K. et al. Association of Obesity With Risk of Early-Onset Colorectal Cancer Among Women. JAMA Oncol. 2019;5(1):37-44
15. Willauer AN, Liu Y, Pereira AAL. et al. Clinical and molecular characterization of early-onset colorectal cancer. Cancer. 2019;125(12):2002-2010
16. Yeo H, Betel D, Abelson JS. et al. Early-onset Colorectal Cancer is Distinct From Traditional Colorectal Cancer. Clin Colorectal Canc. 2017;16(4):293-299
17. Glare P, Virik K, Jones M. et al. A systematic review of physicians' survival predictions in terminally ill cancer patients. BMJ. 2003;327(7408):195-198
18. Iasonos A, Schrag D, Raj GV. et al. How to build and interpret a nomogram for cancer prognosis. Journal of clinical oncology. 2008;26(8):1364-1370
19. Balachandran VP, Gonen M, Smith JJ. et al. Nomograms in oncology: more than meets the eye. The Lancet. Oncology. 2015;16(4):e173-e180
20. Li J, Gu J, Ma X. et al. Development and validation of a nomogram for predicting survival in Chinese han patients with resected colorectal cancer. J Sugr Oncol. 2018;118(6):1034-1041
21. Duhamel A, Labreuche J, Gronnier C. et al. Statistical Tools for Propensity Score Matching. Ann Surg. 2017;265(6):E79-E80
22. Burnett-Hartman AN, Powers JD, Chubak J. et al. Treatment patterns and survival differ between early-onset and late-onset colorectal cancer patients: the patient outcomes to advance learning network. Cancer causes & control. 2019;30(7):747-755
23. O'Connell JB, Maggard MA, Liu JH. et al. Do young colon cancer patients have worse outcomes? World J Sugr. 2004;28(6):558-562
24. Abdelsattar ZM, Wong SL, Regenbogen SE. et al. Colorectal cancer outcomes and treatment patterns in patients too young for average-risk screening. Cancer. 2016;122(6):929-934
25. Sjoquist KM, Renfro LA, Simes RJ. et al. Personalizing Survival Predictions in Advanced Colorectal Cancer: The ARCAD Nomogram Project. J Natl Cancer Inst. 2018;110(6):638-648
26. Zhang J, Gong Z, Gong Y. et al. Development and validation of nomograms for prediction of overall survival and cancer-specific survival of patients with Stage IV colorectal cancer. Jpn J Clin Oncol. 2019;49(5):438-446
27. Fernandez MA, Lopez LC, Argiles MG. et al. Prognostic Nomogram and Patterns of Use of FOLFIRI-Aflibercept in Advanced Colorectal Cancer: A Real-World Data Analysis. Oncologist. 2019;24(8):e687-e695
28. Kim C, Kim WR, Kim KY. et al. Predictive Nomogram for Recurrence of Stage I Colorectal Cancer After Curative Resection. Clin Colorectal Cancer. 2018;17(3):e513-e518
29. Ahmed Farag AF, Elbarmelgi MY, Azim HA. et al. TNMF versus TNM in staging of colorectal cancer. Int J Surg. 2016;27:147-150
30. Obrocea FL, Sajin M, Marinescu EC. et al. Colorectal cancer and the 7th revision of the TNM staging system: review of changes and suggestions for uniform pathologic reporting. Rom J Morphol Embryol. 2011;52(2):537-544
31. Weiser MR. AJCC 8th Edition: Colorectal Cancer. Ann Surg Oncol. 2018;25(6):1454-1455
32. Barton MK. Primary tumor location found to impact prognosis and response to therapy in patients with metastatic colorectal cancer. CA: a cancer journal for clinicians. 2017;67(4):259-260
33. Burki TK. Risk prediction equations for survival in colorectal cancer. The Lancet Oncology. 2017;18(8):e437
34. Chang GJ, Gonen M. Prognostic and Predictive Ability of Tumor Sidedness: Another Vexing Difference Between Localized and Advanced Colon Cancer. JAMA Oncol. 2017;3(10):1314-1315
35. Alotaibi AM, Lee JL, Kim J. et al. Prognostic and Oncologic Significance of Perineural Invasion in Sporadic Colorectal Cancer. Ann Surg oncol. 2017;24(6):1626-1634
36. Chen SH, Zhang BY, Zhou B. et al. Perineural invasion of cancer: a complex crosstalk between cells and molecules in the perineural niche. Am J Cancer Res. 2019;9(1):1-21
37. Huang X, Liu J, Wu G. et al. Development and Validation of a Nomogram for Preoperative Prediction of Perineural Invasion in Colorectal Cancer. Med Sci Monit. 2019;25:1709-1717
38. Huang Y, He L, Dong D. et al. Individualized prediction of perineural invasion in colorectal cancer: development and validation of a radiomics prediction model. Chin J Cancer Res. 2018;30(1):40-50
39. Desai RJ, Wang SV, Vaduganathan M. et al. Comparison of Machine Learning Methods With Traditional Models for Use of Administrative Claims With Electronic Medical Records to Predict Heart Failure Outcomes. JAMA network open. 2020;3(1):e1918962
40. Liu J, Huang X, Yang W. et al. Nomogram for predicting overall survival in stage II-III colorectal cancer. Cancer Med. 2020:10-1002
Author contact
![]() Corresponding author: Weiguo Dong, No.99 Zhang Zhi-dong road, Wuhan 430060, China. Tel: +86-027-88041911, E-mail: dongweiguoedu.cn.
Corresponding author: Weiguo Dong, No.99 Zhang Zhi-dong road, Wuhan 430060, China. Tel: +86-027-88041911, E-mail: dongweiguoedu.cn.