Impact Factor ISSN: 1837-9664

 Global reach, higher impact
J Cancer 2020; 11(22):6484-6490. doi:10.7150/jca.40428 This issue Cite
Research Paper
Survival outcomes of low prostate-specific antigen levels and T stages in patients with high-grade prostate cancer: a population-matched study
Yongming Kang1,2*, Pan Song1*, Kun Fang1, Bo Yang1, Luchen Yang1, Jing Zhou1, Linchuan Wang1, Qiang Dong1 ![]()
1. Department of Urology, Institute of Urology, West China Hospital, Sichuan University, Chengdu, 610041, Sichuan Province, China.
2. Department of Urology, Suining Central Hospital, Suining, 629000, Sichuan Province, China.
*These authors contributed equally to this study.
Received 2019-9-18; Accepted 2020-7-18; Published 2020-9-17
Abstract
Objective: To evaluate the prostate cancer-specific survival (PCSS) of low T stages or low prostate-specific antigens (PSA) levels in men with high-grade prostate cancer.
Materials and Methods: Patients with non-metastatic prostate cancer (T1-4N0M0) and Gleason score 8-10 in the Surveillance, Epidemiology, and End Results database from 2004-2010 were identified. These men were stratified by T stages (T1, T2, T3a, T3b-4) and PSA levels (<4.0 ng/ml, 4.0-10.0 ng/ml, 10.1-20.0 ng/ml, >20.0 ng/ml). Propensity-score matching (PSM) was conducted to balance the covariates. Kaplan-Meier analysis and multivariable Cox regressions were performed to analyze the PCSS in different T stage or PSA levels groups.
Results: A total of 33231 patients aging 69(62~76) years were identified. The overall cohort results showed that the PCSS of T1 group was significantly worse than that of T2 and T3a groups [T2 HR: 0.62(0.57~0.67); T3 HR: 0.70(0.63~0.77)]. There were no significant difference between T2 and T3a groups [T2 HR: 0.98 (0.91~1.05)]. The PSA <4.0 ng/ml group had significantly worse PCSS than PSA 4.0-10.0 ng/ml [PSA 4.0-10.0 ng/ml HR: 0.77(0.68~0.88)]. PSM methods were implemented in the comparison of T1 vs T2, T1 vs T3a, T2 vs T3a. and PSA< 4.0 ng/ml vs PSA 4.0-10.0 ng/ml, The results in these matched cohorts showed that T1 group was associated with significantly worse PCSS than T2 group [T1 HR: 1.31(1.20~1.44)] and T3a group [T1 HR: 1.33(1.16~1.52)]. There were no significant differences between T2 and T3a groups [T3a HR: 1.14(0.99~1.32)]. The PCSS of patients with PSA< 4.0 ng/ml was significantly worse that these with PSA 4.0-10.0 ng/ml in the matched cohort [PSA< 4.0 ng/ml HR: 1.3(1.08~1.56)].
Conclusions: For patients with high-grade PCa, the PCSS of patients seems to be worse in the T1 stage than those in T2 and T3a stages. Patients with PSA <4.0 ng/ml appears to have poorer prognosis than those with PSA 4.0-10.0 ng/ml.
Keywords: Prostate cancer, Gleason score, Prostate-specific antigen, T stage, Prognosis
Introduction
Prostate cancer (PCa) is regarded as the most common malignant tumor of the male urogenital system and the second cause of cancer-related death in men, seriously threatening the life and health of patients in the world [1, 2]. It is estimated that, in 2020, there will be approximately 191,930 newly diagnosed men with PCa and 33,330 cases will be dead for PCa [3]. Due to the great harm of PCa, it is necessary to predict the prognosis of PCa in advance and distinguish the one with poor prognosis. Nowadays, Gleason score (GS), prostate-specific antigen (PSA) and clinical Tumor Node Metastasis (TNM) stages are considered as the most important factors that have significant impacts on the prognosis of PCa and the choices of treatments [4]. GS system reflects the histological classification of tumors. High-grade disease (GS 8-10) is an important indicator of the prognosis of patients with non-metastatic PCa [5], but might have fewer effects on the indication of metastatic lesions [6, 7]. The levels of pretreatment serum PSA reveal the burden of tumor cells, and have close relationships with the prognosis of patients. The TNM stages measure the size of the tumor and the extent of invasion, as well as metastasis. For non-metastatic PCa, all these factors are closely related to the risk classification and prognosis of PCa.
Though many novel predictors for the prognosis of PCa have been reported [8-10], the factors of GS, PSA levels and TNM stages remain the most commonly used indicators for the prognosis of PCa. Generally, patients with higher GS, PSA levels or TNM stages are associated with worse prostate cancer-specific survival (PCSS) [11]. However, there are some exceptions in the high-grade PCa according to the previously published articles. It was reported that patients with high-grade PCa and low PSA levels seem to have reduced survival outcomes [12-14]. As few studies have explored the prognosis of men with different T stages in high-grade diseases, it is unclear whether there are exceptions in the comparison of T stages in men with high-grade diseases. The aim of this study was to evaluate the prognostic differences among T stages (T1, T2, T3a, T3b-4) and PSA levels (PSA <4.0 ng/ml, 4.0-10.0 ng/ml, 10.1-20.0 ng/ml, 20.1-40.0 ng/ml, >40 ng/ml) in patients with non-metastatic high grade (T1-4N0M0 GS 8-10) PCa.
Materials and methods
Data source
The data of this study were derived from the Surveillance, Epidemiology and End Results (SEER) database with the software SEER* STAT. Patients with high-grade PCa diagnosed from January 1, 2004 to December 31, 2010 were retrospectively identified.
Selection criteria
Inclusion criteria: (1) patients were diagnosed with non-metastatic PCa (cT1-4N0M0). (2) High-grade (GS 8-10) was detected by needle core biopsy, transurethral resection of the prostate, or prostatectomy. (3) The PSA levels, clinical T stage were clearly known.
Exclusion criteria: (1) multiple tumor; (2) important information like age, follow-up time was unclear or incomplete. (3) The cancer-specific survival states at the end of follow-ups were unclear.
Variables and main outcomes
The following baseline characteristics were collected including age (<65, 65-75, >75), race (white, black, other race including American Indian and Asian/Pacific Islander), marital status (married, unmarried, divorced or separated), T stage (T1, T2, T3a, T3b-4), PSA levels (<4.0 ng/ml, 4.0-10.0 ng/ml, 10.1-20.0 ng/ml. >20.0 ng/ml), Gleason score (8,9-10), therapy (local treatments including radical prostatectomy and external beam radiotherapy, no local treatments), survival months, and prostate cancer-specific survival status (alive, dead for PCa, dead for other reasons). PCSS was regarded as the main outcome.
Statistical analyses
Baseline characteristics in different PSA level groups (<4.0 ng/ml, 4.0-10.0 ng/ml, 10.1-20.0 ng/ml, and >20.0 ng/mL) and T stage groups (T1, T2, T3a, T3b-4) were described. Kaplan-Meier analysis was introduced to assess the PCSS in different PSA levels and T stages groups and the survival curves were constructed. Univariate and multivariate Cox analysis were used to calculate hazard ratios (HR) and its 95% confidence interval (95% CI). For groups with similar PCSS results in the overall cohort, propensity-score matching (PSM) based on the nearest-neighbor matching principle was adopted to balance the covariates and generate the matched cohorts. The PCSS was reevaluated in the matched groups to verify the results in overall cohort. All statistical analyses were conducted in the software of SPSS 25.0 and Graph prism 7.0.
Results
Patients' characteristics
33,231 patients with a median age of 69 (62-76) years were included. The median follow-up time was 82 (62~109) months. The baseline characteristics of the included patients in PSA level groups and T stage groups were presented in Table 1. The PSM was conducted in the comparison of T1 vs T2, T1 vs T3a, T2 vs T3a and PSA <4.0 ng/ml vs PSA 4.0-10.0 ng/ml group. The basic characteristics of matched groups were shown in Table 2.
Baseline characteristics of patients in different T stage groups and PSA groups
| Characteristic | Total | T1 | T2 | T3a | T3b-T4 | PSA <4.0 ng/ml | PSA 4.0-10.0 ng/ml | PSA 10.1-20.0 ng/ml | PSA >20.0 ng/ml |
|---|---|---|---|---|---|---|---|---|---|
| N | 33231 | 15131 | 9759 | 4187 | 4154 | 2336 | 16309 | 7640 | 6946 |
| Age (years) | |||||||||
| Median (IQR) | 69 (62~76) | 73 (66~78) | 68 (62~75) | 64 (59~69) | 65 (59~71) | 68 (61~74) | 68 (62~74) | 71 (64~77) | 71 (63~78) |
| Age, n (%) | |||||||||
| <65 | 11962 (36) | 3576 (23.6) | 3839 (39.3) | 2383 (56.9) | 2164 (52.1) | 955 (40.9) | 6343 (38.9) | 2409 (31.5) | 2255 (32.5) |
| 65-75 | 12696 (38.2) | 6041 (39.9) | 3695 (37.9) | 1484 (35.4) | 1476 (35.5) | 883 (37.8) | 6709 (41.1) | 2796 (36.6) | 2308 (33.2) |
| >75 | 8573 (25.8) | 5514 (36.4) | 2225 (22.8) | 320 (7.6) | 514 (12.4) | 498 (21.3) | 3257 (20) | 2435 (31.9) | 2383 (34.3) |
| Race, n (%) | 955 (40.9) | 6343 (38.9) | 2409 (31.5) | 2255 (32.5) | |||||
| White | 25441 (76.6) | 10980 (72.6) | 7613 (78) | 3491 (83.4) | 3357 (80.8) | ||||
| Black | 5220 (15.7) | 2916 (19.3) | 1413 (14.5) | 394 (9.4) | 497 (12) | 1980 (84.8) | 12866 (78.9) | 5748 (75.2) | 4847 (69.8) |
| Others | 2274 (6.8) | 1060 (7) | 661 (6.8) | 281 (6.7) | 272 (6.5) | 246 (10.5) | 2260 (13.9) | 1194 (15.6) | 1520 (21.9) |
| Unclear | 296 (0.9) | 175 (1.2) | 72 (0.7) | 21 (0.5) | 28 (0.7) | 94 (4) | 1028 (6.3) | 627 (8.2) | 525 (7.6) |
| Marriage, n (%) | |||||||||
| Married | 22885 (68.9) | 9628 (63.6) | 6966 (71.4) | 3237 (77.3) | 3054 (73.5) | 1745 (74.7) | 11799 (72.3) | 5177 (67.8) | 4164 (59.9) |
| Unmarried | 3030 (9.1) | 1438 (9.5) | 867 (8.9) | 343 (8.2) | 382 (9.2) | 178 (7.6) | 1324 (8.1) | 720 (9.4) | 808 (11.6) |
| Separated | 4644 (14) | 2347 (15.5) | 1356 (13.9) | 450 (10.7) | 491 (11.8) | 254 (10.9) | 2018 (12.4) | 1139 (14.9) | 1233 (17.8) |
| Unclear | 2672 (8) | 1718 (11.4) | 570 (5.8) | 157 (3.7) | 227 (5.5) | 159 (6.8) | 1168 (7.2) | 604 (7.9) | 741 (10.7) |
| T stage, n (%) | |||||||||
| T1 | 15131 (45.5) | 15131 (100) | - | - | - | 681 (29.2) | 7019 (43) | 3796 (49.7) | 3635 (52.3) |
| T2 | 9759 (29.4) | - | 9759 (100) | - | - | 963 (41.2) | 5206 (31.9) | 1954 (25.6) | 1636 (23.6) |
| T3a | 4187 (12.6) | - | - | 4187 (100) | - | 370 (15.8) | 2319 (14.2) | 869 (11.4) | 629 (9.1) |
| T3b-4 | 4154 (12.5) | - | - | - | 4154 (100) | 322 (13.8) | 1765 (10.8) | 1021 (13.4) | 1046 (15.1) |
| PSA, n (%) | |||||||||
| <4.0 ng/ml | 2336 (7) | 681 (4.5) | 963 (9.9) | 370 (8.8) | 322 (7.8) | 2336 (100) | - | - | - |
| 4.0-10.0 ng/ml | 16309 (49.1) | 7019 (46.4) | 5206 (53.3) | 2319 (55.4) | 1765 (42.5) | - | 16309 (100) | - | - |
| 10.1-20.0 ng/ml | 7640 (23) | 3796 (25.1) | 1954 (20) | 869 (20.8) | 1021 (24.6) | - | - | 7640 (100) | - |
| >20.0 ng/ml | 6946 (20.9) | 3635 (24) | 1636 (16.8) | 629 (15) | 1046 (25.2) | - | - | - | 6946 (100) |
| Gleason score, n (%) | |||||||||
| 8 | 19447 (58.5) | 9774 (64.6) | 6001 (61.5) | 2052 (49) | 1620 (39) | 1344 (57.5) | 10207 (62.6) | 4357 (57) | 3539 (51) |
| 9-10 | 13784 (41.5) | 5357 (35.4) | 3758 (38.5) | 2135 (51) | 2534 (61) | 992 (42.5) | 6102 (37.4) | 3283 (43) | 3407 (49) |
| Therapy, n (%) | |||||||||
| Local treatments | 24972 (75.1) | 10635 (70.3) | 8282 (84.9) | 3286 (78.5) | 2769 (66.7) | 1870 (80.1) | 13319 (81.7) | 5599 (73.3) | 4184 (60.2) |
| No local treatments | 8259 (24.9) | 4496 (29.7) | 1477 (15.1) | 901 (21.5) | 1385 (33.3) | 466 (19.9) | 2990 (18.3) | 2041 (26.7) | 2762 (39.8) |
| Survival time (months) | |||||||||
| Median (IQR) | 82 (62~109) | 77 (56~104) | 86(64~113) | 92 (70~117) | 82.5 (62~109) | 86.5 (65~113) | 87 (66.5~113) | 79 (60~107) | 72 (43~100) |
IQR, interquartile range; GS: Gleason score; PSA, prostate-specific antigen.
Baseline characteristics of patients in propensity-score matched groups
| Characteristic | T1 | T2 | p | T1 | T3a | p | T2 | T3a | p | PSA <4.0ng/ml | PSA 4.0-10.0 ng/ml | p |
|---|---|---|---|---|---|---|---|---|---|---|---|---|
| N | 8397 | 8397 | 3674 | 3674 | 3834 | 3834 | 2323 | 2323 | ||||
| Age (years) | ||||||||||||
| Median (IQR) | 70 (64~76) | 70 (62~74) | 65 (63~75) | 65 (61~70) | 65 (61~72) | 65 (60~70) | 68 (61~74) | 72 (65~75) | ||||
| Age, n (%) | ||||||||||||
| <65 | 2735 (32.6) | 2733 (32.5) | 0.999 | 1876 (51.1) | 1885 (51.3) | 0.828 | 2084 (54.4) | 2088 (54.5) | 0.964 | 951 (40.9) | 951 (40.9) | 1.000 |
| 65-75 | 3462 (41.2) | 3465 (41.3) | 1464 (39.8) | 1470 (40) | 1429 (37.3) | 1427 (37.2) | 879 (37.8) | 879 (37.8) | ||||
| >75 | 2200 (26.2) | 2199 (26.2) | 334 (9.1) | 319 (8.7) | 321 (8.4) | 319 (8.3) | 493 (21.2) | 493 (21.2) | ||||
| Race, n (%) | ||||||||||||
| White | 6456 (76.9) | 6456 (76.9) | 0.990 | 3034 (82.6) | 3046 (82.9) | 0.836 | 3224 (84.1) | 3228 (84.2) | 0.990 | 1978 (85.1) | 1968 (84.7) | 0.930 |
| Black | 1372 (16.3) | 1369 (16.3) | 403 (11) | 391 (10.6) | 366 (9.5) | 366 (9.5) | 238 (10.2) | 239 (10.3) | ||||
| Others | 529 (6.3) | 529 (6.3) | 226 (6.2) | 222 (6) | 236 (6.2) | 231 (6) | 92 (4) | 101 (4.3) | ||||
| Unknown | 40 (0.5) | 43 (0.5) | 11 (0.3) | 15 (0.4) | 8 (0.2) | 9 (0.2) | 15 (0.6) | 15 (0.6) | ||||
| Marriage, n (%) | ||||||||||||
| Married | 5857 (69.8) | 5857 (69.8) | 0.999 | 2786 (75.8) | 2789 (75.9) | 0.663 | 2952 (77) | 2960 (77.2) | 0.952 | 1741 (74.9) | 1740 (74.9) | 0.927 |
| Unmarried | 762 (9.1) | 759 (9) | 306 (8.3) | 305 (8.3) | 316 (8.2) | 308 (8) | 174 (7.5) | 174 (7.5) | ||||
| Separated | 1240 (14.8) | 1238 (14.7) | 447 (12.2) | 427 (11.6) | 427 (11.1) | 420 (11) | 251 (10.8) | 261 (11.2) | ||||
| unclear | 538 (6.4) | 543 (6.5) | 135 (3.7) | 153 (4.2) | 139 (3.6) | 146 (3.8) | 157 (6.8) | 148 (6.4) | ||||
| T stage, n (%) | ||||||||||||
| T1 | 8397 (100) | - | - | 3674 (100) | - | - | - | - | - | 679 (29.2) | 669 (28.8) | 0.989 |
| T2 | - | 8397 (100) | - | - | 3834 (100) | - | 958 (41.2) | 968 (41.7) | ||||
| T3a | - | - | - | 3674 (100) | - | 3834 (100) | 367 (15.8) | 367 (15.8) | ||||
| T3b-4 | - | - | - | - | - | - | 319 (13.7) | 319 (13.7) | ||||
| PSA, n (%) | ||||||||||||
| <4.0 ng/ml | 504 (6) | 506 (6) | 1.000 | 253 (6.9) | 249 (6.8) | 0.990 | 324 (8.5) | 325 (8.5) | 1.00 | 2323 (100) | - | - |
| 4.0-10.0 ng/ml | 4449 (53) | 4452 (53) | 2047 (55.7) | 2038 (55.5) | 2146 (56) | 2148 (56) | - | 2323 (100) | ||||
| 10.1-20.0 ng/ml | 1827 (21.8) | 1827 (21.8) | 761 (20.7) | 767 (20.9) | 775 (20.2) | 772 (20.1) | - | - | ||||
| >20.0 ng/ml | 1617 (19.3) | 1612 (19.2) | 613 (16.7) | 620 (16.9) | 589 (15.4) | 589 (15.4) | - | - | ||||
| Gleason score, n (%) | ||||||||||||
| 8 | 5224 (62.2) | 5221 (62.2) | 0.962 | 1999 (54.4) | 2003 (54.5) | 0.925 | 1956 (51) | 1954 (51) | 0.964 | 1341 (57.7) | 1333 (57.4) | 0.812 |
| 9-10 | 3173 (37.8) | 3176 (37.8) | 1675 (45.6) | 1671 (45.5) | 1878 (49) | 1880 (49) | 982 (42.3) | 990 (42.6) | ||||
| Therapy, n (%) | ||||||||||||
| Local treatments | 6954 (82.8) | 6956 (82.8) | 0.967 | 2917 (79.4) | 2934 (79.9) | 0.622 | 3236 (84.4) | 3241 (84.5) | 0.857 | 1867 (80.4) | 1875 (80.7) | 0.767 |
| No local treatments | 1443 (17.2) | 1441 (17.2) | 757 (20.6) | 740 (20.1) | 598 (15.6) | 593 (15.5) | 456 (19.6) | 448 (19.3) | ||||
| Survival time (months) | ||||||||||||
| Median (IQR) | 85 (63~111) | 89 (65~112) | 80 (61~109) | 91 (70~116) | 87 (66~114) | 91 (70~116) | 86 (65~113) | 85 (64~113) | ||||
IQR, interquartile range; GS: Gleason score; PSA, prostate-specific antigen.
Survival outcomes
PCSS of patients in different T stage groups
In overall cohort, the survival curves revealed that the T1 group had significantly worse PCSS than the T2 group and T3a group for men with high-grade PCa. With T1 as the reference, the HRs and 95%CIs of T2, T3a, T3b-4 were 0.62(0.57~0.67), 0.70(0.63~0.77) and 1.41(1.30~1.53), respectively. T2 group was associated with the best PCSS but no obvious difference existed between T2 and T3a group [HR: 0.98 (0.91~1.05)]. The T3b-4 group had the worst survival results among all T stage groups. These results were presented in Figure 1A.
The prostate cancer-specific survival of men with high-grade and different T stage prostate cancer. (A) The prostate cancer-specific survival in overall cohort. (B) The prostate cancer-specific survival in the matched cohort of T1 vs T2 group. (C) The prostate cancer-specific survival in the matched cohort of T1 vs T3a group. (D) The prostate cancer-specific survival in the matched cohort of T2 vs T3a group.
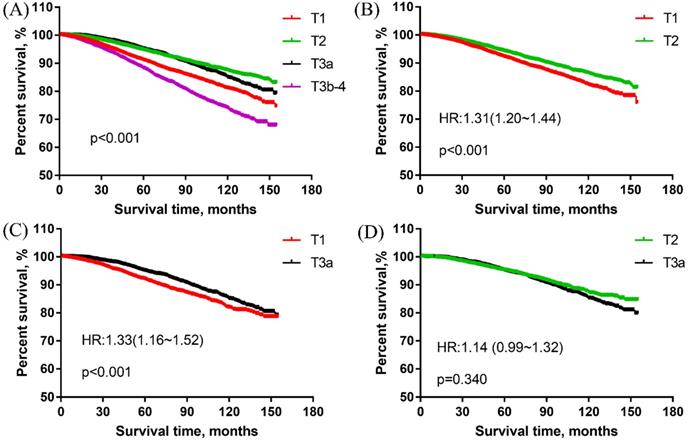
PSM was conducted in the comparison of T1 vs T2 group, T1 vs T3a group. The matched groups were analyzed to verify the results of the overall cohort. There were 16,794 patients matched in the comparison of T1 vs T2 group. The PCSS results showed that T1 group was significantly worse than T2 group (Figure 1B). With T2 as the reference, the HR and 95%CI of T1 was 1.31 (1.20~1.44).
A total of 7348 patients were left in the matched group of T1 vs T3a, the PCSS results revealed that T1 group was obviously worse than T3a group for men with high-grade PCa. With T3a as the reference, the HR and 95%CI of T1 was 1.33 (1.16~1.52) (Figure 1C).
In the matched group of T2 vs T3a group, there were 7668 patients. As shown in Figure 1D, there were no significant differences between T2 and T3a groups in the matched cohort. With T2 as the reference, the HR and 95%CI of T3a was 1.14 (0.99~1.32).
PCSS of patients in different PSA level groups
In the overall cohort, the survival curve showed that the PSA 4.0-10.0 ng/ml group had obviously better PCSS than PSA <4.0 ng/ml group. PSA <4.0 ng/ml group was associated with significantly better PCSS than PSA 10.1-20.0 ng/ml and PSA >20.0 ng/ml. With PSA <4.0 ng/ml as the reference, the HRs and 95% CIs of PSA 4.0-10.0 ng/ml, 10.1-20.0 ng/ml, >20.0 ng/ml were 0.77 (0.68~0.88), 1.27 (1.11~1.46) and 2.44 (2.14~2.79), respectively. The results were presented in Figure 2A.
The prostate cancer-specific survival of men with high-grade and different PSA levels PCa. (A) The prostate cancer-specific survival in overall cohort. (B) The prostate cancer-specific survival in the matched cohort of PSA<4.0 ng/ml vs PSA4.0-10.0 ng/ml group.
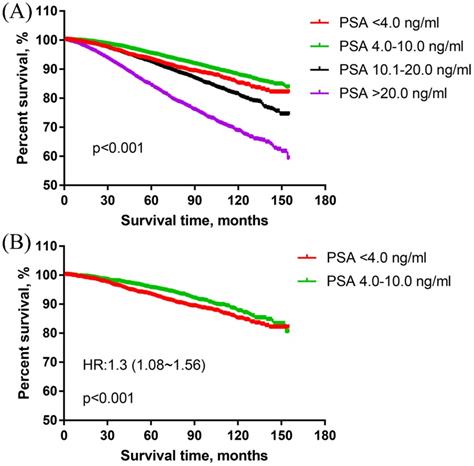
In the matched cohort, there were 2323 patients in each of PSA <4.0 ng/ml and PSA 4.0-10.0 ng/ml group. The PCSS results showed that PSA <4.0 ng/ml group was associated with significantly worse PCSS than PSA 4.0-10.0 ng/ml group in patients with high-grade PCa [HR: 1.30 (1.08~1.56)] (Figure 2B).
Multivariate COX analysis for PCSS
Multivariate COX analysis results of PCSS were presented in Table 3. Factors related to the risk of cancer-specific death included age, race, marital status, T stage, Gleason score, PSA, and treatments. With T1 as the reference, The HRs of T2, T3a and T4 for the cancer-specific mortality of men with high-grade PCa were 0.78 (0.72~0.84), 0.86 (0.78~0.96) and 1.39 (1.27~1.52), respectively. With PSA < 4.0 ng/ml as the reference, the HR of PSA 4.0-10.0 ng/ml, PSA 10.1-20.0 ng/ml, and PSA >20.0 ng/ml for cancer-specific mortality of men with high-grade PCa were 0.79 (0.69~0.9), 1.09 (0.95~1.25) and 1.84 (1.61~2.1), respectively.
Multivariate COX analysis for prostate cancer-specific survival in overall cohort
| Risk factors | PCSS | ||
|---|---|---|---|
| HR | 95% CI | P | |
| Age | |||
| <65 | 1 | Ref. | |
| 65-75 | 1.22 | (1.13~1.32) | < 0.001 |
| >75 | 1.81 | (1.67~1.97) | < 0.001 |
| Race | |||
| White | 1 | Ref. | |
| Black | 1.2 | (1.1~1.3) | < 0.001 |
| Others | 0.78 | (0.69~0.89) | < 0.001 |
| Marital status | |||
| Married | 1 | Ref. | |
| Unmarried | 1.3 | (1.18~1.45) | < 0.001 |
| Separated | 1.31 | (1.2~1.42) | < 0.001 |
| T stage | |||
| T1 | 1 | Ref. | |
| T2 | 0.78 | (0.72~0.84) | < 0.001 |
| T3a | 0.86 | (0.78~0.96) | 0.006 |
| T3b-4 | 1.39 | (1.27~1.52) | < 0.001 |
| PSA | |||
| < 4.0 ng/ml | 1 | Ref. | |
| 4.0-10.0 ng/ml | 0.79 | (0.69~0.9) | < 0.001 |
| 10.1-20.0 ng/ml | 1.09 | (0.95~1.25) | 0.221 |
| > 20.0 ng/ml | 1.84 | (1.61~2.1) | < 0.001 |
| Gleason score | |||
| 8 | 1 | Ref. | |
| 9-10 | 2.09 | (1.96~2.22) | < 0.001 |
| Treatment | |||
| Local treatments | 1 | Ref. | |
| No local treatments | 1.76 | (1.65~1.88) | < 0.001 |
HR, hazard ratio; Ref, reference; PSA, prostate-specific antigen; 95% CI: 95% confidence interval.
Discussion
The factors of GS, PSA or T stage are the widely accepted risk-grading standards in non-metastatic prostate cancer and have great impacts on the treatment decisions [15]. High-grade PCa has a great impact on the prognosis of patients and has always been one of the focuses in PCa researches [16, 17]. In general, PCa with higher PSA levels or T stages is more aggressive and associated with poorer prognosis for the patients. However, there seem to be some exceptions for high-grade GS PCa.
In our study, 33231 patients with high-grade PCa were grouped according to their PSA levels (<4.0 ng/ml, 4.0-10.0 ng/ml, 10.1-20.0 ng/ml, >20.0 ng/ml) and T stages (T1, T2, T3a and T3b-T4). The results in T stage groups showed that men with T1 stage had significantly worse PCSS than those with T2 stage or even T3a stage. The survival differences between T2 and T3a group were not obvious. The PCSS results in the matched groups also showed that T1 group was worse than T2 and T3a groups. Our results revealed that patients with T1 stage and high-grade PCa seem to have poorer cancer-specific survival than those with T2 stage or T3a stage. As far as we can know, these results haven't been reported in previous studies. High-grade PCa with low T stages might be associated with a feature of increased aggressive behavior. However, these results might be disturbed by the inaccurate clinical T staging in clinical practices. As T stage does not have enough prognostic values for localized PCa, the T stage of many patients might be assessed inaccurately. Therefore, the reliability of these results should be evaluated carefully in further studies.
In the comparison of PSA level groups, the results in the overall cohort showed that PSA 4.0-10.0 ng/ml group had the best PCSS among all level groups. PSA <4.0 ng/ml group was significantly worse than PSA 4.0-10.0 ng/ml group. The verification of matched cohorts also showed similar results. Patients in PSA 4.0-10.0 ng/ml group were associated with obviously better PCSS than those in PSA <4.0 ng/ml group in the matched cohort. These results have been revealed by several previous studies In Falchook's study [18], they found that patients with high-grade PCa and PSA<4.0 ng/ml were associated with poorer survival outcomes than those with PSA 4-9.9 ng/ml. Mahal et al. [19] reported that high-grade PCa with low PSA levels was especially aggressive. Men with high-grade PCa and PSA 2.6-4.0 ng/ml were associated with poorer prognoses than those with PSA 4.0-10.0 ng/ml, but obviously better survival outcomes than those with PSA <2.5 ng/ml. Several studies [14, 19-22] have proposed a hypothesis that high-grade PCa with low PSA level has the characteristics of dedifferentiation, clinically aggressiveness, and hormone resistance, but additional evidence are needed for further confirmation.
Our results were conducted with a large number of patients and were verified by the PSM groups. However, there were still some limitations in our study. Firstly, our study was a retrospective study, many confounding factors existed even in the matched groups. Therefore, it's inevitable to get influenced by some potential biases. Secondly, our data was only derived from the SEER database without the validation of our own data. It led to our results lacking sufficient persuasion. Thirdly, limited by the data characteristics in the open database, we only included the available factors in the database. Some important covariates might be missed in our analysis. It might have an impact on our results. Therefore, high-quality studies are needed in the future to verify the results.
Conclusion
High-grade PCa with low T stages or low PSA levels seems to be particularly aggressive and patients with these indicators are associated with decreased PCSS.
Acknowledgements
Ethical Approval
All data are derived from the public database and all patient labels have been removed, so no ethical approval is required.
Funding statement
This work was supported by a Key Project of National Natural Science Foundation of China, Grant ID: 8177060452 and 1.3.5 project for disciplines of excellence, West China Hospital, Sichuan University, Grant ID: ZY2016104. The funding bodies had no role in the design of the study and collection, analysis, and interpretation of data and writing the manuscript.
Competing Interests
The authors have declared that no competing interest exists.
References
1. Ferlay J, Soerjomataram I, Dikshit R, Eser S, Mathers C, Rebelo M. et al. Cancer incidence and mortality worldwide: sources, methods and major patterns in GLOBOCAN 2012. International journal of cancer. 2015;136:E359-86
2. Torre LA, Siegel RL, Ward EM, Jemal A. Global Cancer Incidence and Mortality Rates and Trends-An Update. Cancer epidemiology, biomarkers & prevention: a publication of the American Association for Cancer Research, cosponsored by the American Society of Preventive Oncology. 2016;25:16-27
3. Siegel RL, Miller KD, Jemal A. Cancer statistics, 2020. CA: a cancer journal for clinicians. 2020;70:7-30
4. Corona G, Isidori AM, Aversa A, Burnett AL, Maggi M. Endocrinologic Control of Men's Sexual Desire and Arousal/Erection. The journal of sexual medicine. 2016;13:317-37
5. Dong F, Wang C, Farris AB, Wu S, Lee H, Olumi AF. et al. Impact on the clinical outcome of prostate cancer by the 2005 international society of urological pathology modified Gleason grading system. The American journal of surgical pathology. 2012;36:838-43
6. Armstrong AJ, Tannock IF, de Wit R, George DJ, Eisenberger M, Halabi S. The development of risk groups in men with metastatic castration-resistant prostate cancer based on risk factors for PSA decline and survival. European journal of cancer. 2010;46:517-25
7. Fizazi K, Massard C, Smith M, Rader M, Brown J, Milecki P. et al. Bone-related Parameters are the Main Prognostic Factors for Overall Survival in Men with Bone Metastases from Castration-resistant Prostate Cancer. European urology. 2015;68:42-50
8. K Y, MH J, V C, FA F, K Y, Z H. et al. Novel Biomarker Signature That May Predict Aggressive Disease in African American Men With Prostate Cancer. Journal of clinical oncology: official journal of the American Society of Clinical Oncology. 2015;33:2789-96
9. DA B, ES A. CTC-derived AR-V7 detection as a prognostic and predictive biomarker in advanced prostate cancer. Expert review of molecular diagnostics. 2018;18:155-63
10. MS L, HG N, JE C, L X, B S, J S. et al. Comparing Prognostic Utility of a Single-marker Immunohistochemistry Approach with Commercial Gene Expression Profiling Following Radical Prostatectomy. European urology. 2018;74:668-75
11. M L, L H, P R, PL K-L. Both comorbidity and worse performance status are associated with poorer overall survival after external beam radiotherapy for prostate cancer. BMC cancer. 2020;20:324
12. D'Amico AV, Chen MH, Malkowicz SB, Whittington R, Renshaw AA, Tomaszewski JE. et al. Lower prostate specific antigen outcome than expected following radical prostatectomy in patients with high grade prostate and a prostatic specific antigen level of 4 ng/ml. Or less. The Journal of urology. 2002;167:2025-30 discussion 30-1
13. McGuire BB, Helfand BT, Loeb S, Hu Q, O'Brien D, Cooper P. et al. Outcomes in patients with Gleason score 8-10 prostate cancer: relation to preoperative PSA level. BJU international. 2012;109:1764-9
14. Mahal BA, Aizer AA, Efstathiou JA, Nguyen PL. Association of very low prostate-specific antigen levels with increased cancer-specific death in men with high-grade prostate cancer. Cancer. 2016;122:78-83
15. Buyyounouski MK, Choyke PL, McKenney JK, Sartor O, Sandler HM, Amin MB. et al. Prostate cancer - major changes in the American Joint Committee on Cancer eighth edition cancer staging manual. CA: a cancer journal for clinicians. 2017;67:245-53
16. AU K, RR C, JP C, AE R, MM P, PL N. et al. Radical Prostatectomy, External Beam Radiotherapy, or External Beam Radiotherapy With Brachytherapy Boost and Disease Progression and Mortality in Patients With Gleason Score 9-10 Prostate Cancer. Jama. 2018;319:896-905
17. H H, S M, M N, SN B, A K, MM S. Evaluation of Cancer Specific Mortality with Surgery versus Radiation as Primary Therapy for Localized High Grade Prostate Cancer in Men Younger Than 60 Years. The Journal of urology. 2019;201:120-8
18. Falchook AD, Martin NE, Basak R, Smith AB, Milowsky MI, Chen RC. Stage at presentation and survival outcomes of patients with Gleason 8-10 prostate cancer and low prostate-specific antigen. Urologic oncology. 2016;34:119 e19-26
19. Mahal BA, Yang DD, Wang NQ, Alshalalfa M, Davicioni E, Choeurng V. et al. Clinical and Genomic Characterization of Low-Prostate-specific Antigen, High-grade Prostate Cancer. European urology. 2018;74:146-54
20. BB M, BT H, S L, Q H, D OB, P C. et al. Outcomes in patients with Gleason score 8-10 prostate cancer: relation to preoperative PSA level. BJU international. 2012;109:1764-9
21. RK B, AJ S, AM C, AJ V, JA E, EA K. et al. Comparison of observed biochemical recurrence-free survival in patients with low PSA values undergoing radical prostatectomy and predictions of preoperative nomogram. Urology. 2009;73:1098-103
22. Alshalalfa M, Santiago-Jimenez M, Erho N, Fishbane N, Yousefi K, Ashab HA-D. et al. Relationships between an androgen receptor output signature (ARoS), AR expression, and poor prostate cancer prognosis in RP tissues. American Society of Clinical Oncology. 2017
Author contact
![]() Corresponding author: Qiang Dong. Department of Urology, Institute of Urology, West China Hospital of Sichuan University, No. 37, Guoxue Lane, Wuhou District, Chengdu, 610041, China. E-mail: dqiang666com.
Corresponding author: Qiang Dong. Department of Urology, Institute of Urology, West China Hospital of Sichuan University, No. 37, Guoxue Lane, Wuhou District, Chengdu, 610041, China. E-mail: dqiang666com.