Impact Factor ISSN: 1837-9664

 Global reach, higher impact
J Cancer 2020; 11(21):6299-6318. doi:10.7150/jca.47629 This issue Cite
Research Paper
Development and validation of a metastasis-related Gene Signature for predicting the Overall Survival in patients with Pancreatic Ductal Adenocarcinoma
Mengwei Wu, Xiaobin Li, Rui Liu, Hongwei Yuan, Wei Liu ![]() , Ziwen Liu
, Ziwen Liu ![]()
Department of General Surgery, Peking Union Medical College Hospital, Chinese Academy of Medical Sciences & Peking Union Medical College, Beijing, China.
Received 2020-4-30; Accepted 2020-8-13; Published 2020-8-29
Abstract
Background: Pancreatic ductal adenocarcinoma (PDAC) is a highly fatal, aggressive cancer characterized by invasiveness and metastasis. In this study, we aimed to propose a gene prediction model based on metastasis-related genes (MTGs) to more accurately predict PDAC prognosis.
Methods: Differentially expressed MTGs (DE-MTGs) were identified via integrated analysis of gene expression omnibus (GEO) datasets and Human Cancer Metastasis Database (HCMDB). Overall survival (OS) related DE-MTGs were then identified and a prognostic gene signature was established using Lasso-Cox regression with TCGA-PAAD datasets. Tumor immunity was analyzed using ESTIMATE and CIBERSORT algorithms. Finally, a nomogram predicting 1-year, 2-year, and 3-year OS of PDAC patients was established based on the prognostic gene signature and relevant clinical parameters using a stepwise Cox regression model.
Results: A total of 36 DE-MTGs related to OS were identified in PDAC. Consequently, an MTG-based gene signature comprising of RACGAP1, RARRES3, TPX2, MMP28, GPR87, KIF14, and TSPAN7 was established to predict the OS of PDAC. The MTG-based gene signature was able to distinguish high-risk patients with significantly poorer prognosis and accurately predict OS of PDAC in both the training and external validation datasets. Cox regression analysis indicated that the MTG-based gene signature was an independent prognostic factor in PDAC. The gene set enrichment analysis (GSEA) showed that molecular alterations in the high-risk group were associated with multiple oncological pathways. Moreover, analysis of tumor immunity revealed significantly higher levels of follicular helper T cells and M0 macrophage infiltration, and lower levels of infiltrating naïve B cells, CD8 T cells, monocytes, and resting dendritic cells in the high-risk group. Immune cell infiltration levels were significantly associated with the expression of the seven DE-MTGs. Finally, a nomogram was established by incorporating the prognostic gene signature and clinical parameters, which was superior to the AJCC staging system in predicting the OS of PDAC patients.
Conclusions: The DE-MTGs we identified were closely associated with the progress and prognosis of PDAC and are potential therapeutic targets. The MTG-based gene signature and nomogram may serve to improve the individualized prediction of survival, assisting in clinical decision-making.
Keywords: Gene Expression Omnibus, The Cancer Genome Atlas Program, pancreatic ductal adenocarcinoma, overall survival, nomogram
Introduction
Pancreatic ductal adenocarcinoma (PDAC) is a lethal type of cancer with a five-year overall survival (OS) of less than 10% [1]. Lacking typical clinical manifestations and sensitive screening methods at the early stages, PDAC is the fourth leading cause of cancer-related deaths in the USA, and by 2030, it is predicted to become the second most common cause of cancer-related deaths in the USA because of its globally rising mortality rate [2]. Surgical resection continues to be the only radical treatment option; however, less than 20% of patients are eligible for this procedure [3].
Individualized systemic therapy is now recommended for PDAC, and it is therefore necessary to establish an effective individual prognostic predictive model. To date, models based on clinical and pathological parameters, such as the AJCC staging system, have been applied to evaluate prognosis [4]; however, they cannot be dynamically adjusted as the patient condition changes. In addition, the AJCC staging system does not reflect the biological behavior of tumors at the molecular level. It is, therefore, necessary to develop new more accurate and personalized prognostic prediction tools for patient survival. By utilizing public databases, such as TCGA and GEO, multiple prediction models based on gene expression have been established that can reliably predict prognosis of PDAC patients following surgical resection and reflect the biological behavior of the disease [5, 6]. Recently, Zhou C et al. established a robust six-gene signature to predict the OS of PDAC through comprehensive mining of OS-related DEGs [7]. Rigorous validations revealed that the proposed gene signature was able to distinguish high-risk and low-risk patients with significantly different OS. Therefore, mining genes related to the prognosis of PDAC is an effective strategy to establish prediction models.
A significant proportion of PDAC patients are diagnosed at a progressive stage, with established invasion and metastasis of important nearby structures, causing them to be ineligible for surgical interventions [8]. Metastasis is a biological process involving multiple steps leading to cancer cell dissociation from the primary site, invasion via the extracellular matrix to the blood or lymphatic system, and extravasation and colonization at distant organs [9]. Epithelial-to-mesenchymal transition (EMT), cytoskeletal reorganization, invadopodium formation, increased cellular motility, and extracellular remodeling of the basement membrane are the primary metastasis-associated features. Metastasis at a very early stage is one of the main biological characteristics of PDAC, which is also the leading cause of its poor prognosis. Hence, gene prediction models based on metastasis-related genes (MTGs) may accurately reflect the metastatic behavior of PDAC, thus aiding the accurate prediction of patient prognosis.
In this study, we integrated four GEO gene expression datasets of PDAC to identify genes with differential expression. In combination with the Human Cancer Metastasis Database (HCMDB), differentially expressed MTGs (DE-MTGs) in PDAC were identified. A prognostic gene prediction model was proposed, prognostic factors were identified, and a prognostic nomogram was established. The relevance of the MTG-based gene signature with tumor immunity was also evaluated. The resulting novel MTG-based gene signature and the nomogram may provide a powerful tool for evaluating the OS of patients with PDAC.
Materials and Methods
Acquisition of TCGA clinical samples and expression data
Normalized RNA sequencing data (transcripts per million, TPM) and corresponding clinical and pathological data of pancreatic cancer were obtained from TCGA (https://portal.gdc.cancer.gov/) up to March, 20th, 2020. A total of 150 PDAC cases with pairwise tumor samples were selected based on the official TCGA publication [10]. After removing four cases with history of metastasis, and an additional five with follow-up ≤ 30 days, 141 cases with tumor samples and clinical data were ultimately included in analysis. Genes were regarded to be expressed in the tissue when TPM was above 0.5. Cbioportal database (http://www.cbioportal.org/) was used to evaluate the mutation and copy number variation of tumor tissues.
Integrated analysis of GEO gene expression datasets and identification of DE-MTGs
To identify DEGs in PDAC, the GEO database (https://www.ncbi.nlm.nih.gov/geo/) was used to identify PDAC datasets with mRNA expression and clinical data. "Pancreatic cancer", "PDAC", and "pancreatic adenocarcinoma" were used as keywords. Only datasets generated using the GPL570 platform (Affymetrix Human Genome U133 Plus 2.0 Array) and providing raw data as CEL files were included to minimize inter-platform variation. Human pancreatic tumor tissue and normal control samples were further selected. Research with primary focus on "cell lines" and "xenografts" were excluded. Ultimately, four independent array datasets (GSE15471, GSE16515, GSE32676, and GSE22780) containing 108 tumor and 70 non-tumor samples were selected for identification of DEGs in PDAC. A list of MTGs was also derived via the Human Cancer Metastasis Database (HCMDB) [11]. The four datasets were then merged into a meta-dataset to increase sample size. Raw gene expression data was imported into R Bioconductor using the affy software package [12], normalized and background-corrected using the robust multi-array average (RMA) function. Batch effects were removed using the ComBat function of the inSilicoMerging package. An officially provided annotation file from the manufacturers was used to match probes with gene symbols. If multiple probes matched one single gene symbol, the median ranking value was then used. DEGs were identified using LIMMA R package [13] with cut-off values of p < 0.05, false discovery rate (FDR) < 0.05 and |Log2FC| > 1. DE-MTGs in PDAC were identified after intersection with the DEGs identified. GEPIA (http://gepia.cancer-pku.cn), an interactive web server for analyzing RNA sequencing expression data from 9,736 tumors and 8,587 normal samples from TCGA and Genotype-Tissue Expression (GTEx) projects [14], was used for external validation of DE-MTGs.
Bioinformatics analysis of DE-MTGs
Potential biological processes, cellular components, molecular functions, and significantly relevant signal pathways of DEGs were explored with Gene Ontology and KEGG enrichment analyses using DAVID (https://david.ncifcrf.gov/) [15]. A p < 0.05 was regarded as statistically significant.
Survival analysis and establishment of a prognostic MTG-based gene signature
TCGA-PAAD dataset was used to evaluate associations between DE-MTGs and OS. Normalized gene expression data were base-2 logarithm transformed. Cox regression model was used to identify OS-related DE-MTGs in TCGA dataset. DE-MTGs with p < 0.05 were further used to establish a prognostic gene signature. To select prognostic DE-MTGs, Lasso penalized Cox regression analysis was applied and a prognostic gene signature was established in patients with PDAC based on a linear combination of the regression coefficient derived from the Lasso-Cox regression model coefficients (β) multiplied by its normalized mRNA expression. Optimal cut-off value of the MTG-based gene signature was determined using X-Tile [16]. Patients were then separated into low and high-risk groups. Area under the curve (AUC) of the receiver operating characteristic (ROC) curve, Kaplan-Meier analysis, and Harrell's concordance index were used to assess the power of the MTG-based gene signature. ROC analysis was performed using the 'timeROC' R package and the statistical differences in the AUCs were compared using the methods of Delong et al. [17]. The GSE62452 dataset and PACA-AU dataset of the International Cancer Genome Consortium (ICGC) with survival information were used for external validation [18, 19]. The same formula was used to calculate a risk score for each case.
Identification of independent prognostic parameters in PDAC
Univariate and multivariate Cox regression analyses were performed on the MTG-based gene signature and clinical parameters, including KRAS, TP53, CDKN2A, SMAD4, BRCA1, and BRCA2 mutations, sex, age, tumor size, anatomical site, Grade, T stage, N stage, AJCC stage, histological subtype, residual tumor status, surgical treatment, history of radiation therapy, targeted molecular therapy, chemotherapy, tobacco smoking, alcohol consumption, chronic pancreatitis, diabetes, and prior malignancy in TCGA dataset. Parameters with p < 0.25 in the univariate analysis were further included in the multivariate Cox regression analysis to identify independent prognostic parameters of PDAC and to validate the prognostic role of the MTG-based gene signature. A p < 0.05 was regarded statistically significant.
Development and verification of a prognostic nomogram
After performing a test of collinearity, a prognostic nomogram predicting 1-year, 2-year, and 3-year OS of PDAC patients was established based on independent prognostic parameters and relevant clinical parameters using stepwise Cox regression model. ROC curve, Kaplan-Meier analysis, C-index and calibration plots were used to assess the predictive power of the prognostic nomogram. Kaplan-Meier analysis was used to evaluate the ability to differentiate patients with different OS risk. Patients were separated into two groups according to the optimal cut-off values determined by X-Tile according to the total points of the nomogram. C-index was calculated using 1000 resamples of a bootstrap method. A calibration curve was plotted to demonstrate the predicted against observed OS.
GSEA and analysis of tumor immunity
Potential mechanisms of the MTG-based gene signature were explored using GSEA [20]. Samples from TCGA dataset were separated into high and low-risk groups based on the optimal cut-off value determined by X-Tile. JavaGSEA v3.0 was then applied to the Molecular Signatures Database v6.2 including C2: curated gene sets, C5: GO gene sets and C6: oncogenic signatures to identify enriched KEGG pathways, GO terms and dis-regulated oncogenic signatures related to poor survival of the high-risk group. FDR < 0.05 with |NES| > 1 were regarded as significantly enriched.
Stromal, immune, and estimate scores were calculated to evaluate tumor purity and immune cell infiltration in tumor tissues using ESTIMATE (Estimation of STromal and Immune cells in MAlignant Tumor tissues using expression data) algorithm based on the tumor expression data (https://bioinformatics.mdanderson.org/public-software/estimate/) [21]. The proportion of 22 human hematopoietic cell phenotypes in PDAC tumor tissues (including seven T cell types, naïve and memory B cells, plasma cells, NK cells, and myeloid subsets) were further analyzed with the CIBERSORT algorithm (https://cibersort.stanford.edu/) [22]. To identify associations between DE-MTGs and tumor immunity in PDAC, Pearson coefficients of correlation were calculated. A p < 0.05 was regarded as statistically significant.
Statistical analysis
Statistical analysis was performed based on R software v3.6.1 (https://www.r-project.org/) and GraphPad Prism v8.01 (https://www.graphpad.com/). Categorical variables were analyzed using χ2 test or Fisher's exact test. Continuous variables for paired samples were analyzed using Student's t test. Multiple groups of continuous variables were analyzed using one-way ANOVA. Survival analysis was performed based on the univariate and multivariate Cox regression. To identify DE-MTGs associated with OS, hazard ratio (HR) and 95% confidence interval (CI) were measured. Pearson coefficient of correlation was calculated to measure the correlation between two variables. Unless stated otherwise, two-tailed p < 0.05 was regarded as statistically significant.
Results
Identification of DE-MTGs
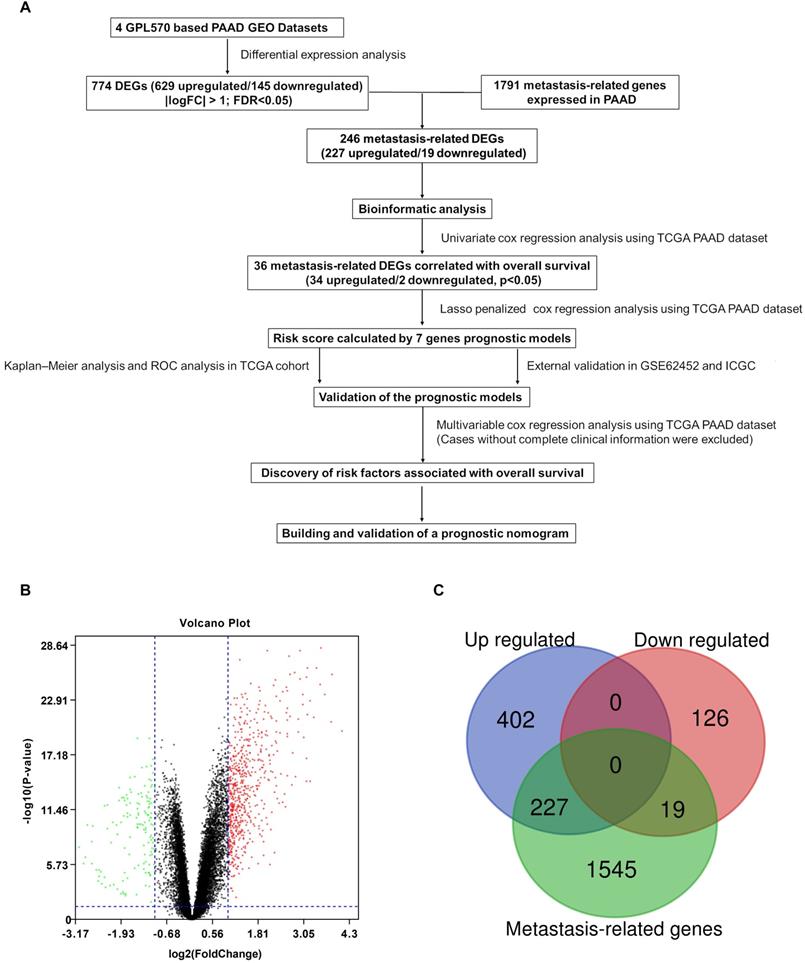
A flowchart of the study is described in Figure 1A. Detailed information on the GEO datasets used is presented in Table 1 [18, 19, 23-25]. A total of 774 DEGs, including 629 upregulated and 145 downregulated, were identified between tumor and normal pancreatic tissues (Figure 1B and Table S1). A total of 1791 MTGs with expression levels ≥ 0.5 TPM were selected (Table S2). After intersection with the identified DEGs, 246 DE-MTGs were identified (Figure 1C and Table S3), of which 227 were upregulated and 19 were downregulated.
Identification of differentially expressed metastasis-related genes (DE-MTGs) in pancreatic ductal adenocarcinoma (PDAC). (A) Flowchart describing the process of establishment of an MTG-based gene signature and prognostic nomogram in PDAC. (B) Differential expression of genes between tumor and normal tissue in PDAC after the integrated analysis of the GEO datasets. (C) A total of 246 DE-MTGs in PDAC (including 227 upregulated and 19 downregulated) were identified based on the intersection between GEO result and potential MTGs derived from the Human Cancer Metastasis Database (HCMDB).
Details of the datasets included in this study
| Datasets | Reference | Platform | Sample size (Tumor/Control) | Application |
|---|---|---|---|---|
| GSE15471 | Badea L et al., 2009 | [HG-U133_Plus_2] Affymetrix Human Genome U133 Plus 2.0 Array | 78 (39/39) | Identification of DEGs |
| GSE16515 | Pei H et al., 2009 | [HG-U133_Plus_2] Affymetrix Human Genome U133 Plus 2.0 Array | 52 (36/16) | Identification of DEGs |
| GSE32688 | Donahue TR et al., 2011 | [HG-U133_Plus_2] Affymetrix Human Genome U133 Plus 2.0 Array | 32 (25/7) | Identification of DEGs |
| GSE22780 | Killary AM et al., 2011 | [HG-U133_Plus_2] Affymetrix Human Genome U133 Plus 2.0 Array | 16 (8/8) | Identification of DEGs |
| GSE62452 | Yang S et al., 2016 | [HuGene-1_0-st] Affymetrix Human Gene 1.0 ST Array [transcript (gene) version] | 69 (69/0) | External validation |
| ICGC | Christopher JS et al., 2011 | Illumina HumanHT-12 V4.0 expression beadchip | 269 (269/0) | External validation |
Functional enrichment analysis of DE-MTGs
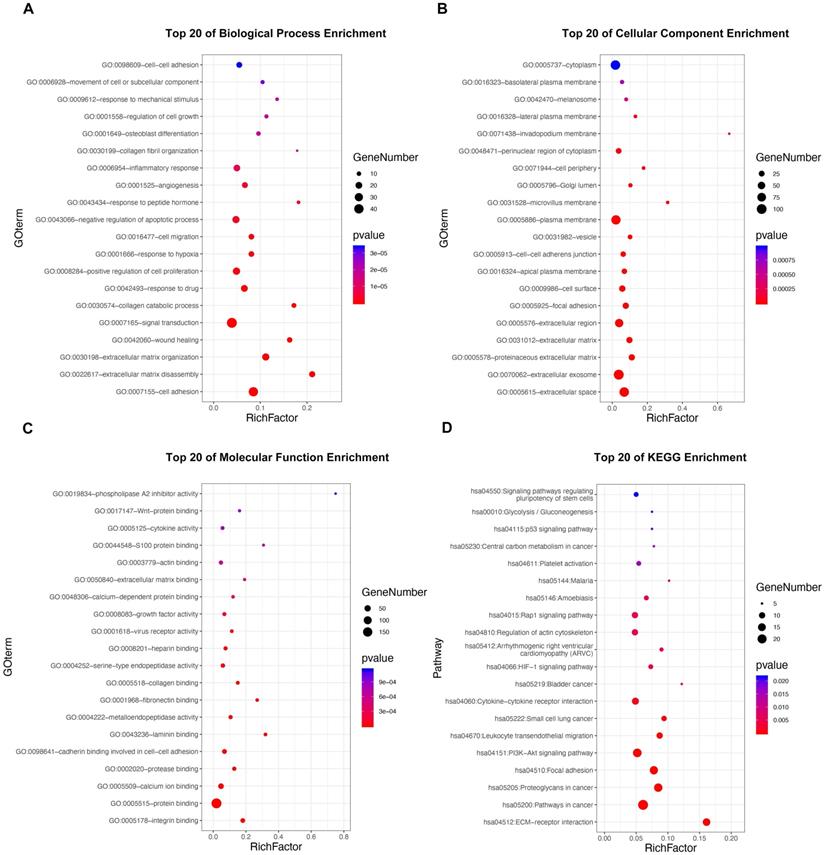
GO and KEGG pathway enrichment analyses were applied to discover potential functions and relevant pathways of the 295 DE-MTGs (Figure 2A-2D and Table S4). In terms of biological process, identified DE-MTGs were most significantly enriched in migration and invasion of cancer, including cell adhesion, extracellular matrix disassembly and organization, wound healing, collagen catabolic process, collagen fibril organization, and movement of cell or subcellular components (Figure 2A). They were also significantly enriched in biological processes associated with other malignant properties of PDAC, including positive regulation of cell proliferation, response to hypoxia, angiogenesis, and negative regulation of apoptotic processes. Further, DE-MTGs were significantly enriched in immune-related processes such as negative regulation of the T cell receptor signaling pathway. KEGG analysis further revealed that the metastasis-related DEGs primarily participated in the ECM-receptor interaction and in the PI3K-Akt, HIF-1, Rap1, and p53 signaling pathways (Figure 2D).
Functional enrichment analysis of the DE-MTGs. (A) Top 20 enriched biological processes of the DE-MTGs in PDAC. (B) Top 20 enriched cellular components of the DE-MTGs in PDAC. (C) Top 20 enriched molecular functions of the DE-MTGs in PDAC. (D) Top 20 enriched pathways of the DE-MTGs in PDAC. p < 0.05 was considered statistically significant.
Identification of DE-MTGs associated with OS and establishment of a prognostic MTG-based gene signature
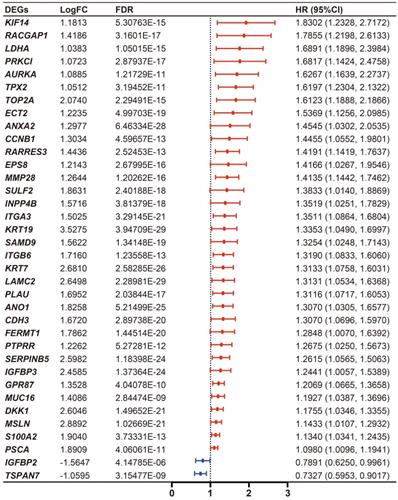
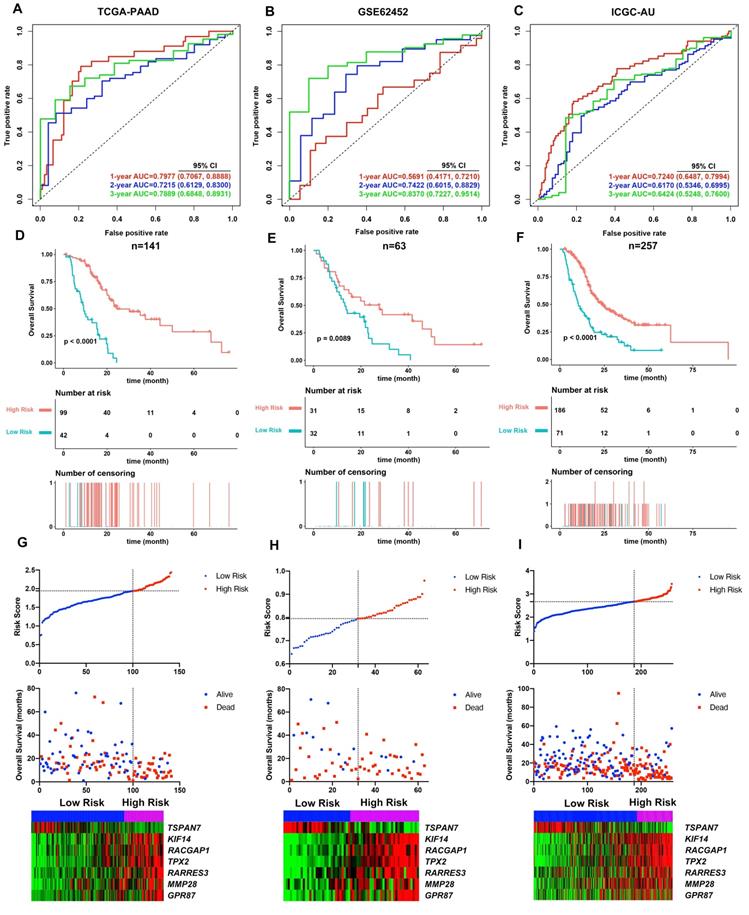
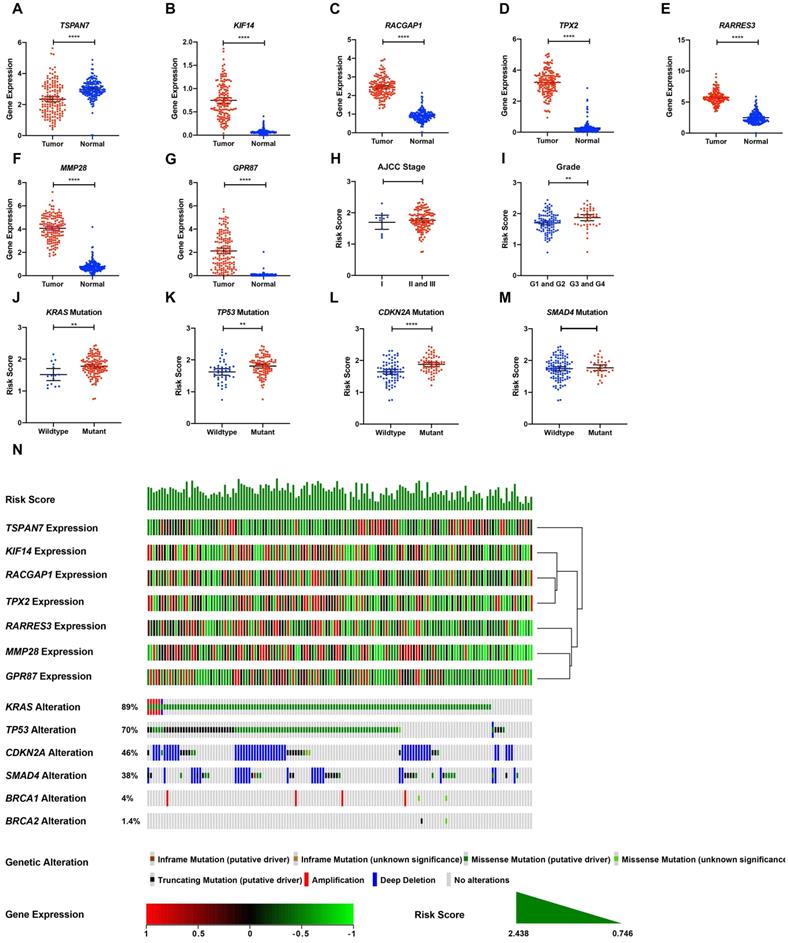
Cumulatively, 141 PDAC cases were included in the survival analysis from TCGA dataset with follow-up >30 days; for whom, the baseline clinical information is presented in Table 2. A total of 36-OS related DE-MTGs were identified (Figure 3) and a prognostic gene signature consisting of seven DE-MTGs, Rac GTPase-activating protein 1 (RACGAP1), retinoic acid receptor responder protein 3 (RARRES3), targeting protein for Xklp2 (TPX2), matrix metalloproteinase-28 (MMP28), G-protein coupled receptor 87 (GPR87), tetraspanin-7 (TSPAN7), and kinesin-like protein KIF14 (KIF14), was constructed using LASSO-COX regression (Figure S1). Among these DE-MTGs, upregulated RACGAP1, RARRES3, TPX2, MMP28, GPR87, and KIF14 with HR > 1 were regarded as oncogenes, whereas downregulated TSPAN7 with HR < 1 was regarded as a tumor suppressor. The following formula was then used to calculate the risk score: [(0.00235)*expression value of RACGAP1] + [(0.11562)*expression value of RARRES3] + [(0.11356)*expression value of TPX2] + [(0.07972)*expression value of MMP28] + [(0.00972)*expression value of GPR87] - [(0.07109)*expression value of TSPAN7] + [(0.09209)*expression value of KIF14]. The optimal cut-off value was determined with X-Tile, and patients were separated into high and low-risk groups accordingly. The high-risk group was identified to have significantly poorer survival using Kaplan-Meier analysis (p < 0.0001; Figure 4D). Time-dependent ROC and C-index were then used to assess the predictive power of the MTG-based gene and the resulting AUCs of 1-year, 2-year, and 3-year OS prediction of the MTG-based gene signature were 0.798 (95% CI: 0.707-0.889), 0.722 (95% CI: 0.613-0.830), and 0.789 (95% CI: 0.685-0.893), respectively (Figure 4A). The C-index for the risk score was 0.690 (95% CI: 0.632-0.749). Expression of the seven DE-MTGs changed with increasing risk score. The correlation between the risk scores, gene expression data, and OS are presented in Figure 4G.
Clinical features of PDAC patients in TCGA-PAAD dataset
| Clinical features | Mean+SD |
|---|---|
| Follow up time (day) | 538.05 ± 418.09 |
| Risk Score | 1.75 ± 0.32 |
| Age | 64.70 ± 11.00 |
| Size (cm) | 3.74 ± 1.37 |
| N (%) | |
| Survival status | |
| Alive | 62 (43.97%) |
| Dead | 79 (56.03%) |
| KRAS mutation | |
| Wildtype | 15 (10.64%) |
| Mutant | 126 (89.36%) |
| TP53 mutation | |
| Wildtype | 43 (30.50%) |
| Mutant | 98 (69.50%) |
| CDKN2A mutation | |
| Wildtype | 76 (53.90%) |
| Mutant | 65 (46.10%) |
| SMAD4 mutation | |
| Wildtype | 107 (75.89%) |
| Mutant | 34 (24.11%) |
| BRCA1 mutation | |
| Wildtype | 135 (95.74%) |
| Mutant | 6 (4.26%) |
| BRCA2 mutation | |
| Wildtype | 139 (98.58%) |
| Mutant | 2 (1.42%) |
| Sex | |
| Male | 75 (53.19%) |
| Female | 66 (46.81%) |
| Subtype | |
| Pancreas-Adenocarcinoma Ductal Type | 128 (90.78%) |
| Pancreas-Adenocarcinoma-Other Subtype | 13 (9.22%) |
| Grade | |
| G1 | 18 (12.77%) |
| G2 | 80 (56.74%) |
| G3 | 42 (29.79%) |
| G4 | 1 (0.71%) |
| T | |
| T1 | 5 (3.55%) |
| T2 | 14 (9.93%) |
| T3 | 118 (83.69%) |
| T4 | 3 (2.13%) |
| Not available | 1 (0.71%) |
| N | |
| N0 | 36 (25.53%) |
| N1 | 103 (73.05%) |
| Not available | 2 (1.42%) |
| M | |
| M0 | 67 (47.52%) |
| Mx | 74 (52.48%) |
| AJCC stage | |
| IA | 4 (2.84%) |
| IB | 7 (4.96%) |
| IIA | 24 (17.02%) |
| IIB | 101 (71.63%) |
| III | 2 (1.42%) |
| Not available | 3 (2.13%) |
| Residual tumor | |
| R0 | 76 (53.90%) |
| R1 | 47 (33.33%) |
| R2 | 5 (3.55%) |
| Not available | 13 (9.22%) |
| Site | |
| Head of Pancreas | 113 (80.14%) |
| Body of Pancreas | 11 (7.80%) |
| Tail of Pancreas | 8 (5.67%) |
| Others | 9 (6.38%) |
| Initial pathologic diagnosis method | |
| Tumor resection | 88 (62.41%) |
| Tissue Biopsy | 25 (17.73%) |
| Cytology (e.g. Peritoneal or pleural fluid) | 18 (12.77%) |
| Fine Needle Aspiration Biopsy | 5 (3.55%) |
| Not available | 5 (3.55%) |
| Surgical treatment | |
| Whipple | 112 (79.43%) |
| Distal Pancreatectomy | 17 (12.06%) |
| Distal Pancreatectomy & laporoscopy followed by Hand-assisted and Splenectomy | 1 (0.71%) |
| Subtotal pancreatectomy and splenectomy and cholecystectomy | 1 (0.71%) |
| Radical pancreaticoduodenectomy | 4 (2.84%) |
| Total Pancreatectomy | 2 (1.42%) |
| Endoscopic Retrograde Cholangiopancreaticography | 1 (0.71%) |
| Not available | 3 (2.13%) |
| History of neoadjuvant treatment | |
| No | 141 (100.00%) |
| History of chemotherapy | |
| No | 43 (30.50%) |
| Yes | 98 (69.50%) |
| History of radiation therapy | |
| No | 81 (57.45%) |
| Yes | 28 (19.86%) |
| Not available | 32 (22.70%) |
| History of targeted molecular therapy | |
| No | 35 (24.82%) |
| Yes | 97 (68.79%) |
| Not available | 9 (6.38%) |
| Tobacco smoking history | |
| Lifelong Non-smoker | 50 (35.46%) |
| Current smoker | 16 (11.35%) |
| Current reformed smoker for > 15 years | 23 (16.31%) |
| Current reformed smoker for ≤ 15 years | 21 (14.89%) |
| Current reformed smoker, duration not specified | 7 (4.96%) |
| Not available | 24 (17.02%) |
| Alcohol drinking history | |
| No | 49 (34.75%) |
| Yes | 81 (57.45%) |
| Not available | 11 (7.80%) |
| History of chronic pancreatitis | |
| No | 103 (73.05%) |
| Yes | 13 (9.22%) |
| Not available | 25 (17.73%) |
| History of diabetes | |
| No | 90 (63.83%) |
| Yes | 31 (21.99%) |
| Not available | 20 (14.18%) |
| History of prior malignancy | |
| No | 128 (90.78%) |
| Yes | 13 (9.22%) |
Differential expression level and forest plot of hazard ratio (HR) presenting the prognostic values of the 36 DE-MTGs associated with overall survival in PDAC.
Evaluation of the performance of the MTG-based gene signature in TCGA-PAAD dataset and external validation in the GSE62452 and ICGC datasets. (A) Time-dependent ROC for 1-, 2- and 3-year predictions of overall survival for the MTG-based gene signature in the TCGA-PAAD dataset. (B) Time-dependent ROC for 1-, 2- and 3-year predictions of overall survival for the MTG-based gene signature in GSE62452. (C) Time-dependent ROC for 1-, 2- and 3-year predictions of overall survival for the MTG-based gene signature in ICGC. (D) Kaplan-Meier survival curves of the MTG-based gene signature. Patients from TCGA-PAAD dataset are stratified into two groups according to the optimal cut-off values for the risk scores determined by X-Tile software. (E) Kaplan-Meier survival curves of the MTG-based gene signature. Patients from the GSE62452 dataset are stratified into two groups according to the optimal cut-off values for the risk scores determined by X-Tile software. (F) Kaplan-Meier survival curves of the MTG-based gene signature. Patients from the ICGC dataset are stratified into two groups according to the optimal cut-off values for the risk scores determined by X-Tile software. (G) Relationship between the risk score (upper), survival status of patients in different groups (middle), and the expression profiles of the seven prognostic DE-MTGs (bottom) in TCGA-PAAD dataset. (H) Relationship between the risk score (upper), survival status of patients in different groups (middle), and the expression profiles of the seven prognostic DE-MTGs (bottom) in the GSE62452 dataset. (I) Relationship between the risk score (upper), survival status of patients in different groups (middle), and the expression profiles of the seven prognostic DE-MTGs (bottom) in the ICGC dataset.
The predictive power of the MTG-based gene signature on OS was further assessed using the AJCC staging system and three previously proposed gene signatures as references. The AUCs of 1-year and 3-year OS prediction of the MTG-based gene signature were significantly higher (p < 0.05) than those of the AJCC staging system (Figures S2A-C). Regarding previously proposed gene signatures, the MTG-based gene signature had a significantly higher AUC in predicting 1-year OS than the gene signatures proposed by Chen H et al. and Liao X et al., higher AUC in predicting 2-year OS than the gene signature proposed by Liao X et al., and higher AUC in predicting 3-year OS than all three gene signatures (p < 0.05) (Figures S2A-C).
Validating the performance of the MTG-based gene signature performance in external dataset
The MTG-based gene signature was then assessed in the external datasets with survival information GSE62452 and ICGC datasets. The same formula was applied to calculate the risk score for each case. Using X-Tile the optimal cut-off value was calculated for each dataset. Patients were then divided accordingly into high and low-risk groups. Kaplan-Meier survival curves identified significantly worse prognosis in the high-risk group (Figure 4E and 4F).
The prognosis predictive power of the MTG-based gene signature was also evaluated using ROC curve and C-index. In the GSE62452 dataset, the AUCs of 1-year, 2-year, and 3-year OS prediction of the MTG-based gene signature were 0.569 (95% CI: 0.417-0.721), 0.742 (95% CI: 0.602-0.883), and 0.837 (95% CI: 0.723-0.951), respectively (Figure 4B), while the C-index of the MTG-based gene signature was 0.570 (95% CI: 0.463-0.678). Furthermore, in the ICGC dataset, the AUCs of 1-year, 2-year, and 3-year OS prediction of the MTG-based gene signature were 0.724 (95% CI: 0.649-0.799), 0.617 (95% CI: 0.535-0.700), and 0.642 (95% CI: 0.525-0.760), respectively (Figure 4C), and the C-index of the MTG-based gene signature was 0.650 (95% CI: 0.549-0.750). The correlation between the risk scores, gene expression data, and OS are presented in Figure 4H-I.
The predictive power of the MTG-based gene signature was also assessed using the AJCC staging system and three previously proposed gene signatures as references. In the GSE62452 dataset, ROC analysis revealed that the MTG-based gene signature was comparable to the AJCC staging system and gene signatures proposed by Zhou C and Chen H, and had significantly higher AUCs than the gene signature proposed by Liao X et al. in terms of predicting the 2-year, and 3-year OS (p < 0.05) (Figure S2D-S2F). Additionally, in the ICGC dataset, the MTG-based gene signature had a significantly higher AUC in predicting 1-year OS than all three gene signatures, as well as a higher AUC in predicting 3-year OS than the gene signature proposed by Liao X et al. (p < 0.05) (Figure S2G-I).
Validation of gene expression and genetic alterations of the seven DE-MTGs
TCGA tumor samples with matched TCGA normal and GTEx data were used to verify the differential expression of the seven DE-MTGs using GEPIA. Consistent with the results of integrated analysis, mRNA expression of RACGAP1, RARRES3, TPX2, MMP28, GPR87, and KIF14 was significantly upregulated in PDAC tumor tissues, whereas TSPAN7 was significantly downregulated (Figure 5A-G). Although the risk scores were comparable between stage II and III patients versus stage I patients, pathological grade 3 and 4 patients had significantly higher risk scores than did grade 1 and 2 patients (Figure 5H-I). The association between the seven-gene signature and the most frequent mutations in PDAC (KRAS, TP53, CDKN2A, and SMAD4) was further analyzed. Risk scores of PDAC cases with KRAS, TP53, and CDKN2A mutations were significantly higher than cases with wild-type genes. In contrast, the risk score was comparable between cases with and without SMAD4 mutation (Figure 5J-M). The relationship between the transcriptome profiles, mutational profiles (KRAS, TP53, CDKN2A, SMAD4, BRCA1, and BRCA2) of PDAC and the MTG-based gene signature were further analyzed and are presented in Figure 5N.
Expression levels of the seven DE-MTGs in PDAC and the mutation landscape of PDAC. (A-G) External validation of differential mRNA expression of the seven DE-MTGs in TCGA PADC tumor tissue and matching normal tissue from TCGA and GTEx data using GEPIA (http://gepia.cancer-pku.cn/). (H, I) Distribution of the MTG-based gene signature in different AJCC stages and grades in TCGA-PAAD dataset. (J-M) Distribution of the MTG-based gene signature for different mutation statuses of KRAS, TP53, CDKN2A, and SMAD4 in TCGA-PAAD dataset. (N) The relationship among the MTG-based gene signature, transcriptome profiles and mutational profiles (KRAS, TP53, CDKN2A, SMAD4, BRCA1, and BRCA2) of PDAC. Data were obtained from the cBioPortal for Cancer Genomics (https://www.cbioportal.org). * p < 0.05, ** p < 0.01. *** p < 0.001. **** p < 0.0001.
Assessment of prognostic parameters related to OS in PDAC
A total of 77 patients from TCGA dataset with complete clinical data were included for further analysis (Table 3, Table S5). Patients in the high-risk group showed significantly shorter OS (p < 0.001), larger tumor size (p = 0.013), and a greater portion of microscopic or macroscopic residual tumor (p = 0.017) (Table 3). Prognostic factors related to OS in PDAC were identified using univariate and multivariate Cox regression. Risk score, tumor size, CDKN2A mutation, BRCA1 mutation, N stage, residual tumor, history of radiation therapy, targeted molecular therapy, and chemotherapy were identified to be significantly related to OS of PDAC in univariate Cox analysis, with p < 0.05 (Table 4). The multivariate Cox analysis further integrated parameters with p < 0.25 in the univariate analysis and found that risk score (p = 0.0037), history of targeted molecular therapy (p = 0.0260) and diabetes (p = 0.0141) were independent risk factors of OS in PDAC (Table 5).
Baseline characteristics of patients included for the evaluation of prognostic factors and establishment of nomogram
| Clinical features | Low risk | High risk | p-value |
|---|---|---|---|
| Mean ± SD | |||
| Overall Survival (day) | 625.75 ± 352.45 | 282.04 ± 177.79 | < 0.001 |
| Risk Score | 1.63 ± 0.25 | 2.11 ± 0.15 | < 0.001 |
| Age | 63.90 ± 12.09 | 63.73 ± 11.06 | 0.952 |
| Size (cm) | 3.40 ± 1.07 | 4.29 ± 2.00 | 0.013 |
| N (%) | |||
| Survival status | < 0.001 | ||
| Alive | 27 (52.94%) | 3 (11.54%) | |
| Dead | 24 (47.06%) | 23 (88.46%) | |
| KRAS mutation | 0.787 | ||
| Wildtype | 7 (13.73%) | 3 (11.54%) | |
| Mutant | 44 (86.27%) | 23 (88.46%) | |
| TP53 mutation | 0.209 | ||
| Wildtype | 19 (37.25%) | 6 (23.08%) | |
| Mutant | 32 (62.75%) | 20 (76.92%) | |
| CDKN2A mutation | 0.164 | ||
| Wildtype | 32 (62.75%) | 12 (46.15%) | |
| Mutant | 19 (37.25%) | 14 (53.85%) | |
| SMAD4 mutation | 0.555 | ||
| Wildtype | 36 (70.59%) | 20 (76.92%) | |
| Mutant | 15 (29.41%) | 6 (23.08%) | |
| BRCA1 mutation | 0.073 | ||
| Wildtype | 50 (98.04%) | 23 (88.46%) | |
| Mutant | 1 (1.96%) | 3 (11.54%) | |
| BRCA2 mutation | 0.306 | ||
| Wildtype | 49 (96.08%) | 26 (100.00%) | |
| Mutant | 2 (3.92%) | 0 (0.00%) | |
| Sex | 0.945 | ||
| Male | 29 (56.86%) | 15 (57.69%) | |
| Female | 22 (43.14%) | 11 (42.31%) | |
| Subtype | 0.179 | ||
| Pancreas-Adenocarcinoma Ductal Type | 44 (86.27%) | 25 (96.15%) | |
| Pancreas-AdenocarcinomaOther Subtype | 7 (13.73%) | 1 (3.85%) | |
| Grade | 0.331 | ||
| G1 | 4 (7.84%) | 0 (0.00%) | |
| G2 | 31 (60.78%) | 15 (57.69%) | |
| G3 | 15 (29.41%) | 11 (42.31%) | |
| G4 | 1 (1.96%) | 0 (0.00%) | |
| T | 0.223 | ||
| T1 | 4 (7.84%) | 0 (0.00%) | |
| T2 | 6 (11.76%) | 1 (3.85%) | |
| T3 | 40 (78.43%) | 25 (96.15%) | |
| T4 | 1 (1.96%) | 0 (0.00%) | |
| N | 0.195 | ||
| N0 | 17 (33.33%) | 5 (19.23%) | |
| N1 | 34 (66.67%) | 21 (80.77%) | |
| M | 0.471 | ||
| M0 | 29 (56.86%) | 17 (65.38%) | |
| Mx | 22 (43.14%) | 9 (34.62%) | |
| AJCC stage | 0.559 | ||
| IA | 3 (5.88%) | 0 (0.00%) | |
| IB | 4 (7.84%) | 1 (3.85%) | |
| IIA | 9 (17.65%) | 4 (15.38%) | |
| IIB | 34 (66.67%) | 21 (80.77%) | |
| III | 1 (1.96%) | 0 (0.00%) | |
| Residual tumor | 0.017 | ||
| R0 | 35 (68.63%) | 9 (34.62%) | |
| R1 | 15 (29.41%) | 16 (61.54%) | |
| R2 | 1 (1.96%) | 1 (3.85%) | |
| Site | 0.497 | ||
| Head of Pancreas | 41 (80.39%) | 24 (92.31%) | |
| Body of Pancreas | 3 (5.88%) | 1 (3.85%) | |
| Tail of Pancreas | 4 (7.84%) | 1 (3.85%) | |
| Others | 3 (5.88%) | 0 (0.00%) | |
| Initial pathologic diagnosis method | 0.887 | ||
| Tumor resection | 31 (60.78%) | 17 (65.38%) | |
| Tissue Biopsy | 13 (25.49%) | 5 (19.23%) | |
| Cytology (e.g. Peritoneal or pleural fluid) | 5 (9.80%) | 3 (11.54%) | |
| Fine Needle Aspiration Biopsy | 1 (1.96%) | 1 (3.85%) | |
| Not available | 1 (1.96%) | 0 (0.00%) | |
| Surgical treatment | 0.761 | ||
| Whipple | 41 (80.39%) | 24 (92.31%) | |
| Distal Pancreatectomy | 6 (11.76%) | 2 (7.69%) | |
| Distal Pancreatectomy & laporoscopy followed by Hand-assisted and Splenectomy | 1 (1.96%) | 0 (0.00%) | |
| Subtotal pancreatectomy and splenectomy and cholecystectomy | 1 (1.96%) | 0 (0.00%) | |
| Total Pancreatectomy | 1 (1.96%) | 0 (0.00%) | |
| Endoscopic Retrograde Cholangiopancreaticography | 1 (1.96%) | 0 (0.00%) | |
| History of chemotherapy | 0.057 | ||
| No | 11 (21.57%) | 11 (42.31%) | |
| Yes | 40 (78.43%) | 15 (57.69%) | |
| History of radiation therapy | 0.039 | ||
| No | 34 (66.67%) | 23 (88.46%) | |
| Yes | 17 (33.33%) | 3 (11.54%) | |
| History of targeted molecular therapy | < 0.001 | ||
| No | 10 (19.61%) | 15 (57.69%) | |
| Yes | 41 (80.39%) | 11 (42.31%) | |
| Tobacco smoking history | 0.550 | ||
| Lifelong Non-smoker | 18 (35.29%) | 12 (46.15%) | |
| Current smoker | 7 (13.73%) | 6 (23.08%) | |
| Current reformed smoker for > 15 years | 13 (25.49%) | 4 (15.38%) | |
| Current reformed smoker for ≤ 15 years | 9 (17.65%) | 3 (11.54%) | |
| Current reformed smoker, duration not specified | 4 (7.84%) | 1 (3.85%) | |
| Alcohol drinking history | 0.679 | ||
| No | 14 (27.45%) | 6 (23.08%) | |
| Yes | 37 (72.55%) | 20 (76.92%) | |
| History of chronic pancreatitis | 0.655 | ||
| No | 45 (88.24%) | 22 (84.62%) | |
| Yes | 6 (11.76%) | 4 (15.38%) | |
| History of diabetes | 0.679 | ||
| No | 37 (72.55%) | 20 (76.92%) | |
| Yes | 14 (27.45%) | 6 (23.08%) | |
| History of Prior Malignancy | 0.981 | ||
| No | 47 (92.16%) | 24 (92.31%) | |
| Yes | 4 (7.84%) | 2 (7.69%) | |
PDAC patients from the TCGA-PAAD dataset without complete clinical information were excluded.
Unadjusted univariate Cox analysis
| Exposure | Statistics | Overall Survival |
|---|---|---|
| Risk Score | 1.80 ± 0.31 | 6.11 (2.01, 18.59) 0.0014 |
| Age | 63.84 ± 11.68 | 1.02 (0.99, 1.05) 0.1665 |
| Sex | ||
| Male | 44 (57.14%) | 1 |
| Female | 33 (42.86%) | 1.26 (0.71, 2.24) 0.4278 |
| Size (cm) | 3.70 ± 1.50 | 1.22 (1.01, 1.47) 0.0422 |
| KRAS mutation | ||
| Wildtype | 10 (12.99%) | 1 |
| Mutant | 67 (87.01%) | 1.21 (0.51, 2.86) 0.6593 |
| TP53 mutation | ||
| Wildtype | 25 (32.47%) | 1 |
| Mutant | 52 (67.53%) | 1.27 (0.68, 2.37) 0.4612 |
| CDKN2A mutation | ||
| Wildtype | 44 (57.14%) | 1 |
| Mutant | 33 (42.86%) | 1.87 (1.04, 3.36) 0.0362 |
| SMAD4 mutation | ||
| Wildtype | 56 (72.73%) | 1 |
| Mutant | 21 (27.27%) | 0.72 (0.37, 1.39) 0.3267 |
| BRCA1 mutation | ||
| Wildtype | 73 (94.81%) | 1 |
| Mutant | 4 (5.19%) | 4.06 (1.43, 11.53) 0.0086 |
| BRCA2 mutation | ||
| Wildtype | 75 (97.40%) | 1 |
| Mutant | 2 (2.60%) | 1.87 (0.45, 7.80) 0.3892 |
| Site | ||
| Head of Pancreas | 65 (84.42%) | 1 |
| Body and tail of Pancreas and others | 12 (15.58%) | 0.39 (0.14, 1.10) 0.0744 |
| Subtype | ||
| Pancreas-Adenocarcinoma Ductal Type | 69 (89.61%) | 1 |
| Pancreas-Adenocarcinoma-Other Subtype | 8 (10.39%) | 0.60 (0.22, 1.68) 0.3336 |
| Grade | ||
| G1 and G2 | 50 (64.94%) | 1 |
| G3 and G4 | 27 (35.06%) | 1.41 (0.79, 2.53) 0.2487 |
| T | ||
| T1 and T2 | 11 (14.29%) | 1 |
| T3 and T4 | 66 (85.71%) | 2.45 (0.87, 6.88) 0.0887 |
| N | ||
| N0 | 22 (28.57%) | 1 |
| N1 | 55 (71.43%) | 2.33 (1.12, 4.85) 0.0231 |
| AJCC stage | ||
| I | 8 (10.39%) | 1 |
| II and III | 69 (89.61%) | 1.63 (0.58, 4.57) 0.3547 |
| Residual tumor | ||
| R0 | 44 (57.14%) | 1 |
| R1 | 31 (40.26%) | 2.14 (1.17, 3.92) 0.0132 |
| R2 | 2 (2.60%) | 1.92 (0.25, 14.58) 0.5270 |
| Surgical treatment | ||
| Whipple | 65 (84.42%) | 1 |
| Distal Pancreatectomy | 9 (11.69%) | 0.55 (0.20, 1.54) 0.2520 |
| Others | 3 (3.90%) | 0.00 (0.00, Inf) 0.9971 |
| History of radiation therapy | ||
| No | 57 (74.03%) | 1 |
| Yes | 20 (25.97%) | 0.28 (0.12, 0.66) 0.0035 |
| History of targeted molecular therapy | ||
| No | 25 (32.47%) | 1 |
| Yes | 52 (67.53%) | 0.18 (0.10, 0.33) < 0.0001 |
| History of chemotherapy | ||
| No | 22 (28.57%) | 1 |
| Yes | 55 (71.43%) | 0.36 (0.20, 0.66) 0.0008 |
| Tobacco smoking history | ||
| Lifelong Non-smoker | 30 (38.96%) | 1 |
| Current or former smoker | 47 (61.04%) | 0.80 (0.44, 1.44) 0.4526 |
| Alcohol drinking history | ||
| No | 20 (25.97%) | 1 |
| Yes | 57 (74.03%) | 1.45 (0.74, 2.86) 0.2782 |
| History of chronic pancreatitis | ||
| No | 67 (87.01%) | 1 |
| Yes | 10 (12.99%) | 0.70 (0.30, 1.66) 0.4209 |
| History of diabetes | ||
| No | 57 (74.03%) | 1 |
| Yes | 20 (25.97%) | 0.51 (0.24, 1.10) 0.0849 |
| History of prior malignancy | ||
| No | 71 (92.21%) | 1 |
| Yes | 6 (7.79%) | 1.59 (0.56, 4.52) 0.3848 |
Multivariate Cox regression analysis
| Exposure | Non-adjusted | Adjust I | Adjust II | Adjust III |
|---|---|---|---|---|
| Risk Score | 6.11 (2.01, 18.59) 0.0014 | 7.66 (2.28, 25.70) 0.0010 | 7.66 (2.28, 25.70) 0.0010 | 7.50 (1.93, 29.18) 0.0037 |
| Age | 1.02 (0.99, 1.05) 0.1665 | 1.02 (0.99, 1.05) 0.2208 | 1.03 (1.00, 1.06) 0.0806 | 1.02 (0.99, 1.06) 0.1834 |
| Sex | ||||
| Male | 1 | 1 | 1 | NA |
| Female | 1.26 (0.71, 2.24) 0.4278 | 1.22 (0.68, 2.17) 0.5065 | 1.23 (0.69, 2.19) 0.4921 | NA |
| Size (cm) | 1.22 (1.01, 1.47) 0.0422 | 1.26 (1.02, 1.55) 0.0318 | 1.24 (1.00, 1.53) 0.0450 | 1.23 (0.97, 1.57) 0.0828 |
| KRAS mutation | ||||
| Wildtype | 1 | 1 | 1 | NA |
| Mutant | 1.21 (0.51, 2.86) 0.6593 | 1.19 (0.50, 2.84) 0.6990 | 0.95 (0.39, 2.27) 0.9016 | NA |
| TP53 mutation | ||||
| Wildtype | 1 | 1 | 1 | NA |
| Mutant | 1.27 (0.68, 2.37) 0.4612 | 1.40 (0.73, 2.66) 0.3086 | 1.10 (0.55, 2.20) 0.7773 | NA |
| CDKN2A mutation | ||||
| Wildtype | 1 | 1 | 1 | 1 |
| Mutant | 1.87 (1.04, 3.36) 0.0362 | 2.02 (1.07, 3.80) 0.0290 | 1.48 (0.75, 2.93) 0.2546 | 0.79 (0.37, 1.66) 0.5279 |
| SMAD4 mutation | ||||
| Wildtype | 1 | 1 | 1 | NA |
| Mutant | 0.72 (0.37, 1.39) 0.3267 | 0.75 (0.39, 1.46) 0.4045 | 0.85 (0.43, 1.68) 0.6420 | NA |
| BRCA1 mutation | ||||
| Wildtype | 1 | 1 | 1 | 1 |
| Mutant | 4.06 (1.43, 11.53) 0.0086 | 3.72 (1.26, 10.97) 0.0171 | 2.68 (0.89, 8.07) 0.0807 | 2.31 (0.61, 8.72) 0.2188 |
| BRCA2 mutation | ||||
| Wildtype | 1 | 1 | 1 | NA |
| Mutant | 1.87 (0.45, 7.80) 0.3892 | 1.94 (0.44, 8.65) 0.3829 | 2.04 (0.46, 9.10) 0.3476 | NA |
| Site | ||||
| Head of Pancreas | 1 | 1 | 1 | 1 |
| Body and tail of Pancreas and others | 0.39 (0.14, 1.10) 0.0744 | 0.42 (0.15, 1.19) 0.1019 | 0.41 (0.14, 1.20) 0.1052 | 0.54 (0.15, 1.95) 0.3459 |
| Subtype | ||||
| Pancreas-Adenocarcinoma Ductal Type | 1 | 1 | 1 | NA |
| Pancreas-Adenocarcinoma-Other Subtype | 0.60 (0.22, 1.68) 0.3336 | 0.67 (0.24, 1.89) 0.4447 | 0.76 (0.27, 2.20) 0.6180 | NA |
| Grade | ||||
| G1 and G2 | 1 | 1 | 1 | 1 |
| G3 and G4 | 1.41 (0.79, 2.53) 0.2487 | 1.33 (0.73, 2.41) 0.3471 | 1.10 (0.60, 2.01) 0.7582 | 1.12 (0.55, 2.28) 0.7447 |
| T | ||||
| T1 and T2 | 1 | 1 | 1 | 1 |
| T3 and T4 | 2.45 (0.87, 6.88) 0.0887 | inf. (0.00, Inf) 0.9958 | inf. (0.00, Inf) 0.9960 | 1.75 (0.47, 6.47) 0.4049 |
| N | ||||
| N0 | 1 | 1 | 1 | 1 |
| N1 | 2.33 (1.12, 4.85) 0.0231 | 2.48 (0.96, 6.45) 0.0620 | 2.26 (0.87, 5.86) 0.0926 | 1.61 (0.63, 4.09) 0.3195 |
| AJCC stage | ||||
| I | 1 | 1 | 1 | NA |
| II and III | 1.63 (0.58, 4.57) 0.3547 | 1.53 (0.54, 4.32) 0.4194 | 1.43 (0.51, 4.02) 0.4991 | NA |
| Residual tumor | ||||
| R0 | 1 | 1 | 1 | 1 |
| R1 | 2.14 (1.17, 3.92) 0.0132 | 2.27 (1.21, 4.26) 0.0108 | 2.00 (1.06, 3.78) 0.0331 | 1.25 (0.55, 2.83) 0.5878 |
| R2 | 1.92 (0.25, 14.58) 0.5270 | 1.92 (0.24, 15.22) 0.5387 | 2.61 (0.32, 21.37) 0.3718 | 4.69 (0.45, 48.71) 0.1958 |
| Surgical treatment | ||||
| Whipple | 1 | 1 | 1 | NA |
| Distal Pancreatectomy | 0.55 (0.20, 1.54) 0.2520 | 0.60 (0.21, 1.69) 0.3308 | 0.60 (0.21, 1.72) 0.3419 | NA |
| Others | 0.00 (0.00, Inf) 0.9971 | 0.00 (0.00, Inf) 0.9971 | 0.00 (0.00, Inf) 0.9972 | NA |
| History of radiation therapy | ||||
| No | 1 | 1 | 1 | 1 |
| Yes | 0.28 (0.12, 0.66) 0.0035 | 0.27 (0.11, 0.65) 0.0034 | 0.27 (0.11, 0.66) 0.0042 | 0.43 (0.16, 1.19) 0.1059 |
| History of targeted molecular therapy | ||||
| No | 1 | 1 | 1 | 1 |
| Yes | 0.18 (0.10, 0.33) < 0.0001 | 0.16 (0.08, 0.30) < 0.0001 | 0.14 (0.07, 0.28) < 0.0001 | 0.24 (0.07, 0.84) 0.0260 |
| History of chemotherapy | ||||
| No | 1 | 1 | 1 | 1 |
| Yes | 0.36 (0.20, 0.66) 0.0008 | 0.26 (0.14, 0.49) < 0.0001 | 0.22 (0.11, 0.43) < 0.0001 | 0.48 (0.13, 1.79) 0.2740 |
| Tobacco smoking history | ||||
| Lifelong non-smoker | 1 | 1 | 1 | NA |
| Current or former smoker | 0.80 (0.44, 1.44) 0.4526 | 0.81 (0.45, 1.47) 0.4970 | 0.93 (0.51, 1.70) 0.8087 | NA |
| Alcohol drinking history | ||||
| No | 1 | 1 | 1 | NA |
| Yes | 1.45 (0.74, 2.86) 0.2782 | 1.35 (0.66, 2.76) 0.4175 | 1.08 (0.51, 2.25) 0.8467 | NA |
| History of chronic pancreatitis | ||||
| No | 1 | 1 | 1 | NA |
| Yes | 0.70 (0.30, 1.66) 0.4209 | 0.77 (0.31, 1.89) 0.5656 | 0.49 (0.20, 1.24) 0.1319 | NA |
| History of diabetes | ||||
| No | 1 | 1 | 1 | 1 |
| Yes | 0.51 (0.24, 1.10) 0.0849 | 0.54 (0.24, 1.19) 0.1264 | 0.62 (0.28, 1.38) 0.2417 | 0.32 (0.13, 0.79) 0.0141 |
| History of prior malignancy | ||||
| No | 1 | 1 | 1 | NA |
| Yes | 1.59 (0.56, 4.52) 0.3848 | 1.38 (0.48, 4.02) 0.5503 | 1.03 (0.35, 3.02) 0.9599 | NA |
Adjust I model adjust for: Age, Sex, and AJCC Stage;
Adjust II model adjust for: Age, Sex, AJCC Stage, and Risk Score;
Adjust III model adjust for parameters with p < 0.25 based on univariate analysis.
Establishment and validation of a prognostic nomogram
On the basis of the 77 patients with complete clinical details from TCGA-PAAD dataset, a prognostic nomogram predicting 1-year, 2-year, and 3-year OS of PDAC patients was created using a stepwise model of Cox regression. Risk score, age, tumor size, tumor site, history of diabetes, history of radiation therapy, and history of targeted molecular therapy were parameters included in the nomogram (Figure 6A). The AUCs of 1-year, 2-year, and 3-year OS were 0.891 (95% CI: 0.806-0.975), 0.874 (95% CI: 0.779-0.969), and 0.847 (95% CI: 0.700-0.994) (Figure 6B-6D), and the C-index was 0.828 (95% CI: 0.781-0.874). Based on the cut-off value calculated using X-Tile, the patients were divided into two groups of different prognostic risk. Patients with higher risk scores were associated with poorer prognosis (Figure 6E). Calibration curves further revealed that the predicted OS using nomogram was similar to that observed for OS (Figure 6G).
Validation of the nomogram in predicting overall survival of PDAC in TCGA-PAAD dataset. (A) A prognostic nomogram incorporating MTG-based gene signature predicting 1-, 2- and 3-year overall survival of PDAC. (B-D) Prognostic performance of the gene signature-based nomogram, MTG-based gene signature and AJCC staging system using time-dependent ROC for predicting the 1-, 2- and 3-year overall survival of PDAC. (E) Kaplan-Meier survival curve of the nomogram. Patients from TCGA-PAAD dataset are stratified into two groups of different level of risk according to the optimal cut-off value for the nomogram determined by X-Tile software. (F) The time-dependent AUC of the nomogram in predicting overall survival of PDAC. (G) The calibration plot for internal validation of the nomogram. The Y axis represents the actual overall survival, whereas the X axis represents the predicted overall survival.
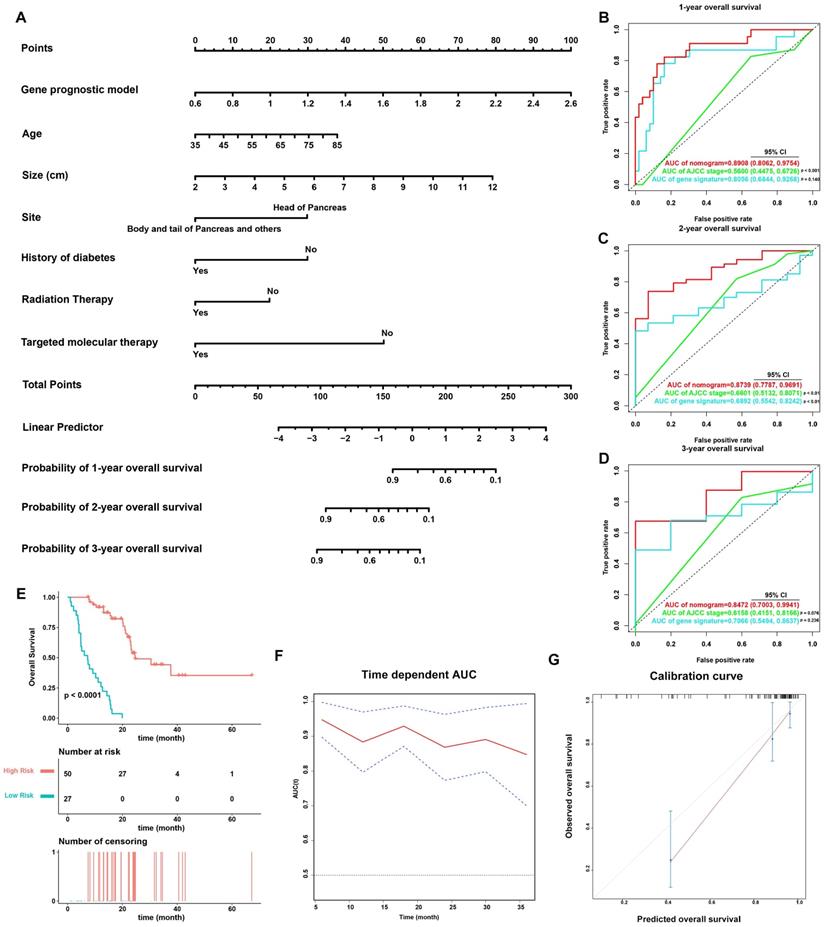
The predictive power of the nomogram was also compared against the AJCC staging system (Figure 6B-D). The AUCs of 1-year, 2-year, and 3-year OS for the AJCC staging system were 0.560 (95% CI: 0.448-0.673), 0.660 (95% CI: 0.513-0.807), and 0.616 (95% CI: 0.415-0.817), while the C-index was 0.572 (95% CI: 0.502-0.643). The nomogram incorporating the MTG-based gene signature had significantly higher AUCs in predicting 1-year and 2-year OS of PDAC patients compared to those of the AJCC staging system (p < 0.05).
GSEA
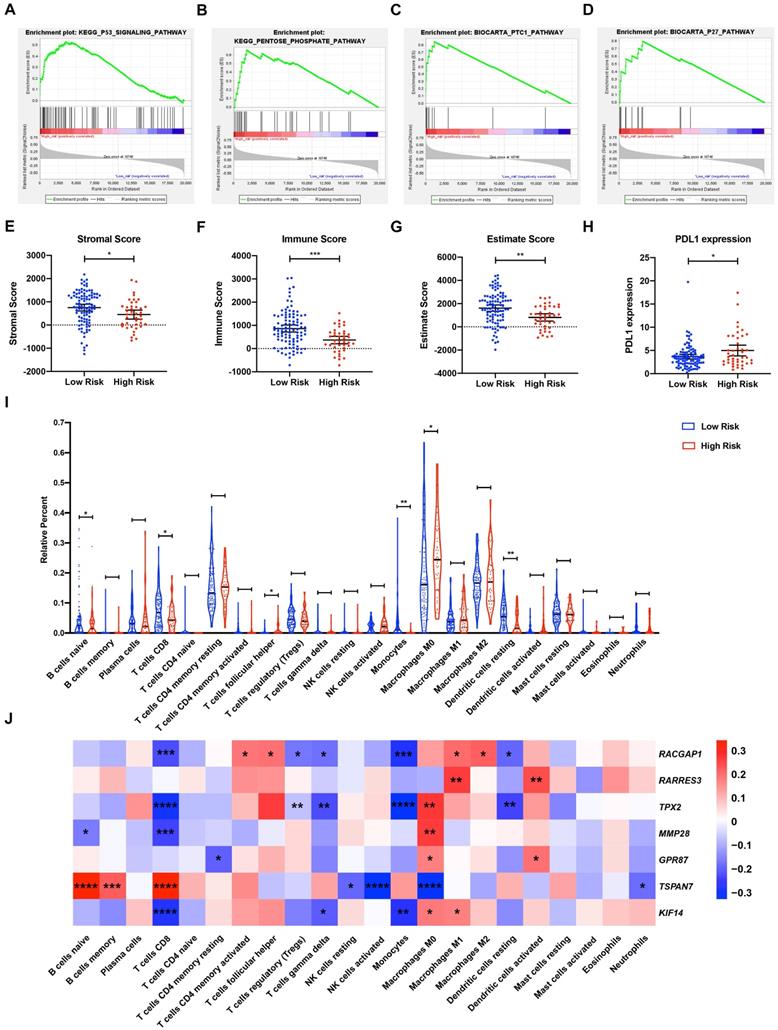
To explore the underlying mechanisms of the MTG-based gene signature, patients from TCGA dataset were separated into high- and low-risk groups according to the optimal cut-off value of the MTG-based gene signature determined by X-Tile. In the high-risk group, enriched KEGG pathway analysis revealed that molecular alteration was closely related to the pentose-phosphate and P53 signaling pathways. A total of 28 oncological signatures, including the pathways PTC1 and P27 were also significantly enriched (Figure 7A-D). Full GSEA analysis results are presented in Table S6.
Gene Set Enrichment Analysis (GSEA) and tumor immunity analysis of the MTG-based gene signature. (A-D) Top signaling pathways and oncological signatures significantly enriched in the high-risk group identified by GSEA. (E-G) Distribution of the Stromal scores, Immune scores, and ESTIMATE scores in high-risk and low-risk groups from TCGA-PAAD dataset. The Stromal scores, Immune scores, and ESTIMATE scores were calculated using the ESTIMATE algorithm (https://bioinformatics.mdanderson.org/public-software/estimate/). (H) Differentially expressed PDL1 between the high-risk and low-risk groups of TCGA-PAAD dataset. (I) Differential immune infiltrates in high-risk and low-risk groups of TCGA-PAAD dataset. The proportion of 22 immune infiltrates for each case are estimated using the CIBERSORT algorithm (https://cibersort.stanford.edu/index.php). (J) Correlation matrix of the relationship between the expression of the seven prognostic DE-MTGs and the differential immune infiltration levels. Pearson correlation analysis was used to calculate the correlations. Colors from blue to red present the Pearson correlation coefficient. * p < 0.05, ** p < 0.01. *** p < 0.001. **** p < 0.0001.
Analysis of tumor immunity
The relationship between risk score and tumor immunity was further analyzed. Tumor purity and the infiltration level of immune cell were estimated. Tumors in the high-risk group had significantly lower stromal, immune, and ESTIMATE scores, indicating a lower level of stroma, immune cell infiltration, and tumor purity (Figure 7E-G). Moreover, tumors in the high-risk group had significantly higher levels of PDL1 expression (Figure 7H). To further explore the underlying molecular mechanisms of the MTG-based gene signature and their relevance to tumor immunity, the proportion of 22 immune infiltrates (naïve B cells, memory B cells, plasma cells, CD8 T cells, CD4 naïve T cells, CD4 memory resting T cells, CD4 memory activated T cells, follicular helper T cells, regulatory T cells (Tregs), gamma delta T cells, resting NK cells, activated NK cells, monocytes, M0 macrophages, M1 macrophages, M2 macrophages, resting dendritic cells, activated dendritic cells, resting mast cells, activated mast cells, eosinophils, and neutrophils) was estimated for each case using CIBERSORT. The high-risk group was found to be associated with significantly higher levels of follicular helper T cells and M0 macrophage infiltration, and lower levels of infiltrating naïve B cells, CD8 T cells, monocytes, and resting dendritic cells (Figure 7I).
Correlations between DE-MTGs gene expression and immune infiltration levels were then evaluated to identify potential immune regulators (Figure 7J). In terms of immune infiltrates upregulated in the high-risk group, the expression of RACGAP1 was positively correlated with infiltration of follicular helper T cells (r = 0.1924, p < 0.05). The expressions of TPX2, MMP28, GPR87, and KIF14 were positively correlated with M0 macrophage infiltration, whereas TSPAN7 expression was negatively correlated with M0 macrophage infiltration (r = 0.2688, 0.2615, 0.1735, 0.1794, and -0.3277, respectively; p < 0.05). In terms of immune infiltrates downregulated in the high-risk group, MMP28 was negatively correlated with the infiltration of naïve B cells, whereas TSPAN7 was positively correlated with naïve B cell infiltration (r = -0.1658 and 0.3352, respectively; p < 0.05). In addition, RACGAP1, TPX2, MMP28, and KIF14 were negatively correlated, while TSPAN7 was positively correlated with the infiltration of CD8 T cells (r = -0.2248, -0.2975, -0.2394, -0.2790, and 0.3450, respectively; p < 0.05). Lastly, RACGAP1, TPX2, and KIF14 were negatively correlated with monocyte infiltration, while RACGAP1 and TPX2 were negatively correlated with the infiltration of resting dendritic cells (r = -0.2787, -0.3240, -0.2714, -0.1925, and -0.2366; p < 0.05).
Discussion
Traditional clinical pathological parameters, such as AJCC staging, do not accurately or dynamically reflect PDAC progress and show poor prognosis predictive capacity. Accurately predicting PDAC prognosis will allow for more aggressive treatment, earlier intervention, and delayed tumor progression. As PDAC is highly heterogeneous, its progression involves a network of multiple complex signaling pathways. Hence, molecular prognostic markers can dynamically reflect tumor progress and are quantitatively measured. Specifically, a gene signature integrating multiple gene markers may be superior compared to a single marker, in predicting biological characteristics and prognosis. Nomograms integrate multiple molecular, biological, and clinicopathological prognostic parameters, individually calculating the numerical probability of clinical events [26] and are widely used in the evaluation of oncology and clinical evaluation of prognosis. Compared with conventional staging strategies, nomograms incorporating gene signatures may prove more accurate in predicting prognosis and in providing a simpler interface for patients to understand, which is helpful in clinical decision-making.
In the current study, 246 DE-MTGs of PDAC were identified. Analysis of OS revealed that 36 DE-MTGs were closely related to the OS of PDAC. A novel MTG-based gene signature was established to predict PDAC OS in TCGA-PAAD dataset. Among these, RACGAP1, RARRES3, TPX2, MMP28, GPR87, and KIF14 were upregulated and positively associated with poor survival, whereas TSPAN7 was downregulated and identified as a tumor suppressor. The MTG-based gene signature was an independent prognostic factor of PDAC, which could distinguish patients with differential OS risk. Patients in the low-risk group had a significantly better prognosis than the high-risk group. The prognostic performance of the MTG-based gene signature was also validated in the external datasets. In addition, a prognostic nomogram predicting 1-year, 2-year, and 3-year OS of PDAC was established based on the MTG-based gene signature and clinical pathological parameters. Analysis of tumor immunity further identified significantly higher levels of follicular helper T cell and M0 macrophage infiltration, and lower infiltration of naïve B cells, CD8 T cells, monocytes, and resting dendritic cells in tumors of the high-risk group. Finally, regulatory relationships between the seven DE-MTGs and alterations in immune cell infiltration were established to explore the underlying mechanisms.
The MTG-based gene signature contains six genes previously reported to be associated with PDAC. TPX2 is required for normal assembly of mitotic spindles and for mediating localization and activation of AURKA by promoting autophosphorylation. The expression of TPX2 is related to the TNM stage and pathological grade of various digestive system cancers, with increased expression having been shown to be significantly associated with poorer prognosis. In PDAC, genomic hybridization and integrated analyses of RNA and DNA identified TPX2 as a potential target for amplification in both PDAC and non-small-cell lung cancer [27]. Further, TPX2 expression is upregulated in PDAC cell lines and tumor tissues, whereas its knockdown using siRNA suppressed the growth of PDAC cells via induction of apoptosis in vitro. Suppression of TPX2 expression also inhibits the growth of PDAC in vivo and enhances the sensitivity of pancreatic cancer cells to paclitaxel [28]. In addition, TPX2 was reported to promote tumor angiogenesis in PDAC. TPX2 siRNA upregulated the expression of IGFBP-3, resulting in significantly reduced CD34-positive micro vessels in the tumor. Hence, TPX2 siRNA may exhibit an anti-angiogenic effect partially by upregulating the expression of IGFBP-3 [29]. A recent study revealed that upregulation of TPX2 in PDAC is associated with KRAS mutation, whereas suppressing TPX2 and its target protein AURKA inhibits growth and migration in KRAS-mutant PDAC cells [30].
GPR87 is a receptor for lysophosphatidic acid (LPA). p53 directly upregulates GPR87 through p53-responsive element, and it is critical for p53-dependent survival in response to DNA damage [31]. GPR87 is also upregulated in PDAC cells and tissues and is related to significantly poorer prognosis and clinicopathological parameters. Further, its upregulation promotes proliferation and angiogenesis of PDAC and increases resistance to gemcitabine through the NF-κB signaling pathway [32]. Hence, GPR87 is regarded a potential target for treatment of PDAC. Bioengineered siRNA loaded nanoparticles may effectively inhibit the expression of GPR87, exerting a cytotoxic effect [33]. The abnormal expression of GPR87 was also reported in a variety of malignancies. For instance, it was found to be upregulated in squamous cell carcinomas of multiple organs as well as in their lymph node metastasis. In addition, GPR87 is highly expressed in lung adenocarcinomas and transitional cell carcinoma of the bladder [34]. Alternatively, inhibition of GPR87 suppresses the migration and proliferation of lung cancer [35] Moreover, GPR87 is overexpressed in hepatocellular carcinoma, which upregulates CD133 expression and increases cancer stem cell migration and invasion [36].
Kinesin-like protein KIF14 is a microtubule motor protein that binds microtubules in the form of heterodimers with high affinity. In addition, KIF14 has ATPase activity and is critical in various biological processes including cytokinesis, cell division, cell proliferation, and apoptosis. In PDAC, KIF14 was reported to be associated with perineural invasion [37] with KIF14 found to be upregulated in PDAC and cancer cells invading the perineural niche. Alternatively, down-regulation of KIF14 altered the perineural invasion pattern of PDAC cells. Moreover, overexpression of KIF14 is associated with poorer prognosis of PDAC [38]. KIF14 was identified as a candidate oncogene in the 1q minimal region of genomic gain in breast cancer, medulloblastoma, lung cancer, retinoblastoma, and renal cell carcinomas [39] with its overexpression being associated with poorer prognosis in these malignancies. KIF14 also participates in modulating components of adhesion on the tumor cell surface, regulating migration and invasion through Rap1a-Radil signaling, thereby promoting cell motility during metastasis [40].
RACGAP1 is a component of the central spindle in the complex mediating microtubule-dependent Rho signaling during cytokinesis. It is also upregulated in PDAC and is related to shorter OS [38]; however, the associated mechanism has not yet been elucidated. RACGAP1 is also critical in the progression of multiple cancers, with its overexpression reported to be associated with histological grade, Ki67 protein expression, and poorer survival [41]. Expression of RACGAP1 also impacts invasiveness of cancer cells resulting in significantly poorer prognosis and lymph node and distant metastasis [42]. Hence, RACGAP1 has potential of predicting metastasis in PDAC.
RARRES3 is important in regulating EMT and metastasis of multiple cancers. Consistent with our study, previous studies revealed that it is upregulated in PDAC and is associated with poor survival [43]. The oncogenic role of RARRES3 is associated with EPS8, which is the target of antitumor miR-130b-5p. RARRES3 is also an important regulator of oncogenic RAS signaling by binding to the hyper-variable regions of RAS proteins [44]. In contrast, in breast cancer, RARRES3 is a tumor suppressor. Specifically, it modulates the acylation status of Wnt proteins, suppressing the EMT and cancer stem cell properties in breast cancer [45]. In colorectal cancer, RARRES3 is downregulated in tumor tissues; in contrast, its upregulation inhibits metastasis through EMT regulation [46]. Hence, RARRES3 may play a two-way regulatory role in mediating metastasis, especially in the presence of different RAS mutation states. The role of RARRES3 in PDAC and metastasis needs to be further elucidated.
MMP28 degrades casein, playing a role in tissue repair and homeostasis. It also modulates cell behavior by releasing growth factors and active peptides from the extracellular matrix. In PDAC, the expression of MMP28 is upregulated by the oncogenic protein PARP1 via the STAT3-MMP7 axis [47]. Moreover, MMP28 is expressed in many cancers [48] and has been shown to induce EMT in lung cancer through the TGF-β signaling pathway, thereby promoting invasion [49]. MMP28 is also overexpressed in gastric cancer and is related to lymph node metastasis, tumor invasion, and poor OS [50]. The role of MMP28 in promoting metastasis via Notch3 signaling was also presented in hepatocellular carcinoma [51].
The role of TSPAN7 in PDAC has not yet been reported. However, TSPAN7 has been shown to participate in regulating cell proliferation and motility. Consistent with our results, higher expression of TSPAN7 is related to longer tumor-specific survival and disease-free survival in clear-cell renal cell carcinoma. Moreover, TSPAN7 is downregulated in metastases, indicating its anti-metastatic role [52]. TSPAN7 is also downregulated in the metastasis of uterine leiomyosarcoma compared with in the primary tumor [53]. In multiple myeloma, TSPAN7 increases cell adhesion and is associated with improved survival [54]. TSPAN7 is also downregulated in soft tissue sarcoma and is associated with better survival [55]. In contrast, TSPAN7 is overexpressed in lung cancer and promotes migration and EMT [56].
Tumor immune evasion is critical in tumor progression [57]. Tumors can manipulate immune cells in the tumor microenvironment to evade surveillance of the immune system. This can be achieved by recruiting immunosuppressive cells, reducing tumor immunogenicity, or utilizing immunosuppressive mechanisms [58]. In our study, follicular helper T cells and M0 macrophage infiltration was significantly upregulated in high-risk tumor tissues, whereas naïve B cell, CD8+ T cell, monocyte, and resting dendritic cell infiltration was significantly downregulated. CD8+ cytotoxic T lymphocytes recognize antigens presented by MHC and are the primary immune cells that target tumor cells. Consistent with our results, higher levels of CD8+ infiltration is associated with improved prognosis in PDAC [59]. Further spatial analysis showed that there was a large heterogeneity in the density of CD8+ cells in PDAC tumor tissues. The infiltration of CD8+ cells in the tumor center was significantly lower than in the tumor margin and was associated with poorer prognosis. Tumor CD274 expression and tertiary lymphatic structure are associated with higher CD8+ cell density at the tumor margin [60]. The role of CD4+ T cells and regulatory T cells in tumor immunity is more complex. On the one hand, CD4+ T cells are required for the formation of effective antitumor immunity as they promote the function of CTLs and maintenance of memory. CD4+ helper T cells also amplify the effects of T cells and B cells and help CTLs overcome negative regulation [61]. On the other hand, regulatory T cells are enriched within primary and metastatic tumors and are associated with poor prognosis [62]. Follicular helper T cells were previously reported to be associated with the function of CD8+ T cells [63]. In our study, with the lower infiltration of CD8+ T cells, a higher infiltration of follicular helper T cells was identified in the high-risk group, which was seemingly a compensatory effect. Similarly, M0 macrophages are upregulated in stage N1 tumors of colorectal cancer, indicating their association with metastasis and progression [64]. In addition, we found that many of the identified metastasis-related DEGs are significantly associated with the infiltration level of various immune cells, suggesting that a potential regulatory relationship may exist. Specifically, genes associated with metastasis are important regulators of the extracellular matrix (ECM), which affects a myriad of aspects related to tumor biology and modulates the function and recruitment of immune cells through direct effects or increased cytokine expression in the tumor microenvironment (TME) [65]. We, therefore, postulate that PDAC cells may manipulate the function and infiltration levels of immune cells in the tumor microenvironment during invasion and metastasis. The cells may then subsequently recruit immunosuppressive cells and alter the secretion profile of cytokines by immune cells and TME to allow immune evasion and invasion. This hypothesis may elucidate the underlying mechanism related to the poor prognosis of patients in the high-risk group of pancreatic cancer; therefore, it deserves further experimental validation.
To the best of our knowledge, the MTG-based gene signature and associated nomogram presented herein, have not yet been reported. Our prognostic model was based on quantitative expression of a panel of genes, which is more economically and practically feasible than genome-wide sequencing. Further, our graphic scoring system of nomograms is simple for patients to understand. Nomograms combined with gene prognosis models and clinical and pathological parameters may provide clinicians with novel methods to accurately evaluate the prognosis of post-surgical PDAC patients, thus achieving personalized treatment. However, the present study has certain limitations. First, the clinical information for our dataset was primarily obtained from TCGA database, which is comprised largely of Caucasian North American patients, and thus caution should be exercised when extending our results to patients of other ethnic groups. Protein expression levels of these DE-MTGs also require further analysis. The molecular mechanisms of their involvement in metastasis and immunomodulation in PDAC depend on further experimental studies for clarification. In addition, the levels of immune cell infiltration in our study were based on algorithmic evaluation and require further experimental validation.
Conclusions
Herein, a prognostic predictive model based on seven DE-MTGs was established for PDAC. A prognostic nomogram was also established combining the MTG-based gene signature and prognostic-related clinical and pathological parameters to predict the OS of PDAC patients. The seven DE-MTGs are significantly related to the progression and OS of PDAC and are potential targets for treatment. Moreover, significant differences in immune cell infiltration were identified between tumors in the high- and low-risk groups with the expression of multiple DE-MTGs closely associated with immune cell infiltration. The nomograms incorporating the MTG-based gene signature were determined to be superior in predicting the OS of PDAC patients, compared to current strategies, and may be useful for designing personalized therapy and medical decisions.
Abbreviations
AUC: area under the curve; CI: confidence interval; DEGs: differentially expressed genes; DE-MTGs: differentially expressed MTGs; ECM: extracellular matrix; EMT: epithelial-to-mesenchymal; GSEA: gene set enrichment analysis; HR: hazard ratio; MTGs: metastasis-related genes; PDAC: pancreatic ductal adenocarcinoma; ROC: receiver operating characteristic; TME: tumor microenvironment; TPM: transcripts per million; Tregs: regulatory T cells.
Supplementary Material
Supplementary figures and tables.
Acknowledgements
Availability of data and materials
The datasets analyzed in the current study are available at the Gene Expression Omnibus (https://www.ncbi.nlm.nih.gov/geo/), TCGA (https://portal.gdc.cancer.gov/) and ICGC (https://dcc.icgc.org/releases/current/Projects/PACA-AU).
Funding
This research was supported by the Nature Science Foundation of Beijing [grant number: 7202164], CAMS Innovation Fund for Medical Sciences (CIFMS) [grant number: 2016-12M-3-005], and CAMS Innovation Fund for graduate students [grant number: 2019-1002-44].
Authors' contributions
Ziwen Liu and Wei Liu: conception, design, and study supervision. Mengwei Wu, Rui Liu, and Xiaobin Li: development of methodology, analysis and interpretation of data, and writing of the manuscript. Ziwen Liu and Hongwei Yuan: review of the manuscript.
Competing Interests
The authors have declared that no competing interest exists.
References
1. Siegel RL, Miller KD, Jemal A. Cancer statistics, 2020. CA Cancer J Clin. 2020;70:7-30
2. Rahib L, Smith BD, Aizenberg R, Rosenzweig AB, Fleshman JM, Matrisian LM. Projecting cancer incidence and deaths to 2030: the unexpected burden of thyroid, liver, and pancreas cancers in the United States. Cancer research. 2014;74:2913-21
3. Kamisawa T, Wood LD, Itoi T, Takaori K. Pancreatic cancer. Lancet. 2016;388:73-85
4. Kamarajah SK, Burns WR, Frankel TL, Cho CS, Nathan H. Validation of the American Joint Commission on Cancer (AJCC) 8th Edition Staging System for Patients with Pancreatic Adenocarcinoma: A Surveillance, Epidemiology and End Results (SEER) Analysis. Ann Surg Oncol. 2017;24:2023-30
5. Chen H, Kong Y, Yao Q, Zhang X, Fu Y, Li J. et al. Three hypomethylated genes were associated with poor overall survival in pancreatic cancer patients. Aging. 2019;11:885-97
6. Liao X, Huang K, Huang R, Liu X, Han C, Yu L. et al. Genome-scale analysis to identify prognostic markers in patients with early-stage pancreatic ductal adenocarcinoma after pancreaticoduodenectomy. Onco Targets Ther. 2017;10:4493-506
7. Zhou C, Zhao Y, Yin Y, Hu Z, Atyah M, Chen W. et al. A robust 6-mRNA signature for prognosis prediction of pancreatic ductal adenocarcinoma. Int J Biol Sci. 2019;15:2282-95
8. Singhi AD, Koay EJ, Chari ST, Maitra A. Early Detection of Pancreatic Cancer: Opportunities and Challenges. Gastroenterology. 2019;156:2024-40
9. Lambert AW, Pattabiraman DR, Weinberg RA. Emerging Biological Principles of Metastasis. Cell. 2017;168:670-91
10. Network CGAR. Integrated Genomic Characterization of Pancreatic Ductal Adenocarcinoma. Cancer Cell. 2017;32:185-203.e13
11. Zheng G, Ma Y, Zou Y, Yin A, Li W, Dong D. HCMDB: the human cancer metastasis database. Nucleic Acids Res. 2018;46:D950-d5
12. Gautier L, Cope L, Bolstad BM, Irizarry RA. affy-analysis of Affymetrix GeneChip data at the probe level. Bioinformatics. 2004;20:307-15
13. Ritchie ME, Phipson B, Wu D, Hu Y, Law CW, Shi W. et al. limma powers differential expression analyses for RNA-sequencing and microarray studies. Nucleic Acids Res. 2015;43:e47
14. Tang Z, Li C, Kang B, Gao G, Li C, Zhang Z. GEPIA: a web server for cancer and normal gene expression profiling and interactive analyses. Nucleic Acids Res. 2017;45:W98-w102
15. Dennis G Jr, Sherman BT, Hosack DA, Yang J, Gao W, Lane HC. et al. DAVID: Database for Annotation, Visualization, and Integrated Discovery. Genome Biol. 2003;4:P3
16. Camp RL, Dolled-Filhart M, Rimm DL. X-tile: a new bio-informatics tool for biomarker assessment and outcome-based cut-point optimization. Clinical cancer research: an official journal of the American Association for Cancer Research. 2004;10:7252-9
17. DeLong ER, DeLong DM, Clarke-Pearson DL. Comparing the areas under two or more correlated receiver operating characteristic curves: a nonparametric approach. Biometrics. 1988;44:837-45
18. Yang S, He P, Wang J, Schetter A, Tang W, Funamizu N. et al. A Novel MIF Signaling Pathway Drives the Malignant Character of Pancreatic Cancer by Targeting NR3C2. Cancer research. 2016;76:3838-50
19. Scarlett CJ, Salisbury EL, Biankin AV, Kench J. Precursor lesions in pancreatic cancer: morphological and molecular pathology. Pathology. 2011;43:183-200
20. Subramanian A, Tamayo P, Mootha VK, Mukherjee S, Ebert BL, Gillette MA. et al. Gene set enrichment analysis: a knowledge-based approach for interpreting genome-wide expression profiles. Proceedings of the National Academy of Sciences of the United States of America. 2005;102:15545-50
21. Yoshihara K, Shahmoradgoli M, Martinez E, Vegesna R, Kim H, Torres-Garcia W. et al. Inferring tumour purity and stromal and immune cell admixture from expression data. Nat Commun. 2013;4:2612
22. Newman AM, Liu CL, Green MR, Gentles AJ, Feng W, Xu Y. et al. Robust enumeration of cell subsets from tissue expression profiles. Nat Methods. 2015;12:453-7
23. Badea L, Herlea V, Dima SO, Dumitrascu T, Popescu I. Combined gene expression analysis of whole-tissue and microdissected pancreatic ductal adenocarcinoma identifies genes specifically overexpressed in tumor epithelia. Hepatogastroenterology. 2008;55:2016-27
24. Pei H, Li L, Fridley BL, Jenkins GD, Kalari KR, Lingle W. et al. FKBP51 affects cancer cell response to chemotherapy by negatively regulating Akt. Cancer Cell. 2009;16:259-66
25. Donahue TR, Tran LM, Hill R, Li Y, Kovochich A, Calvopina JH. et al. Integrative survival-based molecular profiling of human pancreatic cancer. Clinical cancer research: an official journal of the American Association for Cancer Research. 2012;18:1352-63
26. Balachandran VP, Gonen M, Smith JJ, DeMatteo RP. Nomograms in oncology: more than meets the eye. Lancet Oncol. 2015;16:e173-80
27. Tonon G, Wong KK, Maulik G, Brennan C, Feng B, Zhang Y. et al. High-resolution genomic profiles of human lung cancer. Proceedings of the National Academy of Sciences of the United States of America. 2005;102:9625-30
28. Warner SL, Stephens BJ, Nwokenkwo S, Hostetter G, Sugeng A, Hidalgo M. et al. Validation of TPX2 as a potential therapeutic target in pancreatic cancer cells. Clinical cancer research: an official journal of the American Association for Cancer Research. 2009;15:6519-28
29. Miwa T, Kokuryo T, Yokoyama Y, Yamaguchi J, Nagino M. Therapeutic potential of targeting protein for Xklp2 silencing for pancreatic cancer. Cancer Med. 2015;4:1091-100
30. Gomes-Filho SM, Dos Santos EO, Bertoldi ERM, Scalabrini LC, Heidrich V, Dazzani B. et al. Aurora A kinase and its activator TPX2 are potential therapeutic targets in KRAS-induced pancreatic cancer. Cell Oncol (Dordr). 2020
31. Zhang Y, Qian Y, Lu W, Chen X. The G protein-coupled receptor 87 is necessary for p53-dependent cell survival in response to genotoxic stress. Cancer research. 2009;69:6049-56
32. Wang L, Zhou W, Zhong Y, Huo Y, Fan P, Zhan S. et al. Overexpression of G protein-coupled receptor GPR87 promotes pancreatic cancer aggressiveness and activates NF-κB signaling pathway. Molecular cancer. 2017;16:61
33. Ceylan S, Bahadori F, Akbas F. Engineering of siRNA loaded PLGA Nano-Particles for highly efficient silencing of GPR87 gene as a target for pancreatic cancer treatment. Pharm Dev Technol. 2020:1-10
34. Glatt S, Halbauer D, Heindl S, Wernitznig A, Kozina D, Su KC. et al. hGPR87 contributes to viability of human tumor cells. International journal of cancer. 2008;122:2008-16
35. Kita Y, Go T, Nakashima N, Liu D, Tokunaga Y, Zhang X. et al. Inhibition of Cell-surface Molecular GPR87 With GPR87-suppressing Adenoviral Vector Disturb Tumor Proliferation in Lung Cancer Cells. Anticancer Res. 2020;40:733-41
36. Yan M, Li H, Zhu M, Zhao F, Zhang L, Chen T. et al. G protein-coupled receptor 87 (GPR87) promotes the growth and metastasis of CD133⁺ cancer stem-like cells in hepatocellular carcinoma. PLoS One. 2013;8:e61056
37. Abiatari I, DeOliveira T, Kerkadze V, Schwager C, Esposito I, Giese NA. et al. Consensus transcriptome signature of perineural invasion in pancreatic carcinoma. Mol Cancer Ther. 2009;8:1494-504
38. Zhou Z, Cheng Y, Jiang Y, Liu S, Zhang M, Liu J. et al. Ten hub genes associated with progression and prognosis of pancreatic carcinoma identified by co-expression analysis. Int J Biol Sci. 2018;14:124-36
39. Szponar A, Zubakov D, Pawlak J, Jauch A, Kovacs G. Three genetic developmental stages of papillary renal cell tumors: duplication of chromosome 1q marks fatal progression. International journal of cancer. 2009;124:2071-6
40. Ahmed SM, Thériault BL, Uppalapati M, Chiu CW, Gallie BL, Sidhu SS. et al. KIF14 negatively regulates Rap1a-Radil signaling during breast cancer progression. J Cell Biol. 2012;199:951-67
41. Pliarchopoulou K, Kalogeras KT, Kronenwett R, Wirtz RM, Eleftheraki AG, Batistatou A. et al. Prognostic significance of RACGAP1 mRNA expression in high-risk early breast cancer: a study in primary tumors of breast cancer patients participating in a randomized Hellenic Cooperative Oncology Group trial. Cancer Chemother Pharmacol. 2013;71:245-55
42. Saigusa S, Tanaka K, Mohri Y, Ohi M, Shimura T, Kitajima T. et al. Clinical significance of RacGAP1 expression at the invasive front of gastric cancer. Gastric Cancer. 2015;18:84-92
43. Fukuhisa H, Seki N, Idichi T, Kurahara H, Yamada Y, Toda H. et al. Gene regulation by antitumor miR-130b-5p in pancreatic ductal adenocarcinoma: the clinical significance of oncogenic EPS8. J Hum Genet. 2019;64:521-34
44. Engin HB, Carlin D, Pratt D, Carter H. Modeling of RAS complexes supports roles in cancer for less studied partners. BMC Biophys. 2017;10:5
45. Hsu TH, Jiang SY, Chang WL, Eckert RL, Scharadin TM, Chang TC. Involvement of RARRES3 in the regulation of Wnt proteins acylation and signaling activities in human breast cancer cells. Cell Death Differ. 2015;22:801-14
46. Wang Z, Wang L, Hu J, Fan R, Zhou J, Wang L. et al. RARRES3 suppressed metastasis through suppression of MTDH to regulate epithelial-mesenchymal transition in colorectal cancer. Am J Cancer Res. 2015;5:1988-99
47. Martínez-Bosch N, Iglesias M, Munné-Collado J, Martínez-Cáceres C, Moreno M, Guerra C. et al. Parp-1 genetic ablation in Ela-myc mice unveils novel roles for Parp-1 in pancreatic cancer. J Pathol. 2014;234:214-27
48. Marchenko GN, Strongin AY. MMP-28, a new human matrix metalloproteinase with an unusual cysteine-switch sequence is widely expressed in tumors. Gene. 2001;265:87-93
49. Illman SA, Lehti K, Keski-Oja J, Lohi J. Epilysin (MMP-28) induces TGF-beta mediated epithelial to mesenchymal transition in lung carcinoma cells. J Cell Sci. 2006;119:3856-65
50. Jian P, Yanfang T, Zhuan Z, Jian W, Xueming Z, Jian N. MMP28 (epilysin) as a novel promoter of invasion and metastasis in gastric cancer. BMC cancer. 2011;11:200
51. Zhou J, Zheng X, Feng M, Mo Z, Shan Y, Wang Y. et al. Upregulated MMP28 in Hepatocellular Carcinoma Promotes Metastasis via Notch3 Signaling and Predicts Unfavorable Prognosis. Int J Biol Sci. 2019;15:812-25
52. Wuttig D, Zastrow S, Füssel S, Toma MI, Meinhardt M, Kalman K. et al. CD31, EDNRB and TSPAN7 are promising prognostic markers in clear-cell renal cell carcinoma revealed by genome-wide expression analyses of primary tumors and metastases. International journal of cancer. 2012;131:E693-704
53. Davidson B, Abeler VM, Førsund M, Holth A, Yang Y, Kobayashi Y. et al. Gene expression signatures of primary and metastatic uterine leiomyosarcoma. Hum Pathol. 2014;45:691-700
54. Cheong CM, Chow AW, Fitter S, Hewett DR, Martin SK, Williams SA. et al. Tetraspanin 7 (TSPAN7) expression is upregulated in multiple myeloma patients and inhibits myeloma tumour development in vivo. Exp Cell Res. 2015;332:24-38
55. Gu HY, Zhang C, Guo J, Yang M, Zhong HC, Jin W. et al. Risk score based on expression of five novel genes predicts survival in soft tissue sarcoma. Aging. 2020;12:3807-27
56. Wang X, Lin M, Zhao J, Zhu S, Xu M, Zhou X. TSPAN7 promotes the migration and proliferation of lung cancer cells via epithelial-to-mesenchymal transition. Onco Targets Ther. 2018;11:8815-22
57. Fouad YA, Aanei C. Revisiting the hallmarks of cancer. Am J Cancer Res. 2017;7:1016-36
58. Schreiber RD, Old LJ, Smyth MJ. Cancer immunoediting: integrating immunity's roles in cancer suppression and promotion. Science. 2011;331:1565-70
59. Ino Y, Yamazaki-Itoh R, Shimada K, Iwasaki M, Kosuge T, Kanai Y. et al. Immune cell infiltration as an indicator of the immune microenvironment of pancreatic cancer. British journal of cancer. 2013;108:914-23
60. Mochizuki M, Shibuya I, Uchida K, Kagawa T. A method for estimating contact time of red cells in lung capillaries from O2 and CO2 concentrations in rebreathing air in man. Adv Exp Med Biol. 1987;215:51-9
61. Borst J, Ahrends T, Babala N, Melief CJM, Kastenmuller W. CD4(+) T cell help in cancer immunology and immunotherapy. Nat Rev Immunol. 2018;18:635-47
62. Tanaka A, Sakaguchi S. Regulatory T cells in cancer immunotherapy. Cell research. 2017;27:109-18
63. Shi W, Dong L, Sun Q, Ding H, Meng J, Dai G. Follicular helper T cells promote the effector functions of CD8(+) T cells via the provision of IL-21, which is downregulated due to PD-1/PD-L1-mediated suppression in colorectal cancer. Exp Cell Res. 2018;372:35-42
64. Ge P, Wang W, Li L, Zhang G, Gao Z, Tang Z. et al. Profiles of immune cell infiltration and immune-related genes in the tumor microenvironment of colorectal cancer. Biomedicine & pharmacotherapy = Biomedecine & pharmacotherapie. 2019;118:109228
65. Blomberg OS, Spagnuolo L, de Visser KE. Immune regulation of metastasis: mechanistic insights and therapeutic opportunities. Dis Model Mech. 2018 11
Author contact
![]() Corresponding authors: Ziwen Liu, No. 1 Shuaifuyuan, Dongcheng District, Beijing, China. E-mail: liuziwencn; Phone: +86-010-69152600; Wei Liu, No. 1 Shuaifuyuan, Dongcheng District, Beijing, China. E-mail: liuwei3359cn; Phone: +86-010-69152600.
Corresponding authors: Ziwen Liu, No. 1 Shuaifuyuan, Dongcheng District, Beijing, China. E-mail: liuziwencn; Phone: +86-010-69152600; Wei Liu, No. 1 Shuaifuyuan, Dongcheng District, Beijing, China. E-mail: liuwei3359cn; Phone: +86-010-69152600.