Impact Factor ISSN: 1837-9664

 Global reach, higher impact
J Cancer 2020; 11(17):4996-5006. doi:10.7150/jca.45296 This issue Cite
Research Paper
Identification of a Glucose Metabolism-related Signature for prediction of Clinical Prognosis in Clear Cell Renal Cell Carcinoma
Sheng Wang1,2, Ling Zhang1,2, Zhihong Yu2, Kequn Chai2, Jiabin Chen2 ![]()
1. The Second Clinical Medical College, Zhejiang Chinese Medicine University, Hangzhou, Zhejiang.
2. Department of Oncology, Tongde Hospital of Zhejiang, Hangzhou, Zhejiang 310053, P.R. China.
Received 2020-2-25; Accepted 2020-5-17; Published 2020-6-21
Abstract
Background: Clear cell renal cell carcinoma (ccRCC) is one of the most prevalent and invasive histological subtypes among all renal cell carcinomas (RCC). Cancer cell metabolism, particularly glucose metabolism, has been reported as a hallmark of cancer. However, the characteristics of glucose metabolism-related gene sets in ccRCC have not been systematically profiled.
Methods: In this study, we downloaded a gene expression profile and glucose metabolism-related gene set from TCGA (The Cancer Genome Altas) and MSigDB, respectively, to analyze the characteristics of glucose metabolism-related gene sets in ccRCC. We used a multivariable Cox regression analysis to develop a risk signature, which divided patients into low- and high- risk groups. In addition, a nomogram that combined the risk signature and clinical characteristics was created for predicting the 3- and 5-year overall survival (OS) of ccRCC. The accuracy of the nomogram prediction was evaluated using the area under the receiver operating characteristic curve (AUC) and a calibration plot.
Results: A total of 231 glucose metabolism-related genes were found, and 68 differentially expressed genes (DEGs) were identified. After screening by univariate regression analysis, LASSO regression analysis and multivariable Cox regression analysis, six glucose metabolism-related DEGs (FBP1, GYG2, KAT2A, LGALS1, PFKP, and RGN) were selected to develop a risk signature. There were significant differences in the clinical features (Fuhrman nuclear grade and TNM stage) between the high- and low-risk groups. The multivariable Cox regression indicated that the risk score was independent of the prognostic factors (training set: HR=3.393, 95% CI [2.025, 5.685], p<0.001; validation set: HR=1.933, 95% CI [1.130, 3.308], p=0.016). The AUCs of the nomograms for the 3-year OS in the training and validation sets were 0.808 and 0.819, respectively, and 0.777 and 0.796, respectively, for the 5- year OS.
Conclusion: We demonstrated a novel glucose metabolism-related risk signature for predicting the prognosis of ccRCC. However, additional in vitro and in vivo research is required to validate our findings.
Keywords: glucose metabolism, clear cell renal cell carcinoma, signature
Introduction
Renal cell carcinoma (RCC) is one of the most prevalent cancers [1] and was ranked the sixth deadliest malignant tumor worldwide in 2018 [2]. According to The American Cancer Society, in the USA alone, it was estimated that more than 73,000 new cases of RCC would be diagnosed by the end of 2019 and over 14,000 people would die from it in 2019 [3]. Clear cell renal cell carcinoma (ccRCC) is the most frequent and invasive histological subtype among all types of RCC and accounts for 70-80% of RCC cases [4,5]. However, with modern diagnostic and treatment methods, RCC-related deaths are constantly decreasing [6], and the 5-year survival rate of patients in advanced stages is 10% [7]. Moreover, up to 40% of RCC patients have developed metastasis after surgical intervention [8]. The high mortality rate of ccRCC patients in advanced stages may result from lack of effective treatments and reliable risk stratification for assessing the prognosis. The TNM classification system and Fuhrman nuclear grade are the most commonly used clinicopathological parameters for clinical decision making and the prognosis stratification of RCC [9]. However, an increasing body of literature has reported differences in clinical outcomes among RCC patients with the same TNM stage and similar therapeutic regimens [10,11], suggesting that the TNM staging system alone cannot provide complete information for the prognostication of RCC. Therefore, there is an urgent need to identify tumor-specify biomarkers and develop useful clinical prognostic markers for the precise prediction of outcome, which may contribute to risk stratification and guide the clinical diagnosis and treatment of ccRCC.
In the past 15 years, cancer cell metabolism, particularly glucose metabolism, has attracted many researchers and has been proposed as a hallmark of cancer [12]. In the tumor microenvironment (TME), tumor cells are more dependent on glucose metabolism for energy generation. The Warburg effect, a unique glucose metabolism-related metabolic reprogramming, is characterized by a high rate of aerobic glycolysis, which promotes the intake of glucose and the production of lactic acid to produce lactic acid and reduce mitochondrial oxidative phosphorylation (OXPHO). This process is beneficial to the occurrence and development of tumors [13,14]. In addition, increased production of lactate acidifies the TME, creating environmental conditions that can boost tumor proliferation, invasion, and migration [15]. Glucose metabolism and the Warburg effect not only support the rapid growth of cancer cells but also reduces the dependence of cancer cells on oxygen availability in the TME [13]. Hence, regulation of glucose metabolism may be a novel strategy for the treatment of cancer.
In this study, we obtained the gene expression profile from The Cancer Genome Altas (TCGA, version: April 5, 2018, https://cancergenome.nih.gov) and the glucose metabolism related gene set from Molecular Signatures Database v7.0 (MSigDB, http://www.broad.mit.edu/gsea/msigdb/) [16] to perform a systematic and comprehensive analysis of the characteristics of the glucose metabolism-related gene set of ccRCC. Next, we developed a glucose metabolism-related signature for assessing the prognosis of ccRCC patients. In addition, genes highly associated with the risk signature were identified for a functional enrichment analysis and protein-protein interaction (PPI) network. The novel prognostic signature is warranted for the improvement of treatment selection and outcome prediction compared to TNM staging and may help with the development of novel strategies for diagnosis and the identification of potential drug targets of ccRCC.
Materials and Methods
Data source and preprocessing
The gene expression profiles, as well as the relevant clinical characteristics, were downloaded from TCGA. Patients with follow‐up times< 30 days or a lack of pathological diagnosis and corresponding clinical information were removed. A total of 515 ccRCC patients (259 cases in the training set and 256 cases in the validation set) were enrolled in this research (Table 1). A glucose metabolism-related gene set was collected from MSigDB. After comparison with the gene expression profile from TCGA, a glucose metabolism-related gene expression profile was identified, which included 231 genes.
Characteristics of ccRCC patients in two sets
| Parameter | Training set (n=259) | Validation set (n=256) | P value |
|---|---|---|---|
| Age | 0.962 | ||
| ≤60 | 133(51.4%) | 132(51.6%) | |
| >60 | 126(48.6%) | 124(48.4%) | |
| Gender | 0.401 | ||
| Female | 83(32.0%) | 91(35.5%) | |
| Male | 176(68.0%) | 165(64.5%) | |
| TNM stage | 0.608 | ||
| I | 132(51.0%) | 128(50.0%) | |
| II | 29(11.2%) | 26(10.2%) | |
| III | 53(20.4%) | 64(25.0%) | |
| VI | 45(17.4%) | 38(14.8%) | |
| Grade | 0.312 | ||
| G1 | 5(2.0%) | 11(4.3%) | |
| G2 | 121(46.7%) | 105(41.0%) | |
| G3 | 98(37.8%) | 102(39.8%) | |
| G4 | 35(13.5%) | 38(14.9%) | |
| Risk group | 0.506 | ||
| High | 129(49.8) | 135(52.7%) | |
| Low | 130(50.2) | 121(47.3%) | |
| Cluster | 0.194 | ||
| 1 | 201(77.6%) | 186(72.7%) | |
| 2 | 58(22.4%) | 70(27.3%) | |
| Survival status | 0.252 | ||
| Alive | 172(66.4%) | 182(71.1%) | |
| Dead | 87(33.6%) | 74(28.9%) |
Consensus clustering
The “ConsensusClusterPlus” package of the statistical software R (version 3.5.2, https://www.r-project.org) was used to perform the consensus clustering. The consensus matrices and cumulative distribution function (CDF) were applied for assessing the optimal number of clusters. Principal component analysis (PCA) was carried out to investigate the expression difference between the clusters with the R package “princomp”.
Construction and evaluation of the prognostic glucose metabolism-related gene signature
The R and “edgeR” Bioconductor packages (http://www.bioconductor.org/packages/release/bioc/html/edgeR.html) were utilized to identify differentially expressed genes (DEGs) with |logFC| > 2 and FDR < 0.01. Patients with ccRCC were divided into two sets (a training set and a validation set) randomly. In the training set, DEGs that were highly associated with the overall survival (OS) of the ccRCC patients were further screened with univariate Cox regression analysis and LASSO regression analysis. Last, a multivariate Cox regression analysis was applied to select the best survival-related candidate DEGs and develop a risk score formula. The following equation was used: Risk score = (coefficient * expression of gene 1) + (coefficient * expression of gene 2) + ... + (coefficient * expression of gene X). With the median value of the risk score as the cut-off value, patients were divided into low-risk and high-risk groups. In the same way, the risk score of each individual in the validation set was also calculated. In addition, the receiver operating characteristic curve (ROC) and the calibration plot with a boot-strapping set of 1,000 resamples was used to evaluate the predictive capacity of the prognostic signature.
Functional enrichment analysis and protein-protein interaction (PPI) network construction
The Pearson correlation coefficients between candidate risk scores and genes in the expression matrix were calculated. Genes with a correlation coefficient P>0.45 or P<0.01 were selected for further investigation. Kyoto Encyclopedia of Genes and Genomes (KEGG) and Gene Ontology (GO) were performed using DAVID (Database for Annotation, Visualization and Integrated Discovery, version 6.8, https://david-d.ncifcrf.gov) (17) and the PPI network was constructed using String (version 10.5, https://string-db.org) [18].
Survival Analysis
Kaplan-Meier plots were generated to illustrate the survival relationship between the risk score and the OS of ccRCC patients. Univariable and multivariable Cox regression models were used to determine the independent prognostic factors. A P-value<0.05 was set as the cut-off value.
Results
Stratification of ccRCC based on the glucose metabolism-related gene set
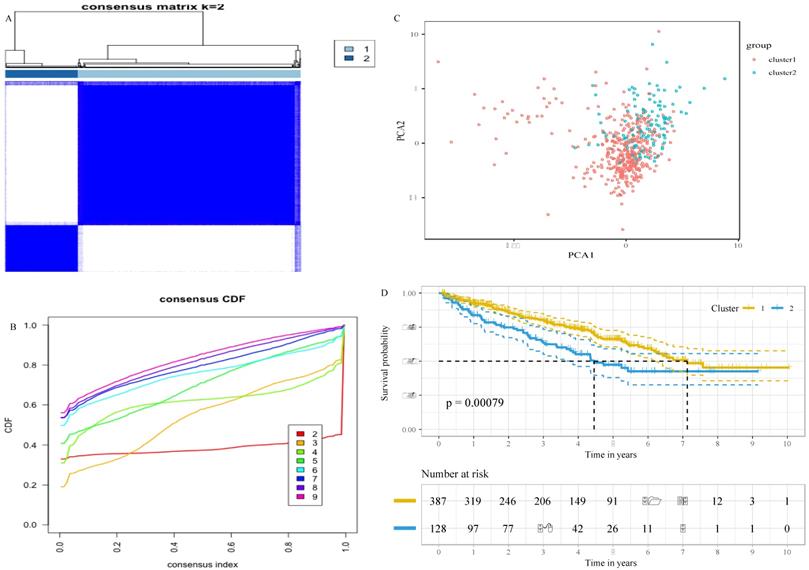
To decipher the relationship between the glucose metabolism-related genes and the outcomes of ccRCC patients, we classified 515 patients into two robust clusters (K=2) with the “ConsensusClusterPlus” package in R (Figure 1A and B). PCA revealed two clusters within different areas, indicating that the differences between the two clusters were greater than those within the cluster (Figure 1C). A Chi-square test revealed that there were significant differences in the TNM stage, grade and survival status between the two clusters (Table 2). In addition, the survival analysis showed that patients in cluster 2 had a worse prognosis compared with patients in cluster 1 (Figure 1D). These results indicate that the expression of glucose metabolism-related genes are highly related with the prognosis and molecular features of ccRCC patients.
Stratification of ccRCC based on the glucose metabolism-related gene set. A, Consensus clustering matrix of 515 ccRCC samples for k = 2. B, Consensus clustering CDF for k = 2 to k = 10. C, Principal component analysis (PCA) of cluster 1 and cluster 2 based on whole gene expression data. D, survival analysis of ccRCC patients in cluster 1 and cluster 2.
Characteristics of ccRCC patients in cluster 1 and cluster 2
| Parameter | Cluster 1 (n=387) | Cluster 2 (n=128) | P value |
|---|---|---|---|
| Age | 0.559 | ||
| ≤60 | 202(52.2%) | 63(49.2%) | |
| >60 | 185(47.8%) | 65(50.8%) | |
| Gender | 0.054 | ||
| Female | 142(36.7%) | 52(40.6%) | |
| Male | 245(63.3%) | 76(59.4%) | |
| TNM stage | <0.001 | ||
| I | 215(55.6%) | 45(35.2%) | |
| II | 42(10.9%) | 13(10.2%) | |
| III | 77(19.9%) | 40(31.2%) | |
| VI | 53(13.6%) | 30()23.4% | |
| Grade | <0.001 | ||
| G1 | 16(4.1%) | 0(0.0%) | |
| G2 | 185(47.8%) | 41(32.0%) | |
| G3 | 149(38.5%) | 51(39.9) | |
| G4 | 37(9.6%) | 36(28.1%) | |
| Survival status | 0.001 | ||
| Alive | 281(72.6%) | 73(57.0%) | |
| Dead | 106(27.4%) | 55(43.0%) |
Construction and evaluation of the prognostic glucose metabolism-related gene signature
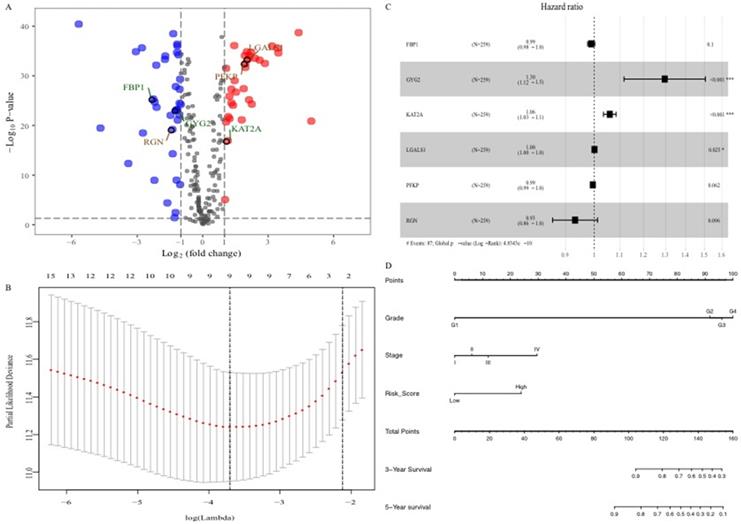
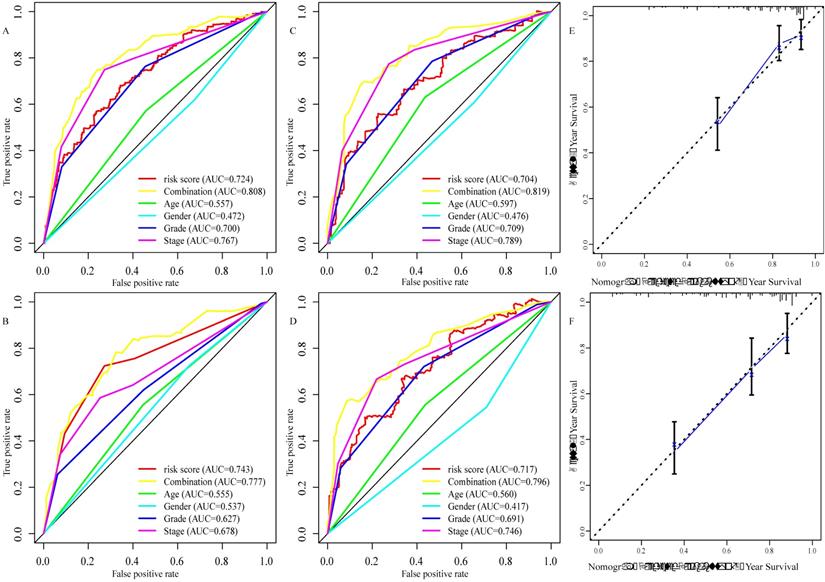
To explore the glucose metabolism-related gene signature, we divided the 515 ccRCC patients into a training set (256 cases) and a validation set (255 cases) randomly. Next, we identified 68 glucose metabolism-related DEGs between ccRCC tissues and adjacent nontumor tissues in the training set, including 32 upregulated DEGs and 36 downregulated DEGs (Figure 2A). After performing univariate Cox regression analysis and LASSO regression analysis, 9 DEGs were filtered out and then subjected to multivariate Cox regression (Figure 2B). Finally, the six best survival-related candidate DEGs (FBP1, GYG2, KAT2A, LGALS1, PFKP, and RGN) were selected to develop a prognostic gene signature and risk score formula (Figure 2C). A nomogram combining the risk score and clinical characteristics was created for predicting the 3-and 5- year survival rates (Figure 2D). The the area under the curve (AUCs) of the nomograms for the 3- and 5-year OS in the training set were 0.808 and 0.777, respectively (Figure 3A and B). To confirm the accuracy of the survival probabilities of this nomogram, 215 ccRCC patients in the validation set were tested to validate the finding in training cohort. The AUCs for predicting the 3- and 5-year OS in the validation set were 0.819 and 0.796, respectively (Figure 3C and D). The calibration plots for the 3- or 5-year survival probabilities in the training set are shown in Figure 3E and F, and those of the validation set are shown in Figure S1. The distribution of the risk scores, survival probabilities and expression profiles of the six candidate DEGs are shown in Figure S2.
Identification of the six glucose metabolism-related genes signature. A, Volcano plot of DEGs. Red dots represent 32 upregulated genes and green dots represent 36 downregulated genes. B, “Leave- one-out-cross-validation” for parameter selection in LASSO regression. C, The forest map of multivariate Cox regression analysis. D, The prognostic nomogram for the prediction of 3- and 5-year overall survival in ccRCC.
Evaluation of the six glucose metabolism-related genes signature. A, the area under the receiver operating characteristic (ROC) curve (AUC) for the 3-year overall survival of ccRCC patients in the training set. B, the AUC for the 5-year overall survival of ccRCC patients in the training set. C the AUC for 3-year overall survival of the ccRCC patients in the validation set. D, the AUC for 5-year overall survival of the ccRCC patients in the validation set. E, Calibration curve of the nomogram model for the 3- year overall survival in the training set. F, Calibration curve of the nomogram model for the 5- year overall survival in the training set.
Correlation between risk score and clinical characteristics
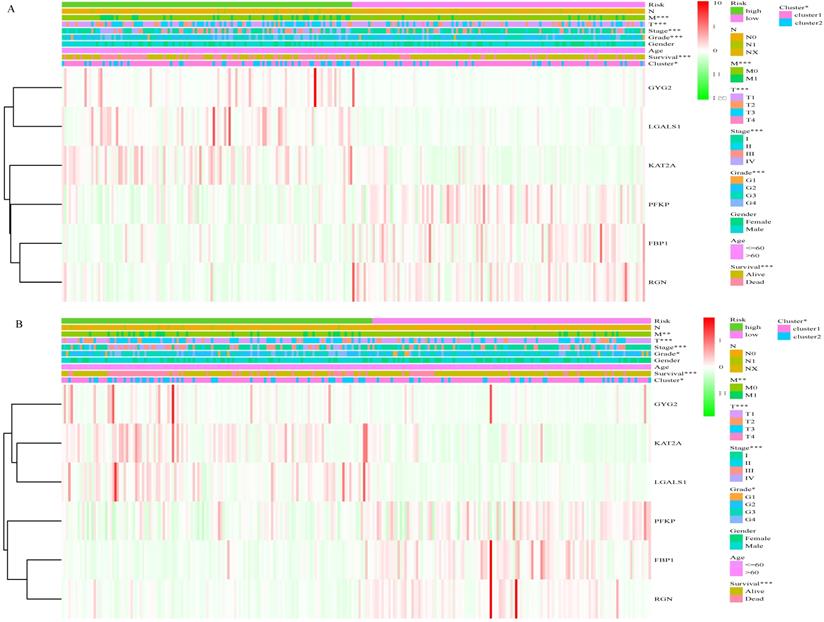
Based on the cut-off values for the risk score (0.840), patients were divided into high- and low- risk groups. As shown in Figure 4A and Table S1, the risk score of each patient was distributed differently in the training set. There were significant differences in most features between the high- and low-risk groups, except gender and age. Similar results were observed in the validation set (Figure 4B, Table S1). This finding indicates a powerful correlation between the glucose metabolism- related signature and the clinical characteristics of ccRCC.
Correlation between risk score and clinical characteristics. A, Heat map of the association of risk scores and clinicopathological features in the training set. B, Heat map of the association of risk scores and clinicopathological features in the validation set. *P<0.05, ** P<0.01, ***P<0.001.
The six-gene signature is an independent prognostic factor of survival
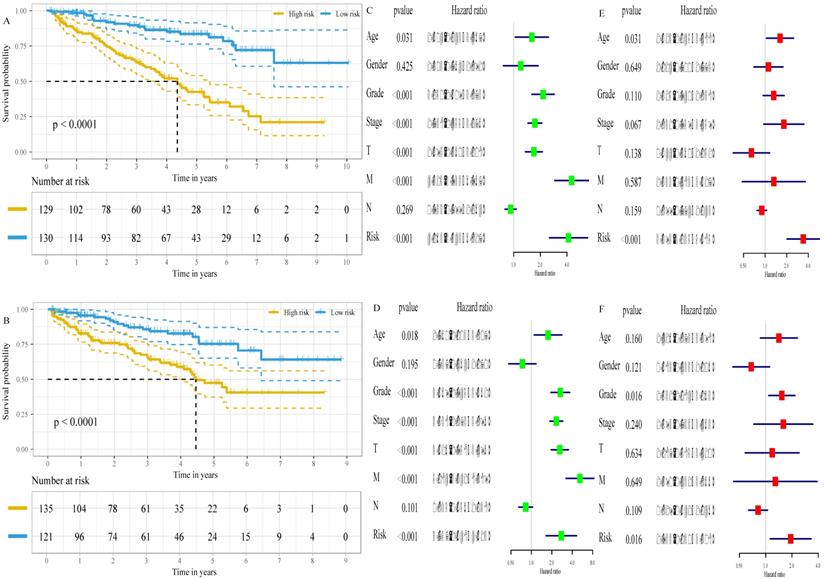
The associations of the risk scores and corresponding overall survival rates were analyzed using a Kaplan-Meier plot and evaluated with a log-rank test. The Kaplan-Meier plot demonstrated that the prognosis of ccRCC patients at high-risk were worse than that at low-risk, both in the training set (P<0.001, Figure 5A) and in the validation set (P<0.001, Figure 5B). Additionally, we found that low expression of FBP1 (P<0.001, Figure S3A), PFKP (P<0.001, Figure S3B), and RGN (P<0.001, Figure S3C) and high expression of GYG2 (P<0.001, Figure S3D), KAT2A (P<0.001, Figure S3E), and LGALS1 (P<0.001, Figure S3F) was negatively correlated with a favorable outcome in the ccRCC patients. To compare the risk score with conventional clinical characteristics such as age, gender, TNM stage and grade, we performed univariate and multivariate Cox regression analysis to assess the importance of these indicators for the prognosis of the ccRCC patients. The univariable Cox regression model showed that the risk score was an important factor in the patient prognosis (training set: HR=4.163, 95% CI [2.543, 6.817], p<0.001, Figure 5C; validation set: HR=2.757, 95% CI [1.647, 4.613], p<0.001, Figure 5D). In addition, the results of the multivariable Cox regression indicated that the risk score was independent of the prognostic factors (training set: HR=3.393, 95% CI [2.025, 5.685], p<0.001, Figure 5E; validation set: HR=1.933, 95% CI [1.130, 3.308], p=0.016, Figure 5F).
The six-gene signature is an independent prognostic factor of survival. A, Kaplan-Meier survival curves for low- and high- risk groups in the training set. B, Kaplan-Meier survival curves for low- and high- risk groups in the validation set. C, the result of univariable Cox regression analysis in the training set. D, the result of univariable Cox regression analysis in the validation set. E, the result of multivariable Cox regression analysis in the training set. F, the result of multivariable Cox regression analysis in the validation set.
Functional enrichment analysis and PPI network
A total of 217 genes with expression that were highly related to the risk score (Pearson correlation coefficient >0.45 and P<0.01) were identified. The KEGG analysis revealed that these genes were involved in 9 pathways, including the cell cycle, fatty acid degradation, fatty acid metabolism, carbon metabolism, oocyte meiosis, valine, leucine and isoleucine degradation, PPAR signaling pathway, glyoxylate and dicarboxylate metabolism, and propanoate metabolism pathways (Figure 6A). In addition, 6 GO terms (3 biological processes, 1 cellular component, and 1 molecular function) were enriched (Figure 6B).
Functional enrichment analysis and PPI network. A, the pathways enriched for 217 genes highly related with risk score. B, GO enrichment analysis. C, Protein-protein interaction (PPI) network.
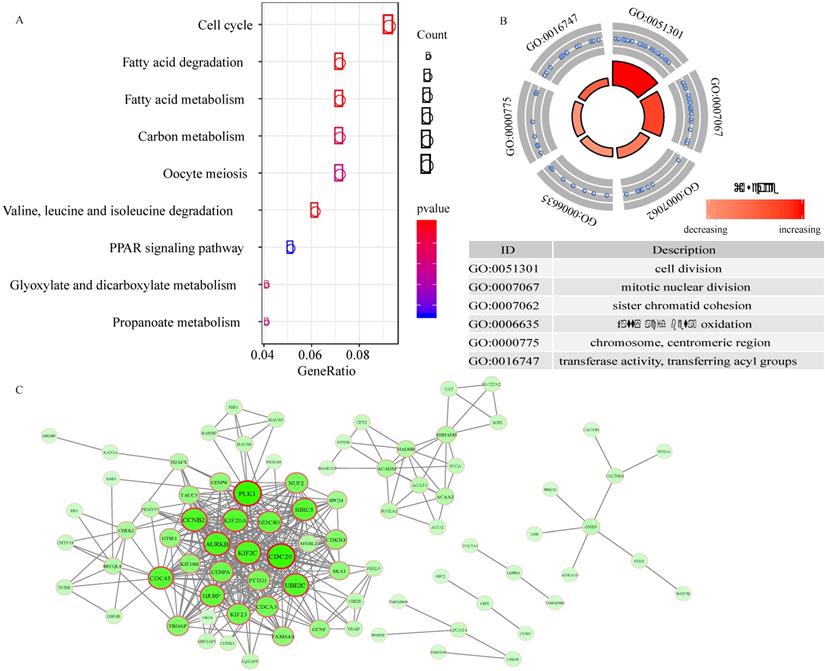
To explore the interplay among 89 overlapping DEGs, a PPI network was created using the STRING tool with confidence >0.9 as a cut-off criterion. The PPI network contained 71 nodes and 376 edges (Figure 6C).
Discussion
ccRCC is one of the most prevalent kidney cancers (19) and accounts for approximately 3% of adult malignant tumors [20]. The 5-year survival rate of ccRCC patients in advanced stages is less than 10%, and 20-40% patients have experienced distant metastasis at the time of diagnosis [21]. The identification of tumor-specific markers and risk stratification is important for assessing the prognosis of patients, which may facilitate the development of new strategies for ccRCC diagnosis and therapy. Moreover, predicting the prognosis is important for treatment selection and the identification of prognosis-related biomarkers [22].
Recently, glucose metabolism was shown to play a critical role in the initiation and progression of various cancers [13]. Due to lipid and glycogen accumulation, the change in cytoplasm is the most striking morphological characteristic of ccRCC, which indicates reprogramming glucose metabolism is a crucial factor for the cancerogenesis and progression of ccRCC [23]. The down-regulation of the tricarboxylic acid (TCA) cycle and up-regulation of Warburg effect (aerobic glycolysis) is major alteration [23,24]. Meanwhile, a study found Warburg effect is a grade-dependent feature and could modulate cell viability and proliferation in ccRCC [25]. In addition to these, partition of glycolytic flux can be activated in order to generate the building blocks required for cancer cell growth in ccRCC [26]. Previously, transcriptomics and metabolomics revealed the pentose phosphate pathway (PPP) is also up-regulated, which start from glucose-6-phosphate, generates precursors for nucleotide biosynthesis and NADPH for anabolic reactions and redox homeostasis maintenance [27]. Research has proved that the rate-limiting enzyme: Glucose-6-phosphate dehydrogenase could promote both anabolic reactions and redox homeostasis [28]. Furthermore, Glucose-6-phosphate isomerase is over-expression in ccRCC, and highly associated with the prognosis of ccRCC patients [29]. In addition, mitochondrial dysfunction and attenuated mitochondrial respiration chain are also observed in ccRCC, which may bring by the overexpression of NDUFA4L2 [30]. Thus, in this study, we downloaded the gene expression profiles and glucose metabolism-related gene sets from TCGA and MSigDB, respectively, to identify the prognostic glucose metabolism-related gene signatures of ccRCC. Altogether, 68 DEGs (32 upregulated and 36 downregulated) were identified between the ccRCC tissues and adjacent nontumor tissues. After performing univariate regression, LASSO regression and multivariable Cox regression analyses, six glucose metabolism related DEGs (FBP1, GYG2, KAT2A, LGALS1, PFKP, and RGN) were selected to develop a risk signature for the prediction of ccRCC clinical prognosis. Additionally, survival analysis revealed that all six glucose metabolism related genes were closely correlated with the clinical outcomes of the ccRCC patients. FBP1 (fructose-bisphosphatase 1), a rate-controlling enzyme in gluconeogenesis, catalyzes the hydrolysis of fructose 1,6-bisphosphate to fructose 6-phosphate [31]. Similar to the findings in this study, Ning et al. found that FBP1 was decreased in ccRCC tissues compared with adjacent healthy tissues [32]. In addition, previous studies have shown that high FBP1 expression inhibits tumor growth by hindering epithelial-mesenchymal transition (EMT) [33], and degradation of FBP1 promotes tumor progression by altering the Warburg effect in hepatocellular carcinoma cells [34]. PFKP (phosphofructokinase, platelet) is an isoform of phosphofructokinase, which plays a vital role in glycolysis regulation and metabolic reprogramming in many cancers including ccRCC [35,36]. LGALS1 (galectin 1) is a β-galactoside-binding protein that recognizes glycoconjugates and regulates cell proliferation, differentiation and apoptosis in cancer [37]. Li et al. showed that LGALS1 was increased in ccRCC and that high expression of LGALS1 predicted a poor prognosis [38]. KAT2A (lysine acetyltransferase 2A) regulates acetyltransferase and succinyltransferase as a transcriptional activator [39]. The activation of KAT2A can promote nasopharyngeal carcinoma cell proliferation [40] and lung cancer cell apoptosis [41]. RGN (regucalcin) is preferentially expressed in the kidney and liver and is highly associated with the pentose phosphate pathway [42]. A study on zebrafish demonstrated that RGN was downregulated in hepatocellular and cholangiocellular carcinomas and played a significant role in cell proliferation and tumorigenesis [42]. GYG2 (glycogenin 2) is a self-glycosylating protein that initiates glycogen biosynthesis and accelerates glucose and galactose metabolism [43].
We created a nomogram that combines risk signature and clinical characteristics to predict the 3- and 5-year OS of ccRCC patients. In addition, we further explored the predictive accuracy of the nomogram for the survival rates at 3- or 5-years. The AUCs of the nomograms for 3- year OS in the training and validation sets was 0.808 and 0.819, respectively, which was significantly higher than those based on clinical characteristics, such as age (training set: 0.557; validation set: 0.579), gender (training set: 0.472; validation set: 0.476), grade (training set: 0.700; validation set: 709) and TNM stage (training set: 0.767; validation set: 0.789). Similar results were observed for the AUC of the nomogram for the 5- year OS (training set: 0.777; validation set: 0.796), and these results were also superior to those based on clinical characteristics (age [training set: 0.555; validation set: 0.560], gender [training set: 0.537; validation set: 0.417], grade [training set: 0.627; validation set: 691] and TNM stage [training set: 0.678; validation set: 0.746]). Recently, a prognostic signature has been used to explore prognosis-related biomarkers and evaluate the prognosis of ccRCC patients. For instance, Chen et al. used 3 mRNAs (CENPW, FOXM1, and NUF2) to establish a prognostic signature that predicted the 3- and 5- year OS of ccRCC patients [44]. In addition, a prognostic signature based on 4 mRNAs (PTEN, PIK3C2A, ITPA, and BCL3) for predicting the 5- year OS in ccRCC was identified in a study by Dai et al. [45]. Luo et al. identified a signature for assessing the 3- and 5- year survival rate in ccRCC patients using 3 miRNAs (miR-130b, miR‐18a, miR‐223) [46]. In addition, Shi et al. developed a prognostic signature for predicting the 3-year OS using 5 lncRNAs (ENSG00000229178, ENSG00000236453, ENSG00000245060, ENSG00000258789, and ENSG00000272558) [47]. The AUCs of 3- and 5- year OS in a study from Chen et al. were 0.645 and 0.705, respectively, and 0.692 and 0.702, respectively, from Luo et al. The AUCs in Chen's and Luo's studies were smaller compared to those in the training set (0.808 and 0.777) and validation set (0.819 and 0.796) of this study. Furthermore, in Dai's study, the AUC for the 5- year OS was 0.701, which was lower than that of the present study. Moreover, the AUC for 3-year OS in the training cohort and validation cohort of this study (0.808 and 0.819) was preferable to that of Shi et al. (0.703 and 0.630). Additionally, the calibration plot for the 3- or 5-year OS demonstrated consistency between the prediction by the nomogram and the actual observation. All data suggested that the established prognostic nomogram is suitable for estimating the probability of 3- and 5- year overall survival rates of ccRCC patients.
Among different grade and TNM stage, there were obvious differences in the distribution of risk score of patients both in training set and validation set. Moreover, survival analysis for low- and high-risk group indicated that the high-risk group had a poorer prognosis than the low-risk group. Meanwhile, multivariable Cox regression revealed that risk score was independent prognostic factors. These results suggested the glucose metabolism-related signature could serve as a robust indicator in predicting the prognosis of the ccRCC patients and stratify patients for glucose metabolism-targeted therapies in future.
Although the prognostic glucose metabolism-related signature demonstrated a well predictive accuracy for ccRCC patients in this study, there are a few limitations needed to be addressed. Firstly, due to all patients were gathered from public database, the potential of selection bias could not be excluded. Secondly, there was no experimental research conducted to examine the functions of six glucose metabolism-related in ccRCC. Thus further investigation both in vitro and in vivo is demanded to testify the discovery of this research.
Conclusion
In this study, we investigated the glucose metabolism-related gene set in ccRCC and its prognostic value and developed a prognostic risk signature based on six glucose metabolism-related genes (FBP1, GYG2, KAT2A, LGALS1, PFKP, and RGN). By combining a risk signature and clinical information, a prognostic nomogram was created for predicting the 3- and 5- year overall survival, which could contribute to the clinical outcome prediction ability of the TNM staging system and provide a convenient tool for risk assessment. Our findings provide a new understanding of glucose metabolism status and will benefit glucose metabolism-targeted therapies in ccRCC patients. However, additional in vitro and in vivo research is required.
Abbreviations
RCC: renal cell carcinomas; ccRCC: Clear cell renal cell carcinoma; TCGA: The Cancer Genome Altas; DEGs: differentially expressed genes; OXPHO: mitochondrial oxidative phosphorylation; TME: the tumor microenvironment; CDF: cumulative distribution function; PCA: Principal component analysis; OS: overall survival; ROC: the receiver operating characteristic curve; AUC: the area under the curve; KEGG: Kyoto Encyclopedia of Genes and Genomes; GO: Gene Ontology; PPI: protein-protein interaction.
Supplementary Material
Supplementary figures and tables.
Acknowledgements
Funding
The present study was supported by Zhejiang province famous Traditional Chinese medicine expert Chai kequn's inheritance studio construction project (GZS2017001) (grant no. GZS2017001), Scientific Research Foundation for Traditional Chinese Medicine of Zhejiang Province (grant no.2019ZQ006) and Key Research & Development Program of Zhejiang Province (grant no.2015C03033).
Availability of data and materials
The datasets analyzed during the present study are available in the TCGA repository, (https://portal.gdc.cancer.gov/).
Authors' Contributions
SW and LZ conceived and designed the study, performed the experiment, and wrote the manuscript. KC and ZH reviewed and edited the manuscript. JC conceived and performed the experiments and reviewed the manuscript. All authors approved the manuscript and agreed to be accountable for all aspects of the research and for ensuring that the accuracy or integrity of any part of the work were appropriately investigated and resolved.
Competing Interests
The authors have declared that no competing interest exists.
References
1. Wang S, Yu ZH, Chai KQ. Identification of EGFR as a Novel Key Gene in Clear Cell Renal Cell Carcinoma (ccRCC) through Bioinformatics Analysis and Meta-Analysis. Biomed Res Int. 2019;2019:6480865
2. Bray F, Ferlay J, Soerjomataram I, Siegel RL, Torre LA, Jemal A. Global cancer statistics 2018: GLOBOCAN estimates of incidence and mortality worldwide for 36 cancers in 185 countries. CA Cancer J Clin. 2018;68(6):394-424
3. Siegel RL, Miller KD, Jemal A. Cancer statistics, 2019. CA. CA Cancer J Clin. 2019;69(1):7-34
4. Zhang G, Wu Y, Zhang J. et al. Nomograms for predicting long-term overall survival and disease-specific survival of patients with clear cell renal cell carcinoma. Onco Targets Ther. 2018;11:5535-5544
5. Xing T, He H. Epigenomics of clear cell renal cell carcinoma: mechanisms and potential use in molecular pathology. Chin J Cancer Res. 2016;28(1):80-91
6. Lai Y, Zeng T, Liang X. et al. Cell death-related molecules and biomarkers for renal cell carcinoma targeted therapy. Cancer Cell Int. 2019;19:221
7. Cao Q, Ruan H, Wang K. et al. Overexpression of PLIN2 is a prognostic marker and attenuates tumor progression in clear cell renal cell carcinoma. Int J Oncol. 2018;53(1):137-147
8. Ravaud A, Motzer RJ, Pandha HS. et al. Adjuvant Sunitinib in high-risk renal-cell carcinoma after nephrectomy. N Engl J Med. 2016;375(23):2246-2254
9. Ljungberg B, Bensalah K, Canfield S. et al. EAU guidelines on renal cell carcinoma: 2014 update. Eur Urol. 2015;67(5):913-24
10. Gulati S, Martinez P, Joshi T. et al. Systematic evaluation of the prognostic impact and intratumour heterogeneity of clear cell renal cell carcinoma biomarkers. Eur Urol. 2014;66(5):936-48
11. Zeng D, Zhou R, Yu Y. et al. Gene expression profiles for a prognostic immunoscore in gastric cancer. Br J Surg. 2018;105(10):1338-1348
12. Hay N. Reprogramming glucose metabolism in cancer: can it be exploited for cancer therapy? Nat Rev Cancer. 2016;16(10):635-49
13. Wang G, Wang JJ, Guan R. et al. Strategies to Target Glucose Metabolism in Tumor Microenvironment on Cancer by Flavonoids. Nutr Cancer. 2017;69(4):534-554
14. Shankaraiah RC, Veronese A, Sabbioni S, Negrini M. Non-coding RNAs in the reprogramming of glucose metabolism in cancer. Cancer Lett. 2018;419:167-174
15. Wang G, Wang JJ, Yin PH. et al. New strategies for targeting glucose metabolism-mediated acidosis for colorectal cancer therapy. J Cell Physiol. 2018;234(1):348-368
16. Liberzon A, Birger C, Thorvaldsdóttir H. et al. The Molecular Signatures Database (MSigDB) hallmark gene set collection. Cell Syst. 2015;1(6):417-425
17. Huang da W, Sherman BT, Lempicki RA. Systematic and integrative analysis of large gene lists using DAVID bioinformatics resources. Nat Protoc. 2009;4(1):44-57
18. Szklarczyk D, Gable AL, Lyon D. et al. STRING v11: protein-protein association networks with increased coverage, supporting functional discovery in genome-wide experimental dataset. Nucleic Acids Res. 2019;47:D607-D613
19. Vecchio SJD; Ellis RJ. Cabozantinib for the Management of Metastatic Clear Cell Renal Cell Carcinoma. J Kidney Cancer VHL. 2018;5(4):1-5
20. Majer W, Kluzek K, Bluyssen H, Wesoły J. Potential Approaches and Recent Advances in Biomarker Discovery in Clear-Cell Renal Cell Carcinoma. J Cancer. 2015;6(11):1105-13
21. Atkins MB; Tannir NM. Current and emerging therapies for first-line treatment of metastatic clear cell renal cell carcinoma. Cancer Treat Rev. 2018;70:127-137
22. Wang Z, Wang Z, Niu X. et al. Identification of seven-gene signature for prediction of lung squamous cell carcinoma. Onco Targets Ther. 2019;12:5979-5988
23. Hakimi AA, Reznik E, Lee CH. et al. An integrated metabolic atlas of clear cell renal cell carcinoma. Cancer Cell. 2016;29:104-116
24. Gatto F, Nookaew I, Nielsen J. Chromosome 3p loss of heterozygosity is associated with a unique metabolic network in clear cell renal carcinoma. Proc Natl Acad Sci. 2014;111:E866-E875
25. Bianchi C, Meregalli C, Bombelli S. et al. The glucose and lipid metabolism reprogramming is grade-dependent in clear cell renal cell carcinoma primary cultures and is targetable to modulate cell viability and proliferation. Oncotarget. 2017;8(69):113502-113515
26. Lucarelli G, Loizzo D, Franzin R. et al. Metabolomic insights into pathophysiological mechanisms and biomarker discovery in clear cell renal cell carcinoma. Expert Rev Mol Diagn. 2019;19(5):397-407
27. Eggleston LV, Krebs HA. Regulation of the pentose phosphate cycle. Biochem J. 1974;138:425-435
28. Lucarelli G, Galleggiante V, Rutigliano M. et al. Metabolomic profile of glycolysis and the pentose phosphate pathway identifies the central role of glucose-6-phosphate dehydrogenase in clear cell-renal cell carcinoma. Oncotarget. 2015;6(15):13371-13386
29. Lucarelli G, Rutigliano M, Sanguedolce F. et al. Increased Expression of the Autocrine Motility Factor is Associated with Poor Prognosis in Patients with Clear Cell-Renal Cell Carcinoma. Medicine (Baltimore). 2015;94(46):e2117
30. Lucarelli G, Rutigliano M, Sallustio F. et al. Integrated multi-omics characterization reveals a distinctive metabolic signature and the role of NDUFA4L2 in promoting angiogenesis, chemoresistance, and mitochondrial dysfunction in clear cell renal cell carcinoma. Aging (Albany NY). 2018;10(12):3957-3985
31. Yang J, Jin X, Yan Y. et al. Inhibiting histone deacetylases suppresses glucose metabolism and hepatocellular carcinoma growth by restoring FBP1 expression. Sci Rep. 2017;7:43864
32. Ning XH, Li T, Gong YQ. et al. Association between FBP1 and hypoxia-related gene expression in clear cell renal cell carcinoma. Oncol Lett. 2016;11(6):4095-4098
33. Liu GM, Li Q, Zhang PF. et al. Restoration of FBP1 suppressed Snail-induced epithelial to mesenchymal transition in hepatocellular carcinoma. Cell Death Dis. 2018;9(11):1132
34. Jin X, Pan Y, Wang L. et al. MAGE-TRIM28 complex promotes the Warburg effect and hepatocellular carcinoma progression by targeting FBP1 for degradation. Oncogenesis. 2017;6(4):e312
35. Lang L, Chemmalakuzhy R, Shay C, Teng Y. PFKP Signaling at a Glance: An Emerging Mediator of Cancer Cell Metabolism. Adv Exp Med Biol. 2019;1134:243-258
36. Chen G, Liu H, Zhang Y. et al. Silencing PFKP inhibits starvation-induced autophagy, glycolysis, and epithelial mesenchymal transition in oral squamous cell carcinoma. Exp Cell Res. 2018;370(1):46-57
37. Li JM1, Teng CW, Lin CC. et al. Upregulation of LGALS1 is associated with oral cancer metastasis. Ther Adv Med Oncol. 2018;10:1758835918794622
38. Li Y, Yang S, Yue H. et al. Unraveling LGALS1 as a Potential Immune Checkpoint and a Predictor of the Response to Anti-PD1 Therapy in Clear Cell Renal Carcinoma. Pathol Oncol Res. 2019 10.1007/s12253-019-00710-4
39. Ma M, Zhang Y, Weng M. et al. lncRNA GCAWKR Promotes Gastric Cancer Development by Scaffolding the Chromatin Modification Factors WDR5 and KAT2A. Mol Ther. 2018;26(11):2658-2668
40. Wang Y, Chen W, Lian J, Zhang H1, Yu B. The lncRNA PVT1 regulates nasopharyngeal carcinoma cell proliferation via activating the KAT2A acetyltransferase and stabilizing HIF-1α. Cell Death Differ. 2019;27(2):695-710
41. Li T, Su L, Lei Y, Liu X, Zhang Y, Liu X. DDIT3 and KAT2A Proteins Regulate TNFRSF10A and TNFRSF10B Expression in Endoplasmic Reticulum Stress-mediated Apoptosis in Human Lung Cancer Cells. J Biol Chem. 2015;290(17):11108-18
42. Fujisawa K, Terai S, Hirose Y, Takami T, Yamamoto N, Sakaida I. Senescence marker protein 30 (SMP30)/regucalcin (RGN) expression decreases with aging, acute liver injuries and tumors in zebrafish. Biochem Biophys Res Commun. 2011;414(2):331-6
43. Stabellini R, Vasques LR, de Mello JC, Hernandes LM, Pereira LV. MAOA and GYG2 are submitted to X chromosome inactivation in human fibroblasts. Epigenetics. 2009;4(6):388-93
44. Chen L, Luo Y, Wang G. et al. Prognostic value of a gene signature in clear cell renal cell carcinoma. J Cell Physiol. 2019;234(7):10324-10335
45. Dai J, Lu Y, Wang J. et al. A four-gene signature predicts survival in clear-cell renal-cell carcinoma. Oncotarget. 2016;7(50):82712-82726
46. Luo Y, Chen L, Wang G. et al. Identification of a three-miRNA signature as a novel potential prognostic biomarker in patients with clear cell renal cell carcinoma. J Cell Biochem. 2019;120(8):13751-13764
47. Shi D, Qu Q, Chang Q. et al. A five-long non-coding RNA signature to improve prognosis prediction of clear cell renal cell carcinoma. Oncotarget. 2017;8(35):58699-58708
Author contact
![]() Corresponding author: Jiabin Chen, Department of Oncology, Tongde Hospital of Zhejiang, NO. 234 Gu Cui Road, Xihu District, Hangzhou, Zhejiang 310053, P.R. China. E-mail: chenjiabin351com.
Corresponding author: Jiabin Chen, Department of Oncology, Tongde Hospital of Zhejiang, NO. 234 Gu Cui Road, Xihu District, Hangzhou, Zhejiang 310053, P.R. China. E-mail: chenjiabin351com.