Impact Factor ISSN: 1837-9664

 Global reach, higher impact
J Cancer 2020; 11(10):2864-2873. doi:10.7150/jca.38689 This issue Cite
Research Paper
Retrospective analysis of the prognostic value of PD-L1 expression and 18F-FDG PET/CT metabolic parameters in colorectal cancer
Hao Jiang1, Rongjun Zhang2, Huijie Jiang1 ![]() , Mingyu Zhang3, Wei Guo4, Jifeng Zhang5, Xinglu Zhou6, Wenbin Pan1, Sheng Zhao1, Ping Li5
, Mingyu Zhang3, Wei Guo4, Jifeng Zhang5, Xinglu Zhou6, Wenbin Pan1, Sheng Zhao1, Ping Li5 ![]()
1. Department of Radiology, The Second Affiliated Hospital of Harbin Medical University, Harbin, China
2. Jiangsu Institute of Nuclear Medicine, Wuxi, China
3. Department of Nuclear Medicine, Beijing Friendship Hospital, Affiliated to Capital Medical University, Beijing, China
4. Department of Ultrasound, Harbin the First Hospital, Harbin, China
5. Department of PET/CT, The Second Affiliated Hospital of Harbin Medical University, Harbin, China
6. Department of PET/CT, Harbin Medical University Cancer Hospital, Harbin, China
Received 2019-7-24; Accepted 2020-2-6; Published 2020-2-25
Abstract
Background: It has been rarely reported whether 18F-fluorodeoxyglucose (18F-FDG) uptake in colorectal cancer cells is associated with the expression of PD-L1. We performed a clinical pathology study to evaluate PD-L1 expression in patients undergoing surgical resection of colorectal cancer with preoperative 18F-FDG PET/CT imaging, with the aim of predicting the response of CRC patients to immune checkpoint inhibitors.
Material and Methods: A retrospective analysis of patients with CRC who underwent FDG-PET imaging before surgery was performed to measure the parameters of FDG-PET imaging: the maximum standardized uptake value (SUVmax), the metabolic tumor volume (MTV), and the total lesion glycolysis (TLG) were evaluated to determine whether each parameter was associated with clinical pathology. Tumor specimens were subjected to PD-L1 staining by immunohistochemistry. Analysis of whether there is a correlation between PD-L1 expression and 18F-FDG uptake parameters in CRC.
Results: PD-L1 expression level was significantly correlated with SUVmax, MTV3.0 and TLG3.0. Multivariate analysis showed that PD-L1 and TLG3.0 were independent predictors of poor DFS in patients with CRC (P=0.009; P=0.016), PD-L1 expression is closely related to the patient's lesion (TLG3.0) (P<0.01).
Conclusion: The results of this study indicate that there was a significant correlation between PD-L1 expression and TLG3.0 which suggested that FDG-PET could serve as a noninvasive tool to assess the tumor microenvironment and as a predictor of PD-L1 inhibitor activity to determine the optimal therapeutic strategy for CRC. High PD-L1 expression levels and high TLG3.0 are independent risk factors for DFS differences in CRC patients.
Keywords: colorectal cancer, programmed cell death ligand 1 (PD-L1), 18F fluorodeoxyglucose (18F-FDG), positron-emission tomography, metabolism
Introduction
Colorectal cancer (CRC) is one of the major cancers worldwide1. According to Bray et al2, CRC is the third most commonly diagnosed cancer and the second most common cause of cancer-related death worldwide. Compared to traditional therapies, emerging cancer immunotherapy usually shows better tolerance and long-lasting effects3,4 . Especially the new checkpoint blockade therapy for PD-1 and its ligand PD-L1 has achieved unprecedented clinical effects in the treatment of the tumors 5,6. Studies have shown that the progression-free survival of PD-L1 antibody in the treatment of non-small cell lung cancer is significantly higher than the consolidation therapy of traditional radiotherapy and chemotherapy (16.8 months vs 5.6 months)7. Many clinical trials have demonstrated that immunotherapy significantly improves progression-free survival in patients. Remarkably, the grade 3 or 4 adverse events were evidently decreased compared to chemotherapy8. And, immunotherapy is suitable for PD-L1 positive patients9, so effective and non-invasive assessment of PD-L1 expression in patients' tumors is a problem to be solved. High expression of PD-L1 has been observed in a large number of solid tumors, including breast cancer10, NSCLC11, hepatocellular carcinoma12, renal cell carcinoma13, testicular cancer14. Some meta-analyses have shown that in many types of cancer, high PD-L1 expression is associated with adverse clinical and pathological outcomes, and the risk of death increases15-17. However, studies on the prevalence and prognosis of PD-L1 expression in CRC remain controversial. A study of another 454 CRC subjects showed that only 12% of patients had PD-L1 expression18. Higher expression of PD-L1 correlates with better prognosis of CRC patients19.
18F-FDG with positron emission tomography (PET) is a diagnostic method for distinguishing between benign and malignant lesions20. Some researchers reported that 18F-FDG PET can be used to monitor the efficacy of chemotherapy drugs and predict the outcome of any treatment for patients with multiple tumors21,22. Lopci et al23 suggest that FDG-PET could serve as a noninvasive tool to assess the tumor microenvironment and therefore predict benefit from PD-L1 blockade or other immunotherapy strategies. However, the relationship between the immune environment, including 18F-FDG uptake and PD-L1 expression in colorectal cancer are unclear.
In the present study, we aimed to investigate whether PD-L1 expression correlates with 18F-FDG uptake parameters to assess whether 18F-FDG PET/CT imaging can be used to predict PD-L1 expression in colorectal cancer. The maximum standard uptake value (SUVmax) only reflects the extent of glucose utilization in the tumor and does not accurately assess the metabolic activity of the tumor as a whole. MTV and TLG provide additional information on intratumoral biological variation. These parameters appear to be reliable indicators for assessing tumor metabolism and have become effective markers for the diagnosis and prognosis of several cancers, including lung and cervical cancer24-27. Therefore, this paper combined MTV, TLG and SUVmax to analyze the relationship between 18F-FDG metabolic parameters and CRC immune microenvironment (PD-L1 expression), and to evaluate the expression level of PD-L1 in patients undergoing surgical colorectal cancer resection with 18F-FDG PET/CT before surgery. To the best of our knowledge, this is a small number of studies providing 18F-FDG PET/CT imaging potential evidence for PD-L1 expression in colorectal cancer.
Material and Methods
Patients
From March 2016 to March 2019, patients with CRC were enrolled in the study; all patients underwent 18F-FDG PET/CT imaging at the Affiliated Tumor Hospital of Harbin Medical University, followed by tumor resection.
The inclusion criteria were as follows: 18F-FDG PET/CT images were obtained before given adjuvant therapy, and colorectal cancer (enlarged) radical resection was performed after imaging; histopathological examination of surgical specimens confirmed the diagnosis of colorectal cancer; complete case records available, including age, gender, tumor size, TNM stage, and degree of differentiation; available immunohistochemical staining tissue specimens. Exclusion criteria were as follows: history of adjuvant therapy before 18F-FDG PET/CT imaging; the pathological tissue specimens of immunohistochemical analysis are insufficient in size; incomplete clinical and pathological data. Complete medical records are available to all patients, including patient clinical data and follow-up information.
Data on clinical pathology was extracted from the medical records. Overall survival and disease-free survival were extracted from the medical records and telephone follow-up. Disease-free survival (DFS) was defined as the time from surgery to tumour recurrence, while overall survival (OS) was defined as the time from surgery to death from any cause.The study was approved by the Ethics Committee of the Affiliated Tumor Hospital of Harbin Medical University and complies with the revised principles of the 2013 Helsinki Declaration.
Immunohistochemical staining
PD-L1 immunohistochemical staining was performed according to previous experimental procedures28,29. The PD-L1 rabbit monoclonal antibody (Abeam, ab205921; UK) was used at a primary antibody concentration of 1:100. The pathological specimens were washed three times with PBS, citrate antigen was repaired, goat serum was blocked for 20 min, and the primary antibody was incubated at 4 °C overnight. On the next day, the corresponding secondary antibody (Zhongshan Jinqiao) was added dropwise to the slide and incubated for 20 min at room temperature. Then, hematoxylin was counterstained and observed under a microscope (magnification: 200; Olympus BX53; Japan). When the dyeing intensity and position were optimal, it was rinsed with tap water, and then dehydrated and sealed with a neutral resin. When membrane staining was observed, the expression of PD-L1 was considered positive. Semi-quantitative scoring method for PD-L1:1 = <1%, 2= 1-5%, 3=6-10%, 4= 11-25%, 5= 26-50% and 6= > 50% positive cells. Tumors with a score greater than or equal to 3 were rated as high expression. At least two investigators examined the tissue sections blindly. If there is any discrepancy, the two investigators will simultaneously evaluate the slices until their assessment reaches a final consensus. The investigators were blinded to the patient outcomes.
18F-FDG PET/CT imaging and data analysis
All patients were fasted for at least 8-12 hours prior to PET imaging and orally laxative (complex polyethylene glycol electrolyte) to clear the intestine for enema in patients with intestinal obstruction. This study did not use intravenous drugs to inhibit intestinal peristalsis. PET imaging was performed using a PET/CT scanner (Discovery ST: GE Medical systems, Milwaukee, WI, USA). Before the injection of 18F-FDG, the patient measured the blood glucose through the fast blood glucose test paper, and controlled the blood glucose level to below 8mmol/L. After the injection, the whole body PET/CT imaging was performed for about 60 minutes. The tube voltage is 120kV, the tube current is 200mAs, and the slice thickness is 3.75mm. PET collection uses 3D mode PET scanning, 2.5min/bed, and generally scans 6-8 beds. Image recombination reconstructs images using the ordered subset maximum expectation method. All 18F-FDG PET/CT images were reviewed by two experienced senior physicians who were unaware of the patient's clinical history and laboratory results. They manually delineate the region of interest (ROI) in colorectal cancer lesions, avoiding heterogeneous regions such as hemorrhage, cystic changes, and necrosis, and measuring SUVmax and mean standardized uptake value (SUVmean) at the most concentrated level of concentration. Inconsistent results were resolved through consensus review. After the PET/CT image is transmitted into the GE PET-VCAR post-processing software, the ROI is automatically outlined by the software using the fixed threshold method and the SUVmax2.5, SUVmax3.0 and SUVmax3.5 as the threshold values on the PET image, manual adjustment from the axial、coronal and sagittal directions to determine the optimal boundary of the primary lesion, then the software automatically generates MTV (2.5, 3.0, 3.5) within the ROI and calculates the corresponding TLG (2.5, 3.0, 3.5) Value. Calculated as follows:

Statistical analysis
Statistical significance was expressed as P <0.05. χ2 or Fisher exact test is used to test whether there was a difference between the clinical data of the 18F-FDG uptake parameters in the PET/CT imaging group. The receiver operating characteristic (ROC) curve analysis was used to examine the possibility that each parameter of 18F-FDG uptake distinguishes between high and low expression of PD-L1, determine the optimal cutoff value for each parameter, and calculate sensitivity and specificity. The correlation between the parameters of 18F-FDG uptake and PD-L1 was assessed using the Spearman correlation coefficient test. The Kaplane Meier method was used to estimate survival as a function of time and to analyze survival differences by Log-rank. Statistical analysis was performed using SPSS software (version 19.0).
Results
Patient demographics
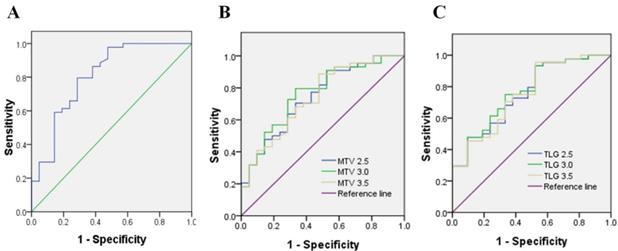
According to the inclusion and exclusion criteria, a total of 65 patients (37 males, 28 females, age range 23-79 years, median age 60 years) were enrolled in the study. The patients' clinicopathological features are listed in Table 1. The best SUVmax cutoff value was determined by ROC curve analysis to be 15.46, the sensitivity was 79.5%, and the specificity was 71.4%(Figure 1). Patients with a SUVmax greater than 15.46 were defined as high SUVmax uptake. High SUVmax uptake was found in 43 (66%) of 65 patients. The relationship between SUVmax and patient clinicopathological features is shown in Table 2. High SUVmax was significantly associated with tumor differentiation (P=0.025), tumor size (P=0.011), TNM stage (P=0.006), and tumor vascular invasion (P=0.000). Similarly, the ROC curve analysis confirmed that MTV3.0 and TLG3.0 had the highest diagnostic performance for PD-L1 high and low expression, the best cut off values were 28.05 and 182.9, respectively, the sensitivity was 79.5% and 75%, respectively, and the specificity was 66.7% and 66.7%(Figure 1). High MTV3.0 was found in 42 (65%) of 65 patients, and high TLG3.0 was found in 40 (62%). The relationship between MTV 3.0, TLG 3.0 and patient clinicopathological features is shown in Table 3. High MTV3.0 and TLG3.0 were significantly associated with tumor differentiation, tumor size, lymph node metastasis, tumor TNM stage, and tumor lymphatic and vascular invasion.
Patients' Characteristics
| Characteristics | N=65 |
|---|---|
| Age | |
| ≤60 years/>60 years | 37/28 |
| Gender | |
| Male/female | 37/28 |
| Tumor location | |
| Rectum/colon | 13/52 |
| Differentiation | |
| Well/ Moderate or poor | 26/39 |
| Tumor size | |
| ≤3cm/>3cm | 28/37 |
| Lymph node metastasis | |
| Positive/ Negative | 48/17 |
| TNM stage | |
| I-II/III-IV | 21/44 |
| Lymphatic permeation | |
| Positive/ Negative | 29/36 |
| Vascular invasion | |
| Positive/ Negative | 29/36 |
| PD-L1 | |
| High/ Low | 44/21 |
A: SUV value parameter to identify the diagnostic performance of PD-L1 high and low expression, the best cutoff value is 15.46. B、C: MTV and TLG parameters identify the diagnostic efficacy of PD-L1 high and low expression, and MTV 3.0 and TLG 3.0 have a larger area under the curve, which is better diagnostic efficiency.
Patient's demographics according to SUVmax and PD-L1 expression.
| Variables | PD-L1 | SUVmax | ||||
|---|---|---|---|---|---|---|
| High (n=44) | Low (n=21) | P value | High (n=43) | Low (n=22) | P value | |
| Age | ||||||
| ≤60years/>60 years | 24/20 | 13/8 | 0.575 | 23/20 | 14/8 | 0.434 |
| Gender | ||||||
| Male/female | 24/20 | 13/8 | 0.575 | 23/20 | 14/8 | 0.434 |
| Tumor location | ||||||
| Rectum/colon | 7/36 | 6/16 | 0.336 | 11/32 | 2/20 | 0.190 |
| Differentiation | ||||||
| Well/ Moderate or poor | 14/30 | 12/9 | 0.051 | 13/30 | 13/9 | 0.025* |
| Tumor size | ||||||
| ≤3cm/>3cm | 13/31 | 15/6 | 0.001* | 15/28 | 15/7 | 0.011* |
| Lymph node metastasis | ||||||
| Positive/ Negative | 36/8 | 12/9 | 0.034* | 36/7 | 12/10 | 0.011* |
| TNM stage | ||||||
| I-II/III-IV | 10/34 | 11/10 | 0.017* | 9/34 | 12/10 | 0.006* |
| Lymphatic permeation | ||||||
| Positive/ Negative | 21/23 | 8/13 | 0.465 | 22/21 | 7/15 | 0.138 |
| Vascular invasion | ||||||
| Positive/ Negative | 24/20 | 5/16 | 0.020* | 26/17 | 3/19 | 0.000* |
* P < 0.05.
P < 0.05 is considered statistically significant.
PD-L1, programmed death ligand-1.
Patient's demographics according to MTV3.0 and TLG3.0.
| Variables | MTV3.0 | TLG3.0 | ||||
|---|---|---|---|---|---|---|
| High (n=42) | Low (n=23) | P value | High (n=40) | Low (n=25) | P value | |
| Age | ||||||
| ≤60years/>60years | 24/18 | 13/10 | 0.961 | 22/18 | 15/10 | 0.692 |
| Gender | ||||||
| Male/female | 22/20 | 15/8 | 0.318 | 22/18 | 15/10 | 0.692 |
| Tumor location | ||||||
| Rectum/colon | 9/33 | 4/19 | 0.758 | 9/31 | 4/21 | 0.524 |
| Differentiation | ||||||
| Well/ Moderate or poor | 9/33 | 14/9 | 0.000* | 9/31 | 17/8 | 0.000* |
| Tumor size | ||||||
| ≤3cm/>3cm | 10/32 | 15/8 | 0.001* | 11/29 | 17/8 | 0.001* |
| Lymph node metastasis | ||||||
| Positive/ Negative | 37/5 | 15/8 | 0.049* | 33/7 | 15/10 | 0.045* |
| TNM stage | ||||||
| I/II/III/IV | 4/2/3/33 | 12/3/0/8 | 0.000* | 3/1/4/32 | 13/4/2/6 | 0.000* |
| Lymphatic permeation | ||||||
| Positive/ Negative | 24/18 | 5/18 | 0.006* | 24/16 | 5/20 | 0.002* |
| Vascular invasion | ||||||
| Positive/ Negative | 29/13 | 4/19 | 0.000* | 26/14 | 3/22 | 0.000* |
* P < 0.05.
P < 0.05 is considered statistically significant.
Immunohistochemistry results
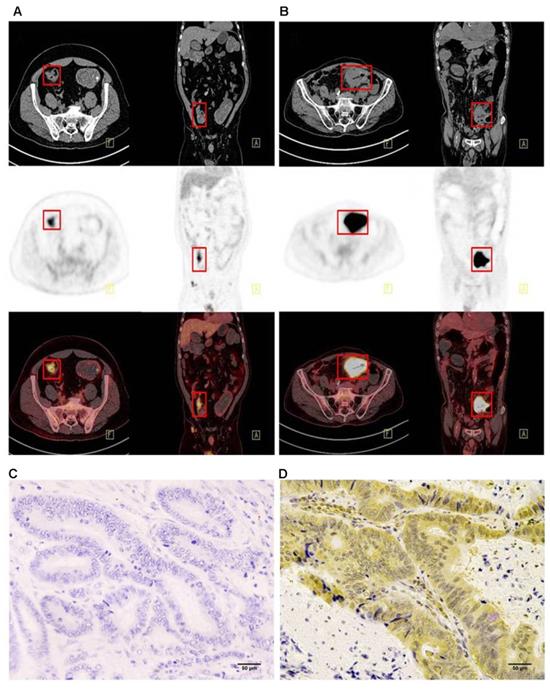
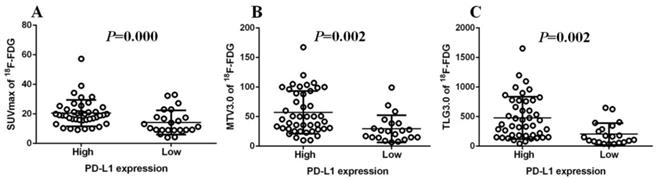
Immunohistochemistry was performed using the main sites of 65 CRC. A representative image of PD-L1 high and low expressions are shown in Figure 2. PD-L1 immunostaining is mainly localized in the plasma membrane of cancer cells30. The high PD-L1 expression rate was 68% (44/65). The relationship between PD-L1 and patient clinicopathological features is shown in Table 1. High expression of PD-L1 was significantly associated with tumor size (P=0.001), lymph node metastasis (P=0.034), tumor TNM stage (P=0.017), and tumor vascular invasion (P=0.020). And based on the comparison of SUVmax, MTV3.0 and TLG3.0 expressed by PD-L1, SUVmax, MTV3.0 and TLG3.0 values were significantly higher in patients with CRC with high PD-L1 expression than those with low expression; the difference was statistically significant (Figure 3).
Representative imaging of immunohistochemical staining with PD-L1 expression and 18F-FDG PET with high 18F-FDG (B) (D) and low 18F-FDG accumulation (A) (C): The maximum standardised uptake values were 9.09 (A) and 39.01 (B) (red frame). The immunostaining pattern of PD-L1 was membrane, and the cases with scoring of 2 (C) and scoring of 6 (D) were presented. PD-L1, programmed death ligand-1; 18F-FDG, 2-Deoxy-2-[fluorine-18] fluoro-D-glucose; PET, positron emission tomography.
Comparison of SUVmax、MTV3.0 and TLG3.0 according to PD-L1 expression: SUVmax was significantly higher in patients with high PD-L1 expression than that in those with low expression (P=0.000) (A); MTV3.0 was significantly higher in patients with high PD-L1 expression than that in those with low expression (P =0.002) (B); TLG3.0 was significantly higher in patients with high PD-L1 expression than that in those with low expression (P=0.002) (C). PD-L1, programmed death ligand-1; SUVmax, standardised uptake value; MTV, metabolic tumor volume; TLG, total lesion glycolysis.
Correlation between PD-L1 expression and various parameters of 18F-FDG uptake
The correlation between SUVmax, MTV 3.0 and TLG 3.0 and PD-L1 is listed in Table 4. Spearman analysis showed that PD-L1 expression was significantly associated with higher SUVmax, MTV3.0 and TLG3.0 (Table 4) (rho=0.50, P<0.0001; rho=0.42, P=0.0004; rho=0.43, P=0.0003).
Correlation with PD-L1 expression and FDG metabolic parameter.
| Variables | PD-L1 | ||
|---|---|---|---|
| rho | 95%CI | P value | |
| All patients(n=65) SUVmax | 0.50 | 0.28 to 0.67 | <0.01* |
| MTV3.0 TLG3.0 | 0.42 0.43 | 0.19 to 0.61 0.20 to 0.62 | <0.01* <0.01* |
* P < 0.05.
P < 0.05 is considered statistically significant.
PD-L1, programmed death ligand-1; CI, confidence interval.
Univariate and multivariate survival analysis
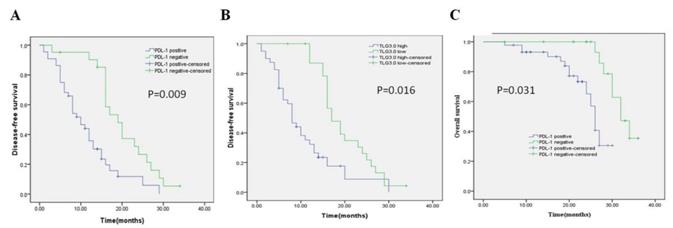
Univariate and multivariate analyses were performed on all patients (Table 5, Table 6). In the univariate analysis, patients with high PD-L1 expression showed shorter DFS (P = 0.000) and OS (P = 0.002) than patients with low PD-L1 expression. Patients with higher SUVmax, MTV3.0, and TLG3.0 had significantly lower DFS (P = 0.004, P = 0.001, P = 0.000) and OS (P = 0.048, P = 0.003, P = 0.004) than patients with lower SUVmax, MTV 3.0 and TLG3.0. In addition, tumor differentiation, tumor size, and vascular invasion were also identified as independent risk factors for DFS; independent risk factors for OS were vascular invasion, PD-L1, SUVmax, MTV3.0, and TLG3.0. Based on the results of the univariate log-rank test, we screened variables with P < 0.05. Multivariate analysis showed that PD-L1, TLG3.0 were significant independent predictors of DFS, and independent predictors of OS were PD-L1 expression and tumor vascular invasion (Table 6). Figure 4 shows KaplaneMeier survival curves for patients with high and low TLG3.0 and PD-L1 expression.
Univariate and multivariate analysis of prognostic factors for disease-free survival.
| Factor | Univariate analysis | Multivariate analysis | ||
|---|---|---|---|---|
| HR (95%CI) | P value | HR (95%CI) | P value | |
| Age(>60vs≤60) | 0.891(0.517-1.537) | 0.667 | ||
| Gender(male vs female) | 0.896(0.516-1.558) | 0.688 | ||
| Differentiation(well vs moderate/poor) | 0.449(0.250-0.804) | 0.004* | 0.530(0.202-1.394) | 0.198 |
| Tumor size(>3cm vs ≤3cm) | 2.071(1.170-3.666) | 0.008* | 0.733(0.261-2.060) | 0.556 |
| Lymph node metastasis (yes vs no) | 1.838(0.955-3.536) | 0.054 | ||
| TNM stage (IV-III vs II-I) | 0.587(0.330-1.042) | 0.055 | ||
| Tumor location(rectum vs colon) | 1.049(0.492-2.234) | 0.898 | ||
| Ly(positive vs negative) | 1.427(0.829-2.458) | 0.181 | ||
| Vascular invasion(positive vs negative) | 2.396(1.295-4.433) | 0.003* | 1.162(0.577-2.340) | 0.675 |
| PD-L1 (positive vs negative) | 2.887(1.566-5.325) | 0.000* | 2.914(1.307-6.497) | 0.009* |
| SUVmax (high vs low) | 2.279(1.268-4.098) | 0.004* | 1.194(0.543-2.626) | 0.658 |
| MTV3.0(high vs low) | 2.426(1.364-4.315) | 0.001* | 0.323(0.078-1.345) | 0.121 |
| TLG3.0(high vs low) | 2.853(1.596-5.101) | 0.000* | 5.784(1.388-24.094) | 0.016* |
*P < 0.05 is considered statistically significant, calculated with continuous variable.CI, confidence interval; Ly, lymphatic permeation; HR, hazard ratio; PD-L1, programmed death ligand-1.
Univariate and multivariate analysis of prognostic factors for overall survival.
| Factor | Univariate analysis | Multivariate analysis | ||
|---|---|---|---|---|
| HR (95%CI) | P value | HR (95%CI) | P value | |
| Age(>60 vs ≤60) | 0.806(0.337-1.927) | 0.618 | ||
| Gender(male vs female) | 1.259(0.537-2.951) | 0.587 | ||
| Differentiation(well vs moderate/poor) | 0.553(0.201-0.519) | 0.238 | ||
| Tumor size(>3cm vs ≤3cm) | 2.650(0.945-7.437) | 0.052 | ||
| Lymph node metastasis (yes vs no) | 2.102(0.755-5.857) | 0.138 | ||
| TNM stage (IV-III vs II-I) | 0.505(0.201-1.274) | 0.135 | ||
| Tumor location(rectum vs colon) | 0.651(0.238-1.782) | 0.390 | ||
| Ly(positive vs negative) | 1.092(0.455-2.620) | 0.841 | ||
| Vascular invasion(positive vs negative) | 4.939(1.732-14.082) | 0.001* | 3.429(1.005-11.697) | 0.049* |
| PD-L1 (positive vs negative) | 5.142(1.673-15.805) | 0.002* | 4.267(1.144-15.917) | 0.031* |
| SUVmax (high vs low) | 2.385(0.968-5.876) | 0.048* | 1.229(0.393-3.847) | 0.723 |
| MTV3.0(high vs low) | 3.935(1.504-10.298) | 0.003* | 1.456(0.142-14.881) | 0.751 |
| TLG3.0(high vs low) | 3.757(1.448-9.743) | 0.004* | 1.578(0.140-17.758) | 0.712 |
*P < 0.05 is considered statistically significant, calculated with continuous variable.
CI, confidence interval; Ly, lymphatic permeation; HR, hazard ratio; PD-L1, programmed death ligand-1.
Kaplan-Meier survival curves for patients with CRC. (A) DFS curves for patients with negative PD-L1 expression and patients with positive PD-L1 expression. (B) DFS curves for patients with a low TLG3.0 and patients with a high TLG3.0. (C) OS curves for patients with negative PD-L1 expression and patients with positive PD-L1 expression.
Discussion
This retrospective study assessed the clinicopathological significance of PD-L1 expression correlated with SUVmax, MTV3.0, and TLG3.0 in surgically resected CRC tissue. We found that SUVmax, MTV3.0, and TLG3.0 were significantly higher in PD-L1 high-expression colorectal cancer than in PD-L1 low-expression colorectal cancer. These results indicate that the expression level of PD-L1 is significantly correlated with tumor metabolism, metabolic volume and total glycolysis. The maximum standard uptake value (SUVmax) of 18F-FDG-PET is widely used in clinical practice due to its simplicity31 . However, it reflects the degree of glucose utilization of the tumor and does not accurately assess the metabolic activity of the tumor as a whole. MTV and TLG provide additional information on intratumoral biological variation. The relationship between PD-L1 expression in colorectal cancer and multiple parameters such as SUVmax, MTV and TLG, and the possible underlying mechanisms are still unclear. To the best of our knowledge, this is a small study analyzing the relationship between multi-parameters of 18F-FDG uptake and PD-L1 expression in colorectal cancer.
Immunotherapy against PD-1/PD-L1 has been successfully used to treat a variety of malignancies including, but not limited to, melanoma, lung cancer, kidney cancer, and bladder cancer32-35 . However, the clinical features associated with the benefits of immunotherapy remain largely unknown and identifying patients who may benefit from PD-1/PD-L1 blockade, while excluding those who may not respond to treatment remains unresolved challenges. By immunohistochemical assessment, expression of PD-L1 has been tested as a predictive biomarker for response to checkpoint inhibitors in colorectal cancer. However, this procedure requires invasive biopsy, so alternative non-invasive strategies for predicting PD-L1 expression, such as PET/CT imaging, and provides information for anti-PD-L1 antibody treatment strategies in colorectal cancer patients, and will be of great value for cancer immunotherapy. In this study, PD-L1 was highly expressed in 68% of CRC patients. In particular, the expression of PD-L1 is closely related to SUVmax, MTV3.0, and TLG3.0, which may be an important indicator for predicting the poor prognosis of CRC patients with high 18F-FDG intake related parameters. This retrospective study evaluated a significant association between 18F-FDG uptake-related parameters (SUVmax, MTV3.0, TLG3.0) and PD-L1 expression in surgically resected CRC. The expression rate of this positive PD-L1 was similar to that of the previous CRC study, and the positive expression of PD-L1 was found in 81.8% of metastatic CRC, which was more common than in primary CRC (40.9%; P = 0.012)36. These results indicate that the expression level of PD-L1 is significantly correlated with tumor metabolism, metabolic volume and total glycolysis. SUVmax, MTV3.0, and TLG3.0 values were significantly higher in patients with high PD-L1 expression than in low-expression patients. Previous studies have shown that FDG-PET could serve as a noninvasive tool to assess the tumor microenvironment and therefore predict benefit from PD-1/PD-L1 blockade or other immunotherapy strategies23. The results are consistent with the results of our study. In multivariate analysis, PD-L1 and TLG3.0 were identified as independent predictors of worse DFS in CRC patients, and DFS in patients with high PD-L1 and TLG3.0 were significantly lower. In addition, multivariate analysis showed that increased PD-L1 expression was significantly associated with low OS in CRC patients, and the results were consistent with previous studies. Wu et al37 conducted two studies demonstrating that positive PD-L1 expression is associated with a poor 5-year OS CRC. The high expression of PD-L1 is associated with low OS in CRC, high expression of PD-L1 is an independent predictor of colorectal cancer prognosis, PD-L1 knockdown can inhibit cell proliferation, migration and invasion38 . It can be seen that the expression of PD-L1 is associated with the prognosis of colorectal cancer. Patients with tumors with high expression of PD-L1 had poorer DFS and OS than patients with tumors with low expression of PD-L1.
Studies have supported our view that increased PD-L1 expression allows tumor cells to evade host immune surveillance and promote disease progression39 . In contrast, the results of another previous study showed that low PD-L1 expression was significantly associated with tumor recurrence and poor prognosis in stage III CRC40. In 2015, Le et al41 found that a higher tumor mutational burden (TMB) has been shown to correlate with clinical benefit from immunotherapy within colorectal cancer. In 2019, Yarchoan et al42 also found PD-L1 expression and TMB may each inform the use of immunotherapy, and identified new opportunities for therapeutic development. It can be seen that high expression of PD-L1 is associated with favorable and unfavorable prognosis in different studies. Moreover, the specificity of immunotherapy of tumor is not only related to the expression of PD-L1, but also may be related to TMB. Some of these findings may be due to differences in antibody selection, determination of thresholds used to determine PD-L1 positivity, and heterogeneity within the tumor. Further analyses are in need to further assess the prognostic value of PD-L1 for CRC patients receiving immunotherapy.
Due to its high repeatability and availability, SUVmax is currently the most commonly used 18F-FDG PET/CT parameter for diagnosis, performing TNM staging and monitoring treatment. Most studies have shown that SUVmax in CRC is associated with prognostic assessment. Marcus et al43 said that SUVmax is higher in patients with poor prognosis in CRC. Unlike SUVs, PET/CT metabolic parameters obtained by measuring high metabolic activity areas of tumors can provide volume and metabolic information for highly metabolized tumor cells. It has been reported in several malignant tumors (including pancreatic cancer, cervical cancer)44,45 that the PET/CT metabolic parameters represented by MTV and TLG are independent prognostic factors. However, the prognostic significance of MTV and TLG for CRC remains unclear. Therefore, this study evaluated the significance of SUVmax, MTV, and TLG for prognostic factors in patients with CRC. In a multivariate analysis, we found that tumor high TLG3.0 was an independent predictor of poor DFS in patients with CRC. It is indicated that TLG3.0 has important predictive value for disease-free survival time of CRC patients. Previous studies have shown that MTV and TLG in PET/CT are reliable biomarkers for CRC diagnosis. Using these parameters, a more accurate preoperative diagnosis of the CRC can be performed46 .
We also studied the biological characteristics of tumors with high and low FDG uptake. Our study showed that there were differences in tumor differentiation, tumor size, lymph node metastasis, TNM stage, and tumor vascular invasion in patients with different SUVmax, MTV3.0, and TLG3.0 CRC, and the difference was statistically significant. New therapies based on PD-1/PD-L1 inhibitors are known to exhibit impressive anti-tumor activity in tumor patients such as NSCLC and have recently become standard therapies for NSCLC47 . It can be seen that in this era of personalized medicine, clinicians face the following important questions: How do doctors identify patients who are more likely to benefit from anti-PD-1/PD-L1 treatment? Recent studies have shown that PD-L1 overexpression has become a useful predictor of poor CRC prognosis, and PD-L1 overexpression may prove valuable for screening candidates for anti-PD-1/PD-L1 therapy38 . In this study, we investigated the relationship between PD-L1 expression and clinicopathological factors. Our results showed that there were differences in tumor TNM stage, tumor size, lymph node metastasis and tumor vascular invasion in patients with different PD-L1 expression levels, and the difference was statistically significant (P <0.05). That is, patients with worse clinical pathological features have higher PD-L1 expression in patients with better clinical pathology, indicating that PD-L1 expression can be used as a marker of disease progression. These patients may benefit more from PD-L1 immunological checkpoint inhibitors than other patients. In addition, this study investigated whether SUVmax, MTV3.0, and TLG3.0 can predict PD-L1 expression in tumor tissues of patients with CRC. We observed a positive correlation between SUVmax, MTV3.0, and TLG3.0 and PD-L1 expression. Our results suggest that FDG-PET can be used as a non-invasive tool for assessing PD-L1 expression, thus predicting the benefits that may be derived from the PD-1/PD-L1 pathway-targeted immunotherapy.
This study has some limitations. First, studying the limited sample size of the cohort may reduce the statistical power of data analysis. Secondly, the deviation of the material selection, the different periods of tumor growth, different storage time and environment, and even the heterogeneity inside the tumor will make the PD-L1 expressed by the tumor bias. Third, different studies use different antibodies, and antibody selection may affect the results of the study. In this study, we used the clone 28-8 antibody, which has been used in clinical trials of nivolumab. In future studies, it may be necessary to validate different anti-PD-L1 antibodies in the same CRC sample.
Conclusion
In conclusion, our results indicate that there is a significant correlation between TLG3.0 and PD-L1 expression levels, suggesting a potential role for 18F-FDG PET/CT to characterize the tumor microenvironment and select CRC patients' candidate to checkpoint inhibitors. In patients with high TLG3.0, PD-L1 is an independent predictor of low postoperative DFS; therefore, the accumulation of total glycolysis in CRC patients may help to predict the predictive effect of PD-L1 expression. Moreover, high PD-L1 expression is also an independent predictor of poor OS in CRC patients, further confirming that PD-L1 can be used as a target for immunotherapy in CRC patients. The future directions is to clarify why immunological checkpoint molecules such as PD-L1 can affect the glycolysis of tumor cells, and further explore the value of 18F-FDG PET/CT in predicting anti-PD-1/PD-L1 therapy response, it plays a key role in selecting the best treatment strategy for CRC patients.
Acknowledgements
Funding
This study was supported by grants from the National Key Research and Development Program of China (2019YFC0118100), National Natural Science Foundation of China (81671760 and 81873910), Scientific Research Transformation Special Fund of Heilongjiang Academy of Medical Sciences (2018415), Scientific Research Project of Health and Family Planning Commission of Heilong jiang Province(201812 and 201622), Harbin Science and Technology Innovation Talent Research Special Fund Project (2012RFQXS063) and Postgraduate Research & Practice Innovation Program of Harbin Medical University (YJSKYCX2018-62HYD).
Author Contributions
Hao Jiang and Rongjun Zhang carried out the studies, participated in collecting data, and drafted the manuscript. Hao Jiang and Wei Guo performed the statistical analysis and participated in its design. Jifeng Zhang and Xinglu Zhou participated in acquisition, analysis of data. Huijie Jiang designed the study and carefully revised the manuscript. Ping Li supervised the study and contributed to data interpretation. Mingyu Zhang, Wenbin Pan and Sheng Zhao have contributed to all experiments. They also carefully revised the manuscript. All authors read and approved the final manuscript.
Competing Interests
The authors have declared that no competing interest exists.
References
1. Wang H, Liang L, Fang JY, Xu J. Somatic gene copy number alterations in colorectal cancer: new quest for cancer drivers and biomarkers. Oncogene. 2016;35(16):2011-9
2. Bray F, Ferlay J, Soerjomataram I, Siegel RL, Torre LA, Jemal A. Global cancer statistics 2018: GLOBOCAN estimates of incidence and mortality worldwide for 36 cancers in 185 countries. CA Cancer J Clin. 2018;68(6):394-424
3. Topalian SL, Taube JM, Anders RA, Pardoll DM. Mechanism-driven biomarkers to guide immune checkpoint blockade in cancer therapy. Nat Rev Cancer. 2016;16(5):275-87
4. Obenauf AC, Zou Y, Ji AL, Vanharanta S, Shu W, Shi H. et al. Therapy-induced tumour secretomes promote resistance and tumour progression. Nature. 2015;520(7547):368-72
5. Topalian SL, Drake CG, Pardoll DM. Immune checkpoint blockade: a common denominator approach to cancer therapy. Cancer Cell. 2015;27(4):450-61
6. Hugo W, Shi H, Sun L, Piva M, Song C, Kong X. et al. Non-genomic and Immune Evolution of Melanoma Acquiring MAPKi Resistance. Cell. 2015;162(6):1271-85
7. Wang Y, Deng W, Li N, Neri S, Sharma A, Jiang W. et al. Combining Immunotherapy and Radiotherapy for Cancer Treatment: Current Challenges and Future Directions. Front Pharmacol. 2018;9:185
8. Brahmer J, Reckamp KL, Baas P, Crino L, Eberhardt WE, Poddubskaya E. et al. Nivolumab versus Docetaxel in Advanced Squamous-Cell Non-Small-Cell Lung Cancer. N Engl J Med. 2015;373(2):123-35
9. Patel SP, Kurzrock R. PD-L1 Expression as a Predictive Biomarker in Cancer Immunotherapy. Mol Cancer Ther. 2015;14(4):847-56
10. Li Z, Dong P, Ren M, Song Y, Qian X, Yang Y. et al. PD-L1 Expression Is Associated with Tumor FOXP3(+) Regulatory T-Cell Infiltration of Breast Cancer and Poor Prognosis of Patient. J Cancer. 2016;7(7):784-93
11. Scheel AH, Ansen S, Schultheis AM, Scheffler M, Fischer RN, Michels S. et al. PD-L1 expression in non-small cell lung cancer: Correlations with genetic alterations. Oncoimmunology. 2016;5(5):e1131379
12. Calderaro J, Rousseau B, Amaddeo G, Mercey M, Charpy C, Costentin C. et al. Programmed death ligand 1 expression in hepatocellular carcinoma: Relationship With clinical and pathological features. Hepatology. 2016;64(6):2038-46
13. Shin SJ, Jeon YK, Kim PJ, Cho YM, Koh J, Chung DH. et al. Clinicopathologic Analysis of PD-L1 and PD-L2 Expression in Renal Cell Carcinoma: Association with Oncogenic Proteins Status. Ann Surg Oncol. 2016;23(2):694-702
14. Cierna Z, Mego M, Miskovska V, Machalekova K, Chovanec M, Svetlovska D. et al. Prognostic value of programmed-death-1 receptor (PD-1) and its ligand 1 (PD-L1) in testicular germ cell tumors. Ann Oncol. 2016;27(2):300-5
15. Gu X, Gao XS, Xiong W, Guo W, Han L, Bai Y. et al. Increased programmed death ligand-1 expression predicts poor prognosis in hepatocellular carcinoma patients. Onco Targets Ther. 2016:94805-13
16. Li X, Li M, Lian Z, Zhu H, Kong L, Wang P. et al. Prognostic Role of Programmed Death Ligand-1 Expression in Breast Cancer: A Systematic Review and Meta-Analysis. Target Oncol. 2016;11(6):753-61
17. Aguiar PN Jr, Santoro IL, Tadokoro H, de Lima Lopes G, Filardi BA, Oliveira P. et al. The role of PD-L1 expression as a predictive biomarker in advanced non-small-cell lung cancer: a network meta-analysis. Immunotherapy. 2016;8(4):479-88
18. Inaguma S, Lasota J, Wang Z, Felisiak-Golabek A, Ikeda H, Miettinen M. Clinicopathologic profile, immunophenotype, and genotype of CD274 (PD-L1)-positive colorectal carcinomas. Mod Pathol. 2017;30(2):278-85
19. Li Y, Liang L, Dai W, Cai G, Xu Y, Li X. et al. Prognostic impact of programed cell death-1 (PD-1) and PD-ligand 1 (PD-L1) expression in cancer cells and tumor infiltrating lymphocytes in colorectal cancer. Mol Cancer. 2016;15(1):55
20. Pieterman RM, van Putten JW, Meuzelaar JJ, Mooyaart EL, Vaalburg W, Koeter GH. et al. Preoperative staging of non-small-cell lung cancer with positron-emission tomography. N Engl J Med. 2000;343(4):254-61
21. Moon SH, Cho SH, Park LC, Ji JH, Sun JM, Ahn JS. et al. Metabolic response evaluated by 18F-FDG PET/CT as a potential screening tool in identifying a subgroup of patients with advanced non-small cell lung cancer for immediate maintenance therapy after first-line chemotherapy. Eur J Nucl Med Mol Imaging. 2013;40(7):1005-13
22. Sunaga N, Oriuchi N, Kaira K, Yanagitani N, Tomizawa Y, Hisada T. et al. Usefulness of FDG-PET for early prediction of the response to gefitinib in non-small cell lung cancer. Lung Cancer. 2008;59(2):203-10
23. Lopci E, Toschi L, Grizzi F, Rahal D, Olivari L, Castino GF. et al. Correlation of metabolic information on FDG-PET with tissue expression of immune markers in patients with non-small cell lung cancer (NSCLC) who are candidates for upfront surgery. Eur J Nucl Med Mol Imaging. 2016;43(11):1954-61
24. Tylski P, Stute S, Grotus N, Doyeux K, Hapdey S, Gardin I. et al. Comparative assessment of methods for estimating tumor volume and standardized uptake value in (18)F-FDG PET. J Nucl Med. 2010;51(2):268-76
25. Park SB, Choi JY, Moon SH, Yoo J, Kim H, Ahn YC. et al. Prognostic value of volumetric metabolic parameters measured by [18F]fluorodeoxyglucose-positron emission tomography/computed tomography in patients with small cell lung cancer. Cancer Imaging. 2014:142
26. La TH, Filion EJ, Turnbull BB, Chu JN, Lee P, Nguyen K. et al. Metabolic tumor volume predicts for recurrence and death in head-and-neck cancer. Int J Radiat Oncol Biol Phys. 2009;74(5):1335-41
27. Kim DH, Song BI, Hong CM, Jeong SY, Lee SW, Lee J. et al. Metabolic parameters using (1)(8)F-FDG PET/CT correlate with occult lymph node metastasis in squamous cell lung carcinoma. Eur J Nucl Med Mol Imaging. 2014;41(11):2051-7
28. Kaira K, Higuchi T, Naruse I, Arisaka Y, Tokue A, Altan B. et al. Metabolic activity by (18)F-FDG-PET/CT is predictive of early response after nivolumab in previously treated NSCLC. Eur J Nucl Med Mol Imaging. 2018;45(1):56-66
29. Shimizu A, Kaira K, Okubo Y, Utsumi D, Yasuda M, Asao T. et al. Positive PD-L1 Expression Predicts Worse Outcome in Cutaneous Angiosarcoma. J Glob Oncol. 2017;3(4):360-69
30. Kaira K, Shimizu K, Kitahara S, Yajima T, Atsumi J, Kosaka T. et al. 2-Deoxy-2-[fluorine-18] fluoro-d-glucose uptake on positron emission tomography is associated with programmed death ligand-1 expression in patients with pulmonary adenocarcinoma. Eur J Cancer. 2018(101):181-190
31. Yoo Ie R, Chung SK, Park HL, Choi WH, Kim YK, Lee KY. et al. Prognostic value of SUVmax and metabolic tumor volume on 18F-FDG PET/CT in early stage non-small cell lung cancer patients without LN metastasis. Biomed Mater Eng. 2014;24(6):3091-103
32. Brahmer JR, Tykodi SS, Chow LQ, Hwu WJ, Topalian SL, Hwu P. et al. Safety and activity of anti-PD-L1 antibody in patients with advanced cancer. N Engl J Med. 2012;366(26):2455-65
33. Herbst RS, Soria JC, Kowanetz M, Fine GD, Hamid O, Gordon MS. et al. Predictive correlates of response to the anti-PD-L1 antibody MPDL3280A in cancer patients. Nature. 2014;515(7528):563-7
34. Powles T, Eder JP, Fine GD, Braiteh FS, Loriot Y, Cruz C. et al. MPDL3280A (anti-PD-L1) treatment leads to clinical activity in metastatic bladder cancer. Nature. 2014;515(7528):558-62
35. Awad MM, Hammerman PS. Durable Responses With PD-1 Inhibition in Lung and Kidney Cancer and the Ongoing Search for Predictive Biomarkers. J Clin Oncol. 2015;33(18):1993-4
36. Wang HB, Yao H, Li CS, Liang LX, Zhang Y, Chen YX. et al. Rise of PD-L1 expression during metastasis of colorectal cancer: Implications for immunotherapy. J Dig Dis. 2017;18(10):574-81
37. Wu P, Wu D, Li L, Chai Y, Huang J. PD-L1 and Survival in Solid Tumors: A Meta-Analysis[J]. PLoS One. 2015;10(6):e0131403
38. Shi SJ, Wang LJ, Wang GD, Guo ZY, Wei M, Meng YL. et al. B7-H1 expression is associated with poor prognosis in colorectal carcinoma and regulates the proliferation and invasion of HCT116 colorectal cancer cells. PLoS One. 2013;8(10):e76012
39. Wang J, Yuan R, Song W, Sun J, Liu D, Li Z. PD-1, PD-L1 (B7-H1) and Tumor-Site Immune Modulation Therapy: The Historical Perspective. J Hematol Oncol. 2017;10(1):34
40. Bae SU, Jeong WK, Baek SK, Kim NK, Hwang I. Prognostic impact of programmed cell death ligand 1 expression on long-term oncologic outcomes in colorectal cancer. Oncol Lett. 2018;16(4):5214-22
41. Le DT, Uram JN, Wang H, Bartlett BR, Kemberling H, Eyring AD. et al. PD-1 Blockade in Tumors with Mismatch-Repair Deficiency. N Engl J Med. 2015;372(26):2509-20
42. Yarchoan M, Albacker LA, Hopkins AC, Montesion M, Murugesan K, Vithayathil TT. et al. PD-L1 expression and tumor mutational burden are independent biomarkers in most cancers. JCI Insight. 2019:4 (6)
43. Marcus C, Wray R, Taghipour M, Marashdeh W, Ahn SJ, Mena E. et al. JOURNAL CLUB: Value of Quantitative FDG PET/CT Volumetric Biomarkers in Recurrent Colorectal Cancer Patient Survival. AJR Am J Roentgenol. 2016;207(2):257-65
44. Im HJ, Oo S, Jung W, Jang JY, Kim SW, Cheon GJ. et al. Prognostic Value of Metabolic and Volumetric Parameters of Preoperative FDG-PET/CT in Patients With Resectable Pancreatic Cancer. Medicine (Baltimore). 2016;95(19):e3686
45. Sun Y, Lu P, Yu L. The Volume-metabolic Combined Parameters from (18)F-FDG PET/CT May Help Predict the Outcomes of Cervical Carcinoma. Acad Radiol. 2016;23(5):605-10
46. Suzuki Y, Okabayashi K, Hasegawa H, Tsuruta M, Shigeta K, Murakami K. et al. Metabolic Tumor Volume and Total Lesion Glycolysis in PET/CT Correlate With the Pathological Findings of Colorectal Cancer and Allow Its Accurate Staging. Clin Nucl Med. 2016;41(10):761-5
47. Ettinger DS, Wood DE, Akerley W, Bazhenova LA, Borghaei H, Camidge DR. et al. NCCN Guidelines Insights: Non-Small Cell Lung Cancer, Version 4.2016. J Natl Compr Canc Netw. 2016;14(3):255-64
Author contact
![]() Corresponding authors: Huijie Jiang, PHD: Department of Radiology, The Second Affiliated Hospital of Harbin Medical University, Harbin, China; Tel:+86-13904509089; E-mail: jhjemailcom. Ping Li, PHD: Department of PET/CT, The Second Affiliated Hospital of Harbin Medical University, Harbin, China; E-mail: 523371675com.
Corresponding authors: Huijie Jiang, PHD: Department of Radiology, The Second Affiliated Hospital of Harbin Medical University, Harbin, China; Tel:+86-13904509089; E-mail: jhjemailcom. Ping Li, PHD: Department of PET/CT, The Second Affiliated Hospital of Harbin Medical University, Harbin, China; E-mail: 523371675com.