Impact Factor ISSN: 1837-9664

 Global reach, higher impact
J Cancer 2020; 11(10):2769-2777. doi:10.7150/jca.38088 This issue Cite
Research Paper
Impacts of RETN genetic polymorphism on breast cancer development
Chao-Qun Wang1,2, Chih-Hsin Tang3,4,5, Huey-En Tzeng6,7,8, Lulu Jin9, Jin Zhao9, Le Kang9, Yan Wang10, Gui-Nv Hu11, Bi-Fei Huang2, Xiaoni Li12, Yong-Ming Zhao11, Chen-Ming Su13 ![]() , Hong-Chuan Jin1
, Hong-Chuan Jin1 ![]()
1. Laboratory of Cancer Biology, Key Laboratory of Biotherapy in Zhejiang Province, Sir Run Run Shaw Hospital, Medical School of Zhejiang University, Hangzhou, China
2. Department of Pathology, Affiliated Dongyang Hospital of Wenzhou Medical University, Dongyang, Zhejiang, China
3. Department of Pharmacology, School of Medicine, China Medical University, Taichung, Taiwan
4. Chinese Medicine Research Center, China Medical University, Taichung, Taiwan
5. Department of Biotechnology, College of Health Science, Asia University, Taichung, Taiwan
6. Taipei Cancer Center, Taipei Medical University, Taipei, Taiwan
7. Graduate Institute of Cancer Biology and Drug Discovery, College of Medical Science and Technology, Taipei Medical University, Taipei, Taiwan
8. Division of Hematology/Oncology, Department of Medicine, Taipei Medical University-Shuang Ho Hospital, Taiwan
9. Department of Biomedical Sciences Laboratory, Affiliated Dongyang Hospital of Wenzhou Medical University, Dongyang, Zhejiang, China
10. Department of Medical Oncology, Affiliated Dongyang Hospital of Wenzhou Medical University, Dongyang, Zhejiang, China
11. Department of Surgical Oncology, Affiliated Dongyang Hospital of Wenzhou Medical University, Dongyang, Zhejiang, China
12. Hefei National Laboratory for Physical Sciences at Microscale and School of Life Sciences, University of Science and Technology of China, Anhui, China
13. Department of Sports Medicine, China Medical University, Taichung, Taiwan
Received 2019-7-2; Accepted 2019-12-1; Published 2020-2-20
Abstract
The adipokine resistin is linked with obesity, inflammation and various cancers, including breast cancer. This study sought to determine whether certain polymorphisms in the gene encoding resistin, RETN, increase the risk of breast cancer susceptibility. We analyzed levels of resistin expression in breast cancer tissue and samples from The Cancer Genome Atlas database. We also examined associations between four RETN single nucleotide polymorphisms (SNPs; rs3745367, rs7408174, rs1862513 and rs3219175) and breast cancer susceptibility in 515 patients with breast cancer and 541 healthy women without cancer. Compared with wild-type (GG) carriers, those carrying the AG genotype of the RETN SNP rs3219175 and those carrying at least one A allele in the SNP rs3219175 had a higher chance of developing breast cancer (adjusted odds ratio, AOR: 1.295, 95% confidence intervals, CI: 1.065-1.575 and 2.202, 1.701-2.243, respectively). When clinical aspects and the RETN SNP rs7408174 were examined in the breast cancer cohort, the CT genotype was linked to late-stage disease, while women with luminal A disease and at least one C allele were likely to progress to stage III/IV disease and to develop highly pathological grade III disease. Moreover, resistin-positive individuals were at greater risk than resistin-negative individuals for developing pathological grade III disease (OR: 5.020; 95% CI: 1.380-18.259). This study details risk associations between resistin and RETN SNPs in breast cancer susceptibility in Chinese Han women.
Keywords: single nucleotide polymorphism, breast cancer, resistin, The Cancer Genome Atlas
Introduction
GLOBOCAN 2018 estimates of cancer incidence and mortality document breast cancer as the most often diagnosed cancer that affects women, accounting for 11.6% of the total cancer cases worldwide [1]. The risk of developing breast cancer is modified by various factors including age, reproductive and gynecological factors, physical activity, consumption of alcohol and tobacco, as well as family history [2] and gynecological diseases such as adenomyosis and polycystic ovarian syndrome [3, 4].
Genetic testing and mammography screening have limited specificity and sensitivity for evaluating an individual's level of breast cancer risk [2]. Research indicates that single nucleotide polymorphism (SNP) genotyping might better predict an individual's risk for breast cancer and guide disease management [5, 6]. Certain SNPs influence susceptibility to breast cancer [7]. The risk of breast cancer is higher in those carrying the BRCA1 and BRCA2 gene mutations [8, 9] and genetic polymorphisms such as high-mobility group box protein 1 (HMGB1) and fascin-1 (FSCN1) [10, 11].
Resistin is a small cysteine-rich adipokine secreted by adipose tissue or constitutively secreted by macrophages [12]; positive correlations have been observed between levels of plasma resistin and inflammatory markers, in addition to coronary artery calcification, a risk factor for coronary atherosclerosis [13]. SNPs are found in the RETN promoter and 3'-untranslated regions [14]. Genetic variation at the RETN locus carries a risk of several diseases, including the metabolic syndrome and colon cancer [15, 16] and those with a functional RETN gene polymorphism at -420 (rs1862513) are at risk of developing type 2 diabetes [17, 18], and associated with obesity in Tunisian population [19]. RETN SNPs have been found to correlated with worsening disease in Chinese Han patients with lung cancer [20]. There is in vitro evidence of upregulated RETN gene expression in samples of human breast cancer tissue [21] and polycystic ovary syndrome [22], but up until now, no association has been observed between RETN gene polymorphisms and breast cancer prognosis. Here we investigated some RETN SNPs with higher impact or risks in various cancers. This case-control study examined the involvement of four RETN SNPs and clinicopathological features in susceptibility to breast cancer amongst women of Chinese Han ethnicity.
2. Materials and Methods
2.1. Participants
This study enrolled 515 Chinese Han women with breast cancer (cases) presenting to Dongyang People's Hospital (Dongyang, Zhejiang, China) and 541 healthy, community-dwelling women without cancer (controls) between 2014 and 2018; all participants provided one blood sample with 3─5 mL. We also enrolled 154 untreated women scheduled for breast cancer surgery at the Affiliated Dongyang Hospital of Wenzhou Medical University (Dongyang, Zhejiang, China) between 2007 and 2017; one tissue specimen was obtained from each participant. Tumor grades were assigned using the Scarff-Bloom-Richardson system and the World Health Organization breast tumor classification criteria were used for pathohistological diagnosis [23] Cases were assigned estrogen receptor (ER), progesterone receptor (PR), human epidermal growth factor receptor 2 (HER2) and Ki-67 status and subtyped as Luminal A (ER-positive [+] and/or PR+, HER2-negative [-], Ki-67 <14%), Luminal B (ER+ and/or PR+, HER2-, Ki-67 ≥14%, ER+ and/or PR+, HER2+), HER2-enriched (ER-, PR-, HER2+), or as triple-negative breast cancer (TNBC; ER-, PR-, HER2-) [24,25,26]. Clinicopathological information was collected from electronic medical records and at study entry each study participant completed a standardized questionnaire providing sociodemographic data. The study protocol was approved by the Dongyang People's Hospital Ethics Committee and all study procedures complied with guidelines and regulations as required. All study participants supplied fully informed written consent at the time of study entry.
2.2. Genotype determination
Following the manufacturer's instructions, we used QIAamp DNA blood mini kits (Qiagen, Valencia, CA) to isolate total genomic DNA from whole blood specimens. TE buffer (1 mM EDTA and 10 mM Tris pH 7.8) was used to dissolve DNA, which was stored at -20°C until quantitative polymerase chain reaction (qPCR) analysis. Four RETN SNPs were selected for analysis (rs3745367, rs7408174, rs1862513 and rs3219175), as they have previously been found to correlate with breast cancer progression [20] SNPs were genotyped by the TaqMan SNP genotyping assay (Applied Biosystems, Warrington, UK), according to the manufacturer's protocol [27,28]. qPCRs were performed as previously described in a total volume of 20 μL containing a specific Master Mix (10 μL), probes (0.5 μL) and 10 ng of individual genomic DNA [24]. Real-time PCR was performed as previously described, including an initial denaturation step at 95°C for 10 min, then 40 amplification cycles at 95°C for 15 secs and 60°C for 1 min [24,29].
2.3. Bioinformatics analysis
Data from an independent cohort of 1,904 breast cancer samples from The Cancer Genome Atlas (TCGA) database [30] were analyzed for overall and disease-free survival using Kaplan-Meier analysis and for gene expression data using the Bioconductor edgeR package (version 3.5.1) (https://www.r-project.org/). Patient profiles that were lacking relevant information were excluded before each analysis.
Correlations between SNPs and levels of RETN expression were identified using genotype-tissue expression (GTEx) data [24, 31]. Expression of quantitative trait loci (eQTL) was analyzed to determine the functional role of phenotype-associated SNPs.
2.4. Immunohistochemistry
The Department of Pathology in Dongyang People's Hospital supplied human breast cancer tissue arrays including 154 breast cancer tissue specimens and 42 normal, cancer-free tissue specimens. Human breast cancer tissue was rehydrated and incubated with 3% hydrogen peroxide to quench endogenous peroxidase activity, then blocked by 3% BSA incubation in phosphate-buffered saline (PBS). After overnight incubation at 4°C with primary mouse anti-human resistin antibody (1:200 dilution), the tissue sections underwent 3 PBS washes and then staining with biotin-labeled secondary antibody and detection with the ABC kit (Vector Laboratories, Burlingame, CA, USA). Slides were stained with chromogen diaminobenzidine, washed, counterstained with Delafield's hematoxylin, dehydrated, treated with xylene then mounted. Two pathologists independently scored each slide for the amount of staining. Resistin expression and staining intensity were scored on a 4-point scale from 0 (no expression) to 1+ (weak), 2+ (moderate), or 3+ (strong).
2.5. Statistical analysis
Between-group differences were treated as significant when p-values were less than 0.05. The SNP genotype distributions were subjected to Chi-square testing for Hardy-Weinberg equilibrium. Demographic comparisons between cases and controls were analyzed using the Mann-Whitney U-test and Fisher's exact test. Since the data was independent and normal distribution, Fisher's exact test was used to compare differences in demographic characteristics between healthy controls and patients with breast cancer and Bonferroni's correction for multiple comparisons. Multiple logistic regression models accounting for confounding variables yielded adjusted odds ratios (AORs) and 95% confidence intervals (CIs) for associations between genotype frequencies and breast cancer or clinicopathological characteristics. All data were analyzed by the software program Statistical Product and Service Solutions (SPSS) version 19 and are indicated as the sample mean ± standard deviation (SD).
3. Results
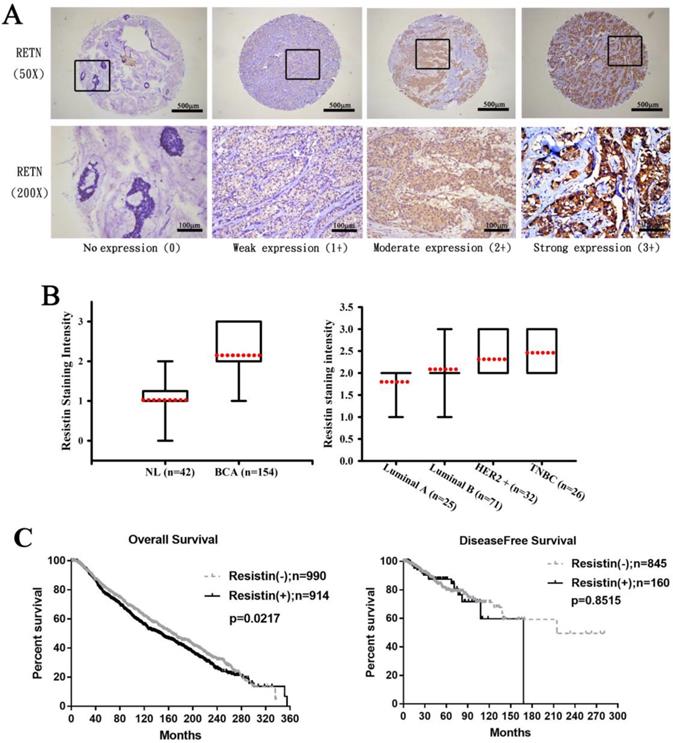
First, we analyzed clinical correlations between resistin expression and breast cancer. Immunohistochemistry (IHC) staining revealed higher resistin expression in the 154 tumor tissue specimens than in the 42 normal, healthy tissue specimens (Fig. 1A) and much stronger resistin staining in HER2+ and TNBC tumor subtypes than in luminal A and luminal B disease specimens (Fig. 1B), suggesting that resistin facilitates the progression of breast cancer. Kaplan-Meier analysis of the TCGA datasets revealed significantly poorer overall survival in the resistin-positive cohort (levels of resistin expression score of 3-4) compared to the resistin-negative group (score of 0-1); no such between-group difference was observed for disease-free survival (Fig. 1C).
Resistin expression levels in breast cancer patients. (A) Breast cancer and normal tissue specimens were analyzed by IHC staining using resistin antibody. The stained specimens were photographed using an optical microscope and scored from 0-3 for levels of resistin expression. (B) Quantitative results of resistin expression in breast cancer specimens. (C) Kaplan-Meier analysis of overall and disease-free survival were compared with the resistin-negative and resistin-positive groups using the cancer genome atlas dataset. Patients profiles that were missing relevant information were excluded before each analysis.RETN, resistin; NL, normal tissues; BCA, breast cancer tissues; HER2, human epidermal growth factor receptor 2; TNBC, triple-negative breast cancer.
All study participants were identified as Chinese Han ethnicity (Table 1). Most were nonsmokers (97.8%) and did not drink alcohol (95.9%). The mean age of the controls was significantly younger than that of the breast cancer cohort (40.47 years vs 53.11 years; p<0.05). Most patients (78%) had stage I/II breast cancer; 22% had stage III/IV disease (Table 1). Almost half (46.6%) had lymph node (N) N1-N3 metastasis. Nearly all tumors (96.9%) were classified as metastasis (M) M0 status (Table 1). Tumors were mostly ER+ (71.1%), PR+ (58.3%), or HER2- (65.4%) (Table 1).
Demographic and clinicopathological characteristics of healthy controls and patients with breast cancer.
| Variable | Controls n=541 (%) | Patients n=515 (%) | p value |
|---|---|---|---|
| Age (years) | Mean ± S.D. | Mean ± S.D. | |
| 40.47 ± 15.61 | 53.11 ± 11.64 | p < 0.05 | |
| Cigarette smoking | |||
| No | 529 (97.8) | 514 (99.8) | |
| Yes | 12 (2.2) | 1 (0.2) | p < 0.05 |
| Alcohol consumption | |||
| No | 519 (95.9) | 481 (93.4) | |
| Yes | 22 (4.1) | 34 (6.6) | p > 0.05 |
| Clinical stage | |||
| I+II | 403 (78.3) | ||
| III+IV | 112 (21.7) | ||
| Tumor size | |||
| ≤T2 | 482 (93.6) | ||
| >T2 | 33 (6.4) | ||
| Lymph node status | |||
| N0 | 275 (53.4) | ||
| N1+N2+N3 | 240 (46.6) | ||
| Distant metastasis | |||
| M0 | 499 (96.9) | ||
| M1 | 16 (3.1) | ||
| Pathological grade | |||
| I | 51 (9.9) | ||
| II | 306 (59.4) | ||
| III | 158 (30.7) | ||
| ER status | |||
| Negative | 149 (28.9) | ||
| Positive | 366 (71.1) | ||
| PR status | |||
| Negative | 215 (41.7) | ||
| Positive | 300 (58.3) | ||
| HER2 status | |||
| Negative | 337 (65.4) | ||
| Positive | 178 (34.6) | ||
| Ki-67 ≤14% | 152 (29.5) | ||
| >14% | 363 (70.5) |
The Mann-Whitney U test or Fisher's exact test was used to compare values between controls and patients with breast cancer. ER, estrogen receptor; PR, progesterone receptor; HER2, human epidermal growth factor receptor 2. Pathological grade: I, well differentiated; II, moderately differentiated; III, poorly differentiated.
Table 2 depicts polymorphism frequencies. All genotypes were in Hardy-Weinberg equilibrium (p>0.05). In cases and controls, most of those with the rs3745367 SNP were homozygous for the GG genotype, most of those with the rs7408174 SNP were homozygous for the TT genotype, most of those with the rs1862513 SNP were homozygous for CC, and most of those with the rs3219175 SNP were homozygous for GG (Table 2).
Distribution frequencies of RETN genotypes in controls and patients with breast cancer.
| Variable | Controls n=541 (%) | Patients n=515 (%) | OR (95% CI) | AOR (95% CI) |
|---|---|---|---|---|
| rs3745367 | ||||
| GG | 212 (39.2) | 184 (35.7) | 1.00 (reference) | 1.00 (reference) |
| AG | 252 (46.6) | 259 (50.3) | 1.184 (0.910-1.540) | 1.180 (0.904-1.542) |
| AA | 77 (14.2) | 72 (14.0) | 1.077 (0.739-1.571) | 1.100 (0.751-1.609) |
| AG+AA | 329 (60.8) | 331 (64.3) | 1.159 (0.903-1.488) | 1.163 (0.903-1.499) |
| G | 676 (62.5) | 627 (60.9) | 1.00 (reference) | 1.00 (reference) |
| A | 406 (37.5) | 403 (39.1) | 1.070 (0.898-1.276) | 1.080 (0.904-1.291) |
| rs7408174 | ||||
| TT | 311 (57.5) | 295 (57.3) | 1.00 (reference) | 1.00 (reference) |
| CT | 196 (36.2) | 186 (36.1) | 1.000 (0.774-1.293) | 1.005 (0.775-1.303) |
| CC | 34 (6.3) | 34 (6.6) | 1.054 (0.639-1.740) | 1.040 (0.625-1.728) |
| CT+CC | 230 (42.5) | 220 (42.7) | 1.008 (0.790-1.287) | 1.010 (0.788-1.294) |
| T | 818 (75.6) | 776 (75.3) | 1.00 (reference) | 1.00 (reference) |
| C | 264 (24.4) | 254 (24.7) | 1.014 (0.832-1.237) | 1.012 (0.828-1.238) |
| rs1862513 | ||||
| CC | 224 (41.4) | 214 (41.6) | 1.00 (reference) | 1.00 (reference) |
| CG | 241 (44.5) | 205 (39.8) | 0.890 (0.684-1.160) | 0.887 (0.677-1.160) |
| GG | 76 (14.0) | 96 (18.6) | 1.322 (0.928-1.885) | 1.363 (0.952-1.950) |
| CG+GG | 317 (58.6) | 301 (58.4) | 0.994 (0.778-1.270) | 1.003 (0.782-1.286) |
| C | 689 (63.7) | 633 (61.5) | 1.00 (reference) | 1.00 (reference) |
| G | 393 (36.3) | 397 (38.5) | 1.110 (0.922-1.312) | 1.118 (0.935-1.338) |
| rs3219175 | ||||
| GG | 316 (58.4) | 226 (43.9) | 1.00 (reference) | 1.00 (reference) |
| AG | 183 (33.8) | 277 (53.8) | 2.116 (1.643-2.726)* | 2.202 (1.701-2.851)* |
| AA | 42 (7.8) | 12 (2.3) | 0.399 (0.206-0.776)* | 0.418 (0.214-0.817)* |
| AG+AA | 225 (41.6) | 289 (56.1) | 1.796 (1.407-2.292)* | 1.869 (1.457-2.397)* |
| G | 815 (75.3) | 729 (70.8) | 1.00 (reference) | 1.00 (reference) |
| A | 267 (24.7) | 301 (29.2) | 1.260 (1.039-1.528)* | 1.295 (1.065 -1.575)* |
The odds ratios (ORs) and their associated 95% confidence intervals (CIs) were estimated by logistic regression analysis. The adjusted odds ratios (AORs) with their associated 95% CIs were estimated by multiple logistic regression analysis that controlled for alcohol consumption and age >55 years. * p < 0.05 was considered to be statistically significant.
In analyses that adjusted for confounders, study participants with the AG or the AG+AA genotype of the RETN rs3219175 polymorphism were around twice as likely to develop breast cancer as compared with those who were GG homozygous (AOR: 2.202; 95% CI: 1.701-2.243 and 1.869; 1.457-2.397, respectively; p<0.05 for both comparisons). In addition, those with the G allele of the RETN rs3219175 polymorphism were more likely than those with the A allele to develop breast cancer (AOR: 1.295; 95% CI: 1.065-1.575; p<0.05). Between-group differences were not significant for the proportions of breast cancer patients with the rs3745367, rs7408174 and rs1862513 polymorphisms, as compared with healthy controls (Table 2).
In a comparison of clinical aspects and rs7408174 RETN genotypes, patients with the CT genotype were almost twice as likely as those with the TT genotype to develop stage III/IV disease (OR: 1.725; 95% CI: 1.113-2.674), while those with at least one C allele were more likely to develop pathological grade III disease (Table 3).
Odds ratios (ORs) and 95% confidence intervals (CIs) of clinical status and RETN rs7408174 genotypic frequency in 515 patients with breast cancer.
| Gene Genotypes | Patients | OR (95% CI) | AOR (95% CI) | |
|---|---|---|---|---|
| Clinical Stage | ||||
| Stage I/II | Stage III/IV | |||
| rs7408174 | n=403 (%) | n=112 (%) | ||
| TT | 242 (60.0) | 53 (47.3) | 1.00 (reference) | 1.00 (reference) |
| CT | 135 (35.5) | 51 (45.5) | 1.725 (1.113-2.674)* | 1.715 (1.106-2.659)* |
| CC | 26 (6.5) | 8 (7.1) | 1.405 (0.603-3.275) | 1.414 (0.605-3.309) |
| CT+CC | 161 (40.0) | 59 (52.7) | 1.673 (1.098-2.549)* | 1.664 (1.092-2.537)* |
| Tumor size | ||||
| ≤T2 | >T2 | |||
| rs7408174 | n=482 (%) | n=33 (%) | ||
| TT | 278 (57.9) | 16 (48.5) | 1.00 (reference) | 1.00 (reference) |
| CT | 173 (35.9) | 13 (39.4) | 1.310 (0.615-2.791) | 1.296 (0.608-2.764) |
| CC | 30 (6.2) | 4 (12.1) | 2.325 (0.730-7.406) | 2.279 (0.713-7.284) |
| CT+CC | 203 (42.1) | 17 (51.5) | 1.460 (0.721-2.959) | 1.451 (0.716-2.943) |
| Lymph node metastasis | ||||
| N0 | N1+N2+N3 | |||
| rs7408174 | n=275 (%) | n=240 (%) | ||
| TT | 163 (59.3) | 85 (55.0) | 1.00 (reference) | 1.00 (reference) |
| CT | 90 (32.7) | 96 (40.0) | 1.317 (0.912-1.903) | 1.314 (0.908-1.900) |
| CC | 22 (8.0) | 12 (5.0) | 0.674 (0.321-1.412) | 0.672 (0.320-1.411) |
| CT+CC | 112 (40.7) | 108 (45.0) | 1.191 (0.839-1.690) | 1.184 (0.833-1.681) |
| Distant metastasis | ||||
| M0 | M1 | |||
| rs7408174 | n=499 (%) | n=16 (%) | ||
| TT | 287 (57.5) | 8 (50.0) | 1.00 (reference) | 1.00 (reference) |
| CT | 181 (36.3) | 5 (31.3) | 0.991 (0.319-3.076) | 0.986 (0.315-3.086) |
| CC | 31 (6.2) | 3 (18.7) | 3.472 (0.875-13.768) | 3.241 (0.807-13.026) |
| CT+CC | 212 (42.5) | 8 (50.0) | 1.354 (0.500-3.665) | 1.332 (0.488-3.637) |
| Pathological grade | ||||
| I+II | III | |||
| rs7408174 | n=357 (%) | n=158 (%) | ||
| TT | 215 (60.2) | 80 (50.6) | 1.00 (reference) | 1.00 (reference) |
| CT | 125 (35.0) | 61 (38.6) | 1.312 (0.880-1.956) | 1.322 (0.886-1.972) |
| CC | 17 (4.8) | 17 (10.8) | 2.688 (1.309-5.519)* | 2.759 (1.339-5.685)* |
| CT+CC | 142 (39.8) | 78 (49.4) | 1.476 (1.012-2.152)* | 1.484 (1.017-2.164)* |
The ORs with their 95% CIs were estimated by logistic regression models. The adjusted odds ratios (AORs) with their 95% CIs were estimated by multiple logistic regression models that controlled for alcohol consumption and age. * p < 0.05 was considered to be statistically significant. Pathological grade: I, well differentiated; II, moderately differentiated; III, poorly differentiated.
When we analyzed the clinical aspects of rs7408174 and rs3219175 RETN genotypic frequencies among breast cancer subtypes, we found that among patients with the luminal A subtype, those carrying the CT genotype at SNP rs7408174 were much more likely than TT genotype carriers to develop stage III/IV disease and pathological grade II and III disease (OR: 3.084; 95% CI: 1.146-8.299 and 3.983; 1.531-10.362, respectively) (Table 4). In an analysis of resistin expression and clinical status in breast cancer tissue samples, high BMI (>24 kg/m2) and resistin positivity was associated with a 5-fold higher likelihood of pathological grade III disease as compared with resistin negativity (OR: 5.020; 95% CI: 1.380-18.259) (Table 5).
Odds ratios (ORs) and 95% confidence interval (CIs) of RETN genotypic frequencies and clinical subtypes in patients with breast cancer.
| Variable | Luminal A (n=143) | Luminal B (n=224) | HER2 overexpression (n=80) | TNBC (n=68) | ||||||||
|---|---|---|---|---|---|---|---|---|---|---|---|---|
| Clinical stage | OR (95% CI) | Clinical stage | OR (95% CI) | Clinical stage | OR (95% CI) | Clinical stage | OR (95% CI) | |||||
| Stage I/II | Stage III/IV | Stage I/II | Stage III/IV | Stage I/II | Stage III/IV | Stage I/II | Stage III/IV | |||||
| rs7408174 | N=123(%) | N=20(%) | N=169(%) | N=55(%) | N=55(%) | N=25(%) | N=56(%) | N=12(%) | ||||
| TT | 83 (67.5) | 8 (40.0) | 1.00 (reference) | 102 (60.4) | 28 (50.9) | 1.00 (reference) | 31 (56.4) | 12 (48.0) | 1.00 (reference) | 26 (46.4) | 5 (41.7) | 1.00 (reference) |
| CT | 37 (30.1) | 11 (55.0) | 3.084 (1.146-8.299)* | 57 (33.7) | 23 (41.8) | 1.470 (0.775-2.787) | 17 (30.9) | 10 (40.0) | 1.520 (0.544-4.243) | 24 (34.4) | 7 (58.3) | 1.517 (0.424-5.426) |
| CC | 3 (2.4) | 1 (5.0) | 3.458 (0.321-37.242) | 10 (5.9) | 4 (7.3) | 1.457 (0.425-4.998) | 7 (12.7) | 3 (12.0) | 1.107 (0.245-5.000) | 6 (10.7) | 0 (0) | — |
| CT+CC | 40 (32.5) | 12 (60.0) | 3.113 (1.179-8.218)* | 67 (39.6) | 16 (49.1) | 1.468 (0.796-2.707) | 24 (43.6) | 13 (52.0) | 1.399 (0.542-3.613) | 30 (53.6) | 7 (58.3) | 1.213 (0.343-4.286) |
| Tumor size | OR (95% CI) | Tumor size | OR (95% CI) | Tumor size | OR (95% CI) | Tumor size | OR (95% CI) | |||||
| ≦T2 | > T2 | ≦T2 | > T2 | ≦T2 | > T2 | ≦T2 | > T2 | |||||
| rs7408174 | N=140(%) | N=3(%) | N=208(%) | N=16(%) | N=71(%) | N=9(%) | N=63(%) | N=5(%) | ||||
| TT | 90 (64.3) | 1 (33.3) | 1.00 (reference) | 122 (58.7) | 8 (50.0) | 1.00 (reference) | 38 (53.5) | 5 (55.6) | 1.00 (reference) | 29 (46.0) | 2 (40.0) | 1.00 (reference) |
| CT | 46 (32.9) | 2 (66.7) | 3.913 (0.346-44.297) | 74 (35.6) | 6 (37.5) | 1.236 (0.413-3.704) | 25 (35.2) | 2 (22.2) | 0.608 (0.109-3.381) | 28 (44.4) | 3 (60.0) | 1.554 (0.241-10.010) |
| CC | 4 (2.9) | 0 (0) | — | 12 (5.7) | 2 (12.5) | 2.542 (0.484-13.355) | 8 (11.3) | 2 (22.2) | 1.900 (0.311-11.591) | 6 (9.6) | 0 (0) | — |
| CG+GG | 50 (35.7) | 2 (66.7) | 3.600 (0.318-40.697) | 86 (41.3) | 8 (50.0) | 1.419 (0.513-3.927) | 30 (58.8) | 4 (44.4) | 0.921 (0.228-3.717) | 34 (54.0) | 3 (60.0) | 1.279 (0.200-8.190) |
| Lymph node status | OR (95% CI) | Lymph node status | OR (95% CI) | Lymph node status | OR (95% CI) | Lymph node status | OR (95% CI) | |||||
| N0 | N1-N3 | N0 | N1-N3 | N0 | N1-N3 | N0 | N1-N3 | |||||
| rs7408174 | N=91(%) | N=52(%) | N=111(%) | N=113(%) | N=35(%) | N=45(%) | N=38(%) | N=30(%) | ||||
| TT | 61 (67.0) | 30 (57.7) | 1.00 (reference) | 67 (60.4) | 63 (55.8) | 1.00 (reference) | 20 (57.1) | 23 (51.1) | 1.00 (reference) | 15 (39.5) | 16 (53.3) | 1.00 (reference) |
| CT | 27 (29.7) | 21 (40.4) | 1.581 (0.771-3.244) | 35 (31.5) | 45 (39.8) | 1.367 (0.781-2.393) | 11 (31.4) | 16 (35.6) | 1.265 (0.478-3.349) | 17 (44.7) | 14 (46.7) | 0.772 (0.285-2.095) |
| CC | 3 (3.3) | 1 (1.9) | 0.678 (0.068-6.794) | 9 (8.1) | 5 (4.4) | 0.591 (0.188-1.859) | 4 (11.5) | 6 (13.3) | 1.304 (0.322-5.289) | 6 (15.8) | 0 (0) | — |
| CG+GG | 30 (33.0) | 22 (42.3) | 1.491 (0.739-3.011) | 44 (39.6) | 49 (44.2) | 1.209 (0.710-2.056) | 15 (42.9) | 22 (48.9) | 1.275 (0.524-3.102) | 23 (60.5) | 14 (46.7) | 0.571 (0.217-1.503) |
| Distant metastasis | OR (95% CI) | Distant metastasis | OR (95% CI) | Distant metastasis | OR (95% CI) | Distant metastasis | OR (95% CI) | |||||
| M0 | M1 | M0 | M1 | M0 | M1 | M0 | M1 | |||||
| rs7408174 | N=141(%) | N=2(%) | N=219(%) | N=5(%) | N=75(%) | N=5(%) | N=64(%) | N=4(%) | ||||
| TT | 90 (63.8) | 1 (50.0) | 1.00 (reference) | 127 (58.0) | 3 (60.0) | 1.00 (reference) | 42 (56.0) | 1 (20.0) | 1.00 (reference) | 28 (43.8) | 3 (75.0) | 1.00 (reference) |
| CT | 47 (33.3) | 1 (50.0) | 1.915 (0.117-31.306) | 79 (36.1) | 1 (20.0) | 0.536 (0.055-5.242) | 25 (33.3) | 2 (40.0) | 3.360 (0.290-38.975) | 30 (46.9) | 1 (25.0) | 0.311 (0.031-3.169) |
| CC | 4 (2.8) | 0 (0) | — | 13 (5.9) | 1 (20.0) | 3.256 (0.316-33.604) | 8 (10.7) | 2 (40.0) | 10.500 (0.848-130.072) | 6 (9.3) | 0 (0) | — |
| CG+GG | 51 (36.2) | 1 (50.0) | 1.765 (0.108-28.818) | 92 (42.0) | 2 (40.0) | 0.920 (0.151-5.619) | 33 (44.0) | 4 (80.0) | 5.091 (0.543-47.736) | 36 (56.2) | 1 (25.0) | 0.259 (0.026-2.629) |
| Pathologic grade | OR (95% CI) | Pathologic grade | OR (95% CI) | Pathologic grade | OR (95% CI) | Pathologic grade | OR (95% CI) | |||||
| I | II+III | I | II+III | I | II+III | I | II+III | |||||
| rs7408174 | N=41(%) | N=102(%) | N=7(%) | N=217(%) | N=2(%) | N=78(%) | N=1(%) | N=67(%) | ||||
| TT | 33 (80.5) | 58 (56.9) | 1.00 (reference) | 5 (71.4) | 125 (57.6) | 1.00 (reference) | 1 (50.0) | 42 (53.8) | 1.00 (reference) | 0 (0) | 31 (46.3) | 1.00 (reference) |
| CT | 6 (14.6) | 42 (41.1) | 3.983 (1.531-10.362)* | 22 (28.6) | 78 (35.9) | 1.560 (0.295-8.238) | 1 (50.0) | 26 (33.3) | 0.619 (0.037-10.330) | 1 (100.0) | 30 (44.7) | — |
| CC | 2 (4.9) | 2 (2.0) | 0.569 (0.077-4.229) | 0 (0) | 14 (6.5) | — | 0 (0) | 10 (12.8) | — | 0 (0) | 6 (9.0) | — |
| CT+CC | 8 (19.5) | 44 (43.1) | 3.129 (1.316-7.440)* | 22 (28.6) | 92 (42.4) | 1.840 (0.349-9.694) | 1 (50.0) | 36 (46.2) | 0.857 (0.052-14.199) | 1 (100.0) | 36 (53.7) | — |
The ORs and their associated 95% CIs were estimated by logistic regression models. * p < 0.05 was considered to be statistically significant. HER2, human epidermal growth factor receptor 2; TNBC, triple-negative breast cancer. Pathological grade: I, well differentiated; II, moderately differentiated; III, poorly differentiated.
Comparison of the clinical parameters and resistin expression in 154 breast cancer tissue samples.
| Parameter | Resistin-negativea n=17 (%) | Resistin-positiveb n=137 (%) | OR (95% CI) |
|---|---|---|---|
| BMI | |||
| 23.07 ± 2.42 | 24.19 ± 3.07 | ||
| Clinical stage | |||
| I+II | 9 (52.9) | 103 (75.2) | |
| III+IV | 8 (47.1) | 34 (24.8) | 0.371 (0.133-1.038) |
| Pathological grade | |||
| I+II | 14 (82.4) | 66 (48.2) | |
| III | 3 (17.6) | 71 (51.8) | 5.020 (1.380-18.259)* |
a Resistin-negative status was scored as 0 or 1; b Resistin-positive status was scored as 2 or 3. The odds ratios (ORs) and their associated 95% confidence intervals (CIs) were estimated by logistic regression models. *p < 0.05. BMI, body mass index.
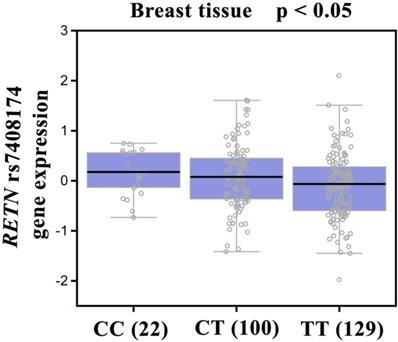
Our analysis of GTEx data revealed that individuals carrying the CC genotype of SNP rs7408174 showed a trend for increased resistin expression, compared with patients who had the wild-type TT homozygous genotype (p<0.05; Fig. 2).
Correlation of rs7408174 genotype with RETN mRNA expression in breast cancer tissues in the Genotype-Tissue Expression (GTEx) dataset.
4. Discussion
Not only is the adipokine resistin associated with obesity, inflammation, and various cancers [32,33,34], but high serum resistin levels have been implicated in the pathogenesis of cachexia in lung cancer [35], while resistin overexpression or upregulation is a feature of several human cancers, including oral cancer, renal cell carcinoma, chondrosarcoma and colon cancer [36,37,38,39]. Notably, resistin helps to promote tumor growth, drug resistance and metastasis in breast cancer [40,41,42]. A mechanical study has recently demonstrated the effect of resistin on epithelial to mesenchymal transition and stemness in breast cancer cells, which might be regulated by cyclase-associated protein 1 (CAP1) [43]. Our IHC results confirmed higher levels of resistin expression in breast cancer specimens than in samples from cancer-free tissue and we found stronger resistin staining in tissue samples representing HER2+ and TNBC disease than in samples from luminal A and luminal B disease, while our analysis of TCGA data revealed significantly poorer overall survival in resistin-positive tissue compared to resistin-negative samples. Notably, inhibition of resistin reduces chondrosarcoma metastasis and lymphangiogenesis [32,36]. Thus, the data suggest that therapeutic strategies that effectively inhibit resistin could be useful in breast cancer.
The prognosis of breast cancer patients depends on the clinical or pathological stage at diagnosis. Thus, individuals with hereditary breast cancer could benefit from epigenetic screening for early diagnosis and treatment that prevents the disease from developing. RETN polymorphisms have been identified in various cancers, including colon and lung [16,20,21], but data are scant as to the involvement of RETN polymorphisms in breast cancer. As far as we are aware, our study is the first to investigate the distributions of the rs3745367, rs7408174, rs1862513 and rs3219175 SNPs and their associations with the development and progression of breast cancer in Chinese Han women. Here, we found that women carrying the GG genotype of the RETN rs3219175 polymorphism were more likely than those with GG homozygotes to develop breast cancer, while those carrying at least one A allele in rs3219175 compared with carriers of wild-type GG homozygotes were at increased risk for breast cancer. Our previous study has reported SNP rs3219175 and rs7408174 at greater risk of developing RA disease [44], and the effects of these variants on resistin expression require to be further examined in breast cancer cells in the future. A previous study has reported that the rs1862513 SNP in RETN increased breast cancer risk and a tendency for luminal breast tumors in Mexican women, which divided into different subtypes according to BMI [45]. It was similar to our results but we separated different subtypes of breast cancer patients based on their clinical pathohistological diagnosis, and we could further considered BMI variable and metastatic gene CAP1 in our future study. This evidence implicates critical roles for resistin and RETN polymorphisms in breast cancer.
Between 2010 and 2014, 5-year relative survival rates for breast cancer were ~90.2% in the USA [46] and ~80% in China [47]. As the prognosis of breast cancer patients depends on their clinical and pathological status at diagnosis, early diagnosis is essential and is becoming ever more possible with improvements in screening strategies and the wider availability of epigenetic strategies [48, 49]. We investigated possible associations between RETN polymorphisms, clinical and pathological markers, and susceptibility to breast cancer. We found that individuals carrying the CT genotype at the rs7408174 polymorphism were more likely to progress to late-stage disease. Carriers of at least one C allele at rs7408174 had a higher risk of developing stage III/IV disease and of developing highly pathological grade III disease. Similarly, among those with luminal A breast cancer, having the CT genotype at SNP rs7408174 was linked to a risk of stage III/IV disease and pathological grade III disease. The SNP rs3219175 had no significance in the clinical status of breast cancer patients (data not shown). Our results also revealed that high BMI (>24 kg/m2) in the resistin-positive cohort increased the risk of pathological grade III disease. Our findings contribute to data concerning the correlation between resistin and breast cancer development. In addition, no significant patterns of linkage disequilibrium were observed in any of the RETN genotypes analysed from breast cancer patients (Supplementary Fig. S1).
It is established that gene expression can be controlled by polymorphisms that appear in the 3ʹ-flanking region [50]. According to the evidence from the GTEx database, the CC genotype at rs7408174 showed a trend for increased expression of resistin, compared with levels of resistin expression found in individuals with wild-type TT homozygous genotypes. This result confirms our SNP data and indicates that RETN SNPs rs7408174 and rs3219175 SNPs may control resistin expression.
In conclusion, our investigation demonstrates an association between RETN gene variants and susceptibility for breast cancer and its progression among Chinese Han women carrying the RETN rs3219175 and rs7408174 polymorphisms. We also identified high levels of resistin expression in breast cancer patients. Resistin appears to be a predictive marker for breast cancer treatment.
Supplementary Material
Supplementary figure S1.
Acknowledgements
We thank Iona J. MacDonald for her English language editing of this manuscript.
Funding
This work was supported by grants from National Natural Science Foundation of China (No. 81802660), Taiwan's Ministry of Science and Technology (MOST 108-2320-B-039-066-MY2) and China Medical University Hospital (DMR-109-158).
Competing Interests
The authors have declared that no competing interest exists.
References
1. Bray F, Ferlay J, Soerjomataram I. et al. Global cancer statistics 2018: GLOBOCAN estimates of incidence and mortality worldwide for 36 cancers in 185 countries. CA Cancer J Clin. 2018;68:394-424
2. Amir E, Freedman OC, Seruga B. et al. Assessing women at high risk of breast cancer: a review of risk assessment models. Journal of the National Cancer Institute. 2010;102:680-91
3. Shen CC, Yang AC, Hung JH. et al. A nationwide population-based retrospective cohort study of the risk of uterine, ovarian and breast cancer in women with polycystic ovary syndrome. The oncologist. 2015;20:45-9
4. Deng Y, Xu H, Zeng X. Induced abortion and breast cancer: An updated meta-analysis. Medicine. 2018;97:e9613
5. Yang MD, Lin KC, Lu MC. et al. Contribution of matrix metalloproteinases-1 genotypes to gastric cancer susceptibility in Taiwan. BioMedicine. 2017;7:10
6. Chen CM, Lai CH, Wu HJ. et al. Genetic characteristic of class 1 integrons in proteus mirabilis isolates from urine samples. BioMedicine. 2017;7:9
7. Chang WS, Liu LC, Hsiao CL. et al. The contributions of the tissue inhibitor of metalloproteinase-1 genotypes to triple negative breast cancer risk. BioMedicine. 2016;6:4
8. Nagy R, Sweet K, Eng C. Highly penetrant hereditary cancer syndromes. Oncogene. 2004;23:6445-70
9. Antoniou AC, Pharoah PD, Narod S. et al. Breast and ovarian cancer risks to carriers of the BRCA1 5382insC and 185delAG and BRCA2 6174delT mutations: a combined analysis of 22 population based studies. Journal of medical genetics. 2005;42:602-3
10. Wang CQ, Tang CH, Wang Y. et al. FSCN1 gene polymorphisms: biomarkers for the development and progression of breast cancer. Scientific reports. 2017;7:15887
11. Huang BF, Tzeng HE, Chen PC. et al. HMGB1 genetic polymorphisms are biomarkers for the development and progression of breast cancer. Int J Med Sci. 2018;15:580-586
12. Steppan CM, Bailey ST, Bhat S. et al. The hormone resistin links obesity to diabetes. Nature. 2001;409:307-12
13. Reilly MP, Lehrke M, Wolfe ML. et al. Resistin is an inflammatory marker of atherosclerosis in humans. Circulation. 2005;111:932-9
14. Steppan CM, Brown EJ, Wright CM. et al. A family of tissue-specific resistin-like molecules. Proc Natl Acad Sci U S A. 2001;98:502-6
15. Kumar S, Gupta V, Srivastava N. et al. Resistin 420C/G gene polymorphism on circulating resistin, metabolic risk factors and insulin resistance in adult women. Immunol Lett. 2014;162:287-91
16. Alharithy RN. Polymorphisms in RETN gene and susceptibility to colon cancer in Saudi patients. Ann Saudi Med. 2014;34:334-9
17. Chung CM, Lin TH, Chen JW. et al. Common quantitative trait locus downstream of RETN gene identified by genome-wide association study is associated with risk of type 2 diabetes mellitus in Han Chinese: a Mendelian randomization effect. Diabetes Metab Res Rev. 2014;30:232-40
18. Rathwa N, Patel R, Palit SP. et al. Genetic variants of resistin and its plasma levels: Association with obesity and dyslipidemia related to type 2 diabetes susceptibility. Genomics. 2019;111:980-985
19. Zayani N, Hamdouni H, Boumaiza I. et al. Resistin polymorphims, plasma resistin levels and obesity in Tunisian volunteers. J Clin Lab Anal. 2018:32
20. Hu WW, Tang CH, Sun Y. et al. Correlation between resistin gene polymorphism and clinical aspects of lung cancer. Medicine (Baltimore). 2017;96:e9485
21. Vallega KA, Liu N, Myers JS. et al. Elevated Resistin Gene Expression in African American Estrogen and Progesterone Receptor Negative Breast Cancer. PLoS One. 2016;11:e0157741
22. Urbanek M, Du Y, Silander K. et al. Variation in resistin gene promoter not associated with polycystic ovary syndrome. Diabetes. 2003;52:214-7
23. Tan PH, Schnitt SJ, van de Vijver MJ. et al. Papillary and neuroendocrine breast lesions: the WHO stance. Histopathology. 2015;66:761-70
24. Wang CQ, Tang CH, Wang Y. et al. FSCN1 gene polymorphisms: biomarkers for the development and progression of breast cancer. Sci Rep. 2017;7:15887
25. Wang CQ, Li Y, Huang BF. et al. EGFR conjunct FSCN1 as a Novel Therapeutic Strategy in Triple-Negative Breast Cancer. Sci Rep. 2017;7:15654
26. Wang CQ, Tang CH, Chang HT. et al. Fascin-1 as a novel diagnostic marker of triple-negative breast cancer. Cancer Med. 2016;5:1983-8
27. Lin YJ, Ho TJ, Lin TH. et al. P-coumaric acid regulates exon 12 splicing of the ATP7B gene by modulating hnRNP A1 protein expressions. Biomedicine (Taipei). 2015;5:10
28. Li TC, Li CI, Liao LN. et al. Associations of EDNRA and EDN1 polymorphisms with carotid intima media thickness through interactions with gender, regular exercise, and obesity in subjects in Taiwan: Taichung Community Health Study (TCHS). Biomedicine (Taipei). 2015;5:8
29. Hu W, Liu PY, Yang YC. et al. Association of HMGB1 Gene Polymorphisms with Lung Cancer Susceptibility and Clinical Aspects. Int J Med Sci. 2017;14:1197-1202
30. Razavi P, Chang MT, Xu G. et al. The Genomic Landscape of Endocrine-Resistant Advanced Breast Cancers. Cancer Cell. 2018;34:427-438 e6
31. Consortium GT. The Genotype-Tissue Expression (GTEx) project. Nat Genet. 2013;45:580-5
32. Tsai CH, Tsai HC, Huang HN. et al. Resistin promotes tumor metastasis by down-regulation of miR-519d through the AMPK/p38 signaling pathway in human chondrosarcoma cells. Oncotarget. 2015;6:258-70
33. Su CM, Hsu CJ, Tsai CH. et al. Resistin Promotes Angiogenesis in Endothelial Progenitor Cells Through Inhibition of MicroRNA206: Potential Implications for Rheumatoid Arthritis. Stem Cells. 2015;33:2243-55
34. Su CM, Huang CY, Tang CH. Characteristics of resistin in rheumatoid arthritis angiogenesis. Biomark Med. 2016;10:651-60
35. Demiray G, Degirmencioglu S, Ugurlu E. et al. Effects of Serum Leptin and Resistin Levels on Cancer Cachexia in Patients With Advanced-Stage Non-Small Cell Lung Cancer. Clin Med Insights Oncol. 2017;11:1179554917690144
36. Su CM, Tang CH, Chi MJ. et al. Resistin facilitates VEGF-C-associated lymphangiogenesis by inhibiting miR-186 in human chondrosarcoma cells. Biochem Pharmacol. 2018;154:234-242
37. Zhang HP, Zou J, Xu ZQ. et al. Association of leptin, visfatin, apelin, resistin and adiponectin with clear cell renal cell carcinoma. Oncol Lett. 2017;13:463-468
38. Singh S, Chouhan S, Mohammad N. et al. Resistin causes G1 arrest in colon cancer cells through upregulation of SOCS3. FEBS Lett. 2017;591:1371-1382
39. Wu CC, Chu HW, Hsu CW. et al. Saliva proteome profiling reveals potential salivary biomarkers for detection of oral cavity squamous cell carcinoma. Proteomics. 2015;15:3394-404
40. Wang CH, Wang PJ, Hsieh YC. et al. Resistin facilitates breast cancer progression via TLR4-mediated induction of mesenchymal phenotypes and stemness properties. Oncogene. 2018;37:589-600
41. Liu Z, Shi A, Song D. et al. Resistin confers resistance to doxorubicin-induced apoptosis in human breast cancer cells through autophagy induction. Am J Cancer Res. 2017;7:574-583
42. Lee JO, Kim N, Lee HJ. et al. Resistin, a fat-derived secretory factor, promotes metastasis of MDA-MB-231 human breast cancer cells through ERM activation. Sci Rep. 2016;6:18923
43. Avtanski D, Garcia A, Caraballo B. et al. Resistin induces breast cancer cells epithelial to mesenchymal transition (EMT) and stemness through both adenylyl cyclase-associated protein 1 (CAP1)-dependent and CAP1-independent mechanisms. Cytokine. 2019;120:155-164
44. Wang L, Tang CH, Lu T. et al. Resistin polymorphisms are associated with rheumatoid arthritis susceptibility in Chinese Han subjects. Medicine (Baltimore). 2018;97:e0177
45. Munoz-Palomeque A, Guerrero-Ramirez MA, Rubio-Chavez LA. et al. Association of RETN and CAP1 SNPs, Expression and Serum Resistin Levels with Breast Cancer in Mexican Women. Genet Test Mol Biomarkers. 2018;22:209-217
46. Allemani C, Matsuda T, Di Carlo V. et al. Global surveillance of trends in cancer survival 2000-14 (CONCORD-3): analysis of individual records for 37 513 025 patients diagnosed with one of 18 cancers from 322 population-based registries in 71 countries. Lancet. 2018;391:1023-1075
47. Li T, Mello-Thoms C, Brennan PC. Descriptive epidemiology of breast cancer in China: incidence, mortality, survival and prevalence. Breast Cancer Res Treat. 2016;159:395-406
48. Wood DE. National Comprehensive Cancer Network (NCCN) Clinical Practice Guidelines for Lung Cancer Screening. Thoracic surgery clinics. 2015;25:185-97
49. Moyer VA. Medications to decrease the risk for breast cancer in women: recommendations from the U.S. Preventive Services Task Force recommendation statement. Annals of internal medicine. 2013;159:698-708
50. Duan ZX, Zhu PF, Dong H. et al. Functional significance of the TLR4/11367 polymorphism identified in Chinese Han population. Shock. 2007;28:160-4
Author contact
![]() Corresponding authors: Chen-Ming Su, PhD; Department of Sports Medicine, China Medical University, Taichung, Taiwan. E-mail: proof814com、cmsucmu.edu.tw. Hong Chuan Jin, PhD; Laboratory of Cancer Biology, Key Laboratory of Biotherapy in Zhejiang Province, Sir Run Run Shaw Hospital, Medical School of Zhejiang University, Hangzhou, China. E-mail: jinhcedu.cn
Corresponding authors: Chen-Ming Su, PhD; Department of Sports Medicine, China Medical University, Taichung, Taiwan. E-mail: proof814com、cmsucmu.edu.tw. Hong Chuan Jin, PhD; Laboratory of Cancer Biology, Key Laboratory of Biotherapy in Zhejiang Province, Sir Run Run Shaw Hospital, Medical School of Zhejiang University, Hangzhou, China. E-mail: jinhcedu.cn