Impact Factor ISSN: 1837-9664

 Global reach, higher impact
J Cancer 2020; 11(9):2540-2551. doi:10.7150/jca.37604 This issue Cite
Review
Application of metabolomics in the diagnosis of breast cancer: a systematic review
Liqing Yang1, Ying Wang1, Haishan Cai1, Shuang Wang1, Yueping Shen2, Chaofu Ke2 ![]()
1. Medical College of Soochow University, Suzhou 215123, P. R. China.
2. Department of Epidemiology and Biostatistics, School of Public Health, Medical College of Soochow University, 199 Renai Road, Suzhou 215123, P. R. China.
Received 2019-6-14; Accepted 2019-12-31; Published 2020-2-10
Abstract
Breast cancer (BC) remains the most frequent type of cancer in females worldwide. However, the pathogenesis of BC is still under the cloud, along with the huge challenge of early diagnosis, which is widely acknowledged as the key to a successful therapy. Metabolomics, a newborn innovative technique in recent years, has demonstrated great potential in cancer-related researches. The aim of this review is to look back on clinical and cellular metabolomic studies in the diagnosis of BC over the past decade, and provide a systematic summary of metabolic biomarkers and pathways related to BC diagnosis.
Keywords: Breast Cancer, Metabolomics, Diagnosis
1. Introduction
Breast cancer (BC) has become the most common cancer in women globally, accounting for nearly 2.1 million newly diagnosed cases in 2018 based on the data from Globocan [1]. Previous researches have evidenced that early diagnosis and timely treatment of BC would exert a significant effect on improving the prognosis of BC patients [2]. As the most widely used tumor markers for BC, neither CA 15-3 nor CEA have satisfactory sensitivities and specificities for early diagnosis [3]. Although annual digital mammography (DM) has been regarded as an effective way to reduce the mortality of BC in age-appropriate asymptomatic women, the sensitivity tends to depend on tissue density and tumor growth patterns [4]. Recent studies indicated that the digital breast tomosynthesis (DBT) might have the potential to replace DM in the early detection of BC, with a preponderance of sensitivity in dense breast to some extent, but an overview of these small-scale evidences came to a conclusion that it is still insufficient to confirm a shift from DBT to DM [5]. Therefore, novel effective and convenient methods for early diagnosis of BC are urgently needed.
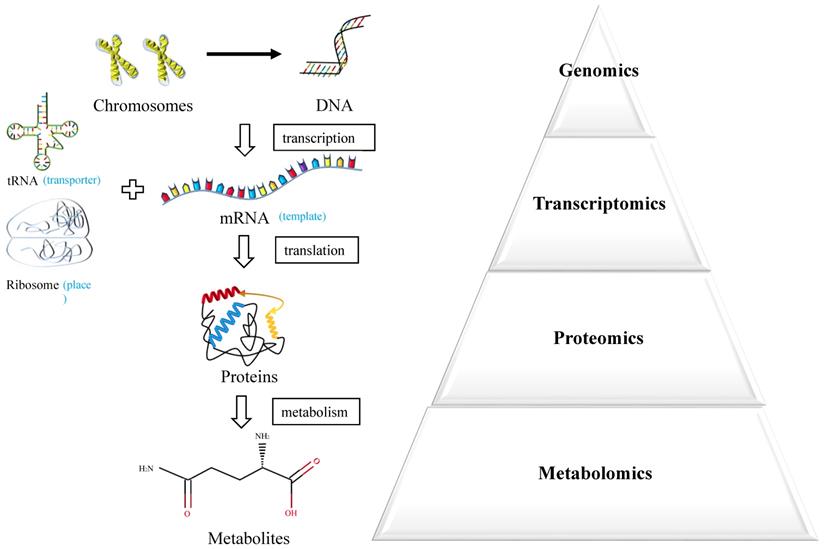
Metabolomics is an emerging powerful technique measuring endogenous metabolic substances in response to internal and external changes of the whole body [6] (Figure 1). The molecules produced by cancer cells during their growth could enter into the urine, blood or tissue, which underlies the potential to discover valuable biomarkers for early diagnosis [7]. In recent years, the technique of metabolomics has been widely used in the discovery of biomarkers in various cancers and served as an effective approach for personalized medicine.
Systems biology approaches.
In this study, we performed a systematic review about the clinical and cellular metabolomic researches in the diagnosis of BC over the past decade, pursuing an overall perspective over the potential application of metabolomics in the diagnosis of BC and discovery of reliable metabolic biomarkers and pathways for BC.
2. Materials and Methods
2.1 Literature Searching
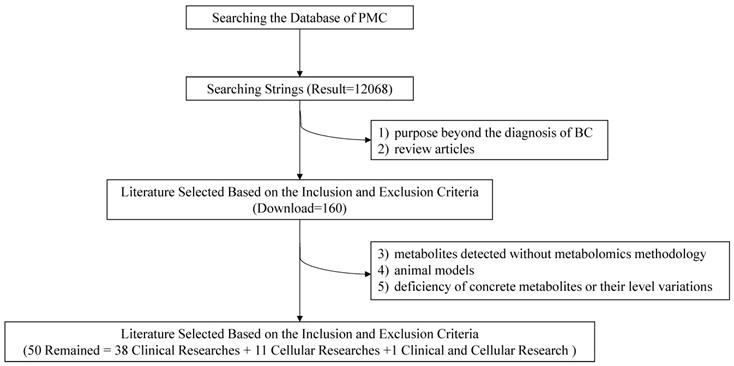
Researchers conducted an advanced retrieval on the PMC platform with the following searching strings: (“metabolomics” OR “metabolic profiling” OR “metabolic profiles” OR “metabolic biomarkers” OR “metabolome” OR “metabolic protraits”) AND (“breast” OR “mammary”) AND (“tumor” OR “tumour” OR “cancer” OR “carcinoma” OR “neoplasm”). Literatures published between 2008/01/01 and 2019/08/01 were included in the index, with a result of 12068 records. Two researchers searched the articles independently and the third one made the final decision if necessary.
2.2 Inclusion and Exclusion Criteria
To lower the missing rate of targeted records, relevant metabolomic studies were all included except the following: 1) purposes beyond the diagnosis of BC; 2) review articles; 3) metabolites detected without metabolomics methodology; 4) animal models; 5) deficiency of concrete metabolites or their level variations. Eventually, 50 items including 38 clinical researches, 11 cellular researches and 1 clinical and cellular research were remained with required information recorded (Figure 2).
Flow chart of the literature search and selection.
2.3 Data Extraction
Information from selected literatures was extracted as followed.
1) Title, first author and publication year;
2) Purpose, study subjects (case and control) and analytical techniques;
3) The significant metabolites with changing trends.
2.4 Statistical Analysis
Frequencies on detecting instruments, biological specimens, sample sizes, study designs and repeatedly reported biomarkers were counted and graphed. The pathway analysis of metabolite markers in BC, including enrichment analysis and pathway topology analysis, was performed using the online software of Metaboanalyst (http://www.metaboanalyst.ca/).
3. Results
3.1 Clinical Researches
3.1.1 Study Characteristics
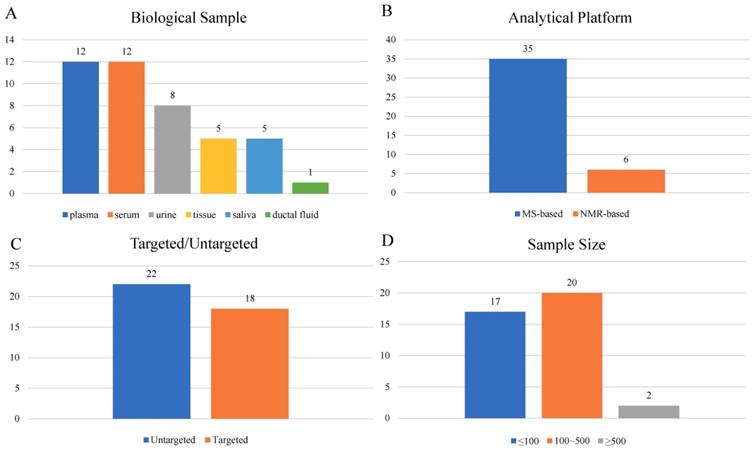
A total of 39 articles[8-46] were included in the final analysis (Supplementary Table S1), among which 22 studies were performed with blood (serum or plasma), 8 with urine, 5 with tissue, 5 with saliva and 1 with ductal fluid (Figure 3A). Mass-spectrometry based metabolomics studies reached 35 articles, while NMR was adopted in 6 studies (Figure 3B). Eighteen studies were targeted, and the other 22 studies were untargeted (Figure 3C). Study sample sizes summing the case and control varied from 3 to 1172, with only 2 studies bigger than 500 (Figure 3D).
Characteristics of clinical studies.
3.1.2 Analysis of High Frequency Metabolic Biomarkers
In all, 492 metabolite markers mentioned in these diagnosis-related studies were recorded. Table 1 summarized 33 metabolic biomarkers with high frequency (reported in ≥ 3 studies). Tyrosine has the highest frequency with 12 hits in total, followed by alanine reported with 11 hits. In studies focusing on the tissue [16, 18, 36, 37, 40], most significant metabolites tended to be up-regulated except glucose. Notably, changes of some fatty acids like palmitic acid, linoleic acid and stearic acid were consistently increased in the blood.
High frequency clinical metabolic biomarkers related to BC diagnosis
| No. | Metabolites | Hits | Changing Direction in BC | |
|---|---|---|---|---|
| up | down | |||
| 1 | Tyrosine | 12 | 6 serum[15, 27], plasma[17], tissue[18], saliva[42], urine[46] | 6 plasma[9, 34, 41], serum[14, 18, 23] |
| 2 | Alanine | 11 | 6 saliva[11, 42], serum[15], plasma[21, 41], urine[43] | 5 plasma[9, 34], serum[14], urine[22], serum&plasma[30] |
| 3 | Glutamic acid | 10 | 6 serum[15], tissue[16,18], plasma[21], saliva[17,42] | 4 plasma[9], serum[14], urine[22], serum&plasma[32] |
| 4 | Valine | 10 | 4 saliva[11, 42], serum[15], plasma[21] | 6 plasma[9, 17, 24, 34], serum[14], urine[22] |
| 5 | Phenylalanine | 9 | 5 serum[15], tissue[18], saliva[26, 42], urine[46] | 4 plasma[9, 34, 41], serum[18] |
| 6 | Glutamine | 9 | 4 saliva[11], serum[15],tissue[18], serum&plasma[32] | 5 plasma[12, 17, 24, 41] serum[14] |
| 7 | Lysine | 9 | 3 plasma[17, 41], saliva[42] | 6 plasma[9, 12, 24], serum[14, 23, 27] |
| 8 | Isoleucine | 8 | 4 saliva[11], serum[15], plasma[21], urine[43] | 4 serum[14], plasma[17, 34], serum&plasma[32] |
| 9 | Histidine | 7 | 3 serum[15], tissue[18], saliva[26] | 4 serum[14, 23, 27], plasma[41] |
| 10 | Choline | 7 | 3 saliva[11], plasma[12], tissue[36] | 4 serum[23], serum&plasma[30, 32], plasma[34] |
| 11 | Glycine | 6 | 4 serum[15], tissue[37], plasma[41] , saliva[42] | 2 urine[22], serum&plasma[30] |
| 12 | Arginine | 6 | 3 serum[10], saliva[11], plasma[17] | 3 serum[14, 15], plasma[24] |
| 13 | Asparagine | 6 | 4 plasma[13], serum[15], serum&plasma[32], urine[43] | 2 plasma[9], serum[27] |
| 14 | Proline | 6 | 3 serum[15], plasma[41], saliva[42] | 3 plasma[13], serum[14, 27] |
| 15 | Serine | 6 | 5 saliva[11, 42], serum[15], plasma[21, 41] | 1 serum&plasma[30] |
| 16 | Creatine | 6 | 3 tissue[18, 37], urine[43] | 3 serum[18], plasma[24, 34] |
| 17 | Leucine | 6 | 2 saliva[11], urine[43] | 4 plasma[9, 34], serum[14], urine[22] |
| 18 | Tryptophan | 6 | 1 serum[33] | 5 serum[14, 18, 27], urine[22], plasma[41] |
| 19 | Lactate | 6 | 4 saliva[11], plasma[17, 21], tissue[37] | 2 serum&plasma[32], plasma[34] |
| 20 | Threonine | 5 | 2 plasma[41], saliva[42] | 3 plasma[9], serum[14], urine[22] |
| 21 | Taurine | 5 | 4 plasma[13, 24], serum[15], tissue[37] | 1 saliva[42] |
| 22 | Glucose | 5 | 2 plasma[17], urine[43] | 3 serum[23], plasma[34], tissue[37] |
| 23 | Aspartic acid | 4 | 3 serum[10], tissue[16], saliva[42] | 1 serum&plasma[32] |
| 24 | Stearic acid | 4 | 4 plasma[13, 21, 24], serum[38] | |
| 25 | Ornithine | 4 | 2 plasma[41], saliva[42] | 2 plasma[9], serum[14] |
| 26 | Cysteine | 4 | 2 serum[15], serum&plasma[32] | 2 urine[22], serum[27] |
| 27 | Glycerophosphocholine | 4 | 2 plasma[12], tissue[36] | 2 serum&plasma[32], saliva[42] |
| 28 | Pyruvate | 3 | 2 serum&plasma[30], plasma[34] | 1 serum[18] |
| 29 | Linoleic acid | 3 | 3 plasma[21, 24], serum[38] | |
| 30 | Palmitic acid | 3 | 3 plasma[13, 21], serum[38] | |
| 31 | Uracil | 3 | 2 serum&plamsa[32], urine[43] | 1 urine[22] |
| 32 | Urea | 3 | 2 urine[43, 45] | 1 plasma[8] |
| 33 | Formate | 3 | 1 urine[43] | 2 serum[10], plasma[17] |
3.1.3 Analysis of Metabolic Pathways
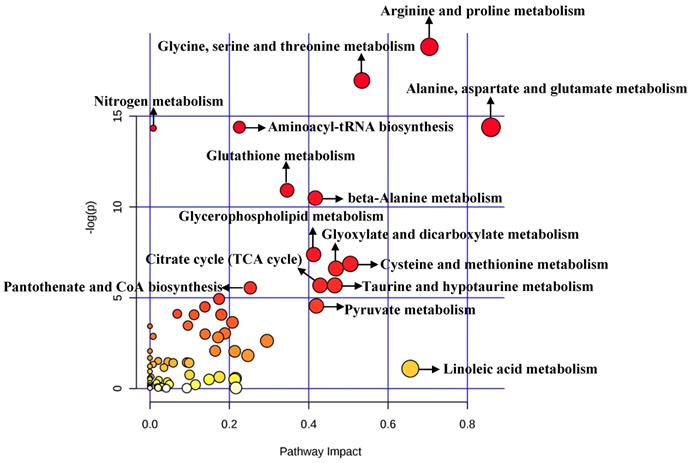
A total of 492 significant metabolites were imported to MetaboAnalyst for the identification of involved metabolic pathways (Figure 4). Those significantly enriched pathways (raw P<0.005) included arginine and proline metabolism, glycine, serine and threonine metabolism, aminoacyl-tRNA biosynthesis, alanine, aspartate and glutamate metabolism, glutathione metabolism and so on (Table 2). Particularly, two pathways (alanine, aspartate and glutamate metabolism and arginine and proline metabolism) performed an impact of 0.85945 and 0.70435, respectively.
Pathway analysis for clinical significant metabolites.
Significant metabolic pathways related to BC diagnosis in clinical researches
| Pathway Name | Raw P | Holm Adjust | FDR* | Impact |
|---|---|---|---|---|
| Arginine and proline metabolism | 6.69E-09 | 5.35E-07 | 5.35E-07 | 0.70435 |
| Glycine, serine and threonine metabolism | 4.27E-08 | 3.37E-06 | 1.71E-06 | 0.53424 |
| Aminoacyl-tRNA biosynthesis | 5.59E-07 | 4.36E-05 | 9.45E-06 | 0.22536 |
| Alanine, aspartate and glutamate metabolism | 5.61E-07 | 4.36E-05 | 9.45E-06 | 0.85945 |
| Nitrogen metabolism | 5.91E-07 | 4.49E-05 | 9.45E-06 | 0.00830 |
| Glutathione metabolism | 1.80E-05 | 0.0013531 | 2.41E-04 | 0.34568 |
| beta-Alanine metabolism | 2.77E-05 | 0.0020517 | 3.17E-04 | 0.41674 |
| Glycerophospholipid metabolism | 6.21E-04 | 0.0453150 | 0.006208 | 0.41257 |
| Cysteine and methionine metabolism | 0.001042 | 0.0750390 | 0.009264 | 0.50502 |
| Glyoxylate and dicarboxylate metabolism | 0.001342 | 0.0952670 | 0.010734 | 0.46883 |
| Citrate cycle (TCA cycle) | 0.003391 | 0.2373800 | 0.022608 | 0.42880 |
| Taurine and hypotaurine metabolism | 0.003391 | 0.2373800 | 0.022608 | 0.46583 |
| Pantothenate and CoA biosynthesis | 0.003890 | 0.2645400 | 0.023940 | 0.25300 |
*FDR: false discovery rate
3.1.4 Diagnostic potential of metabolite markers for discriminating BC
Twenty-two of these studies comparing BC patients with controls reported exact AUC values ranging from 0.627 to 1.000 (Table 3). In addition, Mónica Cala et al. [22] demonstrated that specific built-up biomarkers like dimethylheptanoylcarnitine and succinic acid could have a higher sensitivity and specificity (93.5%, 86.2%) than either dimethylheptanoylcarnitine (71.0%, 75.9%) or succinic acid (67.7%, 75.9%). Notably, the stage of BC patients has a certain influence on the results according to three selected studies [13, 30, 41].
The potential for metabolite markers in the diagnosis of BC
| Ref. | Sample | Sensitivity | Specificity | AUC | Potential Biomarker(s) | Note |
|---|---|---|---|---|---|---|
| Baowen Yuan [9](2019) | plasma | - | - | 0.870 | all significant metabolites | BC vs HC(training) |
| - | - | 0.800 | all significant metabolites | BC vs HC(validation) | ||
| Paniz Jasbi [13](2019) | plasma | 80.00% | 75.00% | 0.890 | all significant metabolites | BC vs HC |
| - | - | 0.760 | proline | BC vs HC | ||
| 86.00% | 75.00% | 0.870 | all significant metabolites | EBC vs HC | ||
| Dan Tudor Eniu [14](2019) | serum | 83.33% | 76.92% | 0.850 | isoleucine | BC vs HC |
| 66.67% | 92.31% | 0.850 | tryptophan | BC vs HC | ||
| Xinyang Wang [15](2018) | serum | - | - | 0.924 | glutamic acid | BC vs HC |
| - | - | 0.901 | taurine | BC vs HC | ||
| - | - | 0.749 | ethylmalonic acid | BC vs HC | ||
| Shankar Suman [17](2018) | plasma | - | - | 0.818 | β-glucose | BC vs HC |
| - | - | 0.780 | α-glucose | BC vs HC | ||
| - | - | 0.780 | lactate | BC vs HC | ||
| - | - | 0.697 | hydroxybutyrate | BC vs HC | ||
| - | - | 0.652 | N-acetyl glycoprotein | BC vs HC | ||
| - | - | 0.627 | lysine | BC vs HC | ||
| Tushar H. More [18](2018) | tissue | - | - | 0.970 | guanine | IDC vs HC |
| - | - | 0.830 | tyrosine | IDC vs BE | ||
| - | - | 0.960 | tyrosine | IDC vs HC | ||
| serum | - | - | 0.980 | ascorbic acid | IDC vs HC | |
| - | - | 0.830 | uridine diphosphate | IDC vs BE | ||
| Mónica Cala [22](2018) | urine | 93.50% | 86.20% | 0.915 | dimethylheptanoylcarnitine +succinic acid | BC vs HC |
| Mariona Jové [24](2017) | plasma | 100.00% | 100.00% | 1.000 | C26H43ClN4S3 | BC vs HC |
| 100.00% | 100.00% | 1.000 | C26H51N5O4 | BC vs HC | ||
| 100.00% | 100.00% | 1.000 | C9H16O3S | BC vs HC | ||
| 100.00% | 100.00% | 0.999 | C23H30N2S | BC vs HC | ||
| 100.00% | 100.00% | 0.995 | caproic acid | BC vs HC | ||
| 100.00% | 90.00% | 0.952 | taurine | BC vs HC | ||
| 90.00% | 90.00% | 0.959 | stearamide | BC vs HC | ||
| 100.00% | 90.00% | 0.935 | linoleic acid | BC vs HC | ||
| Naila Irum Hadi [25](2017) | serum | 96.00% | 100.00% | 0.990 | all significant metabolites | BC vs HC |
| Liping Zhong [26](2016) | saliva | 92.60% | 91.70% | 0.929 | MG(0:0/14:0/0:0) | BC vs HC |
| 77.80% | 100.00% | 0.920 | LysoPC (18:1) | BC vs HC | ||
| 81.50% | 91.70% | 0.920 | LysoPC (22:6) | BC vs HC | ||
| Qingjun Wang [27](2016) | serum | 90.30% | 87.40% | 0.944 | all significant metabolites | BC vs BE(HC) |
| Takahiro Takayama [28](2016) | saliva | 68.90% | 74.40% | 0.744 | spermine. | BC vs HC |
| Luisa Matos Do Canto [29](2016) | ductal fluid | 90.70% | 88.40% | 0.956 | all significant metabolites | BC vs HC |
| Sijia Huang [30](2016) | plasma | - | - | 0.986 | all significant metabolites | BC vs HC(training) |
| - | - | 0.995 | all significant metabolites | EBC vs HC(training) | ||
| - | - | 0.923 | all significant metabolites | BC vs HC(testing) | ||
| - | - | 0.905 | all significant metabolites | EBC vs HC(testing) | ||
| serum | - | - | 0.995 | all significant metabolites | BC vs HC(validation) | |
| - | - | 0.902 | all significant metabolites | EBC vs HC(validation) | ||
| Guoxiang Xie [32](2015) | plasma | 100.00% | 100.00% | 1.000 | aspartic acid | BC vs HC(training) |
| 100.00% | 94.30% | 0.996 | glycerolphosphate | BC vs HC(training) | ||
| plasma | 85.40% | 95.10% | 0.935 | aspartic acid | BC vs HC(validation) | |
| 95.10% | 93.20% | 0.971 | glycerolphosphate | BC vs HC(validation) | ||
| Yunping Qiu [35](2013) | plasma | 98.10% | 96.00% | - | LysoPC a C16:0, PC ae C42:5 and PC aa C34:2 | BC vs HC |
| Tone F. Bathen [37](2013) | tissue | 91.00% | 93.00% | - | all significant metabolites | BC patientstumor tissue vs non-involved adjacent tissue |
| Wuwen Lv [38](2012) | serum | 82.80% | 85.30% | 0.892 | C16:0 | BC vs HC |
| 89.70% | 85.00% | 0.925 | C16:0 | BC vs BE | ||
| Yohei Miyagi [41](2011) | plasma | - | - | 0.778 | all significant metabolites | BC vs HC |
| - | - | 0.813 | all significant metabolites | Stage 0 BC vs HC | ||
| - | - | 0.754 | all significant metabolites | Stage I BC vs HC | ||
| - | - | 0.786 | all significant metabolites | Stage II BC vs HC | ||
| - | - | 0.755 | all significant metabolites | Stage III BC vs HC | ||
| Masahiro Sugimoto [42](2010) | saliva | - | - | 0.973 | all significant metabolites | BC vs HC |
| Carolyn M. Slupsky [43](2010) | urine | 100.00% | 93.00% | - | all significant metabolites | BC vs HC |
| Hojung Nam [45](2009) | urine | - | - | 0.790 | all significant metabolites | BC vs HC |
3.2 Cellular Researches
3.2.1 Study Characteristics
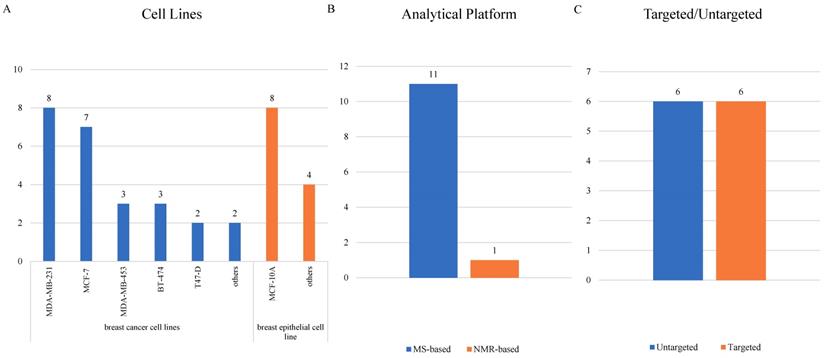
Cellular researches were relatively fewer than clinical researches, and 12 cellular studies [32, 47-57] were ultimately included (Supplementary Table S2). MCF-10A, mentioned in 8 articles, led the most common normal cell line being studied. As for BC cell lines, MDA-MB-231 was adopted most frequently in 8 studies, followed by MCF-7 in 7 studies and both MDA-MB-453 and BT-474 in 3 studies (Figure 5A). Only one study detected metabolites using a NMR-related methodology, and the other 11 studies all adopted mass-spectrometry based metabolomics (Figure 5B). Targeted and untargeted metabolomics both accounted for 6 articles (Figure 5C).
Characteristics of cellular studies.
3.2.2 Analysis of High Frequency Metabolic Biomarkers
There were 84 significant metabolites in the BC cells compared with normal breast epithelial cells. Differential metabolites reported in two studies included decreased amino acids (e.g. leucine, isoleucine, valine, phenylalanine [47, 51] and glutamine [47, 57]), increased lipids (e.g. phosphocholine [53, 56]) and RNA metabolites (e.g. 3-methylcytidine and 5-methyluridine [49, 52]). Moreover, decreased glucose was observed in two studies [53, 57] (Table 4).
High frequency cellular metabolic biomarkers related to BC diagnosis
| No. | Metabolites | Hits | Changing direction in BC | |
|---|---|---|---|---|
| up | down | |||
| 1 | Leucine | 2 | 2[47, 51] | |
| 2 | Isoleucine | 2 | 2[47, 51] | |
| 3 | Valine | 2 | 2[47, 51] | |
| 4 | Phenylalanine | 2 | 2[47, 51] | |
| 5 | Glutamine | 2 | 2[47, 57] | |
| 6 | Glucose | 2 | 2[53, 57] | |
| 7 | Phosphocholine | 2 | 2[53, 56] | |
| 8 | 3-Methylcytidine | 2 | 2[49, 52] | |
| 9 | 5-Methyluridine | 2 | 2[49, 52] | |
3.2.3 Analysis of Metabolic Pathways
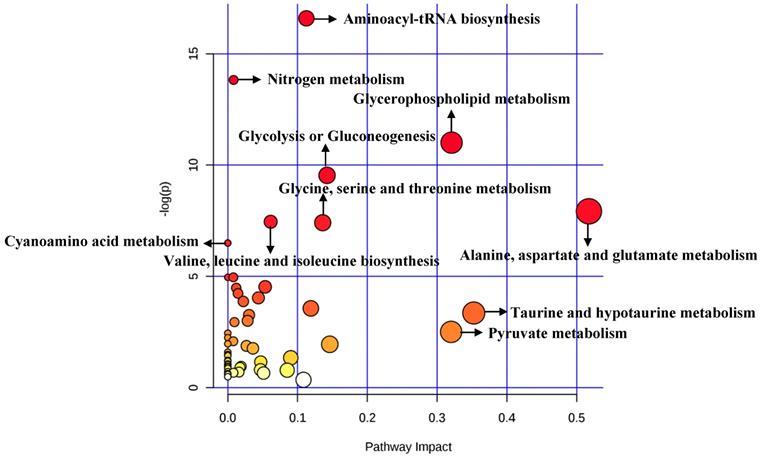
A total of 84 metabolites were imported to MetaboAnalyst for the identification of involved metabolic pathways (Figure 6). Finally, significantly enriched metabolic pathways (raw P<0.005) included aminoacyl-tRNA biosynthesis, glycerophospholipid metabolism, glycolysis or gluconeogenesis, alanine, aspartate and glutamate metabolism, glycine, serine and threonine metabolism and so on (Table 5). Notably, alanine, aspartate and glutamate metabolism had the highest impact value (impact= 0.51757).
Pathway analysis for cellular significant metabolites.
Significant metabolic pathways related to BC diagnosis in cellular researches
| Pathway Name | Raw P | Holm Adjust | FDR* | Impact |
|---|---|---|---|---|
| Aminoacyl-tRNA biosynthesis | 6.23E-08 | 0.00000 | 4.98E-06 | 0.11268 |
| Nitrogen metabolism | 9.91E-07 | 0.00008 | 3.97E-05 | 0.00830 |
| Glycerophospholipid metabolism | 1.66E-05 | 0.00129 | 4.42E-04 | 0.32074 |
| Glycolysis or Gluconeogenesis | 7.21E-05 | 0.00555 | 0.0014422 | 0.14226 |
| Alanine, aspartate and glutamate metabolism | 3.62E-04 | 0.02753 | 0.0057956 | 0.51757 |
| Valine, leucine and isoleucine biosynthesis | 5.79E-04 | 0.04345 | 0.006910 | 0.06148 |
| Glycine, serine and threonine metabolism | 6.05E-04 | 0.04474 | 0.006910 | 0.13604 |
| Cyanoamino acid metabolism | 0.0015061 | 0.10995 | 0.015061 | 0.00000 |
*FDR: false discovery rate
4. Discussion
In this study, we performed a systematic analysis of clinical and cellular metabolomic studies on BC diagnosis. As a result, a series of potential biomarkers were reported and summarized. A total of 33 high-frequency metabolites in clinical researches (reported in ≥3 studies) were listed, and some metabolic biomarkers (e.g. palmitic acid, linoleic acid, stearic acid and lipids.) showed consistent changing trends. In addition, pathway analysis revealed several important metabolic pathways for BC, particularly alanine, aspartate and glutamate metabolism with the highest impact, both in cellular and clinical studies.
When comparing clinical and cellular researches, we found that some significant metabolites (e.g. leucine, isoleucine, valine, phenylalanine, glutamine and glucose) were repeatedly reported in both types of studies. Moreover, five metabolic pathways were significantly enriched in both types of studies (FDR<0.05), including glycine, serine and threonine metabolism, aminoacyl-tRNA biosynthesis, alanine, aspartate and glutamate metabolism, nitrogen metabolism and glycerophospholipid metabolism. Along with the heterogeneity of BC, metabolites in different patients could vary based on different samples, tumor characteristics and dietary structures [58]. By contrast, cellular studies have an advantage of avoiding the heterogeneity resulting from diverse samples. However, metabolites detected could also be fluctuant, which is induced by the incubation time [47, 51] and PH of mediums [48].
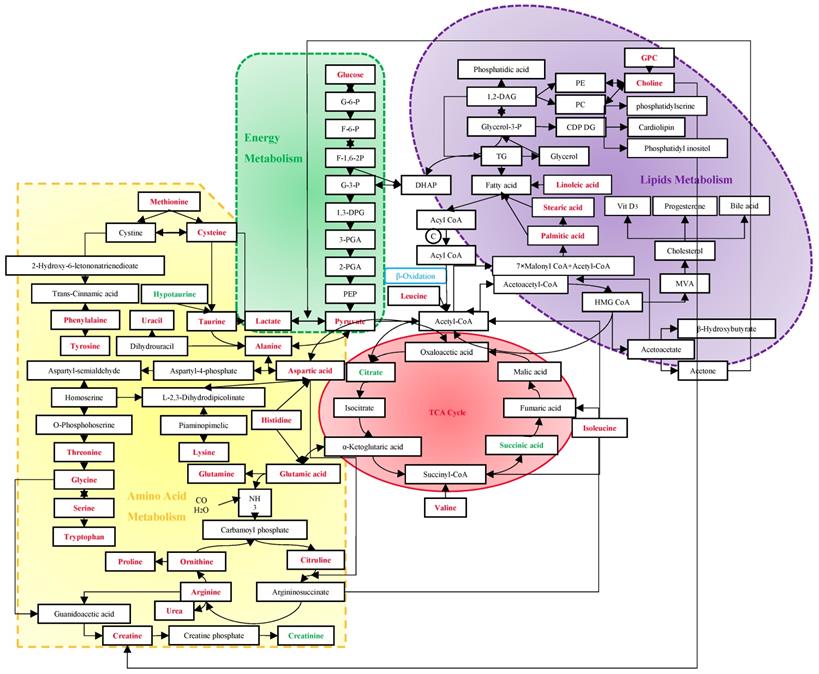
Screening mammography has been acknowledged as the gold standard for early detection of BC, with sensitivities of 54%~77% [59]. Despite the rapid development of many imaging techniques, their utilizations are limited to the high cost and insufficient sensitivities and specificities [60]. Due to the important role of immune system in the process of tumors' origin and development, tumor antigen-specific autoantibodies can be potentially applied to cancer detection as early biomarkers. However, currently used tumor markers usually have low diagnostic specificities and sensitivities as well [61]. Vathany's study suggested that cancer biomarkers could be measured in serum by immunological techniques with superiorities of convenience, relative non-invasion and being tested independently by operators [61]. As evidenced by the preponderant sensitivities and specificities in previous studies, metabolomics has shown advantages in the early diagnosis of BC. It is well known that an acceleration of glyconeogenesis, glycolysis and fat mobilization, and a decrease in protein synthesis, are the main metabolic changes in malignant tumors. The following discussion will expand from three basic metabolic pathways to discover their sensitivities and specificities for BC (Figure 7).
Metabolism in the diagnosis of BC. The red stand for metabolites with hits more than 3, and the green stand for 2-hit frequency metabolites. Abbreviation: G-6-P: glucose-6-phosphate; F-6-P: fructose-6-phosphate; F-1,6-2P: fructose-1, 6-bishosphate; G-3-P: glyceraldehyde-3-phophate; 1,3-DPG: 1,3-diphosphoglyceric acid; 3-PGA: 3-phosphoglycerate; 2-PGA: 2-phosphoglycerate; PEP: phosphoenolpyruvate; DHAP: dihydroxyacetone phosphate; TG: triglyceride; Glycerol-3-P: glycerol-3-phosphate; 1,2-DAG: 1,2-diacylglycerol; PE: phosphatidyl ethanolamine; PC: phosphatidylcholine; CDP DG: cytidine-5'-diphosphate 1,2-diacyl-sn-glycerol; GPC: glycerophosphocholine; MVA: mevalonic acid; HMG CoA: β-hydroxy-β-methylglutaryl- coenzyme A; TCA: tricarboxylic acid.
4.1 Energy Metabolism
Altered utilization of energy relative to normal cells caused by the proliferative tumor cells is an acknowledged hallmark of several cancers [62]. In glycolysis metabolism, a decreasing trend of glucose [23, 34, 37, 53, 57] and an increasing tendency of lactate [11, 17, 21, 37, 57] were observed in BC. This phenomenon might be accounted for a shift in energy production of tumor cells with a preference to anaerobic glycolysis even in the presence of oxygen, known as the Warburg effect [63], which is a better way for the rapid acquisition of energy and self-protection by immune disruptions with an acidic environment [64]. As a result of favoring the carbon source, MCF-7 cells were more likely to accomplish the complete oxidation of carbon consumption than 48R cells [57]. Moreover, higher lactate levels had been found associated with lower 5-year survival rates [65]. Notably, an increasing level of pyruvate can be bound up with an enhanced glycolytic activity [43, 66]. A high level of anaerobic glycolysis could reduce intermediates in the TCA cycle, resulting in a suppressed TCA cycle [43], which might be one of the reasons for down-regulations of branched chain amino acids (BCAAs) in the tissue of BC including leucine, isoleucine and valine [67].
4.2 Amino Acid Metabolism
Former studies suggested that several decreased amino acids might be the result of excessive consumption or preferential utilization to sustain the uncontrolled growth of BC cells [18, 22, 24, 27, 42, 47, 51, 68]. Based on clinical metabolomic studies, tyrosine and alanine shared the highest frequency with 12 hits, indicating they might be sensitive metabolites in the diagnosis of BC. Although the changing trend of tyrosine among different studies were inconsistent, previous research has demonstrated that tyrosine deficiency could result in BC cell growth arrest [69], and inhibition of tumor growth has been confirmed in low phenylalanine and tyrosine diets in an animal study [70]. Recent studies also showed that alanine had a significant difference between estrogen receptor positive and estrogen receptor negative breast cancer [71-72]. In addition, alanine and valine could result in cell damage by decreasing the activity of manganese superoxide dismutase (MnSOD), thereby converting benign tumor to malignant tumor [73].
Pathway analysis showed that alanine, aspartate and glutamate metabolism played an important role in the development of BC. The down-regulated glutamine indicated that glutamic acid might be accumulated in the body, which promotes the occurrence of BC by enhancing the proliferation of mammary epithelial cells [73] through ATP production and biosynthesis of nucleotides [74]. Moreover, the up-regulated glutamic acid via glutaminolysis could maintain the TCA cycle [75]. Researchers also observed that the reversibility of glutamine-glutamate was decreasing in MCF-7 cells, implying that BC cells might be partial to the irreversible glutaminase [57]. The change of glutamine could be reflected in the fluctuant levels of alanine and aspartic acid through the abnormal transport of ammonia. Higher activities of histidine decarboxylase might result in decreasing histidine since decarboxylation of histidine by this enzyme in the colorectal cancer has been reported [76-77]. Therefore, the low concentrations of histidine could be accounted for increased aspartic acid and glutamic acid, which could be converted to oxaloacetic acid and α-ketoglutaric acid, the intermediates of TCA cycle. Aspartic acid has been shown to possess a higher sensitivity for BC compared with gastric and colorectal cancer [32]. Therefore, increasing utilization of aspartic acid by BC cells might result in down-regulated aspartic acid and oxaloacetate in the blood. Notably, as a transamination product of aspartic acid, asparagine has a vital influence on the metastasis of BC [78]. Furthermore, with the role of modifying the indices of oxidative stress and membrane damage, increased hypotaurine could be potentially linked with BC [79].
4.3 Lipid Metabolism
Previous studies had put large efforts to figure out the importance of lipid metabolism in the diagnosis of breast cancer [21, 26, 31, 35, 38-40, 50, 54, 56], but deterministic conclusions are still on the road due to the complexity. It is well known that an increase of choline in the tissue could be a hallmark of aggressiveness breast cancer [80], therefore, excessive consumption of choline could result in its lower blood levels [23, 30, 32, 34]. The phenomenon that phospholipid metabolism shares the trend of upregulation integrally [21, 23] could be explained by an enhanced fatty acid (FFA) oxidation to confer limitless growth or survival advantage[81], mainly through inducing more exalted cell membrane turnover and lipid activity in intracellular signal transduction [82-84]. Remarkably, increased phosphocholine has been reported in other cancers, such as lung cancer [85], prostate cancer [86], brain cancer [87], colorectal cancer [88] and cervical cancer [89]. Fatty acid synthase (FANS) has also been confirmed to be highly expressed in the MCF-7 cells and tissue of BC patients [90]. Linoleic acid, stearic acid and palmitic acid were consistently detected in different studies with elevated levels in BC. Linoleic acid could promote BC via modulating Breast Cancer Susceptibility Gene 1 (BRCA1) [91]. Meanwhile, linoleic acid could increase the production of 20-hydroxyeicosatetraenoic acid (12-HETE), 15-hydroxyeicosatetraenoic acid (15-HETE) and prostaglandin E2 [92], which helps increase the modulation of adhesion and the membrane fluidity to promote BC [93]. Palmitic acid and stearic acid, as two common saturated fatty acids, were confirmed to inhibit insulin metabolism and attenuate insulin signal transduction [94]. Furthermore, a previous study demonstrated that a high level of palmitic acid in erythrocyte could increase the risk of BC [95]. Acetone, one of ketone bodies, was also suggested to be an aggressive biomarker of BC cells [53]. As another important way to provide energy in lipid metabolism, ketone bodies that are promoted by glycolytic stromal cells might provoke tumor growth and metastasis by accelerating oxidative mitochondrial metabolism [96].
5. Conclusions
In conclusion, numerous available publications have demonstrated the potential of metabolic profiling applied to the diagnosis of BC. Our review presents that there indeed exist certain metabolisms in BC patients, which could lay foundation for biomarker discovery for BC diagnosis and shed new light into the development and progression of BC. Moreover, with the advantages of convenience and relative non-invasion compared with imaging screening and tissue biopsy, metabolomics may be considered as an applicable tool in the diagnosis of early BC.
Supplementary Material
Supplementary tables.
Acknowledgements
This work was supported by National Natural Science Foundation of China (project number 81703316), Natural Science Foundation of Jiangsu Province (project number BK20170350) and Postdoctoral Science Foundation of Jiangsu Province (project number 1701123C).
Competing Interests
The authors have declared that no competing interest exists.
References
1. Bray F, Ferlay J, Soerjomataram I, Siegel RL, Torre LA, Jemal A. Global cancer statistics 2018: GLOBOCAN estimates of incidence and mortality worldwide for 36 cancers in 185 countries. CA: a cancer journal for clinicians. 2018;68:394-424
2. Houssami N, Ciatto S, Martinelli F, Bonardi R, Duffy SW. Early detection of second breast cancers improves prognosis in breast cancer survivors. Annals of oncology. 2009;20:1505-10
3. Duffy MJ. Serum tumor markers in breast cancer: Are they of clinical value? Clinical chemistry. 2006;52:345-51
4. Roganovic D, Djilas D, Vujnovic S, Pavic D, Stojanov D. Breast MRI, digital mammography and breast tomosynthesis: Comparison of three methods for early detection of breast cancer. Bosnian journal of basic medical sciences. 2015;15:64-8
5. Armitage EG, Ciborowski M. Applications of metabolomics in cancer studies. Advances in experimental medicine and biology. 2017;965:209-34
6. Nicholson JK, Lindon JC. Systems biology: Metabonomics. Nature. 2008;455:1054-6
7. Lam T, Nabi G. Potential of urinary biomarkers in early bladder cancer diagnosis. Expert review of anticancer therapy. 2007;7:1105-15
8. Zhao H, Shen J, Moore SC, Ye Y, Wu X, Esteva FJ. et al. Breast cancer risk in relation to plasma metabolites among Hispanic and African American women. Breast cancer research and treatment. 2019;176:687-96
9. Yuan BW, Schafferer S, Tang QQ, Scheffler M, Nees J, Heil J. et al. A plasma metabolite panel as biomarkers for early primary breast cancer detection. International journal of cancer. 2019;144:2833-42
10. Pietzke M, Arroyo SF, Sumpton D, Mackay GM, Martin-Castillo B, Camps J. et al. Stratification of cancer and diabetes based on circulating levels of formate and glucose. Cancer & metabolism. 2019;7:3
11. Murata T, Yanagisawa T, Kurihara T, Kaneko M, Ota S, Enomoto A. et al. Salivary metabolomics with alternative decision tree-based machine learning methods for breast cancer discrimination. Breast cancer research and treatment. 2019;177:591-601
12. Luo X, Yu H, Song Y, Sun T. Integration of metabolomic and transcriptomic data reveals metabolic pathway alteration in breast cancer and impact of related signature on survival. Journal of cellular physiology. 2019;234:13021-31
13. Jasbi P, Wang DF, Cheng SL, Fei Q, Cui JY, Liu L. et al. Breast cancer detection using targeted plasma metabolomics. Journal of chromatograohy B-analytical technologies in the biomedical and life sciences. 2019;1105:26-37
14. Eniu DT, Romanciuc F, Moraru C, Goidescu I, Eniu D, Staicu A. et al. The decrease of some serum free amino acids can predict breast cancer diagnosis and progression. Scandinavian journal of clinical and laboratory investigation. 2019;79:17-24
15. Wang XY, Zhao XS, Chou J, Yu JY, Yang TS, Liu LY. et al. Taurine, glutamic acid and ethylmalonic acid as important metabolites for detecting human breast cancer based on the targeted metabolomics. Cancer biomarkers. 2018;23:255-68
16. Torata N, Kubo M, Miura D, Ohuchida K, Mizuuchi Y, Fujimura Y. et al. Visualizing energy charge in breast carcinoma tissues by MALDI mass-spectrometry imaging profiles of low-molecular-weight metabolites. Anticancer research. 2018;38:4267-72
17. Suman S, Sharma RK, Kumar V, Sinha N, Shukla Y. Metabolic fingerprinting in breast cancer stages through (1)H NMR spectroscopy-based metabolomic analysis of plasma. Journal of pharmaceutical and biomedical analysis. 2018;160:38-45
18. More TH, RoyChoudhury S, Christie J, Taunk K, Mane A, Santra MK. et al. Metabolomic alterations in invasive ductal carcinoma of breast: A comprehensive metabolomic study using tissue and serum samples. Oncotarget. 2018;9:2678-96
19. Guo M, Zhang L, Du Y, Du W, Liu D, Guo C. et al. Enrichment and quantitative determination of 5-(hydroxymethyl)-2'-deoxycytidine, 5-(formyl)-2'-deoxycytidine, and 5-(carboxyl)-2'-deoxycytidine in human urine of breast cancer patients by magnetic hyper-cross-linked microporous polymers based on polyionic liquid. Analytical chemistry. 2018;90:3906-13
20. Cavaco C, Pereira JAM, Taunk K, Taware R, Rapole S, Nagarajaram H. et al. Screening of salivary volatiles for putative breast cancer discrimination: An exploratory study involving geographically distant populations. Analytical and bioanalytical chemistry. 2018;410:4459-68
21. Cala MP, Aldana J, Medina J, Sanchez J, Guio J, Wist J. et al. Multiplatform plasma metabolic and lipid fingerprinting of breast cancer: A pilot control-case study in Colombian Hispanic women. PloS one. 2018;13:e0190958
22. Cala M, Aldana J, Sanchez J, Guio J, Meesters RJW. Urinary metabolite and lipid alterations in Colombian Hispanic women with breast cancer: A pilot study. Journal of pharmaceutical and biomedical analysis. 2018;152:234-41
23. Zhou J, Wang Y, Zhang X. Metabolomics studies on serum and urine of patients with breast cancer using 1H-NMR spectroscopy. Oncotarget. 2017 doi: 10.18632/oncotarget.16210
24. Jove M, Collado R, Quiles JL, Ramirez-Tortosa MC, Sol J, Ruiz-Sanjuan M. et al. A plasma metabolomic signature discloses human breast cancer. Oncotarget. 2017;8:19522-33
25. Hadi NI, Jamal Q, Iqbal A, Shaikh F, Somroo S, Musharraf SG. Serum metabolomic profiles for breast cancer diagnosis, grading and staging by gas chromatography-mass spectrometry. Scientific reports. 2017;7:1715
26. Zhong L, Cheng F, Lu X, Duan Y, Wang X. Untargeted saliva metabonomics study of breast cancer based on ultra performance liquid chromatography coupled to mass spectrometry with HILIC and RPLC separations. Talanta. 2016;158:351-60
27. Wang Q, Sun T, Cao Y, Gao P, Dong J, Fang Y. et al. A dried blood spot mass spectrometry metabolomic approach for rapid breast cancer detection. OncoTargets and therapy. 2016;9:1389-98
28. Takayama T, Tsutsui H, Shimizu I, Toyama T, Yoshimoto N, Endo Y. et al. Diagnostic approach to breast cancer patients based on target metabolomics in saliva by liquid chromatography with tandem mass spectrometry. Clinica chimica acta. 2016;452:18-26
29. Matos Do Canto L, Marian C, Varghese RS, Ahn J, Da Cunha PA, Willey S. et al. Metabolomic profiling of breast tumors using ductal fluid. International journal of oncology. 2016;49:2245-54
30. Huang S, Chong N, Lewis NE, Jia W, Xie G, Garmire LX. Novel personalized pathway-based metabolomics models reveal key metabolic pathways for breast cancer diagnosis. Genome medicine. 2016;8:34
31. Cui M, Wang Q, Chen G. Serum metabolomics analysis reveals changes in signaling lipids in breast cancer patients. Biomedical chromatography. 2016;30:42-7
32. Xie G, Zhou B, Zhao A, Qiu Y, Zhao X, Garmire L. et al. Lowered circulating aspartate is a metabolic feature of human breast cancer. Oncotarget. 2015;6:33369-81
33. Cao ZG, Qin XB, Liu FF, Zhou LL. Tryptophan-induced pathogenesis of breast cancer. African health sciences. 2015;15:982-5
34. Mamtimin B, Hizbulla M, Kurbantay N, You L, Yan X, Upur H. An magnetic resonance-based plasma metabonomic investigation on abnormal Savda in different complicated diseases. Journal of traditional Chinese medicine. 2014;34:166-72
35. Qiu YP, Zhou BS, Su MM, Baxter S, Zheng XJ, Zhao XQ. et al. Mass spectrometry-based quantitative metabolomics revealed a distinct lipid profile in breast cancer patients. International journal of molecular sciences. 2013;14:8047-61
36. Mimmi MC, Finato N, Pizzolato G, Beltrami CA, Fogolari F, Corazza A. et al. Absolute quantification of choline-related biomarkers in breast cancer biopsies by liquid chromatography electrospray ionization mass spectrometry. Analytical cellular pathology. 2013;36:71-83
37. Bathen TF, Geurts B, Sitter B, Fjosne HE, Lundgren S, Buydens LM. et al. Feasibility of MR metabolomics for immediate analysis of resection margins during breast cancer surgery. PloS one. 2013;8:e61578
38. Lv WW, Yang TS. Identification of possible biomarkers for breast cancer from free fatty acid profiles determined by GC-MS and multivariate statistical analysis. Clinical biochemistry. 2012;45:127-33
39. Huang J, Sun JH, Chen YH, Song YM, Dong LJ, Zhan QM. et al. Analysis of multiplex endogenous estrogen metabolites in human urine using ultra-fast liquid chromatography-tandem mass spectrometry: A case study for breast cancer. Analytica chimica acta. 2012;711:60-8
40. Brockmoller SF, Bucher E, Muller BM, Budczies J, Hilvo M, Griffin JL. et al. Integration of metabolomics and expression of glycerol-3-phosphate acyltransferase (GPAM) in breast cancer-link to patient survival, hormone receptor status, and metabolic profiling. Journal of proteome research. 2012;11:850-60
41. Miyagi Y, Higashiyama M, Gochi A, Akaike M, Ishikawa T, Miura T. et al. Plasma free amino acid profiling of five types of cancer patients and its application for early detection. PloS one. 2011;6:e24143
42. Sugimoto M, Wong DT, Hirayama A, Soga T, Tomita M. Capillary electrophoresis mass spectrometry-based saliva metabolomics identified oral, breast and pancreatic cancer-specific profiles. Metabolomics. 2010;6:78-95
43. Slupsky CM, Steed H, Wells TH, Dabbs K, Schepansky A, Capstick V. et al. Urine metabolite analysis offers potential early diagnosis of ovarian and breast cancers. Clinical cancer research. 2010;16:5835-41
44. Woo HM, Kim KM, Choi MH, Jung BH, Lee J, Kong G. et al. Mass spectrometry based metabolomic approaches in urinary biomarker study of women's cancers. Clinica chimica acta. 2009;400:63-9
45. Nam H, Chung BC, Kim Y, Lee K, Lee D. Combining tissue transcriptomics and urine metabolomics for breast cancer biomarker identification. Bioinformatics. 2009;25:3151-7
46. Chen Y, Zhang R, Song Y, He J, Sun J, Bai J. et al. RRLC-MS/MS-based metabonomics combined with in-depth analysis of metabolic correlation network: Finding potential biomarkers for breast cancer. Analyst. 2009;134:2003-11
47. Du S, Wang Y, Alatrash N, Weatherly CA, Roy D, MacDonnell FM. et al. Altered profiles and metabolism of l- and d-amino acids in cultured human breast cancer cells vs. non-tumorigenic human breast epithelial cells. Journal of pharmaceutical and biomedical analysis. 2019;164:421-9
48. Silva CL, Perestrelo R, Silva P, Tomas H, Camara JS. Volatile metabolomic signature of human breast cancer cell lines. Scientific reports. 2017;7:43969
49. Willmann L, Schlimpert M, Hirschfeld M, Erbes T, Neubauer H, Stickeler E. et al. Alterations of the exo- and endometabolite profiles in breast cancer cell lines: A mass spectrometry-based metabolomics approach. Analytica chimica acta. 2016;925:34-42
50. Kim HY, Lee KM, Kim SH, Kwon YJ, Chun YJ, Choi HK. Comparative metabolic and lipidomic profiling of human breast cancer cells with different metastatic potentials. Oncotarget. 2016;7:67111-28
51. Willmann L, Schlimpert M, Halbach S, Erbes T, Stickeler E, Kammerer B. Metabolic profiling of breast cancer: Differences in central metabolism between subtypes of breast cancer cell lines. Journal of chromatography B-analytical technologies in the biomedical and life sciences. 2015;1000:95-104
52. Willmann L, Erbes T, Halbach S, Brummer T, Jager M, Hirschfeld M. et al. Exometabolom analysis of breast cancer cell lines: Metabolic signature. Scientific reports. 2015;5:13374
53. Maria RM, Altei WF, Andricopulo AD, Becceneri AB, Cominetti MR, Venancio T. et al. Characterization of metabolic profile of intact non-tumor and tumor breast cells by high-resolution magic angle spinning nuclear magnetic resonance spectroscopy. Analytical biochemistry. 2015;488:14-8
54. Doria ML, Cotrim CZ, Simoes C, Macedo B, Domingues P, Domingues MR. et al. Lipidomic analysis of phospholipids from human mammary epithelial and breast cancer cell lines. Journal of cellular physiology. 2013;228:457-68
55. Doria ML, Cotrim Z, Macedo B, Simoes C, Domingues P, Helguero L. et al. Lipidomic approach to identify patterns in phospholipid profiles and define class differences in mammary epithelial and breast cancer cells. Breast cancer research and treatment. 2012;133:635-48
56. Cao MD, Dopkens M, Krishnamachary B, Vesuna F, Gadiya MM, Lonning PE. et al. Glycerophosphodiester phosphodiesterase domain containing 5 (GDPD5) expression correlates with malignant choline phospholipid metabolite profiles in human breast cancer. NMR in biomedicine. 2012;25:1033-42
57. Meadows AL, Kong B, Berdichevsky M, Roy S, Rosiva R, Blanch HW. et al. Metabolic and morphological differences between rapidly proliferating cancerous and normal breast epithelial cells. Biotechnology progress. 2008;24:334-41
58. Playdon MC, Ziegler RG, Sampson JN, Stolzenberg-Solomon R, Thompson HJ, Irwin ML. et al. Nutritional metabolomics and breast cancer risk in a prospective study. American journal of clinical nutrition. 2017;106:637-49
59. Skaane P. Studies comparing screen-film mammography and full-field digital mammography in breast cancer screening: updated review. Acta radiologica. 2009;50:3-14
60. Leithner D, Wengert GJ, Helbich TH, Thakur S, Ochoa-Albiztegui RE, Morris EA. et al. Clinical role of breast MRI now and going forward. Clinical radiology. 2018;73:700-14
61. Kulasingam V, Diamandis EP. Tissue culture-based breast cancer biomarker discovery platform. International journal of cancer. 2008;123:2007-12
62. Hanahan D, Weinberg RA. Hallmarks of cancer: the next generation. Cell. 2011;144:646-74
63. Garber K. Energy boost: the Warburg effect returns in a new theory of cancer. Journal of the national cancer institute. 2004;96:1805-6
64. Choi SY, Collins CC, Gout PW, Wang Y. Cancer-generated lactic acid: A regulatory, immunosuppressive metabolite? Journal of pathology. 2013;230:350-5
65. Giskeodegard GF, Lundgren S, Sitter B, Fjosne HE, Postma G, Buydens LMC. et al. Lactate and glycine-potential MR biomarkers of prognosis in estrogen receptor-positive breast cancers. NMR in biomedicine. 2012;25:1271-9
66. Jobard E, Pontoizeau C, Blaise BJ, Bachelot T, Elena-Herrmann B, Tredan O. A serum nuclear magnetic resonance-based metabolomic signature of advanced metastatic human breast cancer. Cancer letters. 2014;343:33-41
67. Yang C, Richardson AD, Smith JW, Osterman A. Comparative metabolomics of breast cancer. Pacific symposium on biocomputing. 2007;12:181-92
68. Jain M, Nilsson R, Sharma S, Madhusudhan N, Kitami T, Souza AL. et al. Metabolite profiling identifies a key role for glycine in rapid cancer cell proliferation. Science. 2012;336:1040-4
69. Harvie MN, Campbell IT, Howell A, Thatcher N. Acceptability and tolerance of a low tyrosine and phenylalanine diet in patients with advanced cancer - a pilot study. Journal of human nutrition and dietetics. 2002;15:193-202
70. Atoum M, Abdel-Fattah M, Nimer N, Abdel-Rahman S, Abdeldayem SA. Association of alanine-valine manganese superoxide dismutase gene polymorphism and microheterogeneity manganese superoxide dismutase activity in breast cancer and benign breast tissue. Journal of breast cancer. 2012;15:157-61
71. Budczies J, Brockmoller SF, Muller BM, Barupal DK, Richter-Ehrenstein C, Kleine-Tebbe A. et al. Comparative metabolomics of estrogen receptor positive and estrogen receptor negative breast cancer: alterations in glutamine and beta-alanine metabolism. Journal of proteomics. 2013;94:279-88
72. Fan Y, Zhou X, Xia TS, Chen Z, Li J, Liu Q. et al. Human plasma metabolomics for identifying differential metabolites and predicting molecular subtypes of breast cancer. Oncotarget. 2016;7:9925-38
73. Coloff JL, Murphy JP, Braun CR, Harris IS, Shelton LM, Kami K. et al. Differential glutamate metabolism in proliferating and quiescent mammary epithelial cells. Cell metabolism. 2016;23:867-80
74. El Ansari R, McIntyre A, Craze ML, Ellis IO, Rakha EA, Green AR. Altered glutamine metabolism in breast cancer; subtype dependencies and alternative adaptations. Histopathology. 2018;72:183-90
75. Dowling P, Henry M, Meleady P, Clarke C, Gately K, O'Byrne K. et al. Metabolomic and proteomic analysis of breast cancer patient samples suggests that glutamate and 12-HETE in combination with CA15-3 may be useful biomarkers reflecting tumour burden. Metabolomics. 2015;11:620-35
76. Qiu YP, Cai GX, Su MM, Chen TL, Liu YM, Xu Y. et al. Urinary metabonomic study on colorectal cancer. Journal of proteome research. 2010;9:1627-34
77. Garcia-Caballero M, Neugebauer E, Campos R, Nunez de Castro I, Vara-Thorbeck C. Increased histidine decarboxylase (HDC) activity in human colorectal cancer: results of a study on ten patients. Agents and actions. 1988;23:357-60
78. Knott SRV, Wagenblast E, Khan S, Kim SY, Soto M, Wagner M. et al. Asparagine bioavailability governs metastasis in a model of breast cancer. Nature. 2018;554:378-81
79. Bucak MN, Tuncer PB, Sariozkan S, Ulutas PA, Coyan K, Baspinar N. et al. Effects of hypotaurine, cysteamine and aminoacids solution on post-thaw microscopic and oxidative stress parameters of Angora goat semen. Research in veterinary science. 2009;87:468-72
80. Chen JH, Mehta RS, Baek HM, Nie K, Liu H, Lin MQ. et al. Clinical characteristics and biomarkers of breast cancer associated with choline concentration measured by 1H MRS. NMR in biomedicine. 2011;24:316-24
81. Zaugg K, Yao Y, Reilly PT, Kannan K, Kiarash R, Mason J. et al. Carnitine palmitoyltransferase 1C promotes cell survival and tumor growth under conditions of metabolic stress. Genes & development. 2011;25:1041-51
82. Aboagye EO, Bhujwalla ZM. Malignant transformation alters membrane choline phospholipid metabolism of human mammary epithelial cells. Cancer research. 1999;59:80-4
83. Katz-Brull R, Seger D, Rivenson-Segal D, Rushkin E, Degani H. Metabolic markers of breast cancer: Enhanced choline metabolism and reduced choline-ether-phospholipid synthesis. Cancer research. 2002;62:1966-70
84. Cuadrado A, Carnero A, Dolfi F, Jimenez B, Lacal JC. Phosphorylcholine: A novel second messenger essential for mitogenic activity of growth factors. Oncogene. 1993;8:2959-68
85. Rocha CM, Barros AS, Gil AM, Goodfellow BJ, Humpfer E, Spraul M. et al. Metabolic profiling of human lung cancer tissue by 1H high resolution magic angle spinning (HRMAS) NMR spectroscopy. Journal of proteome research. 2010;9:319-32
86. Swanson MG, Keshari KR, Tabatabai ZL, Simko JP, Shinohara K, Carroll PR. et al. Quantification of choline- and ethanolamine-containing metabolites in human prostate tissues using 1H HR-MAS total correlation spectroscopy. Magnetic resonance in medicine. 2008;60:33-40
87. Tzika AA, Astrakas L, Cao H, Mintzopoulos D, Andronesi OC, Mindrinos M. et al. Combination of high-resolution magic angle spinning proton magnetic resonance spectroscopy and microscale genomics to type brain tumor biopsies. International journal of molecular medicine. 2007;20:199-208
88. Cheng LL, Anthony DC, Comite AR, Black PM, Tzika AA, Gonzalez RG. Quantification of microheterogeneity in glioblastoma multiforme with ex vivo high-resolution magic-angle spinning (HRMAS) proton magnetic resonance spectroscopy. Neuro-oncology. 2000;2:87-95
89. Jordan KW, Nordenstam J, Lauwers GY, Rothenberger DA, Alavi K, Garwood M. et al. Metabolomic characterization of human rectal adenocarcinoma with intact tissue magnetic resonance spectroscopy. Diseases of the colon and rectum. 2009;52:520-5
90. Kuhajda FP. Fatty acid synthase and cancer: new application of an old pathway. Cancer research. 2006;66:5977-80
91. Kachhap SK, Dange P, Nath Ghosh S. Effect of omega-6 polyunsaturated fatty acid (linoleic acid) on BRCA1 gene expression in MCF-7 cell line. Cancer letters. 2000;154:115-20
92. Rose DP, Connolly JM. Omega-3 fatty acids as cancer chemopreventive agents. Pharmacology & therapeutics. 1999;83:217-44
93. Johanning GL. Modulation of breast cancer cell adhesion by unsaturated fatty acids. Nutrition. 1996;12:810-6
94. Ruddock MW, Stein A, Landaker E, Park J, Cooksey RC, McClain D. et al. Saturated fatty acids inhibit hepatic insulin action by modulating insulin receptor expression and post-receptor signalling. Journal of biochemistry. 2008;144:599-607
95. Shannon J, King IB, Moshofsky R, Lampe JW, Gao DL, Ray RM. et al. Erythrocyte fatty acids and breast cancer risk: a case-control study in Shanghai, China. American journal of clinical nutrition. 2007;85:1090-7
96. Bonuccelli G, Tsirigos A, Whitaker-Menezes D, Pavlides S, Pestell RG, Chiavarina B. et al. Ketones and lactate "fuel" tumor growth and metastasis: Evidence that epithelial cancer cells use oxidative mitochondrial metabolism. Cell cycle. 2010;9:3506-14
Author contact
![]() Corresponding author: Tel.: +86-512-6588-0079. E-mail: cfkeedu.cn.
Corresponding author: Tel.: +86-512-6588-0079. E-mail: cfkeedu.cn.