Impact Factor ISSN: 1837-9664

 Global reach, higher impact
J Cancer 2020; 11(6):1446-1456. doi:10.7150/jca.33831 This issue Cite
Research Paper
The miR-34 family and its clinical significance in ovarian cancer
Hannah Welponer1, Irina Tsibulak1, Verena Wieser1, Christine Degasper1, Giridhar Shivalingaiah2#, Sören Wenzel2, Susanne Sprung3, Christian Marth1, Hubert Hackl4, Heidelinde Fiegl1* ![]() , Alain G. Zeimet1*
, Alain G. Zeimet1* ![]()
1. Department of Obstetrics and Gynecology, Medical University of Innsbruck, Innsbruck, Tyrol, 6020, Austria
2. Division of Human Genetics, Medical University of Innsbruck, Innsbruck, Tyrol, 6020, Austria.
3. Institute of Pathology, Medical University of Innsbruck, Innsbruck, Tyrol, 6020, Austria.
4. Biocenter, Division of Bioinformatics, Medical University of Innsbruck, Innsbruck, Tyrol, 6020, Austria.
#Present address: Novartis - Global Drug Development Regulatory Affairs CMC, Sandoz GmbH, Langkampfen, Tyrol, 6336, Austria.
* These authors contributed equally to this work
Received 2019-2-4; Accepted 2019-11-20; Published 2020-1-13
Abstract
The tumor suppressor miR-34 family is transcriptionally induced by p53. Clinical significance of the various miR-34 family members has not been studied in ovarian cancer. In 228 ovarian cancers and in 19 non-neoplastic fallopian tube samples we analysed miR-34 a/b/c expression in relation to clinicopathological characteristics and clinical outcome. We found significantly lower levels of miR-34 a/b/c in ovarian cancers as compared to control-tissues (P=0.002, P<0.001, P<0.001, respectively). Expression of miR-34 b/c revealed an inverse correlation with BRCA1/2 mRNA-expression (BRCA1: miR34 b/c P=0.002 each; BRCA2: miR-34 b/c P<0.001 each), the same was true for miR-34a and BRCA2 mRNA-expression (P<0.001). The miR-34 family expression was found to be significantly lower in type 2 in comparison to type 1 cancers (P<0.001) and in TP53-mutated compared with TP53-wild-type ovarian cancers (P<0.001, P=0.002, P=0.004, respectively). When low grade serous ovarian cancers were compared with high grade serous cancers the respective miR-34 a/b/c expression was 2.6-, 40.8- and 32.3-fold higher. The expression of each of the miR-34 family members was revealed to be of independent prognostic relevance regarding progression free survival (PFS); miR-34a: HR 0.6, P=0.033; miR-34b: HR 0.2, P=0.001 and miR-34c: HR 0.3, P=0.002, respectively). For overall survival (OS) independency of the prognostic value was confined to miR-34b (HR 0.4, P=0.016) and miR-34c (HR 0.6, P=0.049). The independency of the prognostic value of our identified thresholds was confirmed for PFS for miR-34c in a publicly available dataset (NCBI Gene Expression Omnibus GSE73582). Our findings suggest that downregulation of miR-34 family is a crucial part in ovarian cancer development. Low miR-34 levels are linked to a worse overall survival and progression free survival and may indicate a more aggressive disease.
Keywords: ovarian cancer, miR-34, p53, survival, carcinogenesis
Introduction
Mortality due to ovarian cancer is considered to be one of the highest among malignancies in females (1). In advanced ovarian cancer surgery, with the aim of a complete clearance from all macroscopic tumor, and subsequent chemotherapy are the essential parts of treatment (2). Despite appropriate treatment, ovarian cancer will recur in more than 75% of the patients (3, 4).
Ovarian cancer can be classified into two major subgroups founded on two distinct backgrounds in carcinogenesis: Type 1 carcinomas develop from precursor lesions such as atypical proliferative tumors, generally grow slowly and tend to be restricted to the ovary at time of diagnosis (5). Frequently these cancers are associated with mutations of BRAF and KRAS (6). However, the largest group of cancers are the more aggressive type 2 tumors which originate from the fimbrial epithelium of the fallopian tube and develop through STICs (serous tubal intraepithelial carcinomas) as precursor lesions, from where malignant cells exfoliate into the free abdominal cavity and implant on the ovary and on the whole peritoneal surface. Mutations in TP53 are an early event in the genesis and represent the leading driver of these high grade cancers (5, 7, 8).
The transcription factor p53 also known as the “guardian of the genome”, acts as a tumor suppressor (9-11). New insights into the way of function of p53 emerged that some mutations are able to confer even pro-oncogenic properties to the altered p53 protein (12, 13).
Furthermore, there is evidence that p53 transactivates microRNAs (miRNAs) of the 34 family. These miRNAs have been found to interfere with the mRNA of crucial cellular proliferative and anti-apoptotic regulators and negatively control their expression and thus support cell-cycle arrest, senescence and apoptosis (11, 14-18). Of special interest is that within the miR-34 family, miR-34a is encoded by a different gene than miR-34b and 34c, which both are encoded by a common gene (11).
These tumor-suppressing properties of this p53-miR34 interplay are of special importance during p53-detected DNA damage. Mutation of TP53 consecutively may favor carcinogenesis and tumor proliferation by reduced levels of intracellular miR-34 family members (11, 17). Besides its p53 regulation, miR-34a and mir-34 b/c have also been found to be epigenetically regulated via CpG methylation of their promoter (19).
As TP53 mutation represents the driver mutation in more than 95% of the high grade serous cancers, but is very uncommon in type 1 ovarian cancers (5, 7), we wanted to explore how far the members of the miR-34 family are involved in the carcinogenesis and biology of ovarian cancer. Therefore, differences between miR-34 expression profile in type 1 and type 2 cancers as well as in TP53-mutated and -wild-type ovarian cancers were of particular interest. Here we additionally performed also the first comprehensive survival analysis of the miR34-family in ovarian cancer.
Material and Methods
Study population
Ovarian tissue samples from 228 patients with ovarian cancer (OC) obtained at primary debulking (patients were 24 to 90 years old; median age at diagnosis was 61 years) and non-neoplastic tubal tissues from 19 patients obtained by elective salpingo-oophorectomy for benign conditions (patients were 30 to 73 years old, median age: 50 years) were collected and processed at the Department of Obstetrics and Gynecology of the Medical University of Innsbruck between 1989 and 2014 as described recently (20). We included all ovarian cancer patients where fresh frozen tissues were collected and sufficient material for RNA extraction was available. Systemic treatment of OC patients consisted of six adjuvant cycles of platinum-based chemotherapy. Written informed consent was obtained from all patients before enrolment. The study was reviewed and approved by the Ethics committee of the Medical University of Innsbruck (reference number: AN2015-0038 346/4.17) and conducted in accordance with the Declaration of Helsinki. The median observation period of all patients was 30 months (1 to 252 months) regarding the progression free survival and 59 months (1 to 289 months) concerning the median overall survival. Clinicopathological characteristics are shown in Table 1.
Association of miR-34a/b/c mRNA-expression with clinicopathological features in 228 ovarian cancer patients.
| Variable | Number (percent) | mRNA expression values | |||||
|---|---|---|---|---|---|---|---|
| (arbitrary units) | |||||||
| miR-34a | miR-34b | miR-34c | |||||
| Median (IQR) | P value | Median (IQR) | P value | Median (IQR) | P value | ||
| Pathology | |||||||
| ovarian cancer | 228 | 0.75 (0.41 - 1.63) | 0.002 | 0.08 (0.03 - 0.34) | <0.001 | 0.09 (0.02 - 0.45) | <0.001 |
| non-neoplastic fallopian tubes | 19 | 1.40 (1.10 - 2.39) | 14.29 (9.70 - 31.71) | 12.22 (3.74 - 20.46) | |||
| Age | |||||||
| < 61.5 years | 114 (50%) | 0.95 (0.39 - 1.68) | 0.427 | 0.11 (0.03 - 1.10) | 0.056 | 0.13 (0.03 - 1.20) | 0.088 |
| > 61.5 years | 114 (50%) | 0.72 (0.43 - 1.56) | 0.06 (0.02 - 0.21) | 0.08 (0.02 - 0.27) | |||
| FIGO stage | |||||||
| I/II | 84 (37%) | 1.27 (0.67- 2.27) | <0.001 | 0.06 (0.02 - 0.24) | 0.207 | 0.07 (0.02 - 0.35) | 0.136 |
| III/IV | 144 (63%) | 0.62 (0.34 - 1.21) | 0.09 (0.03 - 0.37) | 0.11 (0.03 - 0.50) | |||
| Tumor grade | |||||||
| 1 | 27 (12%) | 1.64 (0.71 - 2.94) | 0.001 | 1.51 (0.02 - 6.92) | 0.015 | 1.92 (0.02 - 6.43) | 0.012 |
| 2 | 117 (51%) | 0.72 (0.42 - 1.61) | 0.08 (0.02 - 0.39) | 0.10 (0.02 - 0.54) | |||
| 3 | 84 (37%) | 0.73 (0.32 - 1.25) | 0.06 (0.03 - 0.18) | 0.08 (0.03 - 0.19) | |||
| Residual disease | |||||||
| macroscopically tumor-free | 117 (51%) | 1.16 (0.49 - 2.13) | 0.001 | 0.10 (0.03 - 0.72) | 0.054 | 0.12 (0.03 - 1.10) | 0.031 |
| residual tumor | 106 (46%) | 0.62 (0.35 - 1.12) | 0.06 (0.02 - 0.20) | 0.08 (0.02 - 0.21) | |||
| n.a. | 5 (2%) | - | - | - | |||
| Histology | |||||||
| LGSOC | 16 (7%) | 1.64 (1.25 - 3.02) | <0.001 | 3.26 (1.02 - 7.01) | <0.001 | 2.91 (1.36 - 8.15) | <0.001 |
| HGSOC | 128 (56%) | 0.63 (0.33 - 1.13) | 0.08 (0.03 - 0.30) | 0.09 (0.03 - 0.33) | |||
| mucinous | 25 (11%) | 1.83 (0.72 - 2.61) | 0.07 (0.02 - 1.39) | 0.04 (0.02 - 1.24) | |||
| endometrioid | 45 (20%) | 0.63 (0.43 - 1.46) | 0.06 (0.02 - 0.22) | 0.07 (0.02 - 0.27) | |||
| clear cell | 14 (6%) | 1.57 (0.85- 2.57) | 0.04 (0.02 - 0.11) | 0.05 (0.02 - 0.11) | |||
| Ovarian cancer Type | |||||||
| Type 1 | 71 (31%) | 1.53 (0.73 - 2.53) | <0.001 | 0.25 (0.04 - 4.68) | <0.001 | 0.40 (0.04 - 5.45) | <0.001 |
| Type 2 | 157 (69%) | 0.60 (0.34 - 1.15) | 0.06 (0.02 - 0.18) | 0.08 (0.02 - 0.19) | |||
| TP53 mutation | |||||||
| wild type | 70 (31%) | 1.68 (1.05 - 2.63) | <0.001 | 0.17 (0.03 - 2.95) | 0.002 | 0.15 (0.03 - 2.62) | 0.004 |
| mutated | 129 (57%) | 0.56 (0.31 - 1.03) | 0.06 (0.02 - 0.19) | 0.08 (0.02 - 0.22) | |||
| n.a. | 29 (13%) | - | - | - | |||
| BRCA1 mutation | |||||||
| wild type | 166 (73%) | 0.85 (0.43 - 1.78) | 0.095 | 0.08 (0.03 - 0.32) | 0.925 | 0.09 (0.03 - 0.40) | 0.963 |
| mutated | 33 (14%) | 0.60 (0.33 - 1.20) | 0.09 (0.02 - 0.25) | 0.09 (0.02 - 0.44) | |||
| n.a. | 29 (13%) | - | - | - | |||
| BRCA2 mutation | |||||||
| wild type | 178 (78%) | 0.83 (0.40 - 1.65) | 0.387 | 0.07 (0.02 - 0.32) | 0.954 | 0.09 (0.02 - 0.43) | 0.813 |
| mutated | 21 (9%) | 0.72 (0.42 - 1.49) | 0.09 (0.03 - 0.22) | 0.15 (0.03 - 0.33) | |||
| n.a. | 29 (13%) | - | - | - | |||
| BRCA1/2 mutation | |||||||
| wild type | 146 (64%) | 0.90 (0.43 - 1.80) | 0.060 | 0.07 (0.02 - 0.37) | 0.967 | 0.09 (0.02 - 0.49) | 0.971 |
| mutated | 53 (23%) | 0.65 (0.35 - 1.22) | 0.09 (0.03 - 0.23) | 0.14 (0.02 - 0.33) | |||
| n.a. | 29 (13%) | - | - | - | |||
| Platinum sensitivity | |||||||
| refractory/ resistant | 27 (17%) | 0.85 (0.52 - 1.51) | 0.135 | 0.06 (0.02 - 0.17) | 0.569 | 0.07 (0.02 - 0.15) | 0.711 |
| very sensitive / sensitive | 118 (76%) | 0.58 (0.34 - 1.12) | 0.06 (0.02 - 0.18) | 0.08 (0.02 - 0.21) | |||
| n.a. | 10 (6%) | - | - | - | |||
Note: The significance level (P) was determined by Mann-Whitney U or Kruskal-Wallis test respectively.
Abbreviations: HGSOC, high grade serous ovarian cancer; IQR, Interquartile range; LGSOC, low grade serous ovarian cancer
Validation cohort
Gene expression data from two independent cohorts of OC patients were used for the validation of our findings (NCBI Gene Expression Omnibus; accession number GSE73583 (GSE73581 (OC179) and GSE73582 (OC133); (21)). Patients without surgical treatment or patients with borderline tumors were excluded.
RNA isolation, Reverse transcription and real-time PCR analysis
Total cellular RNA extraction was done as previously described (20). Reverse transcription was performed using the TaqMan™ MicroRNA Reverse Transcription Kit according the manufacturer's instructions (Applied Biosystems, Carlsbad, USA, Cat.no. 4366597).
TaqMan microRNA assays specific for miR-34a-5p, miR-34b-5p and miR-34c-5p respectively (Applied Biosystems, Assay ID 000426; ID 00427, and ID 00428 respectively) were used. miR-34 expression was normalized to RNU6B (Applied Biosystems, Assay ID 001093) using the standard curve method. The assays were performed in accordance with manufacturer's instructions using the QuantStudio 6 Flex system (Applied Biosystems).
Mutation analysis
Genomic DNA from pulverized, quick-frozen OC specimens was isolated using the DNeasy tissue-kit (Qiagen, Hilden, Germany). Targeted NGS was performed using the TruSight Cancer sequencing panel (Illumina, San Diego, USA). The analyses were performed on the Illumina MiSeq® and the NextSeq system (Illumina, CA, USA). Mutation analysis was performed using NextGene and Geneticist Assistant softwares.
Statistical Analysis
Clinicopathological characteristics and miR-34 a/b/c expression were compared by means of the non-parametric Mann-Whitney U test or Kruskal-Wallis test. Correlation analyses were assessed by Spearman-rank correlation analyses. Progression free survival (PFS) was defined as the time from diagnosis of the primary to tumor to the histopathological confirmation of recurrence or metastases and overall survival (OS) as the time from diagnosis of the primary to tumor to death from any cause or to the last clinical inspection. Univariate Kaplan-Meier analyses and multivariable Cox survival analyses were used to explore the association of miR-34 a/b/c expression or with PFS and OS. For survival analyses, patients were dichotomized into low and high mRNA-expression level groups by the optimal cut-off expression value calculated by the Youden's index based on a receiver operating characteristic curve analysis for overall survival (22). P-values less than 0.05 were considered as statistically significant. Statistical analysis was performed using SPSS statistical software (version 20.0.0; SPSS Inc., Chicago, IL, USA).
Results
Expression of miR-34a, miR-34b and miR-34c according to clinicopathological features
In 228 OC and 19 non-neoplastic fallopian tube samples, expression of miR-34 a/b/c was analysed. Significantly lower levels of miR-34 a/b/c were found in cancer specimens as compared to control tissues (P=0.002, P<0.001 and P<0.001, respectively; Table 1).
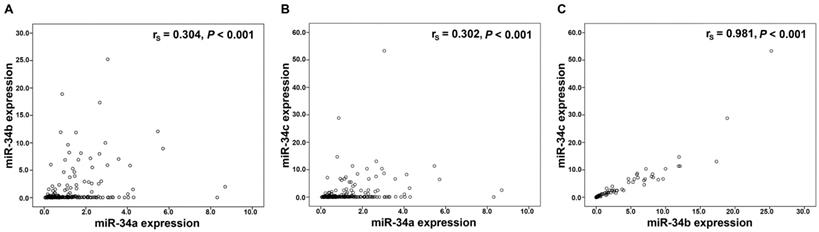
Performing Spearman rank association analyses in the 228 OC tissues, we noted a significant and strong correlation between miR-34b and miR-34c expression (P<0.001; rs=0.981), whereas a significant but weaker correlation of miR-34a with miR-34b (P<0.001; rs=0.304) and with miR-34c (P<0.001; rs=0.302), respectively was identified (Figure 1). Associations with similar correlation coefficients were also detected in control tissues (data not shown).
Correlation analysis in the miR-34 family. Linear regression analysis of (A) miR-34a and miR-34b expression, (B) miR-34a and miR-34c expression, (C) miR-34b and miR-34c expression. mRNA expression values were normalized to TATA box binding protein (TBP) expression.
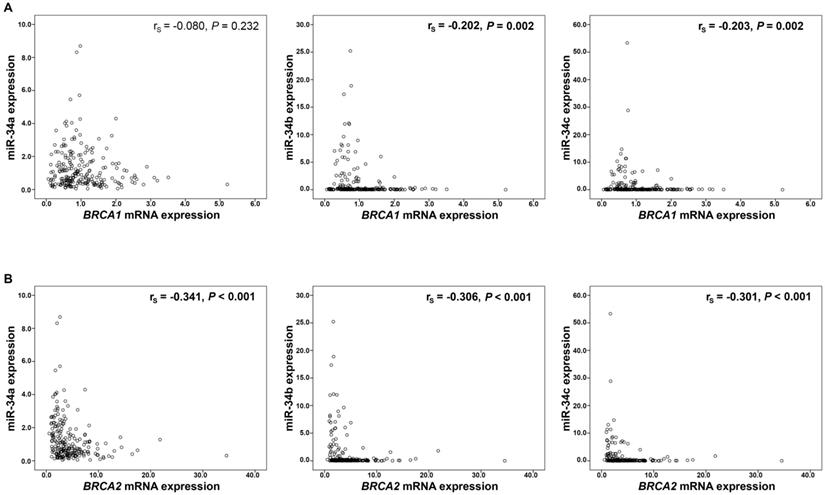
Moreover, expression of miR-34b and miR-34c showed an inverse correlation with BRCA1/2 mRNA expression (BRCA1: miR34b rs=-0.202, P=0.002, miR-34c rs=-0.203, P=0.002, respectively; Figure 2A; BRCA2: miR-34b rs=-0.306, P<0.001, miR-34c rs=-0.301, P<0.001, respectively; Figure 2B). Mir-34a however, correlated inversely only with BRCA2 mRNA expression (rs=-0.341, P<0.001; Figure 2B). These significant associations between miR-34 members and BRCA transcripts were identified only in BRCA1/2 wild-type cancers (data not shown).
Correlation analysis of miR-34 a/b/c and BRCA1/2 mRNA expression. MiR-34 expression and (A) BRCA1 mRNA and (B) BRCA2 mRNA expression. mRNA expression values were normalized to TBP expression.
Regarding BRCA1/2 mutated and wild-type cancers, no significant difference in the expression of miR-34 family could be found (Table 1).
With regard to FIGO stage, expression levels of miR-34a were significantly higher in stage I/II than in stage III/IV (P<0.001), whereas no significant distinction between expression levels of miR-34b and miR-34c was found (Table 1).
Moreover, higher miR-34 a/b/c expression levels were observed in low grade tumors in comparison to grade 2/3 cancers (P=0.001, P=0.015 and P=0.012, respectively; Table 1).
A 1.9-fold and 1.5-fold higher miR-34a and miR-34c expression, respectively was observed in tumors which have been completely cleared during primary surgery (P=0.001, P=0.031, respectively; Table 1) in comparison to cancers resulting in any residual disease. Regarding histological subtypes, the highest expression of miR-34b and miR-34c was identified in low grade serous ovarian cancers (LGSOC) in comparison to all other histological subtypes. For miR-34a we identified a high expression in mucinous ovarian cancer, LGSOC and clear cell ovarian cancer (Table 1). Of special note was a 2.6-fold, 40.8-fold and 32.3-fold higher expression level of miR34 a/b/c, respectively in LGSOC compared with high grade serous ovarian cancers (HGSOC).
According to the dualistic model of carcinogenesis, we investigated the expression of the miRNAs in type 1 (n=71) and in type 2 cancers (n=157). Among all cancer samples, in type 2 ovarian cancers significantly lower expression levels of miR-34a, miR-34b and miR-34c (P<0.001 each) were revealed compared with type 1 cancers.
TP53 mutated tumors exhibited significantly less expression levels of miR-34a (P<0.001), miR-34b (P=0.002) and miR-34c (P=0.004) in comparison with TP53 wild-type cancers (Table 1).
In type 2 cancers no direct significant association between expression of miR-34 family members and platinum-sensitivity in the course of front-line chemotherapy was observed.
Expression of miR-34 family members and clinical outcome
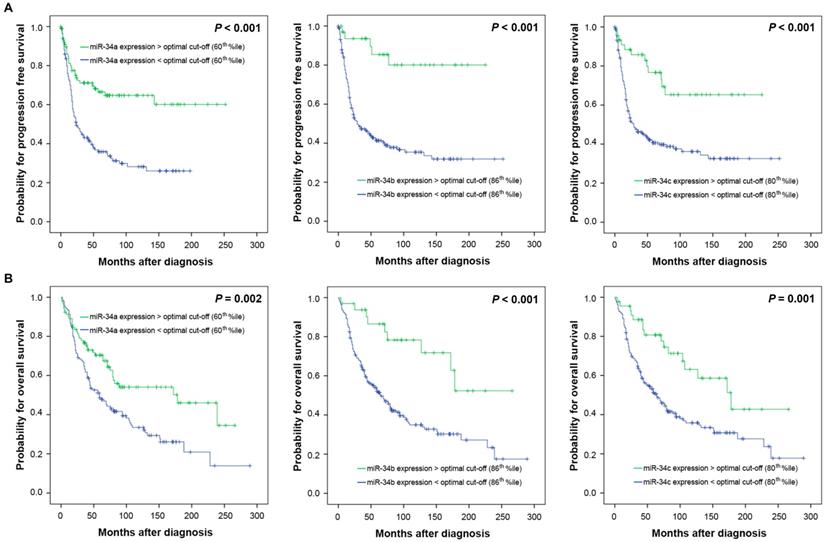
To investigate a possible biologic effect of miR-34 a/b/c on the clinical outcome, the optimal threshold for “high” and “low” expression was determined using Youden's index for progression free survival (PFS). The optimal discriminatory cut-off points corresponded to the following percentiles: miR-34a: 60th percentile; miR-34b: 86th percentile, miR-34c: 80th percentile of the entire cohort of ovarian cancers. Univariate survival analysis revealed that high miR-34 a/b/c expression levels were associated with favourable PFS (P<0.001 each) and overall survival (OS) (P=0.002, P<0.001, P=0.001, respectively) (Table 2, Figure 3). Separate analysis of HGSOC showed a nearly identical survival outcome (PFS: miR-34a P=0.003, miR-34b P=0.001, miR-34c P=0.003, respectively; OS: miR-34a P=0.026, miR-34b P=0.002, miR-34c P=0.002, respectively) (Table 2).
Univariate survival analysis in 228 ovarian cancer patients. The optimal cutoff points for miR-34a/b/c mRNA expression were calculated by the Youden's index for progression free survival (miR-34a expression: low/ high: </>60th percentile; miR-34b expression: low/ high: </>86th percentile, miR-34c expression: low/ high: </>80th percentile).
| PROGRESSION FREE SURVIVAL | OVERALL SURVIVAL | |||||
|---|---|---|---|---|---|---|
| Variable | Median, months (95% CI) | P value | Median, months (95% CI) | P value | ||
| Age | < 61.5 years | 57.0 (29.7 - 84.3) | 0.803 | 129.0 (69.7 - 188.3) | < 0.001 | |
| > 61.5 years | 35.0 (n.r.) | 49.0 (34.2 - 63.8) | ||||
| FIGO stage | I/II | n.r. | < 0.001 | 228.0 (61.5 - 394.5) | < 0.001 | |
| III/IV | 22.0 (17.0 - 27.0) | 56.0 (36.2 - 75.8) | ||||
| Tumor grade | 1 | n.r. | 0.001 | 239.0 (n.r.) | 0.005 | |
| 2/3 | 35.0 (16.1 - 53.9) | 69.0 (52.8 - 85.2) | ||||
| Residual disease | macroscopically tumor-free | n.r. | < 0.001 | 228.0 (79.1 - 376.9) | < 0.001 | |
| residual tumor | 17.0 (14.7 - 19.3) | 36.0 (25.3 - 46.7) | ||||
| Histology | LGSOC | n.r. | < 0.001 | n.r. | < 0.001 | |
| HGSOC | 24.0 (16.7 - 31.3) | 52.0 (37.2 - 66.8) | ||||
| mucinous | n.r. | 172.0 (32.0 - 312.0) | ||||
| endometrioid | n.r. | 188.0 (101.5 - 274.5) | ||||
| clear cell | 18.0 (0.0-74.1) | 79.0 (0.0 - 167.3) | ||||
| Ovarian cancer Type | Type I | n.r. | < 0.001 | 228.0 (173.8 - 282.2) | < 0.001 | |
| Type II | 23.0 (14.1 - 31.9) | 48.0 (30.3 - 65.7) | ||||
| TP53 aberrations | no | n.r. | < 0.001 | 172.0 (115.1 - 228.9) | < 0.001 | |
| yes | 22.0 (17.0 - 27.0) | 44.0 (26.6 - 61.4) | ||||
| miR-34a mRNA expression | low | 24.0 (14.4 - 33.6) | < 0.001 | 59.0 (41.2 - 76.8) | 0.002 | |
| high | n.r. | 178.0 (73.1 - 282.9) | ||||
| Subgroup analysis | ||||||
| HGSOC | low | 20.0 (14.4 - 25.6) | 0.003 | 44.0 (35.3 - 52.7) | 0.026 | |
| high | 143.0 (n.r.) | 79.0 (54.6 - 103.4) | ||||
| LGSOC | low | n.r. | 0.810 | * | 0.379 | |
| high | n.r. | * | ||||
| miR-34b mRNA expression | low | 29.0 (14.0 - 44.0) | < 0.001 | 65.0 (47.0 - 83.0) | < 0.001 | |
| high | n.r. | n.r. | ||||
| Subgroup analysis | ||||||
| HGSOC | low | 22.0 (17.0 - 27.0) | 0.001 | 44.0 (33.8 - 54.2) | 0.002 | |
| high | n.r. | n.r. | ||||
| LGSOC | low | 24.0 (n.r.) | 0.044 | n.r. | 0.972 | |
| high | n.r. | n.r. | ||||
| miR-34c mRNA expression | low | 29.0 (13.8 - 44.2) | < 0.001 | 64.0 (44.6 - 83.4) | 0.001 | |
| high | n.r. | 178.0 (104.2 - 251.8) | ||||
| Subgroup analysis | ||||||
| HGSOC | low | 20.0 (15.1 - 24.9) | 0.003 | 44.0 (34.0 - 54.0) | 0.002 | |
| high | 77.0 (n.r.) | n.r. | ||||
| LGSOC | low | 24.0 (12.8 - 35.2) | 0.039 | * | 0.427 | |
| high | n.r. | * | ||||
Note: The significance level (P) was determined by log-rank test.
Abbreviations: n.r., not reached.
*No statistics are computed because all cases are censored.
Kaplan Meier survival analysis and miR-34 a/b/c mRNA-expression in 228 OC patients. Progression free survival and (A) miR-34a expression, (B) miR-34b expression, (C) miR-34c expression. Overall survival and (D) miR-34a expression, (E) miR34b expression, (F) miR-34c expression. Cut-off points: miR-34a expression: low/ high: </>60th percentile; miR-34b expression: low/ high: </>86th percentile, miR-34c expression: low/ high: </>80th percentile.
Multivariate Cox regression analysis confirmed that high expression levels of miR-34 a/b/c were independently associated with favourable PFS in 228 ovarian cancer patients (miR-34a: HR 0.6 (95% confidence interval (CI) 0.4-1.0), P=0.033; miR-34b: HR 0.2 (95% CI 0.1-0.5), P=0.001 and miR-34c: HR 0.3 (95% CI 0.2-0.7), P=0.002, respectively) (Table 3 A) and among 128 HGSOC patients calculated separately (miR-34a: HR 0.5 (95% CI 0.2-0.9), P=0.019; miR-34b: HR 0.2 (95% CI 0.1-0.8), P=0.019 and mir-34c: HR 0.4 (95% CI 0.2-0.9), P=0.036, respectively) (Table 3 B). Regarding OS in the entire cohort of all ovarian cancer patients only miR-34b and miR-34c expression retained prognostic independency (miR-34b: HR 0.4 (95% CI 0.2-0.8), P=0.016 and mir-34c: HR 0.6 (95% CI 0.3-1.0), P=0.049) (Table 3 A). The separate multivariate analysis for HGSOC patients revealed also independent prognostic relevance with regard to OS for miR-34b (HR 0.3 (95% CI 0.1-0.9), P=0.036) and for mir-34c (HR 0.5 (95% CI 0.2-1.0), P=0.046) (Table 3 B).
Multivariable analysis in ovarian cancer patients. Progression free and overall survival (A) in 228 OC patients, and (B) in 128 HGSOC patients.
| A | |||||
| Progression free survival | Overall survival | ||||
| Variable | HR of progression (95% CI) | P value | HR of death (95% CI) | P value | |
| Age | low vs. high (< or > median age) | - | - | 2.5 (1.7 - 3.6) | < 0.001 |
| FIGO stage | I/II vs. III/IV | 2.2 (1.2 - 4.1) | 0.009 | 1.1 (0.6 - 1.8) | 0.819 |
| Tumor grade | 1 vs. 2/3 | 1.6 (0.6 - 4.3) | 0.330 | 1.5 (0.6 - 3.4) | 0.365 |
| Residual disease | no vs. yes | 2.8 (1.7 - 4.5) | < 0.001 | 3.0 (1.9 - 4.9) | < 0.001 |
| Histology | HGSOC vs. Others | 0.8 (0.5 - 1.3) | 0.374 | 0.8 (0.5 - 1.2) | 0.210 |
| miR-34a expression | low vs. high (< or > optimal cut-off) | 0.6 (0.4 - 1.0) | 0.033 | 0.8 (0.6 - 1.2) | 0.365 |
| miR-34b expression | low vs. high (< or > optimal cut-off) | 0.2 (0.1 - 0.5) | 0.001 | 0.4 (0.2 - 0.8) | 0.016 |
| miR-34c expression | low vs. high (< or > optimal cut-off) | 0.3 (0.2 - 0.7) | 0.002 | 0.6 (0.3 - 1.0) | 0.049 |
| B | |||||
| Progression free survival | Overall survival | ||||
| Variable | HR of progression (95% CI) | P value | HR of death (95% CI) | P value | |
| Age | low vs. high (< or > median age) | - | - | 2.2 (1.4 - 3.4) | 0.001 |
| FIGO stage | I/II vs. III/IV | 0.9 (0.4 - 2.0) | 0.833 | 0.9 (0.5 - 1.7) | 0.735 |
| Residual disease | no vs. yes | 4.0 (2.0 - 7.9) | < 0.001 | 3.3 (1.8 - 6.0) | < 0.001 |
| miR-34a expression | low vs. high (< or > optimal cut-off) | 0.5 (0.2 - 0.9) | 0.019 | 0.6 (0.3 - 1.1) | 0.097 |
| miR-34b expression | low vs. high (< or > optimal cut-off) | 0.2 (0.1 - 0.8) | 0.019 | 0.3 (0.1 - 0.9) | 0.036 |
| miR-34c expression | low vs. high (< or > optimal cut-off) | 0.4 (0.2 - 0.9) | 0.036 | 0.5 (0.2 - 1.0) | 0.046 |
Note: The significance level was determined by Cox regression analysis. HR, hazard ratio.
Validation analyses
In order to confirm our observations we analysed two publicly available datasets of OC patients recently published (GSE73581 and GSE73582) (21).
Due to limitations of availability of clinicopathological characteristics and BRCA1/2 or TP53 mutation data, we were not able to validate all associations identified in our study cohort.
Performing Spearman rank association analyses we confirmed the identified correlations. (GSE73581 cohort: n=168; miR-34b and miR-34c expression (P<0.001; rs=0.719), miR-34a with miR-34b (P<0.001; rs=0.827) and with miR-34c (P<0.001; rs=0.359), respectively; GSE73582 cohort: n=130; miR-34b and miR-34c expression (P<0.001; rs=0.937), miR-34a with miR-34b (P=0.008; rs=0.233) and with miR-34c (P=0.014; rs=0.216), respectively.
We used these two cohorts also to perform survival analyses to validate the prognostic relevance of the identified threshold values in our study cohort. For progression free survival independency of the prognostic value was confined to miR-34c only in the GSE73582 cohort (HR 0.5, P=0.027; Table 4). For overall survival independency was confined to miR-34a again only in the GSE73582 cohort (GSE73582: HR 0.5, P=0.046; Table 4). The separate multivariate analysis for HGSOC patients was not confirmed in both datasets (data not shown).
Multivariable validation analysis in ovarian cancer patients. Progression free and overall survival in 168 OC patients (GSE73581 cohort) (A), and (B) in 130 OC patients (GSE73582 cohort). The identified cutoff values from our study cohort (miR-34a: 60th percentile, miR-34b: 86th percentile miR-34c: 80th percentile) and validation cohort specific optimal thresholds were analysed: (GSE7381: miR-34a: 49th percentile, miR-34b: 24th percentile, miR-34c: 7th percentile; GSE7382: miR-34a: 85th percentile, miR-34b: 55th percentile, miR-34c: 53rd percentile).
| A | |||||
| Progression free survival | Overall survival | ||||
| Variable | HR of progression (95% CI) | P value | HR of death (95% CI) | P value | |
| Age | low vs. high (< or > median age) | 1.5 (1.0 - 2.2) | 0.029 | 1.8 (1.1 - 3.0) | 0.020 |
| FIGO stage | I/II vs. III/IV | 3.1 (1.5 - 6.5) | 0.003 | 2.6 (0.9 - 7.9) | 0.094 |
| Histology | HGSOC vs. non HGSOC | 0.9 (0.6 - 1.4) | 0.648 | 1.2 (0.7 - 2.1) | 0.558 |
| Residual disease | no vs. yes | 2.1 (1.4 - 3.4) | 0.001 | 2.5 (1.3 - 4.7) | 0.005 |
| Study cohort cutoff values: | |||||
| miR-34a expression | low vs. high (< or > 60th percentile) | 0.7 (0.5 - 1.1) | 0.100 | 0.6 (0.4 - 1.0) | 0.066 |
| miR-34b expression | low vs. high (<or > 86th percentile) | 1.0 (0.5 - 1.7) | 0.866 | 0.7 (0.3 - 1.6) | 0.410 |
| miR-34c expression | low vs. high (<or > 80th percentile) | 0.9 (0.6 - 1.5) | 0.788 | 0.9 (0.5 - 1.8) | 0.851 |
| Optimal cohort specific cutoff values | |||||
| miR-34a expression | low vs. high (< or > optimal cut-off) | 0.8 (0.5 - 1.1) | 0.205 | 0.8 (0.5 - 1.2) | 0.259 |
| miR-34b expression | low vs. high (or > optimal cut-off) | 0.6 (0.4 - 1.0) | 0.035 | 0.6 (0.4 - 1.0) | 0.062 |
| miR-34c expression | low vs. high (< or > optimal cut-off) | 0.7 (0.3 - 1.3) | 0.238 | 0.8 (0.3 - 2.4) | 0.742 |
| B | |||||
| Progression free survival | Overall survival | ||||
| Variable | HR of progression (95% CI) | P value | HR of death (95% CI) | P value | |
| Age | low vs. high (< or > median age) | 1.4 (0.9 - 2.1) | 0.145 | 1.9 (1.1 - 3.5) | 0.028 |
| FIGO stage | I vs II vs III vs IV | 1.4 (0.9 - 2.1) | 0.090 | 5.8 (1.9 - 17.2) | 0.002 |
| Histology | HGSOC vs. non HGSOC | 1.0 (0.6 - 1.6) | 0.958 | 0.4 (0.2 - 1.0) | 0.038 |
| Grade | 1/2 vs. 3 or undifferentiated | 1.5 (0.9 - 2.5) | 0.107 | - | - |
| Residual disease | no vs. yes | 2.6 (1.6 - 4.4) | <0.001 | 2.9 (1.4 - 5.8) | 0.004 |
| Study cohort cutoff values: | |||||
| miR-34a expression | low vs. high (< or > 60th percentile) | 0.8 (0.5 - 1.2) | 0.293 | 0.5 (0.3 - 1.0) | 0.046 |
| miR-34b expression | low vs. high (<or > 86th percentile) | 0.6 (0.3 - 1.2) | 0.177 | 0.6 (0.2 - 1.7) | 0.373 |
| miR-34c expression | low vs. high (<or > 80th percentile) | 0.5 (0.3 - 0.9) | 0.027 | 0.6 (0.3 - 1.3) | 0.214 |
| Optimal cohort specific cutoff values | |||||
| miR-34a expression | low vs. high (< or > optimal cut-off) | 0.5 (0.2 - 1.0) | 0.053 | 0.4 (0.1 - 1.3) | 0.123 |
| miR-34b expression | low vs. high (or > optimal cut-off) | 0.6 (0.4 - 0.9) | 0.011 | 0.6 (0.3 - 1.0) | 0.051 |
| miR-34c expression | low vs. high (< or > optimal cut-off) | 0.5 (0.3 - 0.8) | 0.002 | 0.6 (0.3 - 1.1) | 0.078 |
Note: The significance level was determined by Cox regression analysis. HR, hazard ratio.
In a proof of concept analysis using cohort specific, optimal threshold values, we were able to confirm in both cohorts the independent prognostic relevance of miR-34b for PFS (GSE73581: HR 0.6, P=0.035; GSE73582: HR 0.6, P=0.011; Table 4). For miR-34c this was confirmed only in the GSE73582 cohort (HR 0.5, P=0.002; Table 4). The separate multivariate analysis for HGSOC patients revealed again only in the GSE73582 sample set the independent prognostic relevance for PFS of miR-34a (HR 0.4, P=0.044), miR-34b (HR 0.6, P=0.032) and miR-34c (HR 0.5, P=0.009) (data not shown).
Discussion
In this study we could reveal significantly reduced expression of all miR-34 family members in ovarian cancer samples compared to non-neoplastic control tissues what is in accordance with previous findings (23). Moreover, the expression of miR-34 a/b/c was found to be significantly lower in TP53 mutated samples compared with TP53 wild type cancers. These findings confirm observations from Corney et al. (24). The lower expression in TP53 mutated tissues is probably due to the fact that all three members of the mir-34 family are under the positive regulatory control of p53 (11, 14-18).
Furthermore, there is good evidence that miR-34 family is crucially involved into the ying-yang of epithelial-mesenchymal transition (EMT) and mesenchymal-epithelial transition (MET) in cancer cells. Unimpaired p53/miR-34 axis represses SNAIL which is known to induce EMT that is associated with stemness, increased migration and invasion and thus enhances the metastatic potential of malignant cells. Through this repression miR-34 family members indirectly promote MET and are abrogating malignant traits in cancer cells. In addition, in the concert of EMT regulation at least miR-34a was shown to downregulate SLUG and ZEB1 as well as several stemness factors such as BMI1, CD44, etc. On the other hand, miR-34 family members are regulated through a negative feedback loop by SNAIL and ZEB1 (25-27).
Consequently, our results revealing that in FIGO stage I/II miR-34a expression levels were significantly higher than in stage III/IV of ovarian cancer seem to be in line with these findings (25, 26). Also Zhang et al. and Eitan et al. described a downregulation of miR-34 in advanced stage tumors (28, 29). Interestingly, there is data indicating that there might be a link between miR-34a and NOTCH1 expression, with respect to cancer stemness. Park et al. showed that miR-34 family was significantly reduced in chemoresistant breast cancer cells which were characterized by a higher number of cancer stem cells. In cells with reduced expression of miR-34a NOTCH1 levels have been found to be increased. After reconstitution of miR-34a, the stemness could be reduced and the sensitivity to chemotherapy was improved (30). However, this link between strong expression of miR-34a and high chemosensitivity may not be universal and the same for all tumor entities, as low grade serous ovarian cancers are constitutively chemoresistant probably due to their low proliferation rate (31-33), despite the highest miR-34 levels we measured in ovarian cancer. On the other hand, high grade ovarian cancers are generally more responsive to cytotoxic treatment (32) and were found to exhibit lower miR-34 expression in the present investigation. This was the reason we investigated in vivo sensitivity to chemotherapy in type 2 cancers only. However, in this setting none of the miR-34 family members was found to be related to the responsiveness to platinum-based primary chemotherapy.
An interesting aspect emerging from our findings was the strong correlation between miR-34b and miR-34c expression. A weaker, but nevertheless significant, correlation was identified between miR-34a and miR-34b as well as miR-34c, respectively. These findings could be explained by the fact that miR-34a is encoded by a different gene located on chromosome 1p36 while miR-34b and 34c are co-transcribed from a single gene located on chromosome 11q23 via a common promoter (11, 17). In the validation part of our study we used data from publicly available ovarian cancer patient cohorts, (GSE73581, GSE73582). Our identified correlations were confirmed in both cohorts. But the weaker correlation between miR-34a and miR-34b as well as miR-34c, respectively was observed only in the GSE73582 samples. The higher concordance between our study cohort and the GSE73582 cohort is probably due to the usage of fresh frozen tissues in both studies, whereas in the GSE7381 cohort only FFPE tissues were analysed.
P53 binding sites are present in the promoter regions of miR-34a and miR-34 b/c, capable to directly regulate the expression miR-34 family members (15, 16, 18, 34-37). Accordingly, our findings suggest significantly higher expression of miR-34a-c in type 1 cancers compared to type 2 tumors which frequently harbour TP53 mutations (5, 7). Interestingly, miR-34a-c are known to show the most pronounced induction by TP53 out of all miRNAs (35, 38). This was proved by Corney et al., who revealed the miR-34 family to be the most suppressed miRNAs in mouse ovarian surface epithelium cells after p53 inactivation (37).
A more specified analysis according the different histological subtypes revealed the highest miR-34b and 34c levels in LGSOC in comparison to all other histological types. MiR-34a expression was however found to be high in mucinous-, low grade serous- and clear cell cancers. But in our study all clear cell cancers were high grade cancers and thus were classified as type 2 tumors and were TP53 mutated in 31% of cases. One explanation for this contradictory finding may be the fact that especially miR-34a can be regulated by multiple p53-independent mechanisms (39).
Notably, there were significantly higher expression levels of miR-34a and 34c in tumors which have been completely cleared during primary surgery related to cancers resulting in any residual disease. These data may indicate that ovarian cancers with high miR-34a and 34c expression exhibit a lesser malignant potency with lower invasiveness and dissemination. In addition, this fact may be a major factor influencing the association between the levels of miR-34 members and the survival of OC-patients revealed in the present study. However, in multivariate Cox-regression analysis, the parameter “residual disease” was incorporated and high levels of all three members of the miR-34 family were independently associated with a beneficial PFS, as well in whole cohort of OC patients as in the subgroup of HGSOC patients. Regarding OS only miR-34b and 34c expression levels were confirmed as independent prognosticators among all OC- and HGSOC-patients. This finding is in accordance with Lee et al. who described the prognostic relevance of miR-34c in 33 HGSOC in an univariate analysis (40). Similar results for miR-34a were described in non-small-cell lung cancer by Gallardo et al. who identified miR-34a as a prognostic marker for relapse (41). The reason for the beneficial clinical outcome in patients with high miR-34 expression may be that miR-34 represses genes promoting carcinogenesis, malignant progression and stemness (11, 25, 27). As mentioned previously the transcription factor SNAIL, which is regulated by miR-34 family, is one of the key inducers of EMT (25, 26). Another crucial, cell proliferation inducing transcription factor is E2F3a, which is key activator of the cell cycle by stimulating and accelerating the G1/S transition. It has been shown that E2F3a is also negatively controlled by miR-34a. This was demonstrated in ovarian cancer cells by knock-down experiments of miR-34a which led to a significant rise of the E2F3a expression (42, 43).
In addition, L1CAM was also found to be negatively regulated by miR-34a (44). L1CAM is a functional membranous glycoprotein that confers migration and invasion properties to tumor cells and is also crucially involved in EMT (44, 45). Artificial overexpression of miR-34a in endometrial and ovarian cancer cells resulted downregulation of L1CAM expression and substantial reduction in cell migration (44). L1CAM overexpression was associated with highly impaired prognosis in several tumor entities including endometrial and ovarian cancer (46, 47). Interestingly, in ovarian cancer expression of L1CAM was linked to reduced tumor resectability at primary surgery (46). These findings (46) are corroborating the herein revealed association between residual disease and low miR-34a and miR-34c expression levels.
Regarding BRCA1/2 mutational status, for none of the miR-34 family members a different expression between wild-type and mutated cancers was found. However, in BRCA wilde-type cancers, an inverse correlation between the expression of BRCA1/2-mRNA and miR-34 b/c and between miR-34a and BRCA2 mRNA was pointed out. As the proteins encoded by the tumor suppressor genes BRCA1/2 are profoundly involved in homologous recombination DNA repair (48), the revealed inverse associations may reflect the more pronounced malignant phenotype of cancers expressing low miR-34 family members and exhibiting a higher proliferation rates with more DNA replication. Such an increased cellular turn-over needs more DNA repair with higher expression of its main components.
The validation of the survival analyses were separated in two approaches: First, we validated our identified cutoff percentiles for miR-34 a/b/c. The independency of the prognostic value of our identified thresholds was confirmed only for PFS for miR-34c only in the GSE73582 cohort. In contrast to our data miR-34a was shown an independent factor for OS again only in the GSE73582 cohort. Second, we analysed in a proof of principle, cohort specific, optimal threshold values to confirm generally the independent prognostic relevance of the expression of each of the miR-34 family members. We were able to confirm in both cohorts the independent prognostic relevance of miR-34b for PFS. For miR-34c this was confirmed only in the GSE73582 cohort. As described above the higher concordance between our study and the GSE73582 cohort is probably due to the usage of the same sample type in both studies.
In conclusion, our findings demonstrate that miR-34 family members play an essential role in the biology of OC, especially in HGSOC. Prominent differences between the expressions of miR-34 a/b/c were pointed out for HGSOC compared with LGSOC. High miR-34 a/b/c levels were independently associated with a favourable PFS, whereas for OS prognostic independency was confined to miR-34b and 34c.
Our study clearly underscores the tumor suppressive nature of the mir-34 family members in ovarian cancer.
Abbreviations
BMI1: BMI1 proto-oncogene, polycomb ring finger; BRAF: B-Raf proto-oncogene, serine/threonine kinase; BRCA1: BRCA1, DNA repair associated; BRCA2: BRCA2, DNA repair associated; CD44: CD44 molecule (Indian blood group); CI: confidence interval; DNA: deoxyribonucleic acid; E2F3a: E2F transcription factor 3a; EMT: epithelial-mesenchymal transition; FIGO: Fédération Internationale de Gynécologie et d'Obstétrique; HGSOC: high grade serous ovarian cancer; HR: hazard ratio; KRAS: KRAS proto-oncogene, GTPase; L1CAM: L1 cell adhesion molecule; LGSOC: low grade serous ovarian cancer; MET: mesenchymal-epithelial transition; miRNA: microRNA; NOTCH1: notch receptor 1; OC: ovarian cancer; OS: overall survival; PFS: progression free survival; SLUG: snail family transcriptional repressor 2; SNAIL: snail family transcriptional repressor 1; STIC: serous tubal intraepithelial carcinoma; TBP: TATA box binding protein; TP53: tumor protein p53; ZEB1: zinc finger E-box binding homeobox 1.
Acknowledgements
We thank M Fleischer, I Gaugg and A Wiedemair for their excellent technical assistance. The project was supported by the Verein zur Krebsforschung in der Frauenheilkunde and AstraZeneca (NCR-15-11443).
Competing Interests
The authors have declared that no competing interest exists.
References
1. Siegel RL, Miller KD, Jemal A. Cancer Statistics, 2017. CA Cancer J Clin. 2017;67(1):7-30
2. Marth C, Reimer D, Zeimet AG. Front-line therapy of advanced epithelial ovarian cancer: standard treatment. Ann Oncol. 2017;28(suppl_8):viii36-viii9
3. du Bois A, Reuss A, Pujade-Lauraine E, Harter P, Ray-Coquard I, Pfisterer J. Role of surgical outcome as prognostic factor in advanced epithelial ovarian cancer: a combined exploratory analysis of 3 prospectively randomized phase 3 multicenter trials: by the Arbeitsgemeinschaft Gynaekologische Onkologie Studiengruppe Ovarialkarzinom (AGO-OVAR) and the Groupe d'Investigateurs Nationaux Pour les Etudes des Cancers de l'Ovaire (GINECO). Cancer. 2009;115(6):1234-44
4. Pignata S, S CC, Du Bois A, Harter P, Heitz F. Treatment of recurrent ovarian cancer. Ann Oncol. 2017;28(suppl_8):viii51-viii6
5. Kurman RJ, Shih Ie M. The Dualistic Model of Ovarian Carcinogenesis: Revisited, Revised, and Expanded. Am J Pathol. 2016;186(4):733-47
6. Shih Ie M, Kurman RJ. Ovarian tumorigenesis: a proposed model based on morphological and molecular genetic analysis. Am J Pathol. 2004;164(5):1511-8
7. Ahmed AA, Etemadmoghadam D, Temple J, Lynch AG, Riad M, Sharma R. et al. Driver mutations in TP53 are ubiquitous in high grade serous carcinoma of the ovary. J Pathol. 2010;221(1):49-56
8. Kroeger PT Jr, Drapkin R. Pathogenesis and heterogeneity of ovarian cancer. Curr Opin Obstet Gynecol. 2017;29(1):26-34
9. Efeyan A, Serrano M. p53: guardian of the genome and policeman of the oncogenes. Cell cycle (Georgetown, Tex). 2007;6(9):1006-10
10. Lane DP. Cancer. p53, guardian of the genome. Nature. 1992;358(6381):15-6
11. Wong MY, Yu Y, Walsh WR, Yang JL. microRNA-34 family and treatment of cancers with mutant or wild-type p53 (Review). Int J Oncol. 2011;38(5):1189-95
12. Freed-Pastor WA, Prives C. Mutant p53: one name, many proteins. Genes Dev. 2012;26(12):1268-86
13. Brosh R, Rotter V. When mutants gain new powers: news from the mutant p53 field. Nature reviews Cancer. 2009;9(10):701-13
14. He X, He L, Hannon GJ. The guardian's little helper: microRNAs in the p53 tumor suppressor network. Cancer Res. 2007;67(23):11099-101
15. Chang TC, Wentzel EA, Kent OA, Ramachandran K, Mullendore M, Lee KH. et al. Transactivation of miR-34a by p53 broadly influences gene expression and promotes apoptosis. Mol Cell. 2007;26(5):745-52
16. Bommer GT, Gerin I, Feng Y, Kaczorowski AJ, Kuick R, Love RE. et al. p53-mediated activation of miRNA34 candidate tumor-suppressor genes. Curr Biol. 2007;17(15):1298-307
17. Hermeking H. The miR-34 family in cancer and apoptosis. Cell Death Differ. 2010;17(2):193-9
18. He L, He X, Lim LP, de Stanchina E, Xuan Z, Liang Y. et al. A microRNA component of the p53 tumour suppressor network. Nature. 2007;447(7148):1130-4
19. Vogt M, Munding J, Grüner M, Liffers S-T, Verdoodt B, Hauk J. et al. Frequent concomitant inactivation of miR-34a and miR-34b/c by CpG methylation in colorectal, pancreatic, mammary, ovarian, urothelial, and renal cell carcinomas and soft tissue sarcomas. Virchows Archiv. 2011;458(3):313-22
20. Goebel G, Berger R, Strasak AM, Egle D, Muller-Holzner E, Schmidt S. et al. Elevated mRNA expression of CHAC1 splicing variants is associated with poor outcome for breast and ovarian cancer patients. Br J Cancer. 2012;106(1):189-98
21. Bagnoli M, Canevari S, Califano D, Losito S, Maio MD, Raspagliesi F. et al. Development and validation of a microRNA-based signature (MiROvaR) to predict early relapse or progression of epithelial ovarian cancer: a cohort study. Lancet Oncol. 2016;17(8):1137-46
22. Youden WJ. Index for rating diagnostic tests. Cancer. 1950;3(1):32-5
23. Miles GD, Seiler M, Rodriguez L, Rajagopal G, Bhanot G. Identifying microRNA/mRNA dysregulations in ovarian cancer. BMC Res Notes. 2012;5:164
24. Corney DC, Hwang CI, Matoso A, Vogt M, Flesken-Nikitin A, Godwin AK. et al. Frequent downregulation of miR-34 family in human ovarian cancers. Clin Cancer Res. 2010;16(4):1119-28
25. Siemens H, Jackstadt R, Hunten S, Kaller M, Menssen A, Gotz U. et al. miR-34 and SNAIL form a double-negative feedback loop to regulate epithelial-mesenchymal transitions. Cell cycle (Georgetown, Tex). 2011;10(24):4256-71
26. Dong P, Xiong Y, Watari H, Hanley SJ, Konno Y, Ihira K. et al. MiR-137 and miR-34a directly target Snail and inhibit EMT, invasion and sphere-forming ability of ovarian cancer cells. J Exp Clin Cancer Res. 2016;35(1):132
27. Mani SA, Guo W, Liao MJ, Eaton EN, Ayyanan A, Zhou AY. et al. The epithelial-mesenchymal transition generates cells with properties of stem cells. Cell. 2008;133(4):704-15
28. Zhang L, Volinia S, Bonome T, Calin GA, Greshock J, Yang N. et al. Genomic and epigenetic alterations deregulate microRNA expression in human epithelial ovarian cancer. Proc Natl Acad Sci U S A. 2008;105(19):7004-9
29. Eitan R, Kushnir M, Lithwick-Yanai G, David MB, Hoshen M, Glezerman M. et al. Tumor microRNA expression patterns associated with resistance to platinum based chemotherapy and survival in ovarian cancer patients. Gynecol Oncol. 2009;114(2):253-9
30. Park EY, Chang E, Lee EJ, Lee HW, Kang HG, Chun KH. et al. Targeting of miR34a-NOTCH1 axis reduced breast cancer stemness and chemoresistance. Cancer Res. 2014;74(24):7573-82
31. Itamochi H, Kigawa J, Sugiyama T, Kikuchi Y, Suzuki M, Terakawa N. Low proliferation activity may be associated with chemoresistance in clear cell carcinoma of the ovary. Obstet Gynecol. 2002;100(2):281-7
32. Gershenson DM. Low-grade serous carcinoma of the ovary or peritoneum. Ann Oncol. 2016;27(Suppl 1):i45-i9
33. Ayhan A, Kurman RJ, Yemelyanova A, Vang R, Logani S, Seidman JD. et al. Defining the cut point between low-grade and high-grade ovarian serous carcinomas: a clinicopathologic and molecular genetic analysis. Am J Surg Pathol. 2009;33(8):1220-4
34. Concepcion CP, Han YC, Mu P, Bonetti C, Yao E, D'Andrea A. et al. Intact p53-dependent responses in miR-34-deficient mice. PLoS Genet. 2012;8(7):e1002797
35. Hermeking H. p53 enters the microRNA world. Cancer Cell. 2007;12(5):414-8
36. Raver-Shapira N, Marciano E, Meiri E, Spector Y, Rosenfeld N, Moskovits N. et al. Transcriptional activation of miR-34a contributes to p53-mediated apoptosis. Mol Cell. 2007;26(5):731-43
37. Corney DC, Flesken-Nikitin A, Godwin AK, Wang W, Nikitin AY. MicroRNA-34b and MicroRNA-34c are targets of p53 and cooperate in control of cell proliferation and adhesion-independent growth. Cancer Res. 2007;67(18):8433-8
38. Rokavec M, Li H, Jiang L, Hermeking H. The p53/miR-34 axis in development and disease. J Mol Cell Biol. 2014;6(3):214-30
39. Slabakova E, Culig Z, Remsik J, Soucek K. Alternative mechanisms of miR-34a regulation in cancer. Cell Death Dis. 2017;8(10):e3100
40. Lee CH, Subramanian S, Beck AH, Espinosa I, Senz J, Zhu SX. et al. MicroRNA profiling of BRCA1/2 mutation-carrying and non-mutation-carrying high-grade serous carcinomas of ovary. PLoS One. 2009;4(10):e7314
41. Gallardo E, Navarro A, Vinolas N, Marrades RM, Diaz T, Gel B. et al. miR-34a as a prognostic marker of relapse in surgically resected non-small-cell lung cancer. Carcinogenesis. 2009;30(11):1903-9
42. Reimer D, Hubalek M, Kiefel H, Riedle S, Skvortsov S, Erdel M. et al. Regulation of transcription factor E2F3a and its clinical relevance in ovarian cancer. Oncogene. 2011;30(38):4038-49
43. Reimer D, Hubalek M, Riedle S, Skvortsov S, Erdel M, Concin N. et al. E2F3a is critically involved in epidermal growth factor receptor-directed proliferation in ovarian cancer. Cancer Res. 2010;70(11):4613-23
44. Schirmer U, Doberstein K, Rupp AK, Bretz NP, Wuttig D, Kiefel H. et al. Role of miR-34a as a suppressor of L1CAM in endometrial carcinoma. Oncotarget. 2014;5(2):462-72
45. Kiefel H, Bondong S, Hazin J, Ridinger J, Schirmer U, Riedle S. et al. L1CAM: a major driver for tumor cell invasion and motility. Cell Adh Migr. 2012;6(4):374-84
46. Bondong S, Kiefel H, Hielscher T, Zeimet AG, Zeillinger R, Pils D. et al. Prognostic significance of L1CAM in ovarian cancer and its role in constitutive NF-kappaB activation. Ann Oncol. 2012;23(7):1795-802
47. Zeimet AG, Reimer D, Huszar M, Winterhoff B, Puistola U, Azim SA. et al. L1CAM in early-stage type I endometrial cancer: results of a large multicenter evaluation. J Natl Cancer Inst. 2013;105(15):1142-50
48. Roy R, Chun J, Powell SN. BRCA1 and BRCA2: different roles in a common pathway of genome protection. Nature reviews Cancer. 2011;12(1):68-78
Author contact
![]() Corresponding author: A. G. Zeimet, Tel: +43 51250481056; Fax: +43 51250423055; Email: Alain.Zeimetac.at; H. Fiegl, Tel: +43 51250482707; Fax: +43 51250423112; Email: Heidelinde.Fieglac.at.
Corresponding author: A. G. Zeimet, Tel: +43 51250481056; Fax: +43 51250423055; Email: Alain.Zeimetac.at; H. Fiegl, Tel: +43 51250482707; Fax: +43 51250423112; Email: Heidelinde.Fieglac.at.