Impact Factor ISSN: 1837-9664

 Global reach, higher impact
J Cancer 2020; 11(6):1393-1402. doi:10.7150/jca.30699 This issue Cite
Research Paper
Identification of key genes and pathways associated with esophageal squamous cell carcinoma development based on weighted gene correlation network analysis
Mingrui Shao, Wenya Li ![]() , Shiyang Wang, Zhenghua Liu
, Shiyang Wang, Zhenghua Liu
1. Department of Thoracic Surgery, The First Affiliated Hospital of China Medical University, Shenyang, Liaoning Province, China.
2. Department of Geriatric Surgery, The First Affiliated Hospital of China Medical University, Shenyang, Liaoning Province, China.
Received 2018-10-15; Accepted 2019-12-1; Published 2020-1-13
Abstract
Background: As one of the most aggressive malignancies, esophageal squamous cell carcinoma(ESCC) remains one of the leading causes of cancer related death worldwide. The majority of ESCCs are diagnosed at advanced stages with poor five-year survival rate, making it urgent to identify specific genes and pathways associated with its initiation and prognosis.
Materials and Methods: The differentially expressed genes in TCGA were analysed to construct a co-expression network by WGCNA. Gene ontology (GO) terms and Kyoto Encyclopedia of Genes and Genomes (KEGG) pathways analysis were performed for the selected genes. Module-clinical trait relationships were analyzed to explore the genes and pathways that associated with clinicopathological parameters of ESCC. Log-rank tests and COX regression were used to identify the prognosis-related genes.
Results: The brown module containing 716 genes which most significantly contributed to ESCC. GO analysis suggested enrichment of adaptive immune response, cyclin-dependent protein serine, regeneration and mRNA metabolic process. KEGG analysis indicated pathways including Cellular senescence, Ribosome biogenesis, Proteasome, Base excision repair and p53 signaling pathway. Clinical stage was associated with cyan module; clinical M was associated with grey60 module; clinical T was associated with darkturquoise module; while clinical N, histological type and cancer location were associated with turquoise module. Key genes of TCP1, COQ3, PTMA and MAPRE1 might be potential prognostic markers for ESCC.
Discussion: Differentially expressed genes and key modules contributing to initiation and progression in ESCC were identified by WGCNA. These findings provide novel insights into the mechanisms underlying the initiation, prognosis and treatment of ESCC.
Keywords: esophageal squamous cell carcinoma, weighted gene correlation network analysis, risk, prognosis.
Introduction
As one of the most aggressive malignancies, esophageal cancer remains one of the leading causes of cancer related death worldwide [1, 2]. Among the two main histological types of esophageal cancer including esophageal squamous cell carcinoma (ESCC) and esophageal adenocarcinoma (EAC), ESCC represents the dominant subtype in Asians and EAC incidence is higher in Western countries [3]. These two subtypes have different pathogenesis, biology features and clinical outcomes [4]. At present, the majority of ESCCs are diagnosed at advanced stages, the five-year survival rate of which still remains unfavourable with frequently metastasis and recurrence [5, 6]. Therefore, comprehensive researches are urgently needed to fully clarify critical molecular mechanisms related to the initiation, progression and prognosis of ESCC.
It has been widely accepted that alcohol drinking and tobacco consumption are certain risk factors for ESCC with synergistic effects [7, 8]. There is also evidence suggesting that possible association of human papillomavirus (HPV) with ESCC risk according to meta-analysis [9]. Studies have found that polymorphisms in aldehyde dehydrogenase 2 (ALDH2) gene also lead to the development of ESCC especially in Asian populations [10-12]. Multiple studies including high-throughput analysis revealed that genes and pathways involved in ESCC were related with cell cycle, differentiation, and Epidermal Growth Factor Receptor signalling [13]. In addition, epigenetic alterations including DNA methylation of such as APC, RB1 and CDKN2A, histone modification, and loss of genome imprinting also contribute to ESCC [14-16].
Although a number of genes and mechanisms have been proved to be closely implicated in the development of ESCC, the comprehensive picture of the whole genes and regulations of ESCC is still unclear. In recent years, bioinformatic methods become increasingly effective in exploration and analysis of multiple genes or proteins of complicated diseases. Weighted gene co-expression network analysis (WGCNA), a new gene co-expression network-based method, has been successfully used to screen biomarkers and pathways that could be applied in susceptibility genes, diagnose and treatment of cancer [17]. In this study, WGCNA was conducted to analyse data of TCGA data repository of ESCC to identify gene modules and biomarkers (hub genes) implicated in the pathogenesis, progression and prognosis of ESCC.
Materials and Methods
Acquiring and preparing genetic and clinical data
The RNA sequencing and clinical data of esophageal squamous cell carcinoma patients were downloaded from TCGA data repository (https://cancergenome.nih.gov/). The level of gene expression was measured as fragments per kilobase of transcript per million mapped reads (FPKM). Clinical data included the sample type, clinical TNM stage, histologic grade, cancer position and survival information. Samples with incomplete pathologic stage or histologic grade information were not included. As genes with little variation in expression usually represent noise, the most variant genes were filtered for network construction. Gene variabilities were measured by median absolute deviation (MAD).
Constructing gene co-expression network
Gene co-expression network was constructed by the WGCNA package in R and was visualized by Cytoscape software [18]. Power values were screened out by WGCNA algorithm in the construction of co-expression modules. Scale independence and average connectivity analysis of modules with different power value were performed by gradient test (power value ranging from 1 to 20). Appropriate power value was determined when the scale independence value was equal to 0.9. WGCNA algorithm was then used to construct the co-expression network and extract the gene information in the most relevant module. The criterion of co-expression weight> 2 was used to select the candidate network. Heatmap tool package in R language was adopted to describe the strength of the relationship among modules (strong or weak degree).
Relating modules to cancer risk and identifying the prognosis related genes
One of the advantages of WGCNA is that the correlation between modules and clinical parameters can be analyzed. The module eigengene (ME), which can be regarded as a representative of the gene expression profiles from a module, is defined as the first principal component of a given module. Given that the ME can summarize the gene expression profiles, we calculated the correlation between MEs and external sample type data. The gene in the most relevant module was chosen as the risk-related gene. Log-rank tests and COX regression were used to select the prognosis-related genes in the risk-related genes. R package survival was used to carry out log-rank tests and survminer package was used to plot Kaplan-Meier survival curves. In order to validate our findings, microarray dataset of GSE53625 from Gene Expression Omnibus (GEO, https://www.ncbi.nlm.nih.gov/geo/) in NCBI (The National Center for Biotechnology Information) containing 179 esophageal squamous cell carcinoma patients with prognosis information were used to confirm our results.
Gene ontology and pathway Enrichment analysis
To explore the potential biological themes and pathways of genes in risk-related module, the clusterprofiler package in R was used to annotate and visualize gene ontology (GO) terms [19] and Kyoto Encyclopedia of Genes and Genomes (KEGG) pathways [20].
Screening for candidate module with clinical significance and KEGG analysis
We calculated the correlation between MEs and external clinical data. p <0.05 suggested significant correlation. We selected the most relevant module in each clinical data for analysis. KEGG pathway analysis was used to enrich the related genes.
Results
Gene co-expression network of ESCC
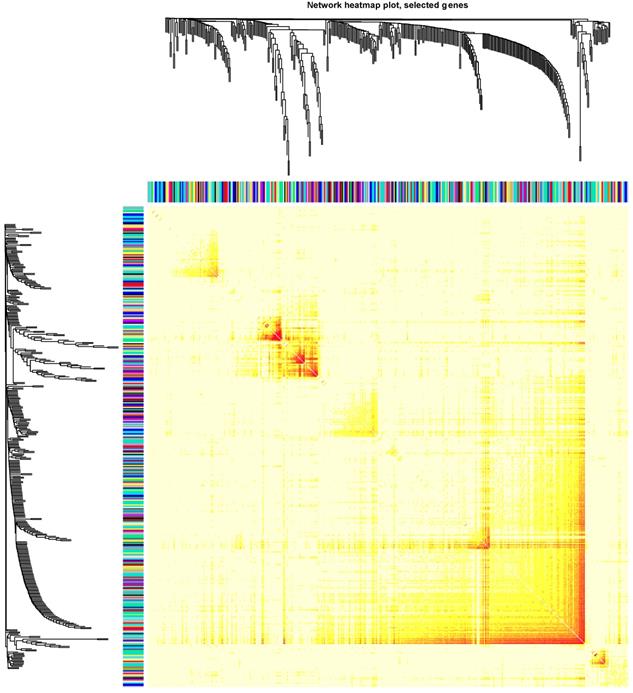
Clinical and level-3 RNA sequencing data for 162 esophageal squamous cell carcinoma samples and 11 normal samples were obtained from TCGA database. For module detection, the 15121 most variant genes were selected according to MAD value for further analysis. When the value of soft thresholding power β was 4, the connectivity between genes met a scale-free network distribution (Fig. S1). Altogether 21 modules were identified by hierarchical clustering and the Dynamic branch Cutting. Each module was assigned a unique color as an identifier. Interaction relationship analysis of co-expression genes was shown in Figure 1. The number of genes in modules ranged from 34 to 2353. The grey module represented a gene set that was not assigned to any of the modules.
The connectivity analysis of critical genes in different module
The risk related module in the WGCNA algorithm
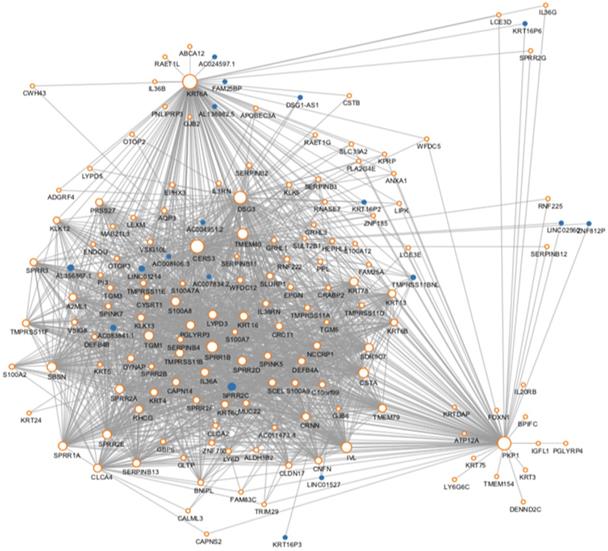
We then use the cancer type as the Clinical phenotype to select the most relevant module with the occurrence of ESCC. Finally, the brown module was selected (Fig. S2). The brown module contained 716 genes. Then we constructed the co-expression network with the criterion of co-expression weight >2. As was shown in Figure 2, a total of 161 genes were selected and their multiple interactions were visualized. The size represents the connection numbers and the color represents the fold change compared by the cancer and normal samples.
The protein-protein interaction network of the genes in the risk-related brown module of ESCC.
Enrichment analysis of the brown module
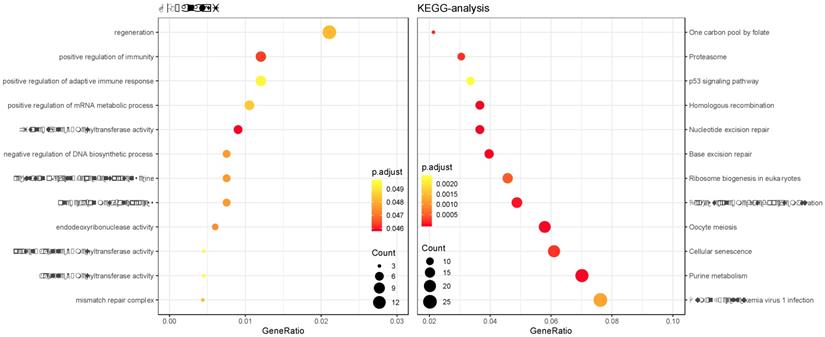
GO and KEGG enrichment analysis was performed on the genes in the constructed cancer-risk-related module. Altogether 984 terms showed difference in GO enrichment (Table 1). As was illustrated in Figure 3, this module in GO analysis was related with biological process of regulation of adaptive immune response, regulation of cyclin-dependent protein serine, regeneration and positive regulation of mRNA metabolic process. According to the KEGG analysis, 19 pathways were associated with brown module including Cellular senescence, Ribosome biogenesis in eukaryotes, Proteasome, Base excision repair and p53 signaling pathway.
Top 5 enrichment analysis of the brown module
| Ontology | ID | Description | GeneRatio | adjusted P | Count |
|---|---|---|---|---|---|
| BP | GO:0002821 | positive regulation of adaptive immune response | 8/664 | 0.049372 | 8 |
| BP | GO:1903313 | positive regulation of mRNA metabolic process | 7/664 | 0.0485 | 7 |
| BP | GO:0031099 | regeneration | 14/664 | 0.048208 | 14 |
| BP | GO:0006730 | one-carbon metabolic process | 5/664 | 0.047667 | 5 |
| BP | GO:0045737 | positive regulation of cyclin-dependent protein serine/threonine kinase activity | 5/664 | 0.047667 | 5 |
| CC | GO:0030687 | preribosome, large subunit precursor | 4/684 | 0.037033 | 4 |
| CC | GO:0000932 | P-body | 8/684 | 0.035763 | 8 |
| CC | GO:0000315 | organellar large ribosomal subunit | 6/684 | 0.035241 | 6 |
| CC | GO:0005762 | mitochondrial large ribosomal subunit | 6/684 | 0.035241 | 6 |
| CC | GO:0036464 | cytoplasmic ribonucleoprotein granule | 14/684 | 0.033517 | 14 |
| MF | GO:0016273 | arginine N-methyltransferase activity | 3/663 | 0.049595 | 3 |
| MF | GO:0016274 | protein-arginine N-methyltransferase activity | 3/663 | 0.049595 | 3 |
| MF | GO:0016889 | endodeoxyribonuclease activity, producing 3'-phosphomonoesters | 4/663 | 0.047419 | 4 |
| MF | GO:0018024 | histone-lysine N-methyltransferase activity | 6/663 | 0.045899 | 6 |
| MF | GO:0004540 | ribonuclease activity | 10/663 | 0.045899 | 10 |
| KEGG | hsa04115 | p53 signaling pathway | 11/328 | 0.002355 | 11 |
| KEGG | hsa05166 | Human T-cell leukemia virus 1 infection | 25/328 | 0.001213 | 25 |
| KEGG | hsa03008 | Ribosome biogenesis in eukaryotes | 15/328 | 0.000475 | 15 |
| KEGG | hsa04218 | Cellular senescence | 20/328 | 0.000221 | 20 |
| KEGG | hsa03050 | Proteasome | 10/328 | 0.000207 | 10 |
Gene Ontology analysis and KEGG pathway enrichment analysis for genes in the risk-related brown module of ESCC.
Prognosis analysis of the brown module
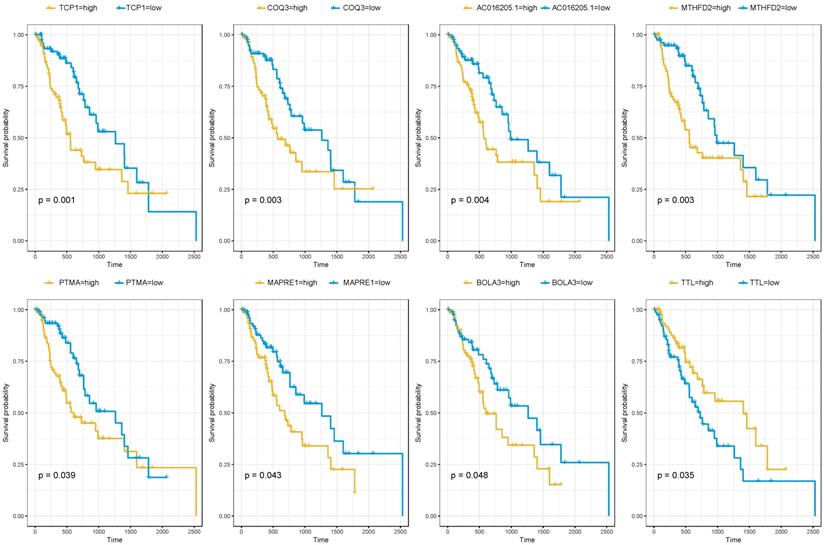
Since the brown module were selected from the modules related to patients' cancer type. It was of great significance to evaluate the potentiality of them to serve as prognostic biomarkers. Among the 716 genes, 39 genes were associated with the prognosis of esophageal squamous cell carcinoma (Table 2). As was summarized in Figure 4, the top four up-regulated genes which indicated a poor prognosis included TCP1 (HR=2.427, P=0.001), COQ3 (HR=2.247, P=0.003), AC016205.1 (HR=2.227, P=0.004) and MTHFD2 (HR=2.179, P=0.003). Of the top four down-regulated genes, PTMA (HR=1.706, P=0.039), MAPRE1 (HR=1.698, P=0.043) and BOLA3 (HR=1.667, P=0.048) significantly associated with poor prognosis while TTL predicted better survival (HR=0.572, P=0.035).
Prognosis analysis of the brown module
| Gene | Gene full name | Location | HR | Lower limit | Upper limit | P |
|---|---|---|---|---|---|---|
| TCP1 | t-complex 1 | 6q25.3-q26 | 2.427 | 1.439 | 4.098 | 0.001 |
| MTHFD2 | methylenetetrahydrofolate dehydrogenase (NADP+ dependent) 2 | 2p13.1 | 2.179 | 1.302 | 3.650 | 0.003 |
| COQ3 | coenzyme Q3, methyltransferase | 6q16.2 | 2.247 | 1.318 | 3.831 | 0.003 |
| AC016205.1 | MIR924 Host Gene | 18q12.2 | 2.227 | 1.284 | 3.861 | 0.004 |
| VBP1 | VHL binding protein 1 | Xq28 | 2.088 | 1.230 | 3.546 | 0.006 |
| MED30 | Mediator Complex Subunit 30 | 8q24.11 | 2.110 | 1.208 | 3.690 | 0.009 |
| SNRPC | small nuclear ribonucleoprotein polypeptide C | 6p21.31 | 1.976 | 1.178 | 3.311 | 0.010 |
| NONO | non-POU domain containing, octamer-binding | Xq13.1 | 1.972 | 1.170 | 3.333 | 0.011 |
| SNRPB | small nuclear ribonucleoprotein polypeptides B and B1 | 20p13 | 1.961 | 1.157 | 3.311 | 0.012 |
| NUDT21 | nudix hydrolase 21 | 16q12.2 | 1.992 | 1.164 | 3.413 | 0.012 |
| ALYREF | Aly/REF Export Factor | 17q25.3 | 1.887 | 1.138 | 3.125 | 0.014 |
| CCT4 | chaperonin containing TCP1 subunit 4 | 2p15 | 1.931 | 1.133 | 3.289 | 0.016 |
| IRAK1 | interleukin 1 receptor associated kinase 1 | Xq28 | 1.866 | 1.110 | 3.135 | 0.019 |
| AHSA1 | activator of Hsp90 ATPase activity 1 | 14q24 | 1.832 | 1.095 | 3.058 | 0.021 |
| CDT1 | chromatin licensing and DNA replication factor 1 | 16q24.3 | 1.835 | 1.095 | 3.067 | 0.021 |
| CCT2 | chaperonin containing TCP1 subunit 2 | 12q15 | 1.789 | 1.080 | 2.967 | 0.024 |
| HNRNPD | heterogeneous nuclear ribonucleoprotein D | 4q21 | 1.808 | 1.082 | 3.021 | 0.024 |
| SAAL1 | Serum Amyloid A Like 1 | 11p15.1 | 1.783 | 1.073 | 2.959 | 0.026 |
| SNRPE | small nuclear ribonucleoprotein polypeptide E | 1q32 | 1.805 | 1.074 | 3.040 | 0.026 |
| SPDL1 | spindle apparatus coiled-coil protein 1 | 5q35.1 | 1.789 | 1.066 | 3.003 | 0.028 |
| YARS2 | tyrosyl-tRNA synthetase 2 | 12p11.21 | 1.795 | 1.063 | 3.030 | 0.029 |
| E2F7 | E2F Transcription Factor 7 | 12q21.2 | 1.828 | 1.055 | 3.165 | 0.031 |
| MRPL18 | mitochondrial ribosomal protein L18 | 6q25.3 | 1.733 | 1.048 | 2.865 | 0.032 |
| LSM5 | LSM5 homolog, U6 small nuclear RNA and mRNA degradation associated | 7p14.3 | 1.745 | 1.049 | 2.907 | 0.032 |
| TTL | Tubulin Tyrosine Ligase | 2q14.1 | 0.572 | 0.340 | 0.962 | 0.035 |
| PTGES3 | prostaglandin E synthase 3 | 12q13.3 | 1.733 | 1.040 | 2.890 | 0.035 |
| SRSF2 | serine and arginine rich splicing factor 2 | 17q25.1 | 1.718 | 1.040 | 2.841 | 0.035 |
| HSPD1 | heat shock protein family D (Hsp60) member 1 | 2q33.1 | 1.718 | 1.031 | 2.865 | 0.038 |
| SF3A3 | splicing factor 3a subunit 3 | 1p34.3 | 1.712 | 1.029 | 2.849 | 0.039 |
| PTMA | prothymosin, alpha | 2q37.1 | 1.706 | 1.026 | 2.833 | 0.039 |
| CTPS1 | CTP synthase 1 | 1p34.1 | 1.684 | 1.022 | 2.770 | 0.041 |
| MAGOHB | mago homolog B, exon junction complex core component | 12p13.2 | 1.709 | 1.020 | 2.865 | 0.042 |
| MAPRE1 | microtubule associated protein RP/EB family member 1 | 20q11.1-q11.23 | 1.698 | 1.016 | 2.833 | 0.043 |
| MCM8 | minichromosome maintenance 8 homologous recombination repair factor | 20p12.3 | 1.692 | 1.014 | 2.825 | 0.044 |
| TRIM37 | tripartite motif containing 37 | 17q23.2 | 0.596 | 0.360 | 0.989 | 0.045 |
| HNRNPAB | heterogeneous nuclear ribonucleoprotein A/B | 5q35.3 | 1.669 | 1.010 | 2.762 | 0.046 |
| STRAP | serine/threonine kinase receptor associated protein | 12p12.3 | 1.706 | 1.004 | 2.907 | 0.048 |
| BOLA3 | BolA Family Member 3 | 2p13.1 | 1.667 | 1.005 | 2.762 | 0.048 |
| LSM6 | LSM6 homolog, U6 small nuclear RNA and mRNA degradation associated | 4q31.22 | 1.698 | 1.005 | 2.865 | 0.048 |
The correlation between the expression levels of key genes of risk-associated brown module and the survival of ESCC patients.
Altogether 179 esophageal squamous cell carcinoma patients with prognosis information of microarray GSE53625 were used to validate our results. As was shown in Table 4, AC016205.1 (P=0.013), PTMA (P=0.023), TTL (P=0.013) still showed significant relation with prognosis of ESCC patients, while MTHFD2 (P=0.082) indicated borderline significant association (Table 4).
Verification for top 4 prognosis gene in GEO datasets
| Gene | Gene full name | HR(95% CI) | P | GSE53625_P |
|---|---|---|---|---|
| TCP1 | t-complex 1 | 2.427(1.439-4.098) | 0.001 | 0.196 |
| MTHFD2 | methylenetetrahydrofolate dehydrogenase (NADP+ dependent) 2 | 2.179(1.302-3.65) | 0.003 | 0.082 |
| COQ3 | coenzyme Q3, methyltransferase | 2.247(1.318-3.831) | 0.003 | 0.130 |
| AC016205.1 | MIR924 Host Gene | 2.227(1.284-3.861) | 0.004 | 0.013 |
| PTMA | prothymosin, alpha | 1.706(1.026-2.833) | 0.039 | 0.023 |
| MAPRE1 | microtubule associated protein RP/EB family member 1 | 1.698(1.016-2.833) | 0.043 | 0.519 |
| BOLA3 | BolA Family Member 3 | 1.667(1.005-2.762) | 0.048 | 0.781 |
| TTL | Tubulin Tyrosine Ligase | 0.572(0.34-0.962) | 0.035 | 0.013 |
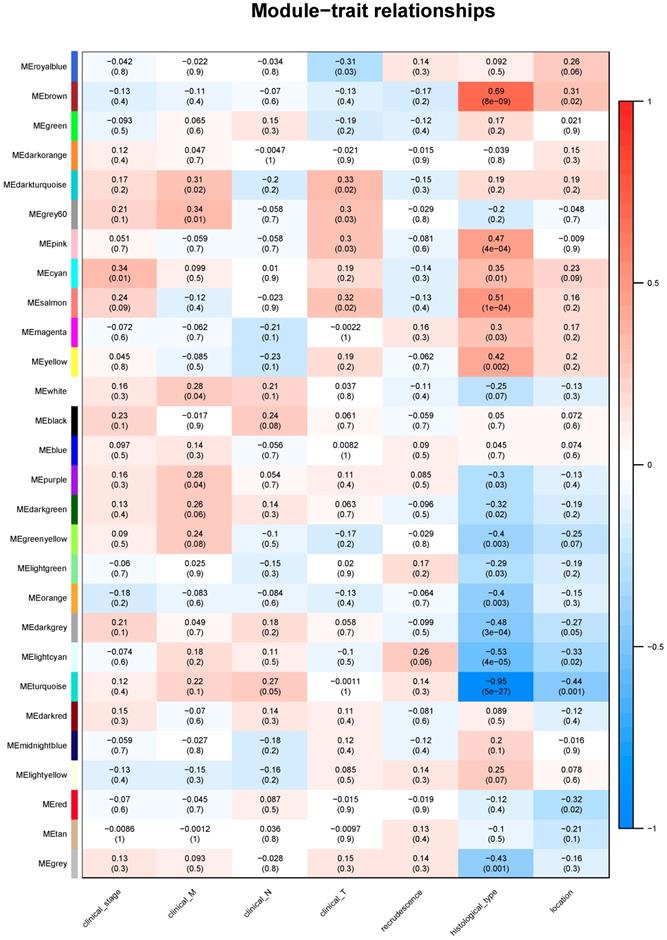
Module-clinical trait relationships
Identifying genes associated with a certain clinical trait is of great value to explore the molecular mechanisms behind the trait. In the present study, the clinical parameters of ESCC patients, including clinical T, clinical N, clinical M, clinical stage, recrudescence stage, histological type and cancer location were involved in the module-trait relationship (MTR) analysis. As was suggested in Figure 5, clinical stage was associated with cyan module; clinical M was associated with grey60 module; clinical T was associated with darkturquoise module; while clinical N, histological type and cancer location were associated with turquoise module. No module correlated with recrudescence.
The module-clinical trait relationships of genes involved in ESCC.
KEGG analysis of clinical related module
We then performed KEGG pathway analysis of the candidate module. The results indicated that genes of cyan module were enriched in Cell cycle; grey60 module was associated with Ribosome; darkturquoise module was related with RNA transport; turquoise module was associated with Fat digestion and absorption, Tight junction, Maturity onset diabetes of the young, Protein digestion and absorption and Fructose and mannose metabolism (Table 3).
KEGG analysis of clinical related module
| Phenotype | Module | ID | Description | GeneRatio | Adjusted P | Count |
|---|---|---|---|---|---|---|
| Clinical stage | cyan | hsa04110 | Cell cycle | 4/29 | 0.0012644 | 4 |
| Clinical M | grey60 | hsa03010 | Ribosome | 4/24 | 0.0013257 | 4 |
| Clinical T | darkturquoise | hsa03013 | RNA transport | 6/45 | 0.0005229 | 6 |
| Clinical NHistological typeCancer location | turquoise | hsa04975 | Fat digestion and absorption | 14/607 | 2.21E-06 | 14 |
| hsa04530 | Tight junction | 31/607 | 1.499E-05 | 31 | ||
| hsa04950 | Maturity onset diabetes of the young | 10/607 | 1.936E-05 | 10 | ||
| hsa04974 | Protein digestion and absorption | 20/607 | 2.754E-05 | 20 | ||
| hsa00051 | Fructose and mannose metabolism | 11/607 | 3.566E-05 | 11 |
Discussion
Although significant progresses have been made in studies concerning the risk and development of ESCC, our understanding of the complex mechanisms of ESCC is still limited. In this study, we conducted a differential expression analysis followed by WGCNA to detect genes and pathways associated with the occurrence, clinical parameters and prognosis of ESCC. Finally, key modules were identified which contribute to the risk (brown module) and clinicopathological parameters (cyan module, grey60 module, darkturquoisemodule and turquoise module) of ESCC. In addition, enrichment analysis of the genes in core modules suggested significant involvement of pathways such as Cellular senescence, Ribosome biogenesis in eukaryotes, Proteasome, Base excision repair and p53 signalling pathway.
In this present study, RNA sequencing data for 162 esophageal squamous cell carcinoma samples and 11 normal samples from TCGA were systematically analyzed. According to the WGCNA analysis of most variant genes, altogether 21 modules were identified and each module was assigned a unique color as an identifier. The number of genes in modules ranged from 34 to 2353. The brown module containing 716 genes was selected when we used the cancer type as the Clinical phenotype, indicating its close involvement in the development of ESCC. GO enrichment analysis were then performed on the genes in the constructed cancer-risk-related module, suggesting significance of biological process including adaptive immune, cyclin-dependent protein serine, regeneration and mRNA metabolic process. It has been reported that immune response and immune escape might play a critical role in ESCC progression and therapy [21, 22]. In addition, key mRNA metabolic procedure such as alternative splicing has also been detected in ESCC. Alternative splicing isoforms of LOXL2, VIL2, OSMRβ and MUC1 have been reported to contribute to ESCC development and progression [23-26]. From this point of view, the specific role of immune response and altered mRNA metabolic process in ESCC require future investigations to elucidate. As for key pathways of KEGG enrichment, aberrant base excision repair capacity and altered p53 signaling pathways have been found to be associated with ESCC development by a number of studies [27, 28]. Pathways of cellular senescence, ribosome biogenesis in eukaryotes and proteasome might be novel research directions for physicians and surgeons for ESCC.
The five-year survival rate of ESCC currently remains unsatisfactory despite recent improvements in treatments of surgical resection and adjuvant chemotherapy. It was therefore of great significance to evaluate the potentiality of key factors to serve as prognostic biomarkers. We eventually screened 39 prognosis-related genes in ESCC after analyzing the risk-associated brown module. Aberrant TCP1 gene status has been detected in hepatocellular carcinoma, breast cancer and colorectal cancer, but no study has been performed for its effect in ESCC [29-31]. MTHFD2 RNA and protein are remarkably increased in many types of cancers and correlated with worse survival in breast cancer according to a comprehensive analysis of RNA profiles of 1,454 metabolic enzymes across 1,981 tumors spanning 19 cancer types [32]. Although some of the prognosis-related genes we identified have been investigated in various types of cancers, limited information was known about their roles in ESCC until now. One limitation of this study is that most results were generated by analysis of publicly available data, further studies based on larger populations and molecular mechanism researches are therefore needed to confirm the results of our study.
In order to explore the genes and modules that associated with clinicopathological parameters of ESCC, we also performed module-clinical trait relationships analysis. We finally detected specific modules which determine the clinical stage, TNM classification, histological type and cancer location. Pathway analysis of the selected modules indicated that these genes enriched in Cell cycle, Ribosome, RNA transport, Fat digestion and absorption, Tight junction, Maturity onset diabetes of the young, Protein digestion and absorption and Fructose and mannose metabolism. Remodeling of energetic metabolism is a hallmark of malignant tumor, by which tumor cells changes themselves and the environment into more suitable conditions for growth and invasion [33]. According to our findings, aberrant metabolism of carbohydrate, fat and protein might be closely related to the progression of ESCC. In addition, alternations in functions of ribosome, RNA transport might also be promising research directions for ESCC.
In summary, differentially expressed genes and key modules contributing to initiation and progression in ESCC were identified by means of WGCNA. Pathways including cellular senescence, ribosome biogenesis in eukaryotes, Proteasome, base excision repair, fat digestion and absorption and p53 signalling might be closely related with ESCC development. Key genes of TCP1, COQ3, PTMA and MAPRE1 might be potential prognostic markers for ESCC. These findings provide novel insights into the mechanisms underlying the etiology, prognosis and treatment of ESCC.
Supplementary Material
Supplementary figures and tables.
Acknowledgements
This study was supported by Natural Science Foundation of Liaoning Province (grant no. 2015020561), Wu JiePing Medical Found (grant no. 320.6750.18293) and the Fund for Scientific Research of The First Hospital of China Medical University (grant no. fsfh1514).
Competing Interests
The authors have declared that no competing interest exists.
References
1. Siegel RL, Miller KD, Jemal A. Cancer statistics, 2016. CA: a cancer journal for clinicians. 2016;66(1):7-30
2. Enzinger PC, Mayer RJ. Esophageal cancer. The New England journal of medicine. 2003;349(23):2241-2252
3. Siewert JR, Ott K. Are squamous and adenocarcinomas of the esophagus the same disease? Seminars in radiation oncology. 2007;17(1):38-44
4. Brown LM, Devesa SS, Chow WH. Incidence of adenocarcinoma of the esophagus among white Americans by sex, stage, and age. Journal of the National Cancer Institute. 2008;100(16):1184-1187
5. Zeng H, Zheng R, Zhang S, Zuo T, Xia C, Zou X, Chen W. Esophageal cancer statistics in China, 2011: Estimates based on 177 cancer registries. Thoracic cancer. 2016;7(2):232-237
6. Rustgi AK, El-Serag HB. Esophageal carcinoma. The New England journal of medicine. 2014;371(26):2499-2509
7. Kumagai N, Wakai T, Akazawa K, Ling Y, Wang S, Shan B, Okuhara Y, Hatakeyama Y, Kataoka H. Heavy alcohol intake is a risk factor for esophageal squamous cell carcinoma among middle-aged men: A case-control and simulation study. Molecular and clinical oncology. 2013;1(5):811-816
8. Rafiq R, Shah IA, Bhat GA, Lone MM, Islami F, Boffetta P, Dar NA. Secondhand Smoking and the Risk of Esophageal Squamous Cell Carcinoma in a High Incidence Region, Kashmir, India: A Case-control-observational Study. Medicine. 2016;95(1):e2340
9. Yong F, Xudong N, Lijie T. Human papillomavirus types 16 and 18 in esophagus squamous cell carcinoma: a meta-analysis. Annals of epidemiology. 2013;23(11):726-734
10. Cui R, Kamatani Y, Takahashi A, Usami M, Hosono N, Kawaguchi T, Tsunoda T, Kamatani N, Kubo M, Nakamura Y. et al. Functional variants in ADH1B and ALDH2 coupled with alcohol and smoking synergistically enhance esophageal cancer risk. Gastroenterology. 2009;137(5):1768-1775
11. Wu C, Kraft P, Zhai K, Chang J, Wang Z, Li Y, Hu Z, He Z, Jia W, Abnet CC. et al. Genome-wide association analyses of esophageal squamous cell carcinoma in Chinese identify multiple susceptibility loci and gene-environment interactions. Nature genetics. 2012;44(10):1090-1097
12. Zhang GH, Mai RQ, Huang B. Meta-analysis of ADH1B and ALDH2 polymorphisms and esophageal cancer risk in China. World journal of gastroenterology. 2010;16(47):6020-6025
13. Zhang W, Zhu H, Liu X, Wang Q, Zhang X, He J, Sun K, Liu X, Zhou Z, Xu N. et al. Epidermal growth factor receptor is a prognosis predictor in patients with esophageal squamous cell carcinoma. The Annals of thoracic surgery. 2014;98(2):513-519
14. Hoshimoto S, Takeuchi H, Ono S, Sim MS, Huynh JL, Huang SK, Marzese DM, Kitagawa Y, Hoon DS. Genome-wide hypomethylation and specific tumor-related gene hypermethylation are associated with esophageal squamous cell carcinoma outcome. Journal of thoracic oncology: official publication of the International Association for the Study of Lung Cancer. 2015;10(3):509-517
15. Kaz AM, Grady WM. Epigenetic biomarkers in esophageal cancer. Cancer letters. 2014;342(2):193-199
16. Toh Y, Egashira A, Yamamoto M. Epigenetic alterations and their clinical implications in esophageal squamous cell carcinoma. General thoracic and cardiovascular surgery. 2013;61(5):262-269
17. Langfelder P, Horvath S. WGCNA: an R package for weighted correlation network analysis. BMC bioinformatics. 2008;9:559
18. Shannon P, Markiel A, Ozier O, Baliga NS, Wang JT, Ramage D, Amin N, Schwikowski B, Ideker T. Cytoscape: a software environment for integrated models of biomolecular interaction networks. Genome research. 2003;13(11):2498-2504
19. Ashburner M, Ball CA, Blake JA, Botstein D, Butler H, Cherry JM, Davis AP, Dolinski K, Dwight SS, Eppig JT. et al. Gene ontology: tool for the unification of biology. The Gene Ontology Consortium. Nature genetics. 2000;25(1):25-29
20. Kanehisa M, Goto S, Kawashima S, Okuno Y, Hattori M. The KEGG resource for deciphering the genome. Nucleic acids research. 2004;32(Database issue):D277-280
21. Geng Y, Shao Y, Zhu D, Zheng X, Zhou Q, Zhou W, Ni X, Wu C, Jiang J. Systemic Immune-Inflammation Index Predicts Prognosis of Patients with Esophageal Squamous Cell Carcinoma: A Propensity Score-matched Analysis. Scientific reports. 2016;6:39482
22. Dadkhah E, Naseh H, Farshchian M, Memar B, Sankian M, Bagheri R, Forghanifard MM, Montazer M, Kazemi Noughabi M, Hashemi M. et al. A cancer-array approach elucidates the immune escape mechanism and defects in the DNA repair system in esophageal squamous cell carcinoma. Archives of Iranian medicine. 2013;16(8):463-470
23. Lv GQ, Zou HY, Liao LD, Cao HH, Zeng FM, Wu BL, Xie JJ, Fang WK, Xu LY, Li EM. Identification of a novel lysyl oxidase-like 2 alternative splicing isoform, LOXL2 Deltae13, in esophageal squamous cell carcinoma. Biochemistry and cell biology = Biochimie et biologie cellulaire. 2014;92(5):379-389
24. Kahkhaie KR, Moaven O, Abbaszadegan MR, Montazer M, Gholamin M. Specific MUC1 splice variants are correlated with tumor progression in esophageal cancer. World journal of surgery. 2014;38(8):2052-2057
25. Kausar T, Sharma R, Hasan MR, Saraya A, Chattopadhyay TK, Gupta SD, Ralhan R. Overexpression of a splice variant of oncostatin M receptor beta in human esophageal squamous carcinoma. Cellular oncology (Dordrecht). 2011;34(3):177-187
26. Zhang XD, Xie JJ, Liao LD, Long L, Xie YM, Li EM, Xu LY. 12-O-Tetradecanoylphorbol-13-Acetate Induces Up-Regulated Transcription of Variant 1 but Not Variant 2 of VIL2 in Esophageal Squamous Cell Carcinoma Cells via ERK1/2/AP-1/Sp1 Signaling. PloS one. 2015;10(4):e0124680
27. Lin DC, Du XL, Wang MR. Protein alterations in ESCC and clinical implications: a review. Diseases of the esophagus: official journal of the International Society for Diseases of the Esophagus. 2009;22(1):9-20
28. Ohashi S, Miyamoto S, Kikuchi O, Goto T, Amanuma Y, Muto M. Recent Advances From Basic and Clinical Studies of Esophageal Squamous Cell Carcinoma. Gastroenterology. 2015;149(7):1700-1715
29. Coghlin C, Carpenter B, Dundas SR, Lawrie LC, Telfer C, Murray GI. Characterization and over-expression of chaperonin t-complex proteins in colorectal cancer. The Journal of pathology. 2006;210(3):351-357
30. Cui X, Hu ZP, Li Z, Gao PJ, Zhu JY. Overexpression of chaperonin containing TCP1, subunit 3 predicts poor prognosis in hepatocellular carcinoma. World journal of gastroenterology. 2015;21(28):8588-8604
31. Guest ST, Kratche ZR, Bollig-Fischer A, Haddad R, Ethier SP. Two members of the TRiC chaperonin complex, CCT2 and TCP1 are essential for survival of breast cancer cells and are linked to driving oncogenes. Experimental cell research. 2015;332(2):223-235
32. Nilsson R, Jain M, Madhusudhan N, Sheppard NG, Strittmatter L, Kampf C, Huang J, Asplund A, Mootha VK. Metabolic enzyme expression highlights a key role for MTHFD2 and the mitochondrial folate pathway in cancer. Nature communications. 2014;5:3128
33. Hanahan D, Weinberg RA. Hallmarks of cancer: the next generation. Cell. 2011;144(5):646-674
Author contact
![]() Corresponding author: Prof Wen-ya Li, E-mail: saint5288com, Phone: 86-13514288257, Zip Code: 110001. Department of Thoracic Surgery, The First Affiliated Hospital of China Medical University, NO.155 North Nanjing Street, Heping District, Shenyang, Liaoning Province, China.
Corresponding author: Prof Wen-ya Li, E-mail: saint5288com, Phone: 86-13514288257, Zip Code: 110001. Department of Thoracic Surgery, The First Affiliated Hospital of China Medical University, NO.155 North Nanjing Street, Heping District, Shenyang, Liaoning Province, China.