Impact Factor ISSN: 1837-9664

 Global reach, higher impact
J Cancer 2019; 10(25):6384-6394. doi:10.7150/jca.30656 This issue Cite
Research Paper
The screening of pivotal gene expression signatures and biomarkers in renal carcinoma
Hailong Ruan1,2*, Sen Li1,2*, Junwei Tong1,2*, Qi Cao1,2*, Zhengshuai Song1,2, Keshan Wang1,2, Yu huang1,2, Lin Bao1,2, Xuanyu Chen1,2, Hongmei Yang3, Ke Chen1,2 ![]() , Xiaoping Zhang1,2
, Xiaoping Zhang1,2 ![]()
1. Department of Urology, Union Hospital, Tongji Medical College, Huazhong University of Science and Technology, Wuhan 430022, China
2. Institute of Urology, Union Hospital, Tongji Medical College, Huazhong University of Science and Technology, Wuhan 430022, China
3. Department of Pathogenic Biology, School of Basic Medicine, Huazhong University of Science and Technology, Wuhan 430030, China
*Contributed equally
Received 2019-7-10; Accepted 2019-9-20; Published 2019-10-19
Abstract
Renal cell carcinoma (RCC) is one of the most common malignancies in the urinary system, among which the proportion of clear cell RCC (ccRCC) is over 80%. This study aims to explore potential signaling pathways and key biomarkers that drive RCC progression. The RCC GEO Datasets GSE15641 was featured to screen differentially expressed genes (DEGs). The pathway enrichment and functional annotation of differentially expressed genes were analyzed using the Kyoto Encyclopedia of Genes and Genomes (KEGG) and the Gene Ontology (GO). We screened Hub genes from DEGs using protein-protein interaction (PPI) networks and Cytoscape software. The survival and diagnostic analysis of these hub genes was performed to evaluate their potential prognostic and diagnostic value for ccRCC. In GSE15641 dataset, 598 DEGs were captured according to screening criteria (406 up-regulated genes and 192 down-regulated genes). Meanwhile, 15 hub genes were screened out from DEGs using PPI and Cytoscape. Kaplan Meier and ROC curve analysis identified three potential prognostic and diagnostic biomarkers (TGFB1, TIMP1 and VIM) for ccRCC from 15 hub genes. Gene set enrichment analysis (GSEA) revealed that these three dysregulated genes are mainly enriched in primary immunodeficiency, ECM receptor interaction, cytokine receptor interaction and natural killer cell-mediated cytotoxicity pathway. In summary, our findings discovered pivotal gene expression signatures and signaling pathways in the progression of ccRCC. TGFB1, TIMP1 and VIM might contribute to the progression of ccRCC, which could have potential as biomarkers or therapeutic targets for ccRCC.
Keywords: hub genes, clear cell renal cell carcinoma, biomarkers, bioinformatics, differentially expressed gene
Introduction
Renal cell carcinoma (RCC) is one of the most common malignant tumors in the genitourinary tract. RCC can be divided into many pathological subtypes, among which clear cell RCC (ccRCC) is the most common subtype. Current major treatments for ccRCC include surgical resection, targeted drug therapy and immunotherapy. Although, in recent years, surgical techniques have been continuously improved and targeted drugs have been used clinically, the prognosis of some patients with advanced or metastatic ccRCC is still not ideal [1]. Moreover, ccRCC is not sensitive to traditional chemoradiotherapy and possesses the risk of high metastasis and high mortality, resulting in poor prognosis [2]. Therefore, early diagnosis and early treatment are the key steps to improve the cure rate of ccRCC. However, early accurate diagnosis of ccRCC remains a great challenge for clinicians [3], and there is a lack of diagnostic biomarkers at this stage.
Mutation and abnormal expression of genes contribute to the initiation and progression of tumors. Mastering the changes in the characteristics of key genes facilitates a comprehensive understanding of ccRCC progression and screening for molecular markers. Numerous studies have confirmed that VHL mutations are key drivers of ccRCC initiation and development [4-6], and that VHL mutations can serve as prognostic markers for ccRCC [7]. A separate VHL mutation is not enough to cause ccRCC, as the formation of ccRCC is a complex biological process involving multiple genes. Previous studies have identified that mutations and abnormal expression of PBRM1 [8], TCEB1 [9] and PP5 [10] contribute to the progression of ccRCC. Comprehensive insight into genetic characteristics of ccRCC could help us discover novel diagnostic biomarkers and therapeutic targets for precise treatment of ccRCC patients.
The wide application of high-throughput gene microarray expression profiling for exploring global genomes molecular landscape could help us easily find differentially expressed genes (DEGs) from cancerous and para-cancerous tissues. However, the application of microarray expression profiles in clinical practice is largely limited, because thousands of genes are identified by microarray expression profiles, resulting in lack of relevant experimental validation and statistical analysis [11]. To apply these differentially expressed genes to clinical practice as soon as possible, it is necessary to screen out a suitable number of core genes from so many DEGs.
In this study, we downloaded GSE15641 dataset from the Gene Expression Omnibus (GEO) and comprehensively screened out DEGs by using GEO2R online tools. Subsequently, we constructed a protein-protein interaction network of DEGs and sieved the top15 hub gene with a high degree of connectivity through Cytoscape tool. Moreover, we performed the Kyoto Encyclopedia of Genes and Genomes (KEGG) and the Gene Ontology (GO) analysis of DEGs and found key biological features and signaling pathways. Overall survival and disease-free survival analysis of 15 hub genes were used to evaluate their prognostic value. The high expression of three genes, (TGFB1, TIMP1 and VIM) predicted a worse prognosis. Analysis of receiver operating characteristic (ROC) curves revealed that these three genes have potential as diagnostic markers for ccRCC. Finally, we used The Cancer Genome Atlas (TCGA) and the Human Protein Atlas (http://www.proteinatlas.org) database to verify the expression of mRNA and protein levels of these three genes in cancerous and para-cancerous tissues.
Materials and Methods
Data collection
We downloaded the GSE15641 dataset from the GEO database, which is a publicly available cancer database. The microarray data of GSE15641 dataset include 23 normal kidney tissues and 32 ccRCC tissues, which was based on GPL96 platform ([HG-U133A] Affymetrix Human Genome U133A Array) by Jones et al [12].
Data processing
The differentially expressed genes between 32 ccRCC tissues and 23 normal kidney tissues were screened out using GEO2R (https://www.ncbi.nlm.nih.gov/geo/geo2r/), a free online analysis software for the GEO database, which was dependent on R language programming. According to the screening criteria of logFC≥2 or logFC≤-2 and adjusted P value <0.05, 598 DEGs were screened out, of which 406 genes were up-regulated and 192 genes were down-regulated. Then, we used Cytoscape software to select the top 15 genes as hub genes based on a high degree of connectivity.
In addition, we performed a heat map of top 50 DEGs using GraphPad Prism 7.04 and a volcano plot of all genes using ImageGP (http://www.ehbio.com/ImageGP) after downloading the raw data of the GSE15641 dataset.
KEGG signaling pathway enrichment and GO functional annotation analysis
The Kyoto Encyclopedia of Genes and Genomes (KEGG) and the Gene Ontology (GO) analysis of DEGs were performed using The Database for Annotation, Visualization and Integrated Discovery (https://david.ncifcrf.gov/) (DAVID, version 6.8), which provides a comprehensive set of functional annotation tools for investigators to understand biological meaning behind large list of genes.
PPI network construction and screening of hub gene
The protein-protein interaction (PPI) networks of DEGs were constructed using The Search Tool for the Retrieval of Interacting Genes (STRING), which is a publicly available software for assessing the interaction between proteins and proteins (https://string-db.org/). Cytoscape software was used to visualize the PPI network and select the top 15 gene as the hub genes.
Kaplan Meier analysis of Hub genes
The overall survival (OS) analysis of hub genes was performed using the online Oncolnc survival analysis server (http://www.oncolnc.org/). The disease-free survival (DFS) analysis of hub genes was performed using the online GEPIA survival analysis server (http://gepia.cancer-pku.cn/). The logrank P value was calculated and analyzed, and we screened out three promising hub genes ((TGFB1, TIMP1 and VIM)) with the prognostic value.
Verification of the expression level of hub genes
We downloaded the mRNA expression and TNM stage parameters of three hub genes from the TCGA database and compared their expression between ccRCC tissues and normal kidney tissues. Subsequently, we analyzed the association of mRNA expression levels of the three hub genes with TNM stage. The protein expression levels of the three hub genes were evaluated using The Human Protein Atlas (HPA, https://www.proteinatlas.org/).
ROC curves analysis of hub genes
The potential diagnostic value of the three hub genes was evaluated using the receiver operating characteristic (ROC) curves by Graphpad Prism software.
Gene set enrichment analysis of hub genes
After downloading the mRNA levels of the three hub genes from TCGA, they were divided into high expression group and low expression group according to the median value, and then GSEA analysis was performed.
Statistical Analysis
The values of different groups are represented by the mean ± SD. The comparison of the expression levels of the paired tumor tissues was analyzed by a paired t test. The comparison of expression levels of unpaired tumor tissues was analyzed by unpaired t test. P < 0.05 was considered statistically significant.
Results
The screening of DEGs and Hub Genes in ccRCC
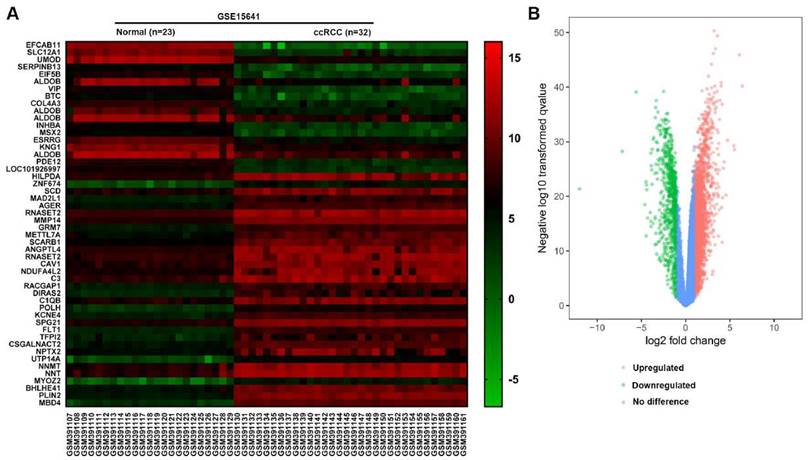
In the GSE15641 dataset, there were 23 normal renal tissues and 32 ccRCC tissues. According to the screening criteria of logFC≥2 or logFC≤-2 and adjusted P value <0.05, 598 DEGs were screened out by the GEO2R analysis tool, of which 406 genes were up-regulated and 192 genes were down-regulated (Fig. 1B). According to the value of |log FC|, we picked out the top 50 genes that differentially expressed in ccRCC. The top 50 DEGs were presented in the form of a heat map. Furthermore, 15 Hub genes with a higher connectivity degree were screened out from the GSE15641 dataset (Table 1).
(A) The heat map of top 50 DEGs. (B) The volcano map of genes in ccRCC from GSE15641 dataset. Red dots represent the upregulated DEGs, green dots represent the downregulated DEGs, and blue dots represent the genes with no difference in expression.
The top 15 hub genes with a higher degree of connectivity in GSE15641 dataset
| Gene name | Degree of connectivity | Adjusted P value | Gene Expression |
|---|---|---|---|
| ALB | 100 | 7.57E-17 | Downregulated |
| VEGFA | 67 | 1.74E-13 | Upregulated |
| EGF | 65 | 2.23E-19 | Downregulated |
| EGFR | 60 | 4.55E-11 | Upregulated |
| TGFB1 | 52 | 5.23E-09 | Upregulated |
| ACACB | 45 | 4.90E-26 | Downregulated |
| PTPRC | 41 | 1.08E-13 | Upregulated |
| FN1 | 39 | 5.05E-21 | Upregulated |
| CCND1 | 38 | 1.47E-16 | Upregulated |
| ICAM1 | 37 | 4.42E-33 | Upregulated |
| KNG1 | 35 | 2.41E-29 | Downregulated |
| VWF | 31 | 4.86E-16 | Upregulated |
| TIMP1 | 30 | 1.62E-22 | Upregulated |
| ACTN1 | 30 | 4.93E-21 | Upregulated |
| VIM | 30 | 5.25E-17 | Upregulated |
KEGG signaling pathway enrichment and GO functional annotation analysis of DEGs in ccRCC
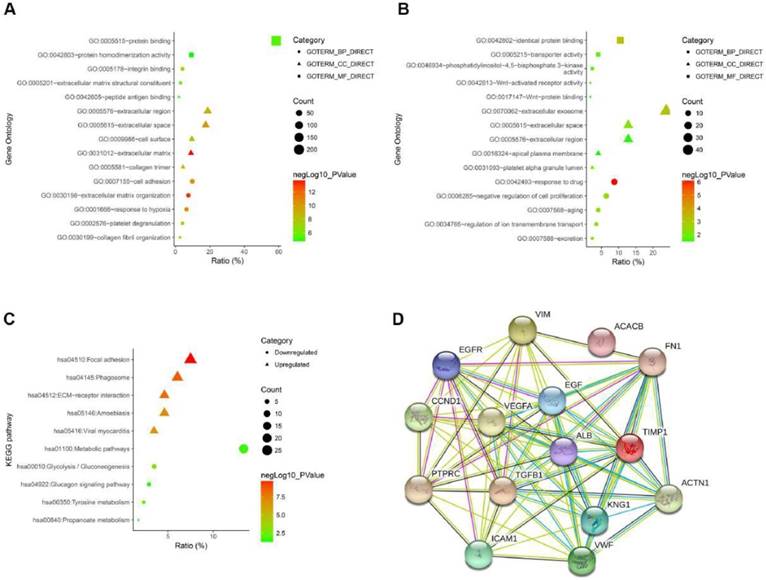
To gain an in-depth and comprehensive understanding of the biological characteristics of these DEGs, GO functional annotation and KEGG signaling pathway enrichment analysis were performed through online analytical tool DAVID. GO analysis showed that the enriched biological processes (BP) of up-regulated DEGs include extracellular matrix organization, response to hypoxia, cell adhesion, et al. The enriched molecular function (MF) of up-regulated DEGs involved integrin binding, protein binding, extracellular matrix structural constituent, et al. The involved cellular components (CC) of up-regulated DEGs included extracellular matrix, extracellular space, collagen trimer, et al (Fig. 2A and Table 2). GO analysis showed that the enriched biological processes (BP) of down-regulated DEGs include response to drug, negative regulation of cell proliferation, regulation of ion transmembrane transport, et al. The enriched molecular function (MF) of down-regulated DEGs involved Wnt-activated receptor activity, phosphatidylinositol-4,5-bisphosphate 3-kinase activity, Wnt-protein binding, et al. The involved cellular components (CC) of down-regulated DEGs included extracellular exosome, platelet alpha granule lumen, apical plasma membrane, et al (Fig. 2B and Table 2). As shown in Figure 2C, we performed the KEGG pathway enrichment analysis of DEGs. KEGG analysis revealed that the enriched pathways of up-regulated DEGs include Focal adhesion, ECM-receptor interaction, viral myocarditis, while the down-regulated DEGs were enriched in tyrosine metabolism, glucagon signaling pathway, metabolic pathways (Fig. 2C and Table 3). Finally, we performed a PPI network of the top 15 hub genes using the STRING online analysis tool (Fig. 2D).
(A) The GO analysis of upregulated DEGs. (B) The GO analysis of downregulated DEGs. (C) The KEGG pathway analysis of DEGs. (D) The PPI network of top 15 hub genes.
The GO analysis of differentially expressed genes in the ccRCC
| Gene expression | Category | Term | Count | % | PValue | FDR |
|---|---|---|---|---|---|---|
| Upregulated | GOTERM_CC_DIRECT | GO:0031012~extracellular matrix | 31 | 8.93 | 2.21E-14 | 3.04E-11 |
| GOTERM_CC_DIRECT | GO:0005615~extracellular space | 61 | 17.57 | 6.12E-11 | 8.41E-08 | |
| GOTERM_CC_DIRECT | GO:0005581~collagen trimer | 15 | 4.32 | 1.09E-09 | 1.50E-06 | |
| GOTERM_CC_DIRECT | GO:0005576~extracellular region | 65 | 18.73 | 1.39E-09 | 1.92E-06 | |
| GOTERM_CC_DIRECT | GO:0009986~cell surface | 33 | 9.51 | 4.67E-09 | 6.42E-06 | |
| GOTERM_BP_DIRECT | GO:0030198~extracellular matrix organization | 26 | 7.49 | 5.52E-14 | 9.56E-11 | |
| GOTERM_BP_DIRECT | GO:0001666~response to hypoxia | 22 | 6.34 | 1.42E-11 | 2.46E-08 | |
| GOTERM_BP_DIRECT | GO:0007155~cell adhesion | 34 | 9.79 | 5.95E-11 | 1.03E-07 | |
| GOTERM_BP_DIRECT | GO:0002576~platelet degranulation | 14 | 4.03 | 7.88E-08 | 1.36E-04 | |
| GOTERM_BP_DIRECT | GO:0030199~collagen fibril organization | 9 | 2.59 | 5.86E-07 | 0.001014072 | |
| GOTERM_MF_DIRECT | GO:0005178~integrin binding | 14 | 4.03 | 7.23E-08 | 1.07E-04 | |
| GOTERM_MF_DIRECT | GO:0005201~extracellular matrix structural constituent | 10 | 2.88 | 3.84E-06 | 0.005662561 | |
| GOTERM_MF_DIRECT | GO:0005515~protein binding | 203 | 58.50 | 4.39E-06 | 0.006464779 | |
| GOTERM_MF_DIRECT | GO:0042605~peptide antigen binding | 7 | 2.01 | 1.03E-05 | 0.015247132 | |
| GOTERM_MF_DIRECT | GO:0042803~protein homodimerization activity | 32 | 9.22 | 1.59E-05 | 0.023366428 | |
| Downregulated | GOTERM_CC_DIRECT | GO:0070062~extracellular exosome | 41 | 23.83 | 6.28E-04 | 0.793504017 |
| GOTERM_CC_DIRECT | GO:0005615~extracellular space | 22 | 12.79 | 0.005456219 | 6.698549756 | |
| GOTERM_CC_DIRECT | GO:0031093~platelet alpha granule lumen | 4 | 2.32 | 0.011661381 | 13.81292879 | |
| GOTERM_CC_DIRECT | GO:0005576~extracellular region | 22 | 12.79 | 0.034131924 | 35.60273157 | |
| GOTERM_CC_DIRECT | GO:0016324~apical plasma membrane | 7 | 4.06 | 0.039386897 | 39.90451163 | |
| GOTERM_BP_DIRECT | GO:0042493~response to drug | 15 | 8.72 | 8.17E-07 | 0.001307793 | |
| GOTERM_BP_DIRECT | GO:0034765~regulation of ion transmembrane transport | 6 | 3.48 | 0.003572931 | 5.565651774 | |
| GOTERM_BP_DIRECT | GO:0008285~negative regulation of cell proliferation | 11 | 6.39 | 0.003600942 | 5.608115289 | |
| GOTERM_BP_DIRECT | GO:0007568~aging | 7 | 4.06 | 0.004178027 | 6.478970288 | |
| GOTERM_BP_DIRECT | GO:0007588~excretion | 4 | 2.32 | 0.004677244 | 7.226235366 | |
| GOTERM_MF_DIRECT | GO:0042802~identical protein binding | 18 | 10.46 | 5.70E-04 | 0.774996196 | |
| GOTERM_MF_DIRECT | GO:0005215~transporter activity | 7 | 4.06 | 0.011237989 | 14.28183863 | |
| GOTERM_MF_DIRECT | GO:0042813~Wnt-activated receptor activity | 3 | 1.74 | 0.017364869 | 21.24766214 | |
| GOTERM_MF_DIRECT | GO:0046934~phosphatidylinositol-4,5-bisphosphate 3-kinase activity | 4 | 2.32 | 0.019675974 | 23.73609635 | |
| GOTERM_MF_DIRECT | GO:0017147~Wnt-protein binding | 3 | 1.74 | 0.033119697 | 36.82480288 |
KEGG pathway analysis of differentially expressed genes in the ccRCC
| Category | Term | Count | Generatio (%) | PValue |
|---|---|---|---|---|
| Up-regulated DEGs | hsa04510:Focal adhesion | 26 | 7.49 | 1.05E-10 |
| hsa04145:Phagosome | 21 | 6.05 | 2.41E-09 | |
| hsa04512:ECM-receptor interaction | 16 | 4.61 | 5.74E-09 | |
| hsa05146:Amoebiasis | 16 | 4.61 | 9.13E-08 | |
| hsa05416:Viral myocarditis | 12 | 3.45 | 2.01E-07 | |
| Down-regulated DEGs | hsa00010:Glycolysis / Gluconeogenesis | 6 | 3.48 | 0.001069 |
| hsa00350:Tyrosine metabolism | 4 | 2.32 | 0.007754 | |
| hsa01100:Metabolic pathways | 23 | 13.37 | 0.022939 | |
| hsa04922:Glucagon signaling pathway | 5 | 2.90 | 0.028494 | |
| hsa00640:Propanoate metabolism | 3 | 1.74 | 0.04214 |
The prognostic value assessment of the top 15 Hub genes
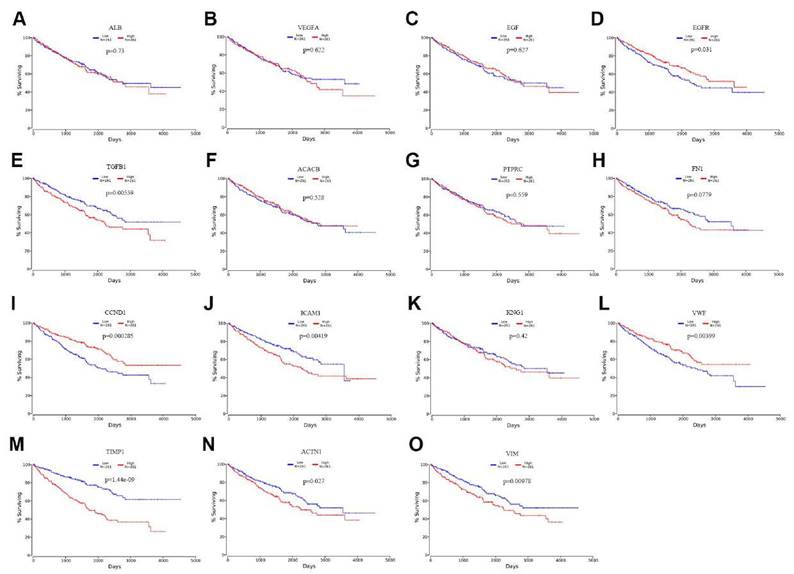
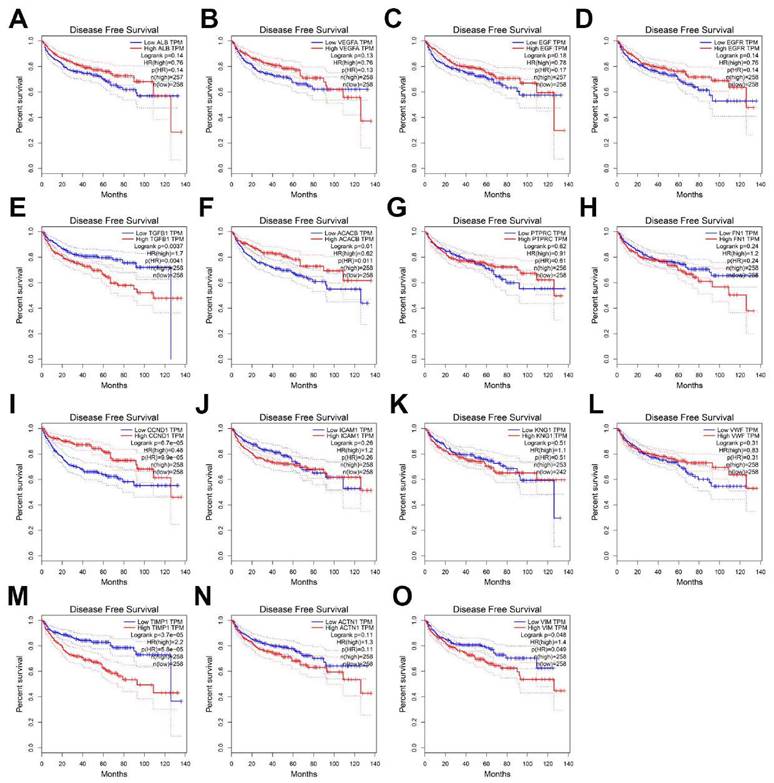
To evaluate the prognostic value of the top 15 hub genes, we performed a Kaplan meier curve analysis for overall survival (OS) at http://www.oncolnc.org/. As shown in Figure 3, the high expression of TGFB1 (logrank p=0.00559), ICAM1 (logrank p=0.00419), TIMP1 (logrank p=1.44e-09), ACTN1 (logrank p=0.027) and VIM (logrank p=0.00978) predicted a poor prognosis for ccRCC patients, while the high expression of EGFR (logrank p=0.031), CCND1 (logrank p=0.000285) and VMF (logrank p=0.00399) predicted a favorable prognosis for ccRCC patients. However, the expression levels of ALB (logrank p=0.73), VEGFA (logrank p=0.622), EGF (logrank p=0.627), ACACB (logrank p=0.528), PTPRC (logrank p=0.559), FN1 (logrank p=0.0779) and KNG1 (logrank p=0.42) were not associated with OS prognosis of ccRCC patients. Then, we evaluated the disease-free survival (DFS) prognosis of the top 15 hub genes at http://gepia.cancer-pku.cn/. As shown in Figure 4, the high expression of TGFB1 (logrank p=0.0037), TIMP1 (logrank p=3.7e-05), and VIM (logrank p=0.048) indicated a poor prognosis for ccRCC patients, while the high expression of CCND1 (logrank p=6.7e-05) indicated a favorable prognosis for ccRCC patients. However, the expression levels of the remaining hub genes were not correlated with disease-free survival (DFS) prognosis of ccRCC patients. From the above analysis, we found that the expression of CCND1, TGFB1, TIMP1 and VIM predicted a consistent overall survival and disease-free survival prognosis, in which high CCND1 expression predicted a good prognosis, while high expression of the other three genes predicted poor Prognosis. But these four hub genes were all highly expressed in ccRCC, so we selected TGFB1, TIMP1 and VIM as our research focus, which have great potential as prognosis biomarkers for ccRCC.
The overall survival analysis of top 15 hub genes in ccRCC: (A) ALB, (B) VEGFA, (C) EGF, (D) EGFR, (E) TGFB1, (F) ACACB, (G) PTPRC, (H) FN1, (I) CCND1, (J) ICAM1, (K) KNG1, (L) VWF, (M) TIMP1, (N) ACTN1, (O) VIM.
The disease-free survival analysis of top 15 hub genes in ccRCC: (A) ALB, (B) VEGFA, (C) EGF, (D) EGFR, (E) TGFB1, (F) ACACB, (G) PTPRC, (H) FN1, (I) CCND1, (J) ICAM1, (K) KNG1, (L) VWF, (M) TIMP1, (N) ACTN1, (O) VIM.
The TCGA and HPA validation and the assessment of diagnostic value
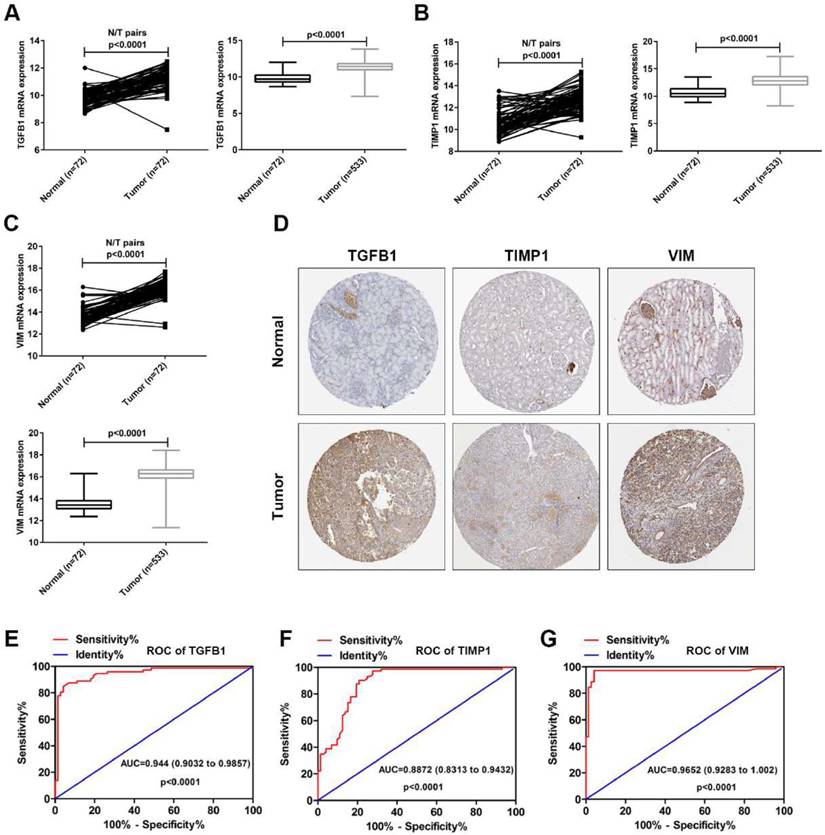
To verify the accuracy of the GSE15641 dataset, the mRNA levels of TGFB1, TIMP1 and VIM were downloaded from the TCGA database. As shown in Fig. 5A-C, the mRNA levels of TGFB1, TIMP1 and VIM were significantly upregulated in the paired and unpaired ccRCC tissues compared to the normal tissues. Then, we analyzed the protein expression levels of these three hub genes using The Human Protein Atlas (HPA, https://www.proteinatlas.org/). As shown in Fig. 5D, the protein levels of TGFB1, TIMP1 and VIM were obviously upregulated in the ccRCC tissues compared to the normal tissues. Finally, we used TGFB1, TIMP1 and VIM mRNA levels from TCGA to evaluate their diagnostic value. ROC curve analysis showed that TGFB1, TIMP1 and VIM expression levels have potential diagnostic value for ccRCC patients (Fig. 5E-G). These results confirm the high expression of TGFB1, TIMP1 and VIM in ccRCC and their diagnostic value for ccRCC.
The expression levels and diagnostic value of TGFB1, TIMP1 and VIM in ccRCC. (A) The mRNA expression levels of TGFB1 in paired and unpaired ccRCC tissues from TCGA. (B) The mRNA expression levels of TIMP1 in paired and unpaired ccRCC tissues from TCGA. (C) The mRNA expression levels of VIM in paired and unpaired ccRCC tissues from TCGA. (D) The protein expression levels of TGFB1, TIMP1 and VIM in ccRCC from HPA. (E-G) The ROC curve analysis of TGFB1, TIMP1 and VIM in ccRCC tissues from TCGA.
The relationship between the expression of hub genes and ccRCC stage
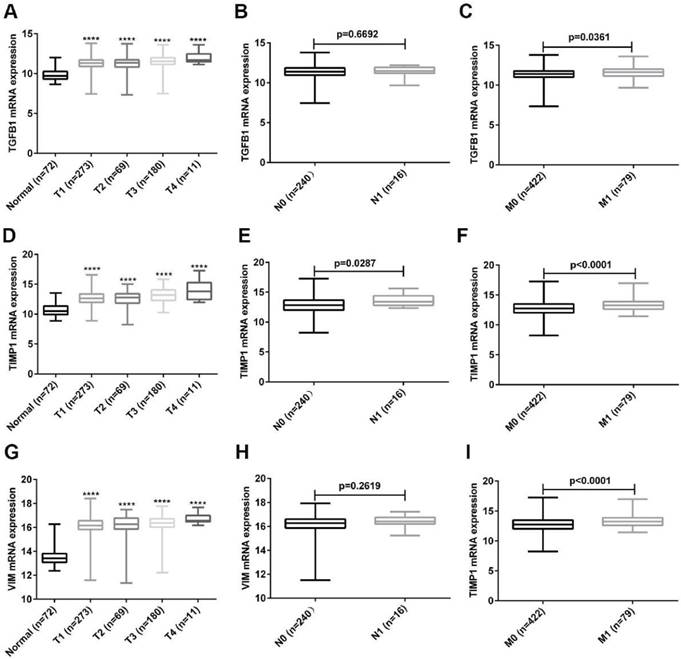
To further explore the clinical value of these three hub genes, we analyzed the relationship between their expression and TNM stage. As shown in Fig. 6A, the expression of TGFB1 was up-regulated as the T stage increased, and the expression of TGFB1 in M1 patients was higher than that of M0 patients (Fig. 6C). Unfortunately, the expression of TGFB1 was not related to the N stage of ccRCC (Fig. 6B). Next, we analyzed the relationship between TIMP1, VIM expression and TNM stage. The results obtained were consistent with the expression analysis of TGFB1 (Fig. 6D-I). Unexpectedly, the expression of TIMP1 was positively correlated with N stage (Fig. 6E).
The relationship between expression of TGFB1, TIMP1 and VIM and TNM stage. (A-C) The relationship between TGFB1 expression and TNM stage. (D-F) The relationship between TIMP1 expression and TNM stage. (G-I) The relationship between VIM expression and TNM stage. (****, P<0.0001, compared with the normal tissues).
The Gene Set Enrichment Analysis of the hub genes
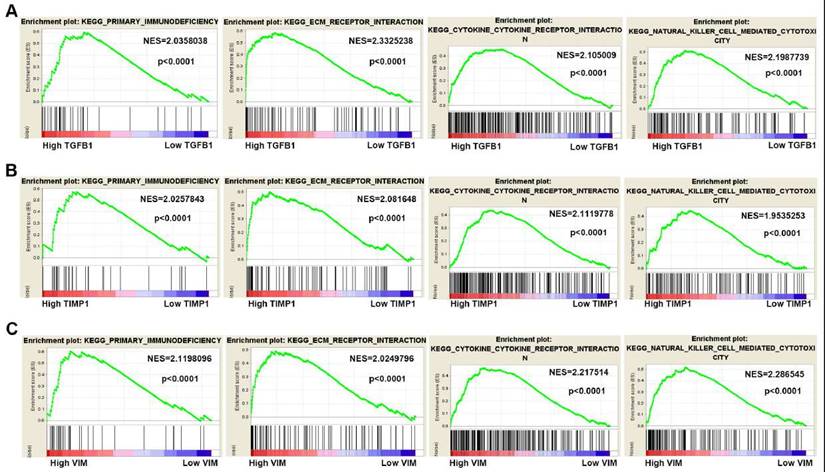
To gain insight into the biological functions of hub genes, GSEA analysis was manipulated to predict the biological processes involved by hub genes. According to the NES (normalized enrichment score) > 2, FDR (the false discovery rate) < 0.05 and the nominal P value < 0.05, high TGFB1, TIMP1 and VIM expression were mainly enriched in “primary immunodeficiency”, “ECM receptor interaction”, “cytokine receptor interaction” and “natural killer cell-mediated cytotoxicity” pathways (Fig. 7A-C).
Gene Set Enrichment Analysis of hub genes in ccRCC. (A-C) High TGFB1, TIMP1 and VIM expression co-enriched gene sets in ccRCC are listed, including "primary immunodeficiency", "ECM receptor interaction", "cytokine receptor interaction" and "natural killer cell-mediated cytotoxicity". (NES means Normalized Enrichment Score)
Discussion
The ccRCC is the most common malignant tumor that occurs in the kidney and is characterized by strong metastatic ability and poor prognosis. In recent years, despite the improvement of surgical techniques and advances in molecular targeted therapy and immunotherapy, the prognosis of ccRCC is still not ideal. Therefore, sensitive and specific biomarkers for early diagnosis of ccRCC are urgently needed to be identified, aiming to implement early treatment and improve patient outcomes. High-throughput sequencing studies can facilitate deep exploration of the mechanisms contributing to ccRCC progression [13]. Thus, our study performed a deep analysis of the microarray expression profile from GSE15641 dataset, which included 23 normal kidney tissues and 32 ccRCC tissues. A total of 598 DEGs were screened out including 406 up-regulated genes and 192 down-regulated genes. Moreover, we identified the top 15 hub genes from the DEGs using the PPI network and Cytoscape software.
To deeply explore the biological pathways and functions involved by these DEGs, we performed GO and KEGG analysis. To find the key genes for ccRCC progression from the numerous DEGs, we identified the top 15 hub genes through the PPI network and Cytoscape. The top 15 hub genes include ALB, VEGFA, EGF, EGFR, TGFB1, ACACB, PTPRC, FN1, CCND1, ICAM1, KNG1, VWF, TIMP1, ACTN1 and VIM. We used Kaplan-Meier curves to analyze the association of top 15 hub genes expression with OS and DFS in ccRCC. The results showed that only three hub genes (TGFB1, TIMP1 and VIM) were related to the OS and DFS of ccRCC. Therefore, we regard these three hub genes as the focus of our research.
To confirm the expression of these three hub genes in the GSE15641 dataset, the TCGA database was used to verify the expression of their mRNA levels and HPA online tool was used to validate the expression of their protein levels. The results obtained by TCGA and HPA verification are consistent with the results of GSE15641 dataset. We then evaluated the diagnostic value of these three hub genes using the ROC curve, indicating that they have potential diagnostic value for ccRCC. These results indicate that these three hub genes may be new diagnostic and prognostic biomarkers for ccRCC.
The gene TGFB1 encodes a secreted ligand of the TGF-beta (transforming growth factor-beta) superfamily of proteins. TGFB1 protein can induce epithelial-to -mesenchymal transition (EMT) and cell migration in various cell types [14, 15]. Also TGFB1 mediates SMAD2/3 activation by inducing its phosphorylation and subsequent translocation to the nucleus [14]. Moreover, TGFB1 may serve as a prognostic biomarker for hepatocellular carcinoma [16]. Integrating our ROC curve analysis and survival analysis, we speculated that TGFB1 might be a potential indicator for the diagnosis and prognosis of ccRCC.
The TIMP1 gene belongs to the TIMP gene family. The proteins encoded by this gene family are natural inhibitors of the matrix metalloproteinases (MMPs), a group of peptidases involved in degradation of the extracellular matrix. In addition to its inhibitory role against most known MMPs, the TIMP1 protein is able to promote cell proliferation in a wide range of cell types, and may also have an anti-apoptotic function [17-19]. The inhibition of TIMP1 expression reduced proliferation and metastasis but increased apoptosis by activating TIMP1 mediated FAK-PI3K/AKT and MAPK pathway [20]. TIMP1, serve as a hub gene of gastric cancer, may be a potential prognostic biomarker for gastric cancer [21]. Our study found that TIMP1 is up-regulated in ccRCC and has potential as a diagnostic and prognostic biomarker.
The VIM gene encodes a type III intermediate filament protein. Intermediate filaments, along with microtubules and actin microfilaments, make up the cytoskeleton. The VIM protein is responsible for maintaining cell shape and integrity of the cytoplasm, and stabilizing cytoskeletal interactions. Moreover, as a mesenchymal cell protein, VIM is a key factor in the EMT process. Previous study has reported that FSTL1 binds to VIM and facilitates colorectal cancer metastasis through activating the focal adhesion signalling pathway [22]. VIM has also been reported as one of the most promising biomarkers for early diagnosis and prognosis prediction of tongue squamous cell carcinoma [23]. Our study found that VIM is highly expressed in ccRCC and has diagnostic and prognostic value for ccRCC.
Through a series of bioinformatics analysis, we will make a summary here. In conclusion, 598 DEGs were screened out from the GSE15641 dataset, which may contain hub genes contributing to the pathogenesis of ccRCC. Through our bioinformatics analysis, three of the top 15 hub genes including TGFB1, TIMP1 and VIM might contribute to the progression of ccRCC, which could serve as novel diagnostic and prognostic biomarkers and therapeutic targets for ccRCC.
Acknowledgements
This study was supported by the National Natural Science Foundation of China (Grant No. 81874090, 81702517, 81672528, 81672524 & 81472405) and Wuhan Union Hospital Scientific Research Fund (Free Innovation Pre-Research Fund, Grant No. 000005001).
Competing Interests
The authors have declared that no competing interest exists.
References
1. Gunduz S, Mutlu H, Uysal M, Coskun HS, Bozcuk H. Prognostic value of hematologic parameters in patients with metastatic renal cell carcinoma using tyrosine kinase inhibitors. Asian Pac J Cancer Prev. 2014;15:3801-3804
2. Ruan H, Li X, Yang H, Song Z, Tong J, Cao Q, Wang K, Xiao W, Xiao H, Chen X. et al. Enhanced expression of caveolin-1 possesses diagnostic and prognostic value and promotes cell migration, invasion and sunitinib resistance in the clear cell renal cell carcinoma. Exp Cell Res. 2017;358:269-278
3. Capitanio U, Montorsi F. Renal cancer. Lancet. 2016;387:894-906
4. Brauch H, Weirich G, Brieger J, Glavac D, Rodl H, Eichinger M, Feurer M, Weidt E, Puranakanitstha C, Neuhaus C. et al. VHL alterations in human clear cell renal cell carcinoma: association with advanced tumor stage and a novel hot spot mutation. Cancer Res. 2000;60:1942-1948
5. Barnabas N, Amin MB, Pindolia K, Nanavati R, Amin MB, Worsham MJ. Mutations in the von Hippel-Lindau (VHL) gene refine differential diagnostic criteria in renal cell carcinoma. J Surg Oncol. 2002;80:52-60
6. Baldewijns MM, van Vlodrop IJ, Vermeulen PB, Soetekouw PM, van Engeland M, de Bruine AP. VHL and HIF signalling in renal cell carcinogenesis. J Pathol. 2010;221:125-138
7. Gossage L, Eisen T. Alterations in VHL as potential biomarkers in renal-cell carcinoma. Nat Rev Clin Oncol. 2010;7:277-288
8. Ibragimova I, Maradeo ME, Dulaimi E, Cairns P. Aberrant promoter hypermethylation of PBRM1, BAP1, SETD2, KDM6A and other chromatin-modifying genes is absent or rare in clear cell RCC. Epigenetics. 2013;8:486-493
9. Cancer Genome Atlas Research N. Comprehensive molecular characterization of clear cell renal cell carcinoma. Nature. 2013;499:43-49
10. Dushukyan N, Dunn DM, Sager RA, Woodford MR, Loiselle DR, Daneshvar M, Baker-Williams AJ, Chisholm JD, Truman AW, Vaughan CK. et al. Phosphorylation and Ubiquitination Regulate Protein Phosphatase 5 Activity and Its Prosurvival Role in Kidney Cancer. Cell Rep. 2017;21:1883-1895
11. Li N, Li L, Chen Y. The Identification of Core Gene Expression Signature in Hepatocellular Carcinoma. Oxid Med Cell Longev. 2018;201:347-361
12. Jones J, Otu H, Spentzos D, Kolia S, Inan M, Beecken WD, Fellbaum C, Gu X, Joseph M, Pantuck AJ. et al. Gene signatures of progression and metastasis in renal cell cancer. Clin Cancer Res. 2005;11:5730-5739
13. Eikrem OS, Strauss P, Beisland C, Scherer A, Landolt L, Flatberg A, Leh S, Beisvag V, Skogstrand T, Hjelle K. et al. Development and confirmation of potential gene classifiers of human clear cell renal cell carcinoma using next-generation RNA sequencing. Scand J Urol. 2016;50:452-462
14. Hwangbo C, Tae N, Lee S, Kim O, Park OK, Kim J, Kwon SH, Lee JH. Syntenin regulates TGF-beta1-induced Smad activation and the epithelial-to-mesenchymal transition by inhibiting caveolin-mediated TGF-beta type I receptor internalization. Oncogene. 2016;35:389-401
15. Li T, Huang H, Shi G, Zhao L, Li T, Zhang Z, Liu R, Hu Y, Liu H, Yu J, Li G. TGF-beta1-SOX9 axis-inducible COL10A1 promotes invasion and metastasis in gastric cancer via epithelial-to-mesenchymal transition. Cell Death Dis. 2018;9:849-867
16. Ji F, Zhang ZH, Zhang Y, Shen SL, Cao QH, Zhang LJ, Li SQ, Peng BG, Liang LJ, Hua YP. Low expression of c-Myc protein predicts poor outcomes in patients with hepatocellular carcinoma after resection. BMC Cancer. 2018;18:460-474
17. Omar OM, Soutto M, Bhat NS, Bhat AA, Lu H, Chen Z, El-Rifai W. TFF1 antagonizes TIMP-1 mediated proliferative functions in gastric cancer. Mol Carcinog. 2018;57:1577-1587
18. Zhou Y, Lin S, Tseng KF, Han K, Wang Y, Gan ZH, Min DL, Hu HY. Selumetinib suppresses cell proliferation, migration and trigger apoptosis, G1 arrest in triple-negative breast cancer cells. BMC Cancer. 2016;16:818-827
19. Rojiani MV, Ghoshal-Gupta S, Kutiyanawalla A, Mathur S, Rojiani AM. TIMP-1 overexpression in lung carcinoma enhances tumor kinetics and angiogenesis in brain metastasis. J Neuropathol Exp Neurol. 2015;74:293-304
20. Song G, Xu S, Zhang H, Wang Y, Xiao C, Jiang T, Wu L, Zhang T, Sun X, Zhong L. et al. TIMP1 is a prognostic marker for the progression and metastasis of colon cancer through FAK-PI3K/AKT and MAPK pathway. J Exp Clin Cancer Res. 2016;35:148-160
21. Liu X, Wu J, Zhang D, Bing Z, Tian J, Ni M, Zhang X, Meng Z, Liu S. Identification of Potential Key Genes Associated With the Pathogenesis and Prognosis of Gastric Cancer Based on Integrated Bioinformatics Analysis. Front Genet. 2018;9:265-279
22. Gu C, Wang X, Long T, Wang X, Zhong Y, Ma Y, Hu Z, Li Z. FSTL1 interacts with VIM and promotes colorectal cancer metastasis via activating the focal adhesion signalling pathway. Cell Death Dis. 2018;9:654-667
23. Hussein AA, Forouzanfar T, Bloemena E, de Visscher J, Brakenhoff RH, Leemans CR, Helder MN. A review of the most promising biomarkers for early diagnosis and prognosis prediction of tongue squamous cell carcinoma. Br J Cancer. 2018;9:724-736
Author contact
![]() Corresponding author: Ke Chen, Department of Urology, Union Hospital, Tongji Medical College, Huazhong University of Science and Technology, 1277 Jiefang Avenue, Wuhan, 430022, Hubei Province, China; E-mail: shenkeedu.cn. Xiaoping Zhang, Department of Urology, Union Hospital, Tongji Medical College, Huazhong University of Science and Technology, 1277 Jiefang Avenue, Wuhan, 430022, Hubei Province, China; E-mail: xzhangedu.cn.
Corresponding author: Ke Chen, Department of Urology, Union Hospital, Tongji Medical College, Huazhong University of Science and Technology, 1277 Jiefang Avenue, Wuhan, 430022, Hubei Province, China; E-mail: shenkeedu.cn. Xiaoping Zhang, Department of Urology, Union Hospital, Tongji Medical College, Huazhong University of Science and Technology, 1277 Jiefang Avenue, Wuhan, 430022, Hubei Province, China; E-mail: xzhangedu.cn.