Impact Factor ISSN: 1837-9664

 Global reach, higher impact
J Cancer 2019; 10(22):5355-5370. doi:10.7150/jca.29293 This issue Cite
Research Paper
Clinical Significance of microRNA-196b-5p in Hepatocellular Carcinoma and its Potential Molecular Mechanism
Lu Zhang1*, Bin Luo2*, Yi-wu Dang1, Rong-quan He2, Zhi-gang Peng2, Gang Chen1 ![]() , Zhen-bo Feng1
, Zhen-bo Feng1 ![]()
1. Department of Pathology, First Affiliated Hospital of Guangxi Medical University, No. 6 Shuangyong Road, Nanning, Guangxi Zhuang Autonomous Region 530021, P. R. China
2. Department of Medical Oncology, First Affiliated Hospital of Guangxi Medical University, No. 6 Shuangyong Road, Nanning, Guangxi Zhuang Autonomous Region 530021, P. R. China
* Lu Zhang and Bin Luo contributed equally to this work as co-first authors.
Received 2018-8-16; Accepted 2019-8-6; Published 2019-8-29
Abstract
Objective: To enquire into the clinical significance and potential molecular mechanism of microRNA (miRNA)-196b-5p in hepatocellular carcinoma (HCC).
Methods: Quantitative reverse transcription and polymerase chain reaction (qRT-PCR) were utilized to examine miR-196b-5p expression level in 67 HCC paraffin embedded tissues and corresponding adjacent tissues. Correlations of miR-196b-5p expression level with clinicopathological characteristics were analyzed in our study. The expression level and clinical significance of miR-196b-5p in HCC were also evaluated in The Cancer Genome Atlas (TCGA) and Gene Expression Omnibus (GEO) database. We made predictions of the target genes of miR-196b-5p by twelve online software and then selected genes predicted by at least 5 software. Subsequently, in order to obtain the potential target genes of miR-196b-5p, we overlapped the predicted target genes and down-regulated mRNAs in HCC based on TCGA database. Then, we performed the Gene Ontology (GO) and the Disease Ontology (DO) functional annotation, Kyoto Encyclopedia of Genes and Genomes (KEGG) pathway enrichment analysis and Protein-Protein Interaction (PPI) network construction of those miR-196b-5p potential target genes.
Results: Higher expression level of miR-196b-5p was seen in HCC tissues than in the corresponding adjacent tissues based on qRT-PCR (P = 0.0007). The expression level of miR-196b-5p was linked with tumor size (P = 0.03), tumor node (P = 0.024), vascular invasion (P = 0.029) and capsular invasion (P = 0.026) in HCC patients. Comprehensive meta-analysis of miR-196b-5p expression based on TCGA, GEO and qRT-PCR verified that higher expression level of miR-196b-5p was observed in HCC tissues than in normal control liver tissues (SMD = 0.56, 95%CI: 0.39-0.72, P heterogeneity = 0.275, I2 = 18.3%). GO annotation revealed that the top terms in biological process, cellular component and molecular function were single-organism catabolic process, neuronal cell body and transmembrane receptor protein kinase activity, respectively. The most relevant disease in DO annotation was arteriosclerosis. The tryptophan metabolism pathway ranked first in KEGG pathway enrichment analysis. The PPI network showed that IGF1, FOXO1, AR and FOS were mostly likely to become the core genes of miR-196b-5p potential target genes, which however required further experiments for validation.
Conclusion: The miR-196b-5p was observed to show higher expression in HCC tissues than in normal control liver tissues. Moreover, the miR-196b-5p expression level had correlations with the clinicopathological parameters such as vascular invasion of HCC, but the molecular mechanisms of miR-196b-5p in HCC still need further elucidation and verification.
Keywords: microRNA-196b-5p, hepatocellular carcinoma, quantitative reverse transcription and polymerase chain reaction, bioinformatics
Introduction
Hepatocellular carcinoma (HCC) represented approximately 85-90% of the primary hepatic cancer. In China, HCC ranked fourth in the morbidity rate and third in mortality rate among all the malignancies [1, 2]. The number of HCC patients increased by over 400 thousand annually, most of whom were diagnosed at the advanced stage, which resulted in the unpleasant prognosis and relatively low 5-year survival rate [3-5]. Notably, Guangxi is a region with a high incidence of HCC [6, 7]. Currently, the main treatment for HCC was operation, but the operation failed to achieve satisfactory clinical cure rate and long-term survival rate [8, 9]. Therefore, the major concern is to seek novel treatments for HCC. Recently, the molecularly targeted therapy has been rising as a new approach to dealing with cancers [10-12]. The initiation and progression of HCC was considered a continual and complex process that involved multiple factors and stages of evolution, in which abnormal changes were detected in the structures and expressions of a large number of coding or non-coding-RNAs. In recent years, the research on the non-coding RNAs has refreshed our knowledge on the initiation and development of HCC, the early diagnostic markers and the novel therapeutic targets [13-15].
The microRNA (miRNA), a sort of non-coding RNA (involving around 20-22 nucleotides) without the protein coding function, affects RNA silencing and post-transcriptional regulation of gene expression [16, 17]. Several researches indicated that miRNA closely correlated to the onset and development of tumors [18, 19]. Studies by deep sequencing and gene microarrays also showed that a number of miRNA was aberrantly expressed in cancer cell lines and tumor tissues, and they participated in the biological process such as the tumor onset, development, metastasis and so on, influencing the growth and proliferation of cancer cells, invasion, metastasis, apoptosis, autophagy, etc. [20-24]. Thereby, the identification of miRNA in the initiation and progression of tumors could assist us to investigate the mechanism of tumor initiation and progression, and to seek the novel diagnostic markers and therapeutic targets [25-33].
The miR-196b-5p, which is categorized into the miR-196b family, is located on human chromosome 7p15.2. Previous studies had shown that overexpressed miR-196b-5p was observed in colorectal carcinoma [34] and gastric carcinoma [35]. In the colorectal cancer, miR-196b-5p could regulate the invasion as well as the metastasis of colorectal cancer cells by targeting HOXB7 and GALNT5 [36]. In terms of the research on miR-196b in the HCC, only Shen et al. [37] detected its overexpression in HCC, and no studies was found on the clinical value of miR-196b-5p in HCC and its mechanism. By quantitative reverse transcription and polymerase chain reaction (qRT-PCR), this study examined the expression of miR-196b-5p in the HCC tissues and the adjacent paraffin embedded tissues, and explored its clinical significance as well. Besides, for the purpose of investigating the expression of miR-196b-5p and its clinical significance in HCC, we took advantage of the RNA sequencing (RNA-seq) data in The Cancer Genome Atlas (TCGA, https://cancergenome.nih.gov/cancer) and microarray data in Gene Expression Omnibus (GEO, https://www.ncbi.nlm.nih.gov/geo/). The target genes of miR-196b-5p would be predicted, and also its molecular mechanism in HCC would be explored.
Materials and Methods
Tissue samples
The researchers collected 67 cases of HCC tissues and 67 cases of corresponding adjacent paraffin embedded tissues from The First Hospital Affiliated to Guangxi Medical University between Jan. 1, 2015 and May 1, 2016. The present study was approved by the Research Ethics Committee of the First Affiliated Hospital of Guangxi Medical University (Nanning, China), and written informed consent was obtained from all patients.
RNA extraction and qRT-PCR
According to the instruction of E.Z.N.A.TM FFPE RNA Kit of Omega Bio-Tek, we extracted the total RNA of 67 cases of HCC tissues and their corresponding adjacent tissues. The reverse transcription was conducted with miRNA 1st Strand cDNA Synthesis Kit (by stem-loop) of Vazyme Biotech Co.,Ltd. The relative quantification of miR-196b-5p expression was performed by Applied Biosystems PCR7500, with the reagent being the miRNA Universal SYBR® qPCR Master Mix of Vazyme. The sequencing of miR-196b-5p primers included F:5' -GCGCGTAGGTAGTTTCCTGTT-3', R:5' - AGTGCAGGGTCCGAGGTATT-3. The sequencing of endogenous reference genes primer U6 was F: 5'-CTCGCTTCGGCAGCACA-3', R: 5'- AACGCTTCACGAATTTGCGT-3'. The expression value was calculated with 2-ΔCt method.
The collection of RNA sequencing data in TCGA
By Xena Public Data Hubs (http://xena.ucsc.edu/public-hubs/), the expression profiling of mature miRNA in HCC was acquired from TCGA, in which the miR-196b-5p was selected, including 369 cases of HCC tissues and 49 cases of normal liver tissues. In addition, the clinicopathologic parameters of HCC were downloaded from TCGA in order to evaluate their relationships with miR-196b-5p [38].
The collection of microarrays in GEO
The researchers retrieved the miRNA microarrays related to HCC in GEO (https://www.ncbi.nlm.nih.gov/geo/) until Nov. 17, 2017 [39]. The search strategy was (hepatocellular OR liver OR hepatic) AND (miRNA OR microRNA). The standards for inclusion of the HCC related microarrays were as follows: (1) the cancer samples were diagnosed with HCC; (2) each microarray contained HCC cohort and the control; (3) the expression profiling of miR-196b-5p was available; (4) the species was homo sapiens. Those microarrays were excluded if (1) they failed to provide the expression profiling of miR-196b-5p; (2) they did not involve the controls; (3) their species were animals.
The prediction of target genes of miR-196b-5p
The twelve online software were linked by miRWalk 2.0 (http://zmf.umm.uni-heidelberg.de/apps/zmf/mirwalk2/), including miRWalk, Microt4, miRanda, mirBridge, miRDB, miRMap, miRNAMap, Pictar2, PITA, RNA22, RNAhybrid and Targetscan, all of which could facilitate the forecast of target genes of miR-196b-5p. Afterwards, genes predicted by at least 5 software were preferred as the predicted genes of miR-196b-5p. We combined those predicted genes and the lowly-expressed differential genes analyzed by R language in TCGA, and selected the overlapping genes as the possible target genes of miR-196b-5p [40].
Annotation, pathway enrichment analysis and Protein-Protein Interaction (PPI) network construction
The David database (https://david.ncifcrf.gov/) was used for annotation and pathway enrichment analysis of the potential target genes of miR-196b-5p, involving the Gene Ontology (GO) annotation and Kyoto Encyclopedia of Genes and Genomes (KEGG) pathway analysis. The GO annotation consists of biological process, cellular component and molecular function. Furthermore, the annotation included the Disease Ontology (DO) annotation, of which results could be generated by R 3.4.1. In order for PPI network construction, we researchers uploaded the potential target genes of miR-196b-5p to Search Tool for the Retrieval of Interacting Genes (STRING) (https://string-db.org/cgi/input.pl), with the confidence score > 0.7 [39, 41, 42].
Statistical analysis
In this study, we researchers examined the expression of miR-196b-5p with qRT-PCR, and calculated the expression value using 2-△CT method: △CT = CTmiR-196b-5p-CTU6. Each sample in triplicate was used in qRT-PCR, and the average CT value was determined. The expressed miR-196b-5p was distributed in skewness in the cancer and adjacent tissues. The Wilcoxon was applied for the test, and the median value was used as a cut-off for the high and low expressions of miR-196b-5p in HCC tissues. The categorical data, like the relationships of expressed miR-196b-5p with the clinicopathologic parameters, were dealt with the Fisher's exact test or χ2, whereas the ranked data were processed with the Kruskal-Wallis H test.
In TCGA and GEO, the expressed miR-196b-5p was shown in normal distribution in tumor and adjacent tissues, and we used the Student's T test to estimate the mean of the expression in the two cohorts. GraphPad Prism Version 5.0 (GraphPad Software, San Diego CA, USA; https://www.graphpad.com) was applied to draw the scatter diagram. In addition, the researchers utilized the receiver operating characteristic curve (ROC curve) to assess the capability of expressed miR-196b-5p to distinguish the cancer from non-cancer tissues, and the area under the curve (AUC) could be applied to quantitatively measure the capability, with great value indicating the great capability. We researchers took advantage of SSPS 22.0 to draw the individual ROC curve. In addition, Stata Version 12.0 was used to draw the summary ROC (SROC) curve which could systematically assess the capability of miR-196b-5p expression to distinguish the cancer from non-cancer tissues.
The Standard mean difference (SMD) and 95% confidence interval (95% CI) were calculated to scrutinize the expression of miR-196b-5p in HCC and the normal tissues. The heterogeneity of the Meta-analysis was represented with chi-square test of Q or inconsistency index (I2). When the P value < 0.05 or I2 > 50%, the heterogeneity obviously existed in the Meta-analysis, and then the random effects model would be used. If the P > 0.05 or I2 < 50%, we found no remarkable heterogeneity in the Meta- analysis, thereby employing the fixed effects model. We applied the Stata Version 12.0 (StataCorp, College Station, TX, USA; http://www.stata.com) to draw the forest plots and conducted sensitivity analysis of the Meta results. Following the sensitivity analysis, we excluded the studies beyond the base line, and then drew the forest plots again. On the condition that the SMD or 95%CI scarcely varied and no obvious heterogeneity was found, the results of Meta-analysis seemed valid and reliable. Besides, the publication bias of the Meta-analysis was evaluated through Egger's and Begg's tests, and then drew the funnel plots. The P value > 0.05 (of Egger's and Begg's tests) would mean no publication bias existed.
Results
The expression of miR-196b-5p in HCC tissues and in corresponding adjacent tissues
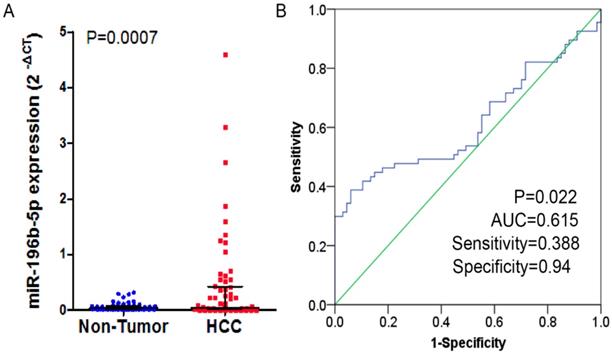
In the study, 41 of 67 cases (61.2%) showed that higher expression of miR-196b-5p was seen in HCC tissues than in the adjacent ones. In these 67 cases, the expressed miR-196b-5p displayed skewed distribution in HCC and the adjacent tissues. In HCC tissues, the median of the relative expression of miR-196b-5p was 0.042, and the inter-quartile range was 0.020-0.404, while in the adjacent tissues, the median value was 0.037 and the inter-quartile range was 0.017-0.072. By Wilcoxon test, we ascertained that the higher relative expression of miR-196b-5p was examined in HCC rather than in adjacent tissues, with statistical significance (P = 0.0007) (Figure 1A). The ROC curve was applied to assess the ability of miR-196b-5p expression to differentiate between the cancer tissues and the non-cancer ones, of which result revealed that AUC was 0.615 (95%CI: 0.517-0.713, P = 0.022), with sensitivity being 0.388 and specificity being 0.94 (Figure 1B). The analysis of the relationships between miR-196b-5p expression and the clinicopathologic parameters revealed that the expression was associated with tumor size, nodule number, vascular and capsular invasions (P < 0.05) (Table 1).
The expression level and ROC curve analysis of miR-196b-5p in HCC based on qRT-PCR. A: miR-196b-5p expression level in HCC was higher than in adjacent tissues. B: ROC curve analysis of miR-196b-5p for discriminating HCC from adjacent tissues.
The relationships between miR-196b-5p expression and the clinicopathologic parameters by qRT-PCR
| Clinicopathologic parameters | miR-196b-5p expression | P value | ||
|---|---|---|---|---|
| Cases of high expression | Cases of low expression | |||
| Sex | Male | 29 | 27 | |
| Female | 5 | 6 | 0.701 | |
| Age | <60 | 27 | 27 | |
| ≥60 | 7 | 6 | 0.803 | |
| Tumor size (cm) | ≥5 | 27 | 18 | |
| <5 | 7 | 15 | 0.03* | |
| Tumor nodule | Single | 25 | 31 | |
| Multiple | 9 | 2 | 0.024* | |
| Vascular invasion | Yes | 17 | 8 | |
| No | 17 | 25 | 0.029* | |
| Capsular invasion | Yes | 12 | 4 | |
| No | 22 | 29 | 0.026* | |
| HBV infection | Yes | 28 | 28 | |
| No | 6 | 5 | 0.783 | |
| HCV infection | Yes | 1 | 1 | |
| No | 31 | 32 | 1 | |
| Cirrhosis | Yes | 19 | 17 | |
| No | 15 | 16 | 0.72 | |
| Portal vein tumor thrombus (PVTT) | Yes | 5 | 2 | |
| No | 29 | 31 | 0.449 | |
| AFP (ng/ml) | ≥400 | 16 | 11 | |
| <400 | 18 | 21 | 0.295 | |
| nm23 | Positive | 31 | 33 | |
| Negative | 3 | 0 | 0.248 | |
| P53 | Positive | 25 | 27 | |
| Negative | 9 | 6 | 0.416 | |
| P21 | Positive | 5 | 3 | |
| Negative | 29 | 30 | 0.74 | |
| VEGF | Positive | 16 | 17 | |
| Negative | 17 | 16 | 0.806 | |
| Ki-67 | High | 18 | 19 | |
| Low | 14 | 13 | 0.8 | |
| CD34 | High | 15 | 19 | |
| Low | 9 | 3 | 0.066 | |
| Pathologic grading | I-II | 18 | 21 | |
| III-IV | 16 | 12 | 0.375 | |
| Child-Pugh class | A | 21 | 18 | |
| B | 3 | 2 | 1 | |
| BCLC stage | 0 | 0 | 2 | |
| A | 12 | 9 | ||
| B | 11 | 7 | ||
| C | 1 | 2 | 0.356 | |
Note: HCC, hepatocellular carcinoma; AFP, α-fetoprotein; nm23, Non-metastasis 23; VEGF, vascular endothelial growth factor; HBV, hepatitis B virus; HCV, hepatitis C virus; BCLC, Barcelona Clinic Liver Cancer; *P<0.05.
The clinical significance of miR-196b-5p in HCC in TCGA
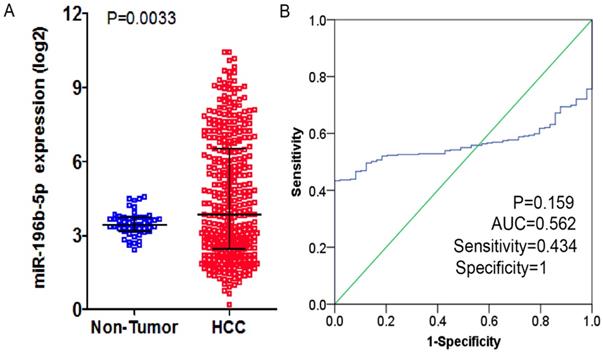
From TCGA database, the researchers downloaded the expression profiling of miR-196b-5p and subsequently compared the 369 cases of HCC tissues and 49 cases of normal liver tissues, finding expression of miR-196b-5p was seen higher in HCC tissues (4.49 ± 2.42) rather than in normal tissues (3.47 ± 0.50), with statistical significance (P = 0.0033), (Figure 2A). The AUC of miR-196b-5p expression to discriminate cancer tissues from the non-cancer ones was 0.562 (95%CI: 0.511-0.613, P = 0.159), with sensitivity and specificity being 0.434 and 1 respectively (Figure 2B). The analysis of the relationships between miR-196b-5p expression and the clinicopathologic parameters proved that the expression was in a close association with the sex of patients with HCC, pathologic grading and vascular invasions (Table 2).
The expression level and ROC curve analysis of miR-196b-5p in HCC based on TCGA database. A: miR-196b-5p expression level in HCC was higher than in normal liver tissues. B: ROC curve analysis of miR-196b-5p for discriminating HCC from normal liver tissues.
The relationships between miR-196b-5p expression and the clinicopathologic parameters in TCGA
| Clinicopathologic parameters | Number of cases | miR-196b-5p expression | P value | |
|---|---|---|---|---|
| (mean ± SD) | ||||
| Tissues | HCC | 369 | 4.49±2.42 | 0.003* |
| Normal controls | 49 | 3.47±0.50 | ||
| Sex | Male | 250 | 4.31±2.42 | 0.035* |
| Female | 119 | 4.88±2.40 | ||
| Age | <60 | 170 | 4.30±2.41 | 0.168 |
| ≥60 | 198 | 4.65±2.43 | ||
| Pathologic grading | I~II | 228 | 4.28±2.37 | 0.041* |
| III~IV | 137 | 4.81±2.44 | ||
| Stage | I~II | 256 | 4.52±2.44 | 0.97 |
| III~IV | 87 | 4.51±2.41 | ||
| T | TX | 1 | 4.16 | |
| T1 | 180 | 4.34±2.37 | 0.524 | |
| T2-4 | 186 | 4.62±2.45 | ||
| N | NX | 111 | 4.10±2.30 | |
| N0 | 253 | 4.67±2.46 | 0.078 | |
| N1 | 4 | 3.42±1.70 | ||
| M | MX | 98 | 4.09±2.29 | |
| M0 | 267 | 4.64±2.47 | 0.148 | |
| M1 | 4 | 4.84±1.09 | ||
| Vascular invasion | Yes | 110 | 4.93±2.56 | 0.023* |
| No | 204 | 4.27±2.34 | ||
| Cirrhosis | Yes | 6 | 3.44±2.56 | 0.272 |
| No | 344 | 4.53±2.39 | ||
| Drinking | Yes | 117 | 4.49±2.32 | 0.908 |
| No | 233 | 4.52±2.44 | ||
| Smoking | Yes | 17 | 4.82±2.57 | 0.579 |
| No | 333 | 4.49±2.39 | ||
| HBV infection | Yes | 107 | 4.55±2.58 | 0.828 |
| No | 243 | 4.49±2.31 | ||
| HCV infection | Yes | 55 | 4.53±2.53 | 0.948 |
| No | 295 | 4.50±2.37 | ||
Note: HCC, hepatocellular carcinoma; TCGA, The Cancer Genome Atlas; HBV, hepatitis B virus; HCV, hepatitis C virus; *P<0.05.
The expression of miR-196b-5p in HCC in GEO
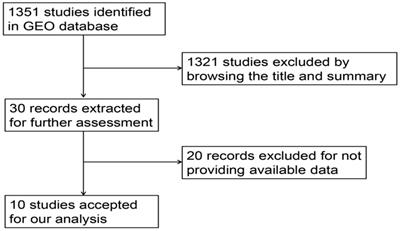
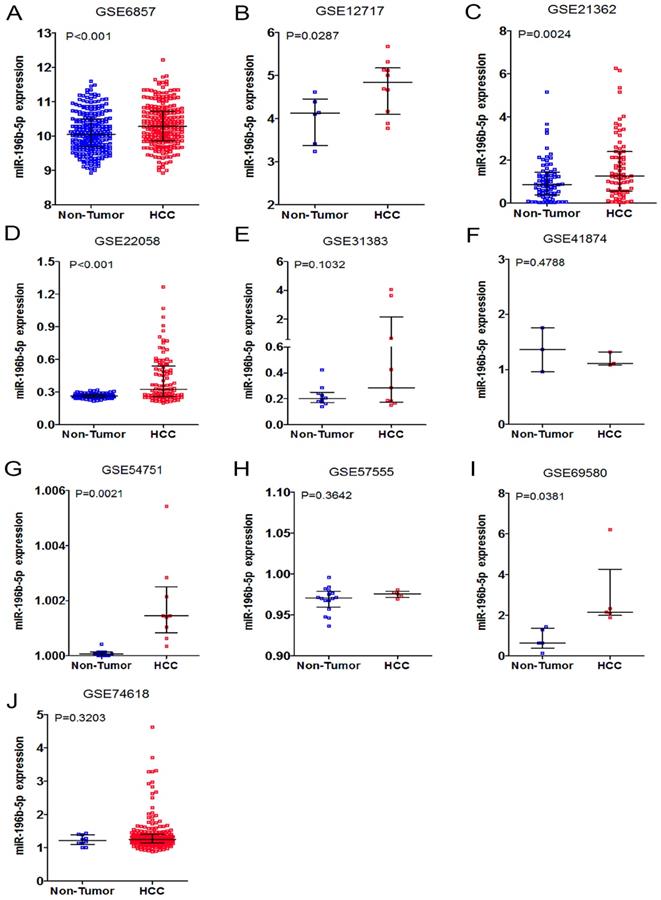
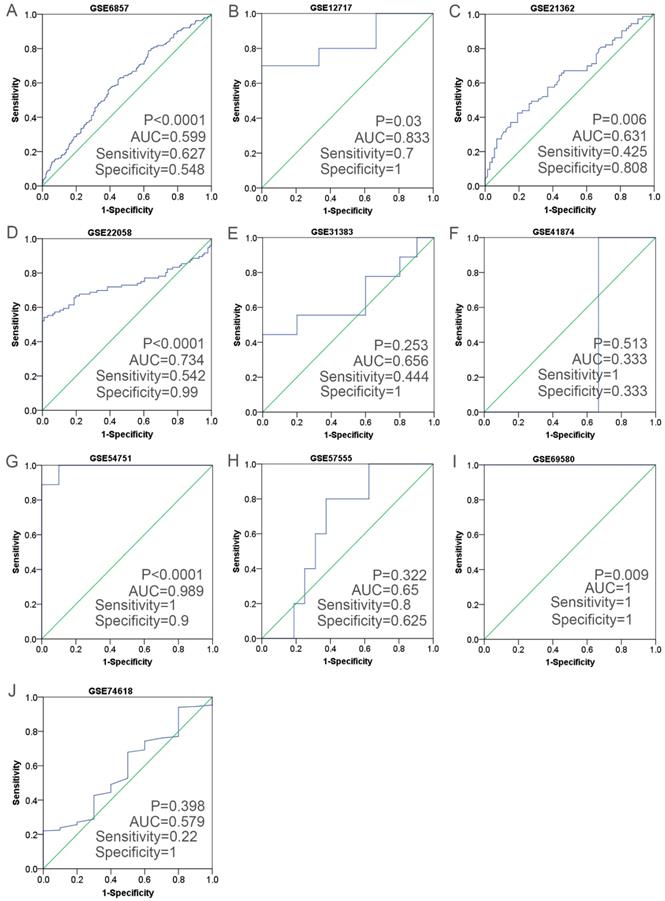
Having retrieved the GEO database, we included in our research 10 microarrays of miR-196b-5p expression profiling, involving GSE6857, GSE12717, GSE21362, GSE22058, GSE31383, GSE41874, GSE54751, GSE57555, GSE69580 and GSE74618. The retrieval process was displayed in Figure 3. The basic features of these 10 microarrays were shown in Table 3. In 6 microarrays, compared with the normal tissues, miR-196b-5p was expressed higher in HCC tissues (GSE6857, GSE12717, GSE21362, GSE22058, GSE54751 and GSE69580) (Figure 4A-D, G, H). However, no statistical significance was found in miR-196b-5p expression in HCC and normal liver tissues (GSE31383, GSE41874, GSE57555, GSE74618) (Figure 4 E, F, H, J). The ROC curves of each microarray were displayed in Figure 5.
Flow chart of study selection for miR-196b-5p microarray data based on GEO datasets.
The basic features of 10 microarrays of expression profiling of miR-196b-5p form GEO database
| Series | Platform | Country/Region | Citation | Number of samples | miR-196b-5p expression (Mean ± SD) | ||
|---|---|---|---|---|---|---|---|
| HCC | Normal control | HCC | Normal control | ||||
| GSE6857 | GPL4700 | USA | Budhu et al. (2008) | 241 | 241 | 10.322±0.607 | 10.113±0.575 |
| GSE12717 | GPL7274 | USA | Su et al. (2009) | 10 | 6 | 4.742±0.629 | 3.987±0.544 |
| GSE21362 | GPL10312 | Japan | Sato et al. (2011) | 73 | 73 | 1.686±1.463 | 1.053±0.957 |
| GSE22058 | GPL10457, GPL6793, GPL9733 | USA | Burchard et al. (2010) | 96 | 96 | 0.416±0.214 | 0.265±0.020 |
| GSE31383 | GPL10122 | USA | Wang et al. (2012) | 9 | 10 | 1.084±1.584 | 0.223±0.081 |
| GSE41874 | GPL7722 | Japan | None | 3 | 3 | 1.171±0.129 | 1.359±0.397 |
| GSE54751 | GPL18262 | USA | Shen et al. (2015) | 9 | 10 | 1.002±0.002 | 1.000±0.000 |
| GSE57555 | GPL18044, GPL16699 | Japan | Murakami et al. (2015) | 5 | 16 | 0.975±0.004 | 0.969±0.015 |
| GSE69580 | GPL10850 | Taiwan | None | 5 | 5 | 2.938±1.832 | 0.824±0.527 |
| GSE74618 | GPL14613 | Spain | Villanueva et al. (2016) | 218 | 10 | 1.380±0.483 | 1.227±0.158 |
Note: HCC, hepatocellular carcinoma; USA, United States of America; SMD, standard mean difference.
The expression data of miR-196b-5p in HCC in ten microarrays from GEO datasets. A: the expression level of miR-196b-5p from GSE6857. B: the expression level of miR-196b-5p from GSE12717. C: the expression level of miR-196b-5p from GSE21362. D: the expression level of miR-196b-5p from GSE22058. E: the expression level of miR-196b-5p from GSE31383. F: the expression level of miR-196b-5p from GSE41874. G: the expression level of miR-196b-5p from GSE54751. H: the expression level of miR-196b-5p from GSE57555. I: the expression level of miR-196b-5p from GSE69580. J: the expression level of miR-196b-5p from GSE74618.
The ROC curves of miR-196b-5p in HCC in ten microarrays from GEO datasets. A: the ROC curve of miR-196b-5p from GSE6857. B: the ROC curve of miR-196b-5p from GSE12717. C: the ROC curve of miR-196b-5p from GSE21362. D: the ROC curve of miR-196b-5p from GSE22058. E: the ROC curve of miR-196b-5p from GSE31383. F: the ROC curve of miR-196b-5p from GSE41874. G: the ROC curve of miR-196b-5p from GSE54751. H: the ROC curve of miR-196b-5p from GSE57555. I: the ROC curve of miR-196b-5p from GSE69580. J: the ROC curve of miR-196b-5p from GSE74618.
The analysis of miR-196b-5p expression in HCC by combination of TCGA, GEO and qRT-PCR results
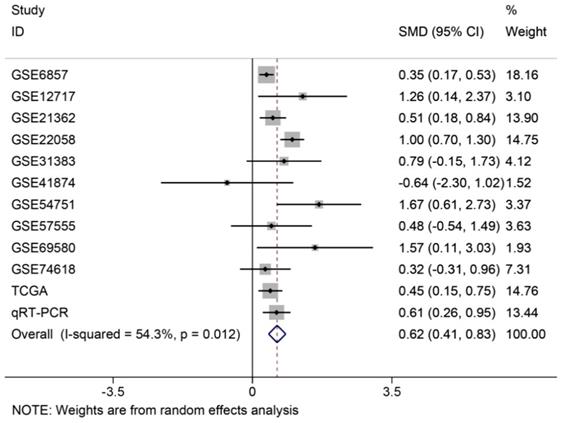
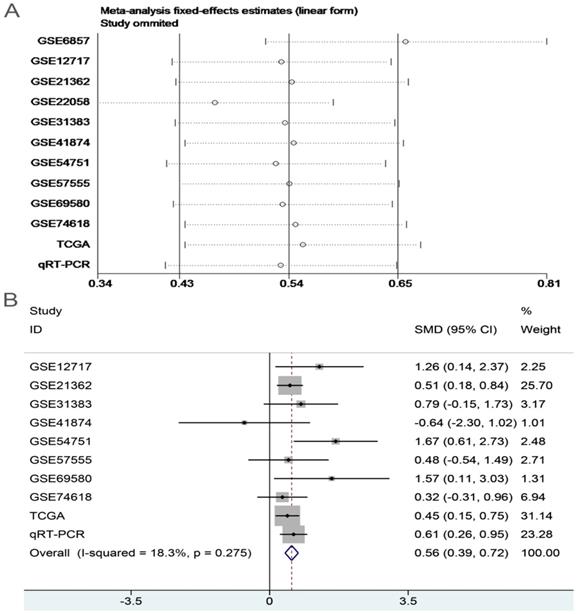
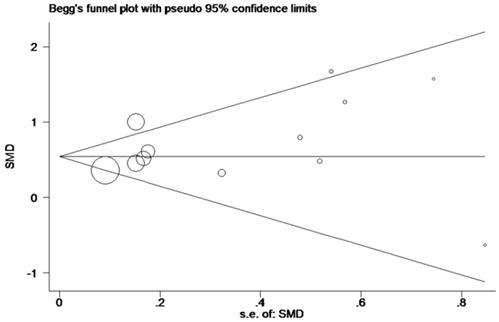
In order to systematically and holistically analyze the miR-196b-5p expression, we researchers combined the results of TCGA, GEO and qRT-PCR for Meta-analysis, which contained 1105 cases of HCC tissues and 586 cases of normal liver tissues. The Meta-analysis showed SMD = 0.62 (95%CI: 0.41-0.83); since the SMD > 0 and 95%CI did not cover 0, it was demonstrated that miR-196b-5p displayed was expressed higher in HCC tissues rather than in normal liver tissues (Figure 6). The heterogeneity test revealed that remarkable heterogeneity was observed in Meta-analysis of miR-196b-5p expression (P heterogeneity = 0.012, I2 = 54.3%; Figure 6), so random effects model was preferred. In the sensitivity test, after excluding GSE6857 and GSE22058, we discovered SMD = 0.56 (95%CI: 0.39-0.72), and failed to detect obvious heterogeneity (P heterogeneity = 0.275, I2 = 18.3%; Figure 7A, B). Egger's test showed P = 0.230, and Begg's test showed P = 0.304; in addition, the funnel plots were distributed in symmetry, suggesting that we failed to detect remarkable publication bias in the Meta-analysis of miR-196b-5p expression (Figure 8).
Forest plot of studies evaluating standard mean difference of miR-196b-5p expression between HCC group and non-tumor group based on TCGA, GEO and qRT-PCR.
Sensitivity analysis and the forest plot after sensitivity analysis. A: sensitivity analysis of Meta-analysis of the expression level of miR-196b-5p in HCC group and in non-tumor group based on TCGA, GEO and qRT-PCR. B: forest plot of miR-196b-5p expression between HCC group and non-tumor group after removing the study of GSE6857 and GSE22058.
Funnel plot for publication bias test after Meta-analysis of the expression level of miR-196b-5p based on TCGA, GEO and qRT-PCR.
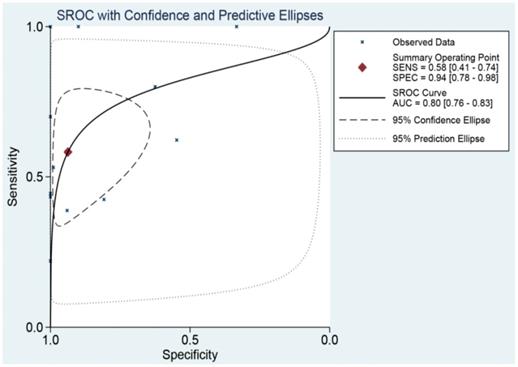
The SROC curve was applied to analyze and calculate the AUC and 95%CI in order to systematically evaluate the ability of miR-196b-5p expression to distinguish the cancer tissues from the non-cancer ones. As Figure 9 illustrated, the total AUC of miR-196b-5p expression was 0.80 (95%CI: 0.76-0.83), with the sensitivity being 0.58 (95%CI: 0.41-0.74) and specificity being 0.94 (95%CI: 0.78-0.98).
SROC curve analysis of miR-196b-5p for discriminating HCC from normal liver tissues based on TCGA, GEO and qRT-PCR.
The potential target genes of miR-196b-5p
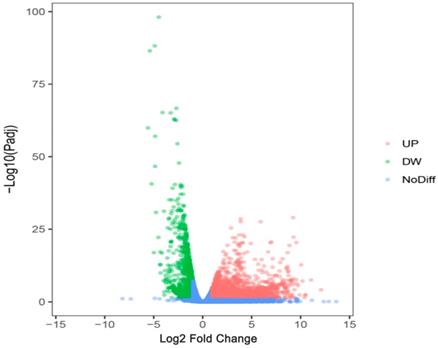
We researchers predicted the target genes of miR-196b-5p with the help of twelve online softwares (miRWalk, miRanda, Microt4, mirBridge, RNA22, miRMap, miRDB, miRNAMap, Pictar2, PITA, RNAhybrid and Targetscan), and then selected 1955 genes that were predicted by at least 5 software. Subsequently, we combined these 1955 genes and 1123 down-regulated mRNAs in TCGA (Log2 Fold Change < -1, P < 0.05) (Figure 10), acquiring 107 overlapping potential target genes (Table 4).
The volcano plot of mRNA expression in HCC based on TCGA database. The pink dots represent up-regulated genes, the green dots represent down-regulated genes and the blue dots are non-differentially expressed genes.
A total of 107 potential target genes of miR-196b-5p
| Gene names | ||||||
|---|---|---|---|---|---|---|
| UROC1 | SPATA18 | PTPRD | NFAM1 | IGFBP3 | DMD | BCO2 |
| TRIB1 | SOWAHC | PRKCB | NAALADL2 | IGF1 | DLGAP2 | BACH2 |
| TMEM56 | SOCS2 | PPARGC1A | MTTP | HAAO | CXCL12 | AXL |
| TMEM25 | SLC46A3 | PLIN2 | MMAA | GYS2 | CTBS | ATP13A4 |
| TMEM220 | SLC41A2 | PLCXD3 | MEGF10 | GJB2 | CR1 | ATP11C |
| TGFBR3 | SLC38A4 | PDGFRA | MCC | FRMD4B | CPN2 | AR |
| TBX15 | SLC38A2 | PDE7B | MBNL2 | FREM2 | CPEB3 | APOF |
| TAPT1 | SLC35D1 | PDE2A | MBL2 | FOXO1 | COLEC11 | ALDOB |
| SYT9 | SLC31A1 | PDE11A | MASP1 | FOS | COBLL1 | ALDH6A1 |
| SYNPO2 | SIGLEC1 | PANK1 | LPIN2 | FAM46A | CHRM2 | ALDH1B1 |
| SULT2A1 | SERPINE1 | PALM2 | KMO | ESR1 | CDH19 | ACVR1C |
| ST6GAL2 | SERPINB9 | PAIP2B | KLHL15 | EPM2A | CD302 | |
| ST3GAL6 | SERPINB8 | OAS2 | KLF11 | EPB41L4B | CD300E | |
| SRD5A1 | RSAD2 | NTN4 | INMT | ELMSAN1 | CCL23 | |
| SPTBN2 | RET | NRXN1 | INHBC | EDNRB | CBFA2T3 | |
| SPRYD4 | RBMS3 | NRBF2 | IL6ST | DPYD | BMPER | |
Annotation, pathway enrichment analysis and PPI network construction
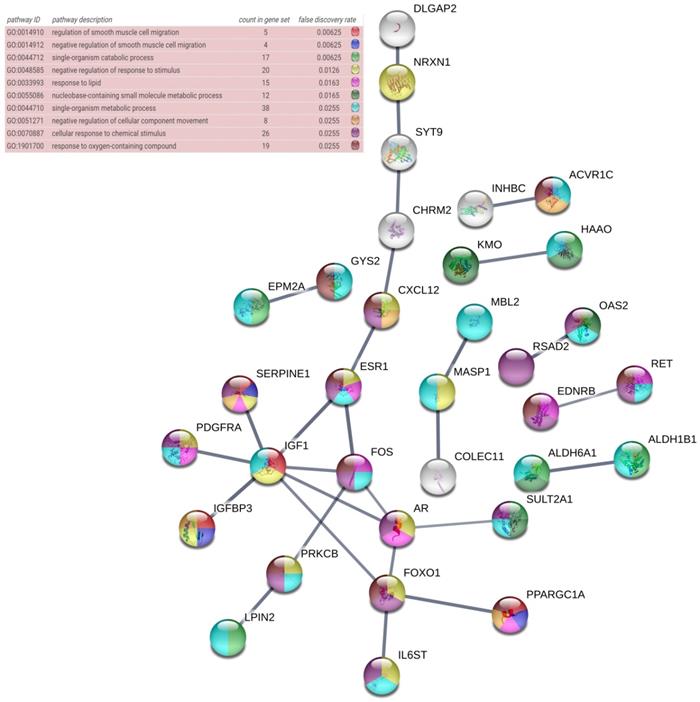
The DAVID database was utilized for GO annotation and KEGG pathway enrichment analysis for the purpose of exploring the functions of these 107 possible target genes of miR-196b-5p as well as the relevant molecular mechanism (Table 5). The GO analysis displayed that in biological process the potential target genes mainly participated in single-organism catabolic process, response to external stimulus, single-organism metabolic process, etc. In cellular component, these potential target genes were mostly enriched in neuronal cell body, cell periphery and extracellular space. In molecular function, the potential target genes largely took part in the molecular process like transmembrane receptor protein kinase activity, 3',5'-cyclic-AMP phosphodiesterase activity, growth factor binding and so on. The KEGG analysis uncovered that the potential target genes were chiefly involved in pathways of tryptophan metabolism, pathways in cancer, complement and coagulation cascades, beta-alanine metabolism, prostate cancer, morphine addiction and so on. Moreover, DO annotation of the potential target genes were conducted via R 3.4.1 (Figure 11), and the top ten terms of DO annotation (based on the P value) were listed in Figure 12. Also, we constructed the PPI network of these 107 possible target genes of miR-196b-5p by STRING (Figure 13).
GO annotation and KEGG pathway enrichment analysis of 107 potential target genes of miR-196b-5p
| ID | Term | Count | % | P Value | Genes |
|---|---|---|---|---|---|
| Biological Process | |||||
| GO:0044712 | single-organism catabolic process | 19 | 17.8 | 1.94E-06 | ALDH6A1, PLCXD3, SULT2A1, ALDOB, IGF1, PDE11A, KMO, CBFA2T3, LPIN2, PPARGC1A, etc. |
| GO:0009605 | response to external stimulus | 28 | 26.2 | 5.53E-05 | MBL2, SLC38A2, MASP1, IL6ST, RSAD2, FOXO1, OAS2, FAM46A, CXCL12, TRIB1, etc. |
| GO:0044710 | single-organism metabolic process | 43 | 40.2 | 6.37E-05 | PLCXD3, IL6ST, ALDOB, PDE11A, FOXO1, KMO, OAS2, CBFA2T3, ACVR1C, EDNRB, etc. |
| GO:0051094 | positive regulation of developmental process | 19 | 17.8 | 6.86E-05 | TAPT1, AR, PTPRD, RET, CPEB3, IL6ST, AXL, IGF1, ATP11C, NRXN1, etc. |
| GO:1901701 | cellular response to oxygen-containing compound | 17 | 15.9 | 9.21E-05 | RET, SOCS2, CPEB3, KLF11, ESR1, AXL, FOXO1, PPARGC1A, TRIB1, EDNRB, etc. |
| GO:0055086 | nucleobase-containing small molecule metabolic process | 15 | 14 | 0.00010186 | ALDH6A1, SULT2A1, ALDOB, PDE11A, IGF1, KMO, OAS2, CBFA2T3, PPARGC1A, EDNRB, etc. |
| GO:0051239 | regulation of multicellular organismal process | 32 | 29.9 | 0.00010961 | TAPT1, IL6ST, CPEB3, RSAD2, FOXO1, FAM46A, CXCL12, MEGF10, FOS, EDNRB, etc. |
| GO:0048806 | genitalia development | 5 | 4.7 | 0.00012226 | AR, AXL, ESR1, SRD5A1, GJB2 |
| GO:1901700 | response to oxygen-containing compound | 22 | 20.6 | 0.00012321 | RET, SOCS2, CPEB3, KLF11, ESR1, AXL, FOXO1, PPARGC1A, CXCL12, TRIB1, etc. |
| GO:0048585 | negative regulation of response to stimulus | 21 | 19.6 | 0.00014142 | CR1, AR, MASP1, SOCS2, IL6ST, EPM2A, ESR1, FOXO1, IGF1, NRXN1, etc. |
| Cellular Component | |||||
| GO:0043025 | neuronal cell body | 10 | 9.3 | 0.0006596 | RET, SLC38A2, CHRM2, IL6ST, SPTBN2, PDE11A, SRD5A1, NRXN1, SLC31A1, PPARGC1A |
| GO:0071944 | cell periphery | 46 | 43 | 0.00115965 | SLC38A4, SLC38A2, IL6ST, CPEB3, SYT9, MEGF10, CXCL12, ACVR1C, EDNRB, PLIN2, etc. |
| GO:0005615 | extracellular space | 19 | 17.8 | 0.00128717 | MBL2, MASP1, IL6ST, AXL, IGF1, CXCL12, CPN2, SERPINB9, CCL23, BMPER, etc. |
| GO:0044297 | cell body | 10 | 9.3 | 0.00170277 | RET, SLC38A2, CHRM2, IL6ST, SPTBN2, PDE11A, SRD5A1, NRXN1, SLC31A1, PPARGC1A |
| GO:0036477 | somatodendritic compartment | 11 | 10.3 | 0.00454342 | RET, SLC38A2, CHRM2, CPEB3, IL6ST, SPTBN2, PDE11A, SRD5A1, NRXN1, SLC31A1, PPARGC1A |
| GO:0005886 | plasma membrane | 43 | 40.2 | 0.004909 | SLC38A4, SLC38A2, IL6ST, CPEB3, SYT9, MEGF10, CXCL12, ACVR1C, EDNRB, PLIN2, etc. |
| GO:0097458 | neuron part | 16 | 15 | 0.00856024 | RET, SLC38A2, CPEB3, DLGAP2, IL6ST, SYT9, PDE11A, NRXN1, PPARGC1A, FOS, etc. |
| GO:0044459 | plasma membrane part | 25 | 23.4 | 0.01229329 | SLC38A4, SLC38A2, CPEB3, IL6ST, CXCL12, MEGF10, ACVR1C, EDNRB, DMD, SLC31A1, etc. |
| GO:0044425 | membrane part | 52 | 48.6 | 0.02036989 | IL6ST, CPEB3, SYT9, CXCL12, MEGF10, ACVR1C, EDNRB, TMEM56, AR, RET, etc. |
| GO:0097060 | synaptic membrane | 6 | 5.6 | 0.02099924 | PDE2A, CHRM2, DLGAP2, CPEB3, DMD, NRXN1 |
| Molecular Function | |||||
| GO:0019199 | transmembrane receptor protein kinase activity | 5 | 4.7 | 0.00122381 | RET, PDGFRA, AXL, TGFBR3, ACVR1C |
| GO:0004115 | 3',5'-cyclic-AMP phosphodiesterase activity | 3 | 2.8 | 0.00320233 | PDE7B, PDE2A, PDE11A |
| GO:0019838 | growth factor binding | 5 | 4.7 | 0.00612277 | IL6ST, PDGFRA, TGFBR3, IGFBP3, ACVR1C |
| GO:0005102 | receptor binding | 17 | 15.9 | 0.00806588 | MBL2, AR, PTPRD, SOCS2, IL6ST, IGF1, NRXN1, CXCL12, PRKCB, EDNRB, etc. |
| GO:0004114 | 3',5'-cyclic-nucleotide phosphodiesterase activity | 3 | 2.8 | 0.01024124 | PDE7B, PDE2A, PDE11A |
| GO:0004112 | cyclic-nucleotide phosphodiesterase activity | 3 | 2.8 | 0.01098852 | PDE7B, PDE2A, PDE11A |
| GO:0008081 | phosphoric diester hydrolase activity | 4 | 3.7 | 0.01599651 | PLCXD3, PDE7B, PDE2A, PDE11A |
| GO:0004118 | cGMP-stimulated cyclic-nucleotide phosphodiesterase activity | 2 | 1.9 | 0.01696476 | PDE2A, PDE11A |
| GO:0030246 | carbohydrate binding | 6 | 5.6 | 0.01739252 | MBL2, SIGLEC1, EPM2A, ALDOB, COLEC11, CD302 |
| GO:0005126 | cytokine receptor binding | 6 | 5.6 | 0.01979523 | CCL23, SOCS2, IL6ST, INHBC, TGFBR3, CXCL12 |
| KEGG pathway | |||||
| hsa00380 | tryptophan metabolism | 4 | 3.7 | 0.00308774 | ALDH1B1, HAAO, KMO, INMT |
| hsa05200 | pathways in cancer | 9 | 8.4 | 0.00752836 | EDNRB, FOS, AR, RET, PDGFRA, FOXO1, IGF1, CXCL12, PRKCB |
| hsa04610 | complement and coagulation cascades | 4 | 3.7 | 0.01409894 | MBL2, CR1, MASP1, SERPINE1 |
| hsa00410 | beta-alanine metabolism | 3 | 2.8 | 0.02166778 | ALDH6A1, ALDH1B1, DPYD |
| hsa05215 | prostate cancer | 4 | 3.7 | 0.02678936 | AR, PDGFRA, FOXO1, IGF1 |
| hsa05032 | morphine addiction | 4 | 3.7 | 0.02920649 | PDE7B, PDE2A, PDE11A, PRKCB |
Note: GO, Gene Ontology; KEGG, Kyoto Encyclopedia of Genes and Genomes.
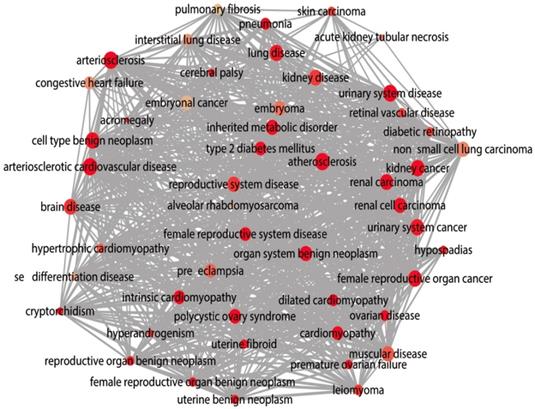
DO functional annotation of the 107 potential target genes of miR-196b-5p, circles represent diseases and edges represent disease-disease associations.
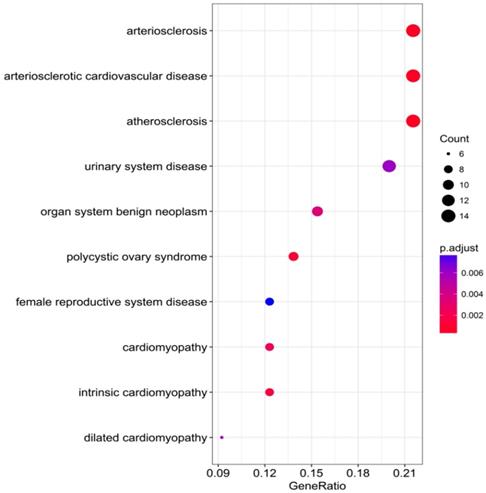
Top 10 DO functional annotation terms of the 107 potential target genes of miR-196b-5p, color tints represent the P-values and size of the circle represent the number of selected genes in the pathway.
PPI network of the 107 potential target genes of miR-196b-5p constructed by STRING online database, nodes represent proteins and edges represent protein-protein associations.
Discussion
The miR-196b-5p, which is categorized into the miR-196b family (containing miR-196a-1, miR-196a-2 and miR-196b), is situated on human chromosome 7p15.2, which is situated in the area of homobox (HOX) gene cluster [43, 44]. The nucleotide sequence of mature miR-196a-1 is the same as that of mature miR-196a-2, but mature miR-196b and mature miR-196a varied in one nucleotide [44]. Abnormally expressed miR-196b was frequently detected in various tumors like head and neck squamous-cell carcinoma (HNSCC), colorectal carcinoma, lung carcinoma, pancreatic cancer, gastric cancer, etc. In HNSCC, the results of Álvarez-Teijeiro et al. suggested that miR-196b exhibited higher expression in HNSCC fresh tissues and paraffin-embedded tissues than in the adjacent ones; in addition, overexpression of miR-196b was detected in the saliva samples [45]. In the case of lung cancer, Bai et al. used qRT-PCR to confirm that remarkably lower expression of miR-196b appeared in various lung cancer cell lines (A549, H-1650 and H-1299) than in healthy lung tissue cells (WI-38 and HEL-1) [46]. In pancreatic cancer, Wang et al. examined the differentially expressed miRNAs of 20 cases of pancreatic cancer tissues and the non-cancer ones, and acquired 39 lowly expressed and 40 highly expressed miRNAs in the cancer tissues. Subsequently, qRT-PCR was used to verify the top five miRNAs: miR-200c, miR-196b, miR-1, miR-200a and let-7b (based on the P value), and it was uncovered that miR-196b, miR-200a and miR-200c were detected to be highly expressed, miR-1 was seen lowly expressed, whereas the expression of let-7b showed no statistical significance in cancer tissues and the non-cancer ones [47]. By ArrayExpress and TCGA, Ren et al. concluded that miR-196b-5p displayed higher expression in colorectal cancer tissues compared with normal colonic mucosa tissues [48]. In gastric carcinoma, Lee et al. took advantage of miRNA microarrays to examine 34 cases of gastric cancer tissues and the adjacent ones, afterwards acquiring 5 highly expressed miRNAs in cancer tissues (miR-196b-5p, miR-215, miR-375, miR-1and miR-370) and 5 lowly expressed miRNAs (miR-2861, miR-483-5p, miR-486-5p, miR-622 and miR-149-3p), and finally confirmed that the expressions of miR-196b-5p and miR-375 were consistent with the microarrays [35]. Studies above all suggested that the aberrantly expressed miR-196b was closely linked with morbid state.
In this research, we researchers applied qRT-PCR to examine the miR-196b-5p expression in HCC, discovering that miR-196b-5p displayed higher expression in HCC tissues than in the adjacent ones with the assistance of endogenous reference genes primer U6. The analysis of relationships between miR-196b-5p expression and the clinicopathologic parameters revealed that the expression was associated with the tumor size, nodule number, vascular and capsular invasions. Following that, we selected the miR-196b-5p from the expression profiling of mature miRNA in TCGA database, and uncovered that higher expression of miR-196b-5p was observed in HCC tissues than in healthy liver tissues; the expression was connected with the sex of patients, pathologic grading and vascular invasion. Afterwards, we researchers analyzed the miRNA microarrays in GEO, and carried out Meta-analysis of miR-196b-5p by combining the results of qRT-PCR and TCGA sequencing data, which verified that miR-196b-5p was differentially expressed and overexpressed in HCC tissues.
Results above indicated that miR-196b-5p was abnormally expressed in HCC; more importantly, it played a pivotal part in the initiation and progression of HCC. Nonetheless, no studies were found on its influences in HCC and the molecular mechanism. The miRNAs perform their functions by entirely or partly binding to the target genes, thereby resulting in the degradation or translational control of the target genes. Furthermore, miRNA would participate in the biological behaviors such as the proliferation of tumor cells, invasion, metastasis and so on [49-51]. The binding of miRNA to target genes had been sufficiently studied, and the prediction of miR-196b-5p target genes was available in many online databases [52]. In this study, taking advantage of 12 online software, we researchers predicted the miR-196b-5p target genes, then selecting those genes appearing in at least 5 software. Next, we combined the genes and the down-regulated mRNAs in TCGA, acquiring the 107 overlapping genes that could be used as possible target genes of miR-196b-5p. Previous studies reported that miR-196b-5p could influence the invasion of tumor cells, metastasis, resistance to drugs, etc. by targeting the downstream target mRNAs and relevant signal transduction pathways. For instance, results of Ren et al. suggested that miR-196b-5p could cause the resistance of colon cancer cells to 5-fluorouracil via STAT3 signal transduction pathway [34]. Stiegelbauer et al. put forth that invasion of colon cancer cells and distant metastasis could be controlled by miR-196b-5p targeting HOXB7 and GALNT5 [36]. In order to clarify the molecular mechanism of miR-196b-5p target genes in HCC, we carried out GO and DO annotations, KEGG pathway enrichment analyses, PPI network construction of the 107 potential target genes, which could elucidate the related pathways and possible biological roles of the potential target genes. The GO annotation unveiled that the top-ranked terms in biological process, cellular component and molecular function were single-organism catabolic process, neuronal cell body and transmembrane receptor protein kinase activity, respectively. The most relevant disease in DO annotation was arteriosclerosis. The tryptophan metabolism pathway ranked first in KEGG pathway enrichment analysis. The PPI network showed that IGF1, FOXO1, AR and FOS were mostly likely to become the core genes of miR-196b-5p potential target genes, which required further experiments for validation.
In this study, we, by means of qRT-PCR, TCGA sequencing data and GEO microarrays, confirmed that miR-196b-5p was expressed remarkably higher in HCC tissues rather than in healthy liver tissues. Moreover, miR-196b-5p expression level had correlations with the clinicopathological parameters such as vascular invasion of HCC. GO annotation revealed that the top-ranked terms in biological process, cellular component and molecular function were single-organism catabolic process, neuronal cell body and transmembrane receptor protein kinase activity, respectively. The most relevant disease in DO annotation was arteriosclerosis. The tryptophan metabolism pathway ranked first in KEGG pathway enrichment analysis. PPI network showed that IGF1, FOXO1, AR and FOS were mostly likely to become the core genes of miR-196b-5p potential target genes, which however required further experiments for validation.
Abbreviations
miRNA: microRNA; HCC: hepatocellular carcinoma; qRT-PCR: quantitative reverse transcription and polymerase chain reaction; TCGA: The Cancer Genome Atlas; GEO: Gene Expression Omnibus; GO: Gene Ontology; DO: Disease Ontology; KEGG: Kyoto Encyclopedia of Genes and Genomes; PPI: Protein-Protein Interaction; SMD: Standard mean difference; 95% CI: 95% confidence interval; I2: inconsistency index; AUC: area under the curve; ROC curve: receiver operating characteristic curve; SROC: summary ROC.
Acknowledgements
This study was supported by the Fund of National Natural Science Foundation of China (No. NSFC81860419 and NSFC81560386), Natural Science Foundation of Guangxi, China (No. 2018GXNSFAA050037 and 2018GXNSFAA294025), Guangxi Medical University Training Program for Distinguished Young Scholars, the Medical Excellence Award, Funded by the Creative Research Development Grant from the First Affiliated Hospital of Guangxi Medical University and Guangxi Zhuang Autonomous Region Health and Family Planning Commission Self-financed Scientific Research Project (No. Z20180979).
Competing Interests
The authors have declared that no competing interest exists.
References
1. Chen W, Zheng R, Baade PD, Zhang S, Zeng H, Bray F. et al. Cancer statistics in China, 2015. CA: a cancer journal for clinicians. 2016;66:115-32
2. Xie DY, Ren ZG, Zhou J, Fan J, Gao Q. Critical appraisal of Chinese 2017 guideline on the management of hepatocellular carcinoma. Hepatobiliary surgery and nutrition. 2017;6:387-96
3. Zhu X, Liu W, Qiu X, Wang Z, Tan C, Bei C. et al. Single nucleotide polymorphisms in MLH1 predict poor prognosis of hepatocellular carcinoma in a Chinese population. Oncotarget. 2017;8:80039-49
4. Fu J, Wang H. Precision diagnosis and treatment of liver cancer in China. Cancer letters. 2018;412:283-8
5. Ozakyol A. Global Epidemiology of Hepatocellular Carcinoma (HCC Epidemiology). Journal of gastrointestinal cancer. 2017;48:238-240
6. Bei C, Tan C, Zhu X, Wang Z, Tan S. Association Between Polymorphisms in CMTM Family Genes and Hepatocellular Carcinoma in Guangxi of China. DNA and cell biology. 2018;7:691-696
7. Lan F, Wei H, Zhu X, Li S, Qin X. Increased Red Cell Distribution Width is Strong Inflammatory Marker of Liver Diseases in a Guangxi Population. Clinical laboratory. 2017;63:389-98
8. Shiina S, Sato K, Tateishi R, Shimizu M, Ohama H, Hatanaka T. et al. Percutaneous Ablation for Hepatocellular Carcinoma: Comparison of Various Ablation Techniques and Surgery. Canadian journal of gastroenterology & hepatology. 2018 vol. 2018: Article ID 4756147: 8
9. Ayuso C, Rimola J, Vilana R, Burrel M, Darnell A, Garcia-Criado A. et al. Diagnosis and staging of hepatocellular carcinoma (HCC): current guidelines. European journal of radiology. 2018;101:72-81
10. Amicone L, Marchetti A. Microenvironment and tumor cells: two targets for new molecular therapies of hepatocellular carcinoma. Translational gastroenterology and hepatology. 2018;3:24
11. Dhanasekaran R, Gabay-Ryan M, Baylot V, Lai I, Mosley A, Huang X. et al. Anti-miR-17 therapy delays tumorigenesis in MYC-driven hepatocellular carcinoma (HCC). Oncotarget. 2018;9:5517-28
12. Li H, He G, Yao H, Song L, Zeng L, Peng X. et al. TGF-beta Induces Degradation of PTHrP Through Ubiquitin-Proteasome System in Hepatocellular Carcinoma. Journal of Cancer. 2015;6:511-8
13. Yao Z, Xiong Z, Li R, Liang H, Jia C, Deng M. Long non-coding RNA NRON is downregulated in HCC and suppresses tumour cell proliferation and metastasis. Biomedicine & pharmacotherapy = Biomedecine & pharmacotherapie. 2018;104:102-9
14. Song X, Tan S, Wu Z, Xu L, Wang Z, Xu Y. et al. HBV suppresses ZHX2 expression to promote proliferation of HCC through miR-155 activation. International journal of cancer. 2018;43:3120-3130
15. Chen L, Guo P, He Y, Chen Z, Chen L, Luo Y. et al. HCC-derived exosomes elicit HCC progression and recurrence by epithelial-mesenchymal transition through MAPK/ERK signalling pathway. Cell death & disease. 2018;9:513
16. Ni WJ, Leng XM. miRNA-Dependent Activation of mRNA Translation. MicroRNA (Shariqah, United Arab Emirates). 2016;5:83-6
17. Tahamtan A, Teymoori-Rad M, Nakstad B, Salimi V. Anti-Inflammatory MicroRNAs and Their Potential for Inflammatory Diseases Treatment. Frontiers in immunology. 2018;9:1377
18. Ankasha SJ, Shafiee MN, Wahab NA, Ali RAR, Mokhtar NM. Post-transcriptional regulation of microRNAs in cancer: From prediction to validation. Oncology reviews. 2018;12:344
19. Hahne JC, Valeri N. Non-Coding RNAs and Resistance to Anticancer Drugs in Gastrointestinal Tumors. Frontiers in oncology. 2018;8:226
20. Vasuri F, Visani M, Acquaviva G, Brand T, Fiorentino M, Pession A. et al. Role of microRNAs in the main molecular pathways of hepatocellular carcinoma. World journal of gastroenterology. 2018;24:2647-60
21. Chen E, Xu X, Liu R, Liu T. Small but Heavy Role: MicroRNAs in Hepatocellular Carcinoma Progression. BioMed research international. 2018 vol. 2018: Article ID 6784607: 9
22. Tan X, Fu Y, Chen L, Lee W, Lai Y, Rezaei K. et al. miR-671-5p inhibits epithelial-to-mesenchymal transition by downregulating FOXM1 expression in breast cancer. Oncotarget. 2016;7:293-307
23. Wallis CJ, Gordanpour A, Bendavid JS, Sugar L, Nam RK, Seth A. MiR-182 Is Associated with Growth, Migration and Invasion in Prostate Cancer via Suppression of FOXO1. Journal of Cancer. 2015;6:1295-305
24. Zhang W, Sun Z, Su L, Wang F, Jiang Y, Yu D. et al. miRNA-185 serves as a prognostic factor and suppresses migration and invasion through Wnt1 in colon cancer. European journal of pharmacology. 2018;825:75-84
25. Li H, Jin X, Chen B, Li P, Li Q. Autophagy-regulating microRNAs: potential targets for improving radiotherapy. Journal of cancer research and clinical oncology. 2018;144:163-1634
26. An Y, Gao S, Zhao WC, Qiu BA, Xia NX, Zhang PJ. et al. Novel serum microRNAs panel on the diagnostic and prognostic implications of hepatocellular carcinoma. World journal of gastroenterology. 2018;24:2596-604
27. Yu L, Zhao J, Gao L. Predicting Potential Drugs for Breast Cancer based on miRNA and Tissue Specificity. International journal of biological sciences. 2018;14:971-82
28. Wu X, Tan X, Fu SW. May Circulating microRNAs be Gastric Cancer Diagnostic Biomarkers? Journal of Cancer. 2015;6:1206-13
29. Nam RK, Benatar T, Amemiya Y, Wallis CJD, Romero JM, Tsagaris M. et al. MicroRNA-652 induces NED in LNCaP and EMT in PC3 prostate cancer cells. Oncotarget. 2018;9:19159-76
30. Nam RK, Benatar T, Wallis CJ, Amemiya Y, Yang W, Garbens A. et al. MiR-301a regulates E-cadherin expression and is predictive of prostate cancer recurrence. The Prostate. 2016;76:869-84
31. He D, Wang J, Zhang C, Shan B, Deng X, Li B. et al. Down-regulation of miR-675-5p contributes to tumor progression and development by targeting pro-tumorigenic GPR55 in non-small cell lung cancer. Molecular cancer. 2015;14:73
32. Li Y, Deng X, Zeng X, Peng X. The Role of Mir-148a in Cancer. Journal of Cancer. 2016;7:1233-41
33. Wang J, Song C, Tang H, Zhang C, Tang J, Li X. et al. miR-629-3p may serve as a novel biomarker and potential therapeutic target for lung metastases of triple-negative breast cancer. Breast cancer research: BCR. 2017;19:72
34. Ren D, Lin B, Zhang X, Peng Y, Ye Z, Ma Y. et al. Maintenance of cancer stemness by miR-196b-5p contributes to chemoresistance of colorectal cancer cells via activating STAT3 signaling pathway. Oncotarget. 2017;8:49807-23
35. Lee SW, Park KC, Kim JG, Moon SJ, Kang SB, Lee DS. et al. Dysregulation of MicroRNA-196b-5p and MicroRNA-375 in Gastric Cancer. Journal of gastric cancer. 2016;16:221-9
36. Stiegelbauer V, Vychytilova-Faltejskova P, Karbiener M, Pehserl AM, Reicher A, Resel M. et al. miR-196b-5p Regulates Colorectal Cancer Cell Migration and Metastases through Interaction with HOXB7 and GALNT5. Clinical cancer research: an official journal of the American Association for Cancer Research. 2017;23:5255-66
37. Shen J, Wang S, Zhang YJ, Kappil MA, Chen Wu H, Kibriya MG. et al. Genome-wide aberrant DNA methylation of microRNA host genes in hepatocellular carcinoma. Epigenetics. 2012;7:1230-7
38. Cao J, Sun L, Li J, Zhou C, Cheng L, Chen K. et al. A novel threemiRNA signature predicts survival in cholangiocarcinoma based on RNASeq data. Oncology reports. 2018;40:1422-1434
39. He RQ, Wu PR, Xiang XL, Yang X, Liang HW, Qiu XH. et al. Downregulated miR-23b-3p expression acts as a predictor of hepatocellular carcinoma progression: A study based on public data and RT-qPCR verification. International journal of molecular medicine. 2018;41:2813-31
40. Dweep H, Gretz N, Sticht C. miRWalk database for miRNA-target interactions. Methods in molecular biology (Clifton, NJ). 2014;1182:289-305
41. Gao L, Zhang LJ, Li SH, Wei LL, Luo B, He RQ. et al. Role of miR-452-5p in the tumorigenesis of prostate cancer: A study based on the Cancer Genome Atl (TCGA), Gene Expression Omnibus (GEO), and bioinformatics analysis. Pathology, research and practice. 2018;214:732-49
42. Zhang Y, Li XJ, He RQ, Wang X, Zhang TT, Qin Y. et al. Upregulation of HOXA1 promotes tumorigenesis and development of nonsmall cell lung cancer: A comprehensive investigation based on reverse transcription-quantitative polymerase chain reaction and bioinformatics analysis. International journal of oncology. 2018;53:73-86
43. Yekta S, Shih IH, Bartel DP. MicroRNA-directed cleavage of HOXB8 mRNA. Science (New York, NY). 2004;304:594-6
44. Tanzer A, Amemiya CT, Kim CB, Stadler PF. Evolution of microRNAs located within Hox gene clusters. Journal of experimental zoology Part B, Molecular and developmental evolution. 2005;304:75-85
45. Alvarez-Teijeiro S, Menendez ST, Villaronga MA, Rodrigo JP, Manterola L, de Villalain L. et al. Dysregulation of Mir-196b in Head and Neck Cancers Leads to Pleiotropic Effects in the Tumor Cells and Surrounding Stromal Fibroblasts. Scientific reports. 2017;7:17785
46. Bai X, Meng L, Sun H, Li Z, Zhang X, Hua S. MicroRNA-196b Inhibits Cell Growth and Metastasis of Lung Cancer Cells by Targeting Runx2. Cellular physiology and biochemistry: international journal of experimental cellular physiology, biochemistry, and pharmacology. 2017;43:757-67
47. Wang HL, Zhou R, Liu J, Chang Y, Liu S, Wang XB. et al. MicroRNA-196b inhibits late apoptosis of pancreatic cancer cells by targeting CADM1. Scientific reports. 2017;7:11467
48. Ge J, Chen Z, Li R, Lu T, Xiao G. Upregulation of microRNA-196a and microRNA-196b cooperatively correlate with aggressive progression and unfavorable prognosis in patients with colorectal cancer. Cancer cell international. 2014;14:128
49. Vannini I, Fanini F, Fabbri M. Emerging roles of microRNAs in cancer. Current opinion in genetics & development. 2018;48:128-33
50. Liu W, Ma R, Yuan Y. Post-transcriptional Regulation of Genes Related to Biological Behaviors of Gastric Cancer by Long Noncoding RNAs and MicroRNAs. Journal of Cancer. 2017;8:4141-54
51. Wang J, Liu L, Sun Y, Xue Y, Qu J, Pan S. et al. miR-615-3p promotes proliferation and migration and inhibits apoptosis through its potential target CELF2 in gastric cancer. Biomedicine & pharmacotherapy = Biomedecine & pharmacotherapie. 2018;101:406-13
52. Riffo-Campos AL, Riquelme I, Brebi-Mieville P. Tools for Sequence-Based miRNA Target Prediction: What to Choose? International journal of molecular sciences. 2016;17:1987
Author contact
![]() Corresponding author: Prof. Dr. Zhen-bo Feng and Gang Chen, Department of Pathology, The First Affiliated Hospital of Guangxi Medical University, No. 6 Shuangyong Road, Nanning, Guangxi Zhuang Autonomous Region 530021, P. R. China; Fax: +86 771 5356534; Email: fengzhenbo_gxmucom, chengangedu.cn.
Corresponding author: Prof. Dr. Zhen-bo Feng and Gang Chen, Department of Pathology, The First Affiliated Hospital of Guangxi Medical University, No. 6 Shuangyong Road, Nanning, Guangxi Zhuang Autonomous Region 530021, P. R. China; Fax: +86 771 5356534; Email: fengzhenbo_gxmucom, chengangedu.cn.