Impact Factor ISSN: 1837-9664

 Global reach, higher impact
J Cancer 2019; 10(19):4596-4602. doi:10.7150/jca.31184 This issue Cite
Research Paper
The risk trajectory between preoperative fasting glucose and common digestive tract cancer-specific mortality in the FIESTA cohort involving 6865 Chinese patients
Dan Hu1*, Feng Peng2* ![]() , Xiandong Lin3, Hejun Zhang1, Yan Xia1, Jinxiu Lin2, Xiongwei Zheng1, Wenquan Niu4
, Xiandong Lin3, Hejun Zhang1, Yan Xia1, Jinxiu Lin2, Xiongwei Zheng1, Wenquan Niu4 ![]()
1. Department of Pathology, Fujian Cancer Hospital & Fujian Medical University Cancer Hospital, Fuzhou, Fujian, China
2. Department of Cardiology, The First Affiliated Hospital of Fujian Medical University, Fuzhou, Fujian, China
3. Department of Radiobiology, Fujian Cancer Hospital & Fujian Medical University Cancer Hospital, Fuzhou, Fujian, China
4. Institute of Clinical Medical Sciences, China-Japan Friendship Hospital, Beijing, China
*Shared first authors.
Received 2018-11-2; Accepted 2019-5-21; Published 2019-8-7
Abstract
Backgrounds: High blood glucose or hyperglycemia is an established risk factor for the development and progression of cancer at many sites, whereas data on the relevance between low blood glucose or hypoglycemia and cancer survival are lacking.
Aims: We aimed to assess the shape of risk trajectory between preoperative fasting glucose and postoperative digestive cancer-specific mortality in Chinese.
Methods: In total, 6865 patients who underwent radical surgery for esophageal cancer (n=2535), gastric cancer (n=3012) and colorectal cancer (n=1318) during 2000-2010 were followed up as of December 2015. All patients received neither chemotherapy nor radiotherapy before and after the surgery. Optimal cutoff points were determined using survival tree analysis.
Results: The median follow-up time was 44.9 months (range: 0.5-188.9 months), with 1065 deaths from esophageal cancer, 1331 from gastric cancer and 412 from colorectal cancer. Using fasting glucose (4.36, 6.09] mmol/L as the reference group, hazard ratios for fasting glucose ≤4.36, (6.09, 8.95], (8.95, 11.5] and >11.5 mmol/L were 1.35 (95% confidence interval: 1.19, 1.54), 2.82 (2.57, 3.11), 3.56 (3.10, 4.08) and 4.27 (3.67, 4.97), respectively (p<0.001).
Conclusions: Our findings indicate a U-shaped risk trajectory between preoperative fasting glucose and digestive tract cancer-specific mortality in Chinese. Further external validation is warranted.
Keywords: digestive tract cancer, fasting glucose, prognosis, mortality.
Introduction
It is widely recognized that high blood glucose or hyperglycemia is an established risk factor for the development and progression of cancer [1-3]. The underlying mechanisms connecting hyperglycemia and cancer have been long debated [4,5], and a possible explanation is that chronic hyperglycemia can mediate physiological alteration and metabolic distortion that further leads to organ dysfunction, infection, cancer progression and other pathophysiological consequences [6]. We have recently in the Fujian prospective investigation of cancer (FIESTA) study, assessed the prognostic association of preoperative metabolic syndrome and its components with the disease-specific mortality of esophageal squamous cell carcinoma [7], gastric cancer [8] and colorectal cancer [9], respectively. Our findings consistently indicated that hyperglycemia was an independent significant predictor of poor prognosis for common digestive tract cancer. However, a systematic literature search has failed to reveal any proofs linking low blood glucose or hypoglycemia to cancer survival. An emerging body of evidence supports that hypoglycemia can induce a pro-inflammatory state [10], which has a detrimental role in carcinogenesis [11]. We therefore developed a hypothesis that hypoglycemia may be associated with an increased mortality risk for digestive tract cancer. To test this hypothesis, in post hoc analysis of the FIESTA study, we aimed to assess the shape of risk trajectory between preoperative fasting glucose and postoperative specific mortality of three types of common digestive tract cancer mentioned above, overall and by cancer type.
Methods
The FIESTA study
The FIESTA study is an ongoing investigation of preoperative factors for predicting disease-specific mortality of common digestive tract cancer, including sites at esophagus, stomach and colon and rectum.
Study patients
Using data from the FIESTA cohort [7-9,12-20], a total of 6865 eligible patients who underwent radical surgery for esophageal cancer (n=2535), gastric cancer (n=3012) and colorectal cancer (n=1318) at Fujian Provincial Cancer Hospital (the current Fujian Cancer Hospital & Fujian Medical University Cancer Hospital) and survived hospitalization between January 2000 and December 2010 were analyzed in the current study, and they were followed up as of December 2015. The FIESTA study got approval from the Ethical Committee of the Fujian Provincial Cancer Hospital, and all patients gave written informed consent.
Digestive tract cancer was confirmed with preoperative biopsy or postoperative pathologic examination. All patients are unrelated Han Chinese, and they received neither chemotherapy nor radiotherapy before and after the surgery.
Follow-up evaluation
Follow-up was conducted annually after discharge either at the Out-Patient Department of Fujian Provincial Cancer Hospital or through calling or sending post letters in case of no-show on scheduled time. If death occurred during follow-up, the exact date was traced either through his/her relatives or medical reports. The study design, recruitment procedure, eligibility criteria and follow-up assessment have been described previously [7-9,13,14,16].
Baseline data
At enrollment, each patient was asked to complete a self-designed structured questionnaire covering information on social demographic and anthropometric characteristics, including age, gender, cigarette smoking status, alcohol drinking status and family cancer history. Meanwhile, body weight and height were measured to calculate body mass index (BMI). Blood pressure was also measured, and hypertension was defined as systolic blood pressure ≥140 mm Hg or diastolic blood pressure ≥90 mm Hg or intake of antihypertension agents.
Clinicopathologic data
A pair of cancer tissue and near normal tissue was cut from each patient during radical resection. All tissue samples were formalin-fixed and paraffin-embedded, and they were pathologically analyzed at the Department of Pathology, Fujian Provincial Cancer Hospital.
Clinicopathologic data were got from medical charts and pathological reports, including invasion depth, regional lymph node metastasis, distant metastasis, differentiation, tumor embolus and tumor nodes metastasis (TNM) stage (I, II, III and IV) [21].
Fasting (at least 8 hours) venous blood sample was collected into the EDTA-K2 anticoagulative tubes at the morning of undergoing the surgery. Plasma triglycerides, total cholesterol, and high-density lipoprotein cholesterol and low-density lipoprotein cholesterol were measured per standard procedures. Fasting blood glucose was determined by an automated glucose oxidase method.
Survival time definition
Cancer-specific survival time was defined as the time from the date of radical surgery to the date of the death from specific types of three common digestive tract cancer under study or the date of the last follow-up, whichever occurred first.
Statistical analysis
The optimal cutoff points of preoperative fasting glucose concentrations were determined in survival tree analysis implemented by the STREE program (http://c2s2.yale.edu/software/stree/). In detail, only preoperative fasting glucose was incorporated in the analysis, along with clinical endpoint and survival time, and node value was extracted to constitute a partition of study patients.
Difference in survival rates was presented in Kaplan-Meier curve and judged by Log-rank test. Risk prediction, expressed as hazards ratio (HR) and 95% confidence interval (95% CI), was estimated using the Weibull hazards regression model. Statistical analysis was implemented using the Stata/SE software (StataCorp, TX, version 14.1). Study power was estimated using the PS-Power Simple Size software (version 3.1.2).
Results
The median follow-up time was 44.9 months (range: 0.5-188.9 months), with 2808 deaths from digestive tract cancer (1065 from esophageal cancer, 1331 from gastric cancer and 412 from colorectal cancer). The overall median survival time was 113.4 months.
Among all study patients, four potential cutoff points of fasting glucose concentrations preoperatively at 4.36, 6.09, 8.95, 11.5 mmol/L were determined in survival tree analysis. Accordingly, 6865 patients were classified into five groups according to above glucose thresholds in mmol/L: fasting glucose concentrations ≤4.36 (group I: n=891), (4.36, 6.09] (group II: n=3469), (6.09, 8.95] (group III: n=1440), (8.95, 11.5] (group IV: n=430) and >11.5 (group V: n=635).
Baseline demographic and clinicopathologic characteristics stratified by five fasting glucose groups are shown in Table 1.
Baseline characteristics of study patients with common digestive tract cancer according to preoperative fasting glucose
| Characteristics | Preoperative fasting glucose (mmol/L) | ||||
|---|---|---|---|---|---|
| Group I (≤ 4.36) | Group II (4.36, 6.09) | Group III (6.09, 8.95) | Group IV (8.95, 11.5) | Group V> 11.5 | |
| No. of patients | 891 | 3469 | 1440 | 430 | 635 |
| Age at cancer diagnosis (years) | 55.48 (11.42) | 56.84 (10.67) | 58.79 (10.73) | 59.66 (10.77) | 59.88 (10.61) |
| Males | 676 (75.87%) | 2495 (71.92%) | 1035 (71.88%) | 300 (69.77%) | 430 (67.72%) |
| Females | 215 (24.13%) | 974 (28.08%) | 405 (28.13%) | 130 (30.23%) | 205 (32.28%) |
| Cigarette smokers | 258 (29.52%) | 881 (26.02%) | 364 (25.60%) | 108 (25.78%) | 90 (14.98%) |
| Alcohol drinkers | 118 (13.50%) | 351 (10.38%) | 142 (9.98%) | 35 (8.35%) | 38 (6.33%) |
| Family cancer history | 93 (10.68%) | 362 (10.71%) | 151 (10.62%) | 42 (10.02%) | 34 (5.67%) |
| BMI (kg/m2) | 22.62 (2.70) | 22.56 (2.93) | 23.25 (3.27) | 23.54 (3.41) | 22.90 (3.15) |
| BMI category | |||||
| ≤ 24 kg/m2 | 726 (81.48%) | 2418 (69.70%) | 867 (60.21%) | 239 (55.58%) | 327 (51.50%) |
| (24, 28] kg/m2 | 148 (16.61%) | 904 (26.06%) | 467 (32.43%) | 144 (33.49%) | 184 (28.98%) |
| > 28 kg/m2 | 17 (1.91%) | 147 (4.24%) | 106 (7.36%) | 47 (10.93%) | 124 (19.53%) |
| SBP (mmHg) | 120.34 (18.59) | 122.85 (17.96) | 128.61 (19.60) | 129.89 (21.03) | 131.45 (20.24) |
| DBP (mmHg) | 75.67 (10.96) | 76.75 (10.49) | 79.17 (11.10) | 79.61 (12.34) | 79.94 (12.31) |
| TG (mmol/L) | 1.04 (0.70) | 1.14 (0.80) | 1.35 (1.03) | 1.50 (1.14) | 1.48 (1.25) |
| TC (mmol/L) | 4.36 (0.94) | 4.68 (1.02) | 4.72 (1.19) | 4.63 (1.16) | 4.64 (1.19) |
| HDLC (mmol/L) | 1.12 (0.36) | 1.15 (0.39) | 0.98 (0.39) | 0.94 (0.52) | 0.92 (0.39) |
| LDLC (mmol/L) | 2.91 (0.84) | 3.06 (0.91) | 3.11 (1.06) | 3.01 (0.97) | 3.02 (1.01) |
| Glucose (mmol/L) | 4.03 (0.37) | 5.02 (0.42) | 7.18 (0.83) | 9.97 (0.68) | 14.11 (2.59) |
| Hypertension | 181 (20.41%) | 766 (22.16%) | 526 (36.55%) | 157 (37.12%) | 128 (20.65%) |
| Cancer site | |||||
| Esophageal cancer | 353 (39.62%) | 1350 (38.92%) | 530 (36.81%) | 161 (37.44%) | 141 (22.20%) |
| Gastric cancer | 360 (40.40%) | 1408 (40.59%) | 684 (47.50%) | 193 (44.88%) | 367 (57.80%) |
| Colorectal cancer | 178 (19.98%) | 711 (20.50%) | 226 (15.69%) | 76 (17.67%) | 127 (20.00%) |
| Invasion depth | |||||
| T1 | 69 (7.74%) | 393 (11.33%) | 102 (7.08%) | 36 (8.37%) | 43 (6.77%) |
| T2 | 116 (13.02%) | 517 (14.90%) | 169 (11.74%) | 43 (10.00%) | 105 (16.54%) |
| T3 | 514 (57.69%) | 1829 (52.73%) | 788 (54.72%) | 221 (51.40%) | 268 (42.20%) |
| T4 | 192 (21.55%) | 730 (21.04%) | 381 (26.46%) | 130 (30.23%) | 219 (34.49%) |
| Regional LNM | |||||
| N0 | 335 (37.60%) | 1449 (41.77%) | 431 (29.93%) | 137 (31.86%) | 161 (25.35%) |
| N1 | 280 (31.43%) | 1005 (28.97%) | 416 (28.89%) | 111 (25.81%) | 165 (25.98%) |
| N2 | 225 (25.25%) | 821 (23.67%) | 449 (31.18%) | 129 (30.00%) | 176 (27.72%) |
| N3 | 51 (5.72%) | 194 (5.59%) | 144 (10.00%) | 53 (12.33%) | 133 (20.94%) |
| Distant metastasis | |||||
| Negative | 652 (73.18%) | 2673 (77.05%) | 997 (69.24%) | 267 (62.09%) | 451 (71.02%) |
| Positive | 239 (26.82%) | 796 (22.95%) | 443 (30.76%) | 163 (37.91%) | 184 (28.98%) |
| Differentiation | |||||
| High | 82 (9.20%) | 273 (7.87%) | 82 (5.69%) | 27 (6.28%) | 93 (14.65%) |
| Moderate | 484 (54.32%) | 1992 (57.42%) | 720 (50.00%) | 227 (52.79%) | 282 (44.41%) |
| Low | 325 (36.48%) | 1204 (34.71%) | 638 (44.31%) | 176 (40.93%) | 260 (40.94%) |
| Tumor embolus | |||||
| Negative | 703 (78.90%) | 2677 (77.17%) | 982 (68.19%) | 291 (67.67%) | 124 (19.53%) |
| Positive | 188 (21.10%) | 792 (22.83%) | 458 (31.81%) | 139 (32.33%) | 511 (80.47%) |
| TNM stage | |||||
| I | 98 (11.00%) | 513 (14.79%) | 126 (8.75%) | 38 (8.84%) | 12 (1.89%) |
| II | 230 (25.81%) | 970 (27.96%) | 323 (22.43%) | 88 (20.47%) | 171 (26.93%) |
| III | 503 (56.45%) | 1803 (51.97%) | 813 (56.46%) | 244 (56.74%) | 339 (53.39%) |
| IV | 60 (6.73%) | 183 (5.28%) | 178 (12.36%) | 60 (13.95%) | 113 (17.80%) |
Abbreviations: BMI, body mass index; SBP, systolic blood pressure; DBP, diastolic blood pressure; TG, triglyceride; TC, total cholesterol; HDLC, high-density lipoprotein cholesterol; LDLC, low-density lipoprotein cholesterol; LNM, lymph node metastasis; TNM, tumor nodes metastasis. Data are expressed as either mean (standard deviation) or count (percentage).
The distributions of preoperative fasting glucose concentrations in 0.5 mmol/L increments among all study patients are presented as a frequency histogram (Figure 1, the upper panel).
The distribution of preoperative fasting blood glucose in all patients with common digestive tract cancer (the upper panel) and Kaplan-Meier survival curves according to preoperative fasting blood glucose (the lower panel).
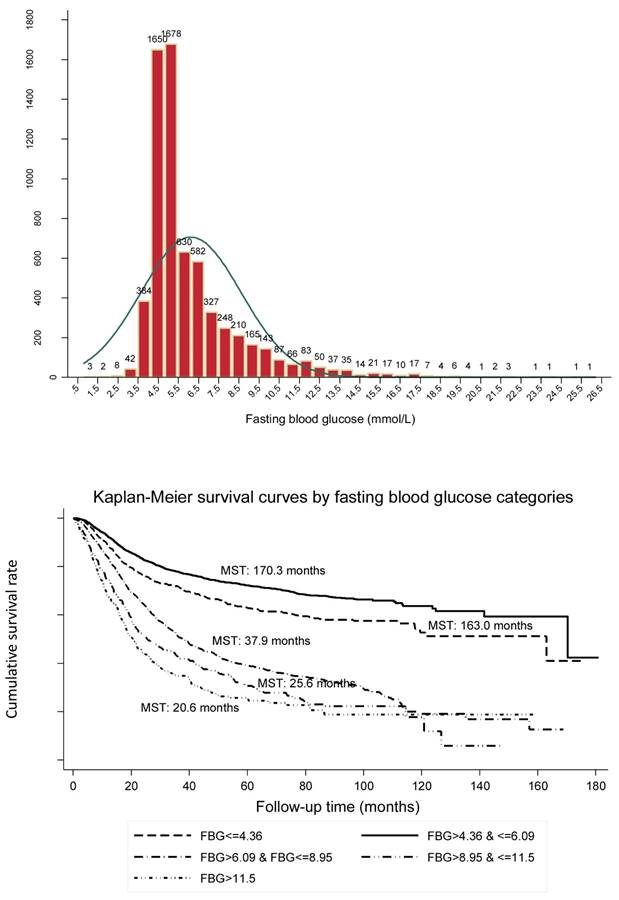
The Kaplan-Meier curve showed good discrimination of cancer-specific survival for all five fasting glucose groups (Log-rank test p<0.001), as shown in Figure 1 (the lower panel). It is worth noting that patients in group II (median survival time [MST]: 170.3 months) had the best prognosis, followed by group I (MST: 163.0 months), group III (MST: 37.9 months), group IV (MST: 25.6 months) and group V (MST: 20.6 months).
Using group II as the reference group, HRs for group I, group III, group IV and group V were 1.35 (95% CI: 1.19, 1.54), 2.82 (95% CI: 2.57, 3.11), 3.56 (95% CI: 3.10, 4.08) and 4.27 (95% CI: 3.67, 4.97), respectively (all p<0.001) after adjusting for confounding factors in overall analysis (Table 2). The power to detect statistical significance was over 99% for above estimates.
Risk prediction of preoperative fasting blood glucose in categories for common digestive tract cancer-specific mortality
| Group | Adjustment* | Preoperative fasting glucose (mmol/L) | ||||
|---|---|---|---|---|---|---|
| Group I (≤ 4.36) | Group II (4.36, 6.09] | Group III (6.09, 8.95] | Group IV (8.95, 11.5] | Group V > 11.5 | ||
| Overall | Unadjusted | 1.39 (1.23, 1.57) <0.001 | Reference | 2.78 (2.54, 3.05) <0.001 | 3.60 (3.16, 4.11) <0.001 | 4.28 (3.70, 4.95) <0.001 |
| Adjusted | 1.35 (1.19, 1.54) <0.001 | Reference | 2.82 (2.57, 3.11) <0.001 | 3.56 (3.10, 4.08) <0.001 | 4.27 (3.67, 4.97) <0.001 | |
| Cancer site | ||||||
| Esophageal cancer | Unadjusted | 1.28 (1.07, 1.82) <0.001 | Reference | 1.80 (1.55, 2.10) <0.001 | 2.38 (1.92, 2.97) <0.001 | 2.49 (1.94, 3.18) <0.001 |
| Adjusted | 1.26 (1.05, 1.51) 0.015 | Reference | 1.81 (1.56, 2.11) <0.001 | 2.40 (19.2, 3.01) <0.001 | 2.51 (1.95, 3.22) <0.001 | |
| Gastric cancer | Unadjusted | 1.50 (1.23, 1.82) <0.001 | Reference | 3.30 (2.89, 3.78) <0.001 | 4.33 (3.58, 5.23) <0.001 | 5.10 (4.12, 6.31) <0.001 |
| Adjusted | 1.47 (1.20, 1.81) <0.001 | Reference | 3.39 (2.93, 3.93) <0.001 | 4.18 (3.39, 5.14) <0.001 | 5.10 (4.05, 6.43) <0.001 | |
| Colorectal cancer | Unadjusted | 1.44 (1.02, 2.04) 0.039 | Reference | 4.63 (3.62, 5.91) <0.001 | 5.84 (4.17, 8.18) <0.001 | 9.80 (6.87, 13.97) <0.001 |
| Adjusted | 1.40 (1.05, 2.10) 0.026 | Reference | 5.00 (3.89, 6.42) <0.001 | 6.01 (4.25, 8.52) <0.001 | 9.99 (6.96, 14.32) <0.001 | |
| Stage | ||||||
| I-II | Unadjusted | 1.63 (1.20, 2.20) 0.002 | Reference | 4.09 (3.27, 5.11) <0.001 | 4.74 (3.41, 6.60) <0.001 | 5.99 (4.04, 8.87) <0.001 |
| Adjusted | 1.58 (1.15, 2.16) 0.004 | Reference | 4.08 (3.23, 5.14) <0.001 | 4.89 (3.49, 6.87) <0.001 | 6.00 (4.01, 8.97) <0.001 | |
| III-IV | Unadjusted | 1.26 (1.10, 1.44) 0.001 | Reference | 2.29 (2.07, 2.53) <0.001 | 2.97 (2.57, 3.43) <0.001 | 3.33 (2.85, 3.90) <0.001 |
| Adjusted | 1.26 (1.09, 1.45) 0.001 | Reference | 2.32 (2.08, 2.57) <0.001 | 2.90 (2.49, 3.38) <0.001 | 3.29 (2.79, 3.88) <0.001 | |
Data are expressed as hazard ratio (95% confidence interval) p value. *Adjusted variables included age, sex, body mass index, smoking, drinking, family cancer history, hypertension, triglyceride and total cholesterol.
Significance persisted after grouping patients by cancer type and TNM stage. Risk prediction was particularly evident for patients with gastric cancer, and for patients at early stages (I and II).
Discussion
This large prospective cohort study of patients with common digestive tract cancer provides strong evidence for a U-shaped risk trajectory between preoperative fasting glucose and postoperative digestive tract cancer-specific mortality in Chinese with a median follow-up of 44.9 months. Compared with patients with preoperative fasting glucose concentrations ranging 4.36-6.09 mmol/L, the cancer-specific mortality risk was significantly increased for both lower (than 4.36 mml/L) and higher (than 6.09 mmol/L) fasting glucose. The relation was particularly evident for gastric cancer and early stages.
The observations that elevated blood glucose is associated with high risk or poor prognosis of cancer at many sites have been widely made in the medical literature [22-25]. However, relevant data on low blood glucose or hypoglycemia are sparse and only restricted to cancer risk [26]. As a symptom of cancer, hypoglycemia is drawing much concern from a biological aspect. For example, low glucose stress can decrease cellular NADH and mitochondrial ATP in colonic epithelial cancer cells [27]. Additionally, low glucose can enhance the cytotoxicity of metformin to cancer cells both in vitro and in vivo [28]. We in the FIESTA cohort study show that preoperative fasting glucose concentration less than 4.36 mmol/L was independently associated with a 35% increased mortality risk of common digestive tract cancer, especially for early stages (58% increase) and gastric cancer (47% increase). Irrespective of underlying mechanisms, low fasting glucose before the surgery can clearly identify patients with poorer postoperative prognosis who could benefit from closer monitoring.
In this study, we employed survival tree analysis to determine optimal cutoff points for fasting glucose. A conventional method to determine cutoffs is the adoption of receiver operating characteristic (ROC) curve, yet this method often produces different points across studies, which limits the generalizability. For this case, several splitting criteria have been developed, including classification and regression trees (CART) and multivariate adaptive regression splines (MARS) [29,30]. Although the relative merits of these criteria are not clearly resolved, survival tree-based method has been applicable to more general situations on the basis of scientific judgement [31].
Despite the clear strengths of the current study, including prospective design, large sample size and long follow-up interval, our findings should be interpreted within the context of the following limitations. This is a mono-center study, limiting the generalizability of findings, although it facilitates consistency of evaluation. Due to the difficulty in identifying an external group, we are unable to validate our findings in an independent population. In addition, data on drug regimens and medical treatment are not available, which might introduce a systematic bias and residual confounding. Importantly, only fasting glucose was measured before the surgery, and it is of great interest to monitor postoperative glucose, and if possible glycosylated hemoglobin, which is accurate and stable, to see its dynamic changes in predicting survival of digestive tract cancer. All resectable patients were recruited between January 2000 and December 2010, and during this period, remarkable advances in surgical techniques might introduce a possible bias. Findings were exclusively enrolled from a southern city in China, calling for external replications in other domestic or ethnic populations.
In conclusion, our findings provide strong evidence for a U-shaped risk trajectory between preoperative fasting glucose and digestive tract cancer-specific mortality in Chinese. This study highlights the importance of measuring fasting glucose for patients who undergo radical surgery for digestive tract cancer to inform risk assessment and identify patients in need of closer monitoring postoperatively. For practical reasons, we hope that this study will not remain just another end point of research but instead a beginning to establish background data to unveil the underlying mechanisms of glucose abnormalities in carcinogenesis.
Acknowledgements
We thank our colleagues over the years at Fujian Cancer Hospital — particularly Xiaohui Chen, Yuzhen Zheng, Qingfeng Zheng, Shuoyan Liu, Zhilian She, Kunshou Zhu, Weidong Zang, Weizhong Ruan, Weimin Fang, Lin Li, Mingqiang Chen, Derong Zhang, Shaofeng Lin, Shunjin Chen, Yigui Chen and Guohong Zhao for performing the surgery, Yanni Gao, Zhenzhou Xiao, Su Lin, Xuehong Liao, Wenhui Jiang, Jieqiong Lin, Xinjing Li, Yi Shi, Xiaojiang Wang, Shanfeng Jin, Hongfei Wang, Wucheng Shen, Weifeng Zhu, Xiaowen Cai, Baozhen Chen, Tongmei Chen, Xueyan Chen and Lifang Chen for collecting the blood/tissue samples and performing the follow-up investigations.
Specific author contributions
XZ, WN planned and designed the study, and directed its implementation; DH, FP, JL, XZ drafted the protocol; DH, XL, HZ, YX obtained statutory and ethics approvals; DH, XL, HZ, YX contributed to data acquisition; WN, XZ, FP conducted statistical analyses; WN, DH, FP, JL had access to all raw data; DH, FP, WN did the data preparation and quality control; FP, WN wrote the manuscript. All authors read and approved the final manuscript prior to submission.
Funding
This study was financially supported by the Joint Funds for the Innovation of Science and Technology of Fujian Province (Grant No. 2017Y9090), the Natural Science Foundation of Fujian Province (Grant No. 2018Y0024), the Science and Technology Program of Fujian Province (Grant No. 2018Y2003), the Fundamental Research Funds for the Central Universities (Grant No. 3332018170) and the research grants from the Ministry of Health P.R. China (WKJ2016-2-05). The funder of this study had no role in study design, data collection, data analysis, data interpretation, or writing of the report. The corresponding authors had full access to all the data in the study and had final responsibility for the decision to submit for publication.
Competing Interests
The authors have declared that no competing interest exists.
References
1. Wolpin BM, Bao Y, Qian ZR, Wu C, Kraft P, Ogino S. et al. Hyperglycemia, insulin resistance, impaired pancreatic beta-cell function, and risk of pancreatic cancer. J Natl Cancer Inst. 2013;105:1027-35
2. Cooney KA, Gruber SB. Hyperglycemia, obesity, and cancer risks on the horizon. JAMA. 2005;293:235-6
3. Fiorillo C, Rosa F, Quero G, Menghi R, Doglietto GB, Alfieri S. Postoperative hyperglycemia in nondiabetic patients after gastric surgery for cancer: perioperative outcomes. Gastric Cancer. 2017;20:536-42
4. Wang L, Li JJ, Guo LY, Li P, Zhao Z, Zhou H. et al. Molecular link between glucose and glutamine consumption in cancer cells mediated by CtBP and SIRT4. Oncogenesis. 2018;7:26
5. Fan C, Tang Y, Wang J, Xiong F, Guo C, Wang Y. et al. Role of long non-coding RNAs in glucose metabolism in cancer. Mol Cancer. 2017;16:130
6. Giri B, Dey S, Das T, Sarkar M, Banerjee J, Dash SK. Chronic hyperglycemia mediated physiological alteration and metabolic distortion leads to organ dysfunction, infection, cancer progression and other pathophysiological consequences: An update on glucose toxicity. Biomed Pharmacother. 2018;107:306-28
7. Peng F, Hu D, Lin X, Chen G, Liang B, Zhang H. et al. Analysis of Preoperative Metabolic Risk Factors Affecting the Prognosis of Patients with Esophageal Squamous Cell Carcinoma: The Fujian Prospective Investigation of Cancer (FIESTA) Study. EBioMedicine. 2017;16:115-23
8. Hu D, Peng F, Lin X, Chen G, Zhang H, Liang B. et al. Preoperative Metabolic Syndrome Is Predictive of Significant Gastric Cancer Mortality after Gastrectomy: The Fujian Prospective Investigation of Cancer (FIESTA) Study. EBioMedicine. 2017;15:73-80
9. Peng F, Hu D, Lin X, Chen G, Liang B, Zhang H. et al. Preoperative metabolic syndrome and prognosis after radical resection for colorectal cancer: The Fujian prospective investigation of cancer (FIESTA) study. Int J Cancer. 2016;139:2705-13
10. Drummond JB, Barbosa IG, Dantzer R, Teixeira AL. The effect of insulin-induced hypoglycemia on inflammatory markers: A systematic review. Brain Behav Immun. 2018;73:41-50
11. May-Wilson S, Sud A, Law PJ, Palin K, Tuupanen S, Gylfe A. et al. Pro-inflammatory fatty acid profile and colorectal cancer risk: A Mendelian randomisation analysis. Eur J Cancer. 2017;84:228-38
12. Fan G, Hu D, Peng F, Xu G, Lin X, Liang B. et al. Different Risk Profiles for the Postsurgical Prognosis of Gastric Cancer Patients with Different Blood Types: The FIESTA Study. J Cancer. 2018;9:2885-94
13. Hu D, Peng F, Lin X, Chen G, Liang B, Chen Y. et al. Prediction of three lipid derivatives for postoperative gastric cancer mortality: the Fujian prospective investigation of cancer (FIESTA) study. BMC Cancer. 2018;18:785
14. Peng F, Hu D, Lin X, Liang B, Chen Y, Zhang H. et al. Impact of long-term antihypertensive and antidiabetic medications on the prognosis of post-surgical colorectal cancer: the Fujian prospective investigation of cancer (FIESTA) study. Aging (Albany NY). 2018;10:1166-81
15. Sha H, Hu D, Wu S, Peng F, Xu G, Fan G. et al. Baseline Metabolic Risk Score and Postsurgical Esophageal Cancer-Specific Mortality: The Fujian Prospective Investigation of Cancer (FIESTA) Study. J Cancer. 2018;9:1173-81
16. Peng F, Hu D, Lin X, Chen G, Liang B, Chen Y. et al. An in-depth prognostic analysis of baseline blood lipids in predicting postoperative colorectal cancer mortality: The FIESTA study. Cancer Epidemiol. 2018;52:148-57
17. Hu D, Zhang H, Lin X, Chen G, Li C, Liang B. et al. Elevated preoperative neutrophil-to-lymphocyte ratio can predict poor survival in early stage gastric cancer patients receiving radical gastrectomy: The Fujian prospective investigation of cancer (FIESTA) study. J Cancer. 2017;8:1214-22
18. Peng F, Hu D, Lin X, Chen G, Liang B, Li C. et al. The monocyte to red blood cell count ratio is a strong predictor of postoperative survival in colorectal cancer patients: The Fujian prospective investigation of cancer (FIESTA) study. J Cancer. 2017;8:967-75
19. Hu D, Lin X, Chen Y, Chang Q, Chen G, Li C. et al. Preoperative blood-routine markers and prognosis of esophageal squamous cell carcinoma: The Fujian prospective investigation of cancer (FIESTA) study. Oncotarget. 2017;8:23841-50
20. Hu D, Peng F, Lin X, Chen G, Liang B, Li C. et al. The elevated preoperative fasting blood glucose predicts a poor prognosis in patients with esophageal squamous cell carcinoma: The Fujian prospective investigation of cancer (FIESTA) study. Oncotarget. 2016;7:65247-56
21. Edge SB, Compton CC. The American Joint Committee on Cancer: the 7th edition of the AJCC cancer staging manual and the future of TNM. Ann Surg Oncol. 2010;17:1471-4
22. Murtola TJ, Vihervuori VJ, Lahtela J, Talala K, Taari K, Tammela TL. et al. Fasting blood glucose, glycaemic control and prostate cancer risk in the Finnish Randomized Study of Screening for Prostate Cancer. Br J Cancer. 2018;118:1248-54
23. Jee SH, Ohrr H, Sull JW, Yun JE, Ji M, Samet JM. Fasting serum glucose level and cancer risk in Korean men and women. JAMA. 2005;293:194-202
24. Wulaningsih W, Vahdaninia M, Rowley M, Holmberg L, Garmo H, Malmstrom H. et al. Prediagnostic serum glucose and lipids in relation to survival in breast cancer patients: a competing risk analysis. BMC Cancer. 2015;15:913
25. Andersen DK, Korc M, Petersen GM, Eibl G, Li D, Rickels MR. et al. Diabetes, Pancreatogenic Diabetes, and Pancreatic Cancer. Diabetes. 2017;66:1103-10
26. Kong AP, Yang X, Luk A, Ma RC, So WY, Ozaki R. et al. Severe hypoglycemia identifies vulnerable patients with type 2 diabetes at risk for premature death and all-site cancer: the Hong Kong diabetes registry. Diabetes Care. 2014;37:1024-31
27. Circu ML, Maloney RE, Aw TY. Low glucose stress decreases cellular NADH and mitochondrial ATP in colonic epithelial cancer cells: Influence of mitochondrial substrates. Chem Biol Interact. 2017;264:16-24
28. Zhuang Y, Chan DK, Haugrud AB, Miskimins WK. Mechanisms by which low glucose enhances the cytotoxicity of metformin to cancer cells both in vitro and in vivo. PLoS One. 2014;9:e108444
29. Austin PC. A comparison of regression trees, logistic regression, generalized additive models, and multivariate adaptive regression splines for predicting AMI mortality. Stat Med. 2007;26:2937-57
30. Put R, Xu QS, Massart DL, Vander Heyden Y. Multivariate adaptive regression splines (MARS) in chromatographic quantitative structure-retention relationship studies. J Chromatogr A. 2004;1055:11-9
31. Zhang H, Singer BH. Analysis of Censored Data: Survival Trees and Random Forests. 1999: pp 93-103.
Author contact
![]() Corresponding authors: Wenquan Niu, Ph.D. Address: No.2 Yinghua East Street, Chao Yang District, Beijing 100029, China. Tel & Fax: 86-10-8420 6414. E-mail: niuwenquan_shcncom or niuwenquancom.cn. Or Feng Peng, M.D. Ph.D. Address: No.20 Chazhong Road, Tai Jiang District, Fuzhou 350005, Fujian, China. Tel: +86-591-8798 1637. Fax: +86-591-8798 1635. E-mail: pengfengfuzhoucom
Corresponding authors: Wenquan Niu, Ph.D. Address: No.2 Yinghua East Street, Chao Yang District, Beijing 100029, China. Tel & Fax: 86-10-8420 6414. E-mail: niuwenquan_shcncom or niuwenquancom.cn. Or Feng Peng, M.D. Ph.D. Address: No.20 Chazhong Road, Tai Jiang District, Fuzhou 350005, Fujian, China. Tel: +86-591-8798 1637. Fax: +86-591-8798 1635. E-mail: pengfengfuzhoucom