Impact Factor ISSN: 1837-9664

 Global reach, higher impact
J Cancer 2019; 10(17):3914-3925. doi:10.7150/jca.31448 This issue Cite
Research Paper
KPNA3 Confers Sorafenib Resistance to Advanced Hepatocellular Carcinoma via TWIST Regulated Epithelial-Mesenchymal Transition
Bo Hu1*, Jian-Wen Cheng1*, Jin-Wu Hu1*, Hong Li2, Xiao-Lu Ma3, Wei-Guo Tang1, Yun-Fan Sun1, Wei Guo3, Ao Huang1, Kai-Qian Zhou1, Ping-Ting Gao1, Ya Cao4, Shuang-Jian Qiu1, Jian Zhou1,5, Jia Fan1,5, Xin-Rong Yang1 ![]()
1. Department of Liver Surgery and transplantation, Liver Cancer Institute, Zhongshan Hospital, Fudan University; Key Laboratory of Carcinogenesis and Cancer Invasion, Ministry of Education, Shanghai 200032, P.R.China;
2. Key Laboratory for Computational Biology, CAS-MPG Partner Institute for Computing Biology, Shanghai Institute for Biological Sciences, Chinese Academy of Sciences, Shanghai, 200031, China;
3. Department of Laboratory Medicine, Zhongshan Hospital, Fudan University;
4. Cancer Research Institute, Xiangya School of Medicine, Central South University; Key Laboratory of Carcinogenesis and Cancer Invasion, Ministry of Education, Changsha 410078, China;
5. Key Laboratory of Medical Epigenetics and Metabolism, Institute of Biomedical Sciences, Fudan University, Shanghai 200032, P. R. China
*These authors have contributed equally to this work.
Received 2018-11-12; Accepted 2019-5-6; Published 2019-6-24
Abstract
Sorafenib, a multikinase inhibitor, is a new standard treatment for patients with advanced hepatocellular carcinoma (HCC). However, resistance to this regimen is frequently observed in clinical practice, and the molecular basis of this resistance remains largely unknown. Herein, the antitumor activity of sorafenib was assessed in 16 patient-derived xenograft (PDX) models of HCC. Gene expression analysis was conducted to identify factors that promote sorafenib resistance. Quantitative RT-PCR and immunoblotting were used to determine gene expression and activation of signaling pathways. Cell proliferation, clone formation, and transwell assays were conducted to evaluate drug-sensitivity, proliferation, and invasiveness, respectively. Kaplan-Meier analysis was used to evaluate the predictive power of biomarkers for sorafenib response. Differential gene expression analysis suggested that sorafenib resistance correlated with high karyopherin subunit alpha 3 (KPNA3) expression. Overexpression of KPNA3 in HCC cells enhanced tumor cell growth and invasiveness. Interestingly, KPNA3 was found to trigger epithelial-mesenchymal transition (EMT), a key process mediating drug resistance. On a mechanistic level, KPNA3 increased phosphorylation of AKT, which then phosphorylated ERK, and ultimately promoted TWIST expression to induce EMT and sorafenib resistance. Moreover, retrospective analysis revealed that HCC patients with low KPNA3 expression had remarkably longer survival after sorafenib treatment. Finally, we have identified a novel KPNA3-AKT-ERK-TWIST signaling cascade that promotes EMT and mediates sorafenib resistance in HCC. These findings suggest that KPNA3 is a promising biomarker for predicting patient responsiveness to sorafenib. Targeting KPNA3 may also contribute to resolving sorafenib resistance in HCC.
Keywords: hepatocellular carcinoma, drug resistance, epithelial-mesenchymal transition, patient-derived xenograft, personalized medicine
Introduction
Hepatocellular carcinoma (HCC) is one of the most common malignancies leading to death worldwide [1]. Moreover, HCC was estimated to be one of the leading causes of malignancy-related death in China [2]. The mortality rate of patients with HCC was more than 0.02% [3]. Advanced HCC was defined as those patients who are ineligible for or have progressed following surgery or locoregional therapy [4]. Although diagnostic approaches for HCC have improved in recent years, advanced HCC patients can only be treated with palliative therapies, which are designed to extend life but are not capable of achieving cure [3, 5-7].
Sorafenib, a multikinase inhibitor, is the first-line FDA-approved regimen to treat patients with advanced HCC [8, 9]. Mechanistically, sorafenib inhibits the kinase activity of RAF, platelet-derived growth factor receptor, and vascular endothelial growth factor receptor, which effectively restrains tumor growth [10-12]. Sorafenib was demonstrated to improve survival of patients with advanced HCC in the Sorafenib Hepatocellular Carcinoma Assessment Randomized Protocol (SHARP) and Oriental trials [4, 13]. However, the response rate to sorafenib was relatively low [4, 14]. Therefore, it is critical to identify the mechanism underlying sorafenib resistance in HCC to provide new strategies for HCC management and improve the prognosis of patients with advanced HCC.
The majority of patients receiving sorafenib treatment have unresectable lesions [3, 15], making it difficult to obtain fresh tumor tissues to investigate the mechanism contributing to sorafenib resistance. Thus, cell line-derived xenografts (CDX) models that are based on established cell lines are widely used [16-18]. However, these models exhibit disadvantages of low consistency after long periods of in vitro culture and lack of heterogeneity, which greatly hinder an improved understanding of sorafenib resistance in HCC. Patient-derived xenograft (PDX) models, which are established by transferring fresh tumor tissues into immunodeficient mice, shed new insight into a more comprehensive understanding of drug resistance [19]. PDX models have been demonstrated to better recapitulate parental tumor biology compared to conventional CDX models [20]. Therefore, PDX models effectively overcome the disadvantages of CDX models and serve as promising tools for deep exploration of the mechanisms underlying drug resistance to facilitate personalized treatment in clinical practice [21, 22]. However, data concerning the application of PDX models in the investigation of sorafenib-resistant HCC remains lacking.
Here, we have identified karyopherin subunit alpha 3 (KPNA3) as the key mediator of sorafenib resistance in HCC through expression profiling comparisons between sorafenib-sensitive and -resistant PDX models. We further investigated the function of KPNA3 in HCC progression and detailed the mechanism that contributes to sorafenib resistance. Finally, we evaluated the predictive value of KPNA3 expression for sorafenib responsiveness in clinical HCC samples to assess its value as a biomarker. Altogether, this work lays the foundation for the development of therapies to combat sorafenib resistance in advanced HCC.
Materials and Methods
Patient specimens
To explore the predictive value of KPNA3, 78 HCC patients receiving sorafenib treatment were recruited into the present study between March 2013 and October 2014, and these patients received sorafenib treatment after recurrence. These patients were monitored postsurgically until March 20, 2017. HCC was defined on the basis of pathologic diagnosis, imaging examinations (ultrasound, computed tomography, or magnetic resonance imaging), and alpha-fetoprotein serology according to the American Association for Study of Liver Disease guidelines [15]. The Child-Pugh staging system was used to assess liver function, and the Barcelona Clinic Liver Cancer staging system was used to determine tumor stage [3]. Approval for the use of human subjects was obtained from the research ethics committee of Zhongshan Hospital, and informed consent was obtained from each individual enrolled in this study.
Establishment and use of PDX models
Fresh tumor tissues were placed in ice-cold high-glucose Dulbecco's Modified Eagle's Medium (DMEM) with 10% fetal bovine serum (FBS), 100 U/ ml penicillin, and 100 U/ml streptomycin and rapidly processed for engraftment. After removal of necrotic tissue, tumor specimens were divided into 2×1×1 mm3 sections with a scalpel blade under aseptic conditions. Then, tissue fragments were washed three times in pre-cooled phosphate-buffered saline (PBS) followed by a 30-minute incubation in DMEM supplemented with 50% Matrigel™ (BD; 356234), 10 ng/ml epidermal growth factor (Gibco; PHG0314), 10 ng/ml basic fibroblast growth factor (Gibco; PHG0264), 100 U/ml penicillin, and 100 U/ml streptomycin. Three pieces of tumor tissue in the incubation mixture (Matrigel plus growth factors) were transplanted into the right flanks of male non-obese diabetic, severe combined immunodeficiency (NOD/SCID) mice (n=3; 4-5 weeks old, Shanghai Institute of Material Medicine, Chinese Academy of Science) subcutaneously with a No. 20 trocar. Animal care and experimental protocols were approved by the Shanghai Medical Experimental Animal Care Commission. Tumor growth was recorded three times per week by measuring the tumor length (L) and width (W) with a caliper. Tumor volume in mm3 was calculated as 0.5×L×W2 [23]. Mice were sacrificed at approximately 30 days or up to 80 days after grafting, and tumors were collected for histological evaluation, re-grafting, or snap-freezing in liquid nitrogen. Once tumor volumes reached approximately 100-150 mm3, mice were randomized into treatment arms and treated via oral gavage with vehicle (n=6), or sorafenib (n=6; 30 mg/kg) daily for 28 days. Tumor growth inhibition (TGI), or TV change, was calculated for each mouse by following equation: TGI=ΔT/ΔC (%), where T=treated TV and C=control TV. According to the criteria of the Division of Cancer Treatment (NCI), we defined response as 0.00-20.00% TGI, stability as 21.00-50.00% TGI, and tumor progression as >50.00% TGI [24].
Microarray gene expression
GeneChip® U133 Plus 2.0 arrays (Affymetrix) were used to profile the tumor tissues from sorafenib- resistant and -sensitive PDX models. Arrays were scanned using the GeneChip® Scanner 3000 (Cat#00- 00212, Affymetrix) and Command Console Software 3.1 (Affymetrix) with default settings. Raw gene expression data were preprocessed using the Robust Multi-array Average algorithm, log-transformed, and quartile normalized (implemented with R package “simpleaffy”). Similarity between two samples was calculated by the Spearman's rank correlation coefficient, and the association between gene expression and sorafenib sensitivity was identified by a Student's t-test (P<0.01). The functional enrichment analyses of differentially expressed genes were performed using the Qiagen Ingenuity® Pathway Analysis™ (IPA) software (www.qiagen.com/ingenuity). The complete dataset is available as GEO (Gene Expression Omnibus) proles on the GEO database (www.ncbi.nih.gov/ geo/; GEO accession number GSE90653).
Cell lines
The human HCC cell lines Huh7 and HepG2 were purchased from the cell bank of the Chinese Academy of Sciences (Shanghai, China). MHCC97H and HCCLM3 cell lines were generated by our institute. The cell lines were maintained in DMEM (Gibco) supplemented with 10% FBS (Gibco), 100 U/ml penicillin, and 100 U/ml streptomycin at 37°C under 5% CO2. Cell lines were routinely screened for the presence of mycoplasma (Mycoplasma Detection Kit, Roche Diagnostics) during the study period.
RNA isolation, reverse transcription, and quantitative reverse transcription-polymerase chain reaction (qRT-PCR)
Total RNA from cells and frozen tumor tissues was extracted using RNeasy mini kit (Qiagen), and mRNA was reverse transcribed with the QuantiTect reverse transcription kit (Qiagen) according to the manufacturer's instructions. The SuperScript III Platinum SYBR green one-step qRT-PCR kit (Thermo Fisher) was used to perform qRT-PCR reactions in accordance with the manufacturer's instructions. The primers used in this study are listed in Table 1. Relative mRNA expression levels were calculated based on the Ct values and normalized using GAPDH expression according to following equation: 2-ΔCt (ΔCt=Ct[target gene]-Ct[GAPDH]). All experiments were performed in triplicate on a Roche LightCycle 480 platform.
Primers for RT-PCR assays
| Gene | Forward primer (5'-3') | Reverse primer 5'-3' |
|---|---|---|
| KPNA3 | GTGGTCCAATTGAGTGCTGTCCAGGC | TGATATGACATAATCTCTACATTGAG |
| RANBP2 | CCTCGGACTGCTGAGAACTT | ATGCCATCCTTAACAAACCC |
| RANGAP1 | GCAGTGCAGGATGCAGTAGATG | GCGGGCGAAGGAGCAGGATT |
| XPO1 | CCCAGCATTCCTTGCTATTC | GTAAGCCCGTATCTGCGACA |
| SNAIL | TCTGAGGCCAAGGATCTCCA | GTGGCTTCGGATGTGCATCT |
| VIM | CTGCAGGACTCGGTGGACTT | GAAGCGGTCATTCAGCTCCT |
| E-Cadherin | GTAGGAAGGCACAGCCTGTC | CAGCAAGAGCAGCAGAATCA |
| N-Cadherin | GAGCATGCCAAGTTCCTGAT | TGGCCACTGTGCTTACTGAA |
| Twist | GCCGACGACAGCCTGAGCAA | CGCCACAGCCCGCAGACTTC |
| GAPDH | ATGGGGAAGGTGAAGGT | AAGCTTCCCGTTCTCAG |
Abbreviations: KPNA3, Karyopherin Subunit Alpha 3; RANBP2, RAN binding protein 2; RANGAP1, RAN GTPase activating protein 1; XPO1, Exportin 1; VIM, vimentin; GAPDH, glyceraldehyde-3-phosphate dehydrogenase.
Western blot analysis
Western blotting was conducted as previously described [25]. Briefly, proteins were separated by 10% SDS PAGE and then transferred to polyvinylidene difluoride membranes. These membranes were washed and blocked. Primary antibody dilutions were applied and were followed by horseradish- peroxidase-conjugated secondary antibodies. Detailed antibody information is listed in Table 2. Antibody binding was then detected by enhanced chemiluminescence assays.
Antibodies for WB assays
| Gene | Manufacturer | Dilution Ratio |
|---|---|---|
| KPNA3 | Invitrogen | 1:1000 |
| E-Cadherin | Abcam | 1:1000 |
| N-Cadherin | Cell Signaling Technology | 1:1000 |
| TWIST | Cell Signaling Technology | 1:1000 |
| SNAIL | Abcam | 1:250 |
| VIM | Cell Signaling Technology | 1:750 |
| ERK1/2 | Abcam | 1:2500 |
| pERK1/2 | Cell Signaling Technology | 1:1000 |
| AKT | Abcam | 1:500 |
| pAKT | Abcam | 1:5000 |
| GAPDH | R&D | 1:1000 |
| β-Actin | Invitrogen | 1:200 |
Abbreviations: KPNA3, Karyopherin Subunit Alpha 3; VIM, vimentin; GAPDH, glyceraldehyde-3-phosphate dehydrogenase.
Cell proliferation, migration, and invasion assays
To evaluate the proliferation of HCC cells, cell counting kit-8 (CCK8; Dojindo) assays were performed as previously described [25]. Briefly, cells were seeded in 96-well plates at a concentration of 5×10³ cells/well and cultured over night at 37°C followed by the indicated treatment and time periods. After treatment, 10 μl of CCK8 solution was added into each well, and cells were incubated at 37 °C for 2 hours. The absorbance was measured at 450 nm.
To evaluate cell migration and invasion potential, transwell assays with or without Matrigel were performed as previously described [25]. Briefly, HCC cells were collected and washed with PBS following treatment. For migration assays, 104 cells were seeded in the upper chamber on a non-coated membrane (24-well insert, pore size 8 μm; Corning) with DMEM containing 1% FBS. For invasion assays, 105 cells were seeded in the upper chamber on a Matrigel-coated membrane (dilution: 1:6). In both assays, the lower chamber contained DMEM supplemented with 10% FBS to act as a chemo-attractant. After 24 or 48 hours of incubation at 37°C, cells that migrated or invaded to the lower surface of the membrane were fixed with 4% methanol, stained with crystal violet, and counted in 10 random 200× microscopic fields.
Cell transfection
A retroviral vector, pMSCV, was used to knock down the expression of KPNA3. The retrovirus was produced by 293T packaging cells. The pLKO.1-shRNA targeting the KPNA3 oligonucleotide was TGCTGTTGACAGTGAGCGCATGCGAAGACATAGAAATGAATAGTGAAGCCACAGATGTATTCATTTCTATGTCTTCGCATTTGCCTACTGCCTCGGA. Cells were infected with this virus or a control virus and then selected against puromycin for 3 days before splitting for further assays.
Tissue microarray (TMA) and immunohistochemistry
The resected specimens were paraffin embedded and stored at 4°C. The construction of the TMA and the immunohistochemistry procedure were described previously [26]. Briefly, immunohistochemical staining was performed by the avidin-biotin-peroxidase complex method. After rehydration and microwave antigen retrieval, primary anti-human-KPNA3 antibodies were applied to the slides and incubated at 4°C overnight. Then, secondary antibody incubation was conducted at 37°C for 30 minutes. Staining was performed with 3'3-diaminobenzidine tetra hydrochloride, and counterstaining was performed with Mayer's hematoxylin. Negative control slides lacking the primary antibody were included in all assays. Immunohistochemical staining was assessed by three independent pathologists who were blinded to clinical characteristics, and discrepancies were resolved by consensus. The intensity of KPNA3 staining was stratified as either high or low expression.
Reagents
Sorafenib; A6730, an AKT inhibitor; FR180204, an ERK1/2 inhibitor; and NSC 293100, an ERK activator were all obtained from Sigma.
In vivo animal model assays
For the mouse xenograft models, 6-week-old male nude mice were purchased from the Chinese Science Academy (Shanghai, China). Nude models were constructed by implanting 3×10⁶ HCCLM3 cells infected with lentivirus (HCCLM3 or HCCLM3- KPNA3KD) subcutaneously. To evaluate tumor growth, TV was measured twice a week and was calculated. Five weeks after HCC cell injection, the mice were sacrificed, and tumor tissues were resected for hematoxylin and eosin staining.
Statistical analysis
Statistical analysis was conducted with SPSS 19.0 software (IBM). Experimental values for continuous variables were expressed as the mean ± SEM. The chi-square test, Fisher's exact probability test, and Student's t-test were used, where appropriate, to evaluate the significance of differences between groups. If variances within groups were not homogeneous, the nonparametric Mann-Whitney test or the Wilcoxon signed-rank test was used. The relationship between KPNA3 expression level and overall survival (OS) or time to recurrence were analyzed using Kaplan-Meier survival curves and log-rank tests, respectively. Univariate and multivariate proportional analyses were performed using the Cox proportional hazard regression model, and P<0.05 was considered statistically significant.
Results
KPNA3 promotes sorafenib resistance in PDX models of HCC
To investigate key regulators that promote sorafenib resistance, we first identified three sorafenib-sensitive (ΔT/ΔC <20%; HMP322, HMP215, and HFP31) and five sorafenib-resistant PDX models (ΔT/ΔC >50%; HMP321, HMP312, HMP326, HMP325, and HMP136) from 16 PDX models. Expression profiling was then conducted to compare expression pattern differences between sorafenib-sensitive and -resistant PDXs. Kyoto Encyclopedia of Genes and Genomes (KEGG) pathway analysis was performed to identify critical pathways involved in sorafenib resistance. The ras-related nuclear protein (RAN) signaling pathway was identified as the most significantly altered pathway (P<0.001, Figure 1A and 1B).
Identification of KPNA3 as a key regulator of sorafenib resistance. (A) Kyoto Encyclopedia of Genes and Genomes (KEGG) pathway analysis. (B) The ras-related nuclear protein (RAN) signaling pathway analysis based on the KEGG database. (C) Hierarchical clustering analysis based on four candidate genes involved in RAN signaling. Red and green cells depict high and low expression levels, respectively. (D) Differential expression of the four candidate genes confirmed by qRT-PCR. (E) qRT-PCR assays for the four candidate genes involved in RAN signaling in sorafenib-resistant cells derived from Huh7 and HCCLM3 cell lines. (F) Apoptosis rates of Huh7-SR and HCCLM3-SR cells upon treatment with sorafenib after KPNA3 expression was knocked down. (G) KPNA3 expression in HCC cell lines. (H) Survival rates of Huh7 and HCCLM3 with modulated KPNA3 expression after 10 μM sorafenib treatment were evaluated by CCK8 assay. (I)The xenograft study confirmed that KPNA3-KD induced sensitization to sorafenib, whereas KPNA3-OE resulted in sorafenib resistance.
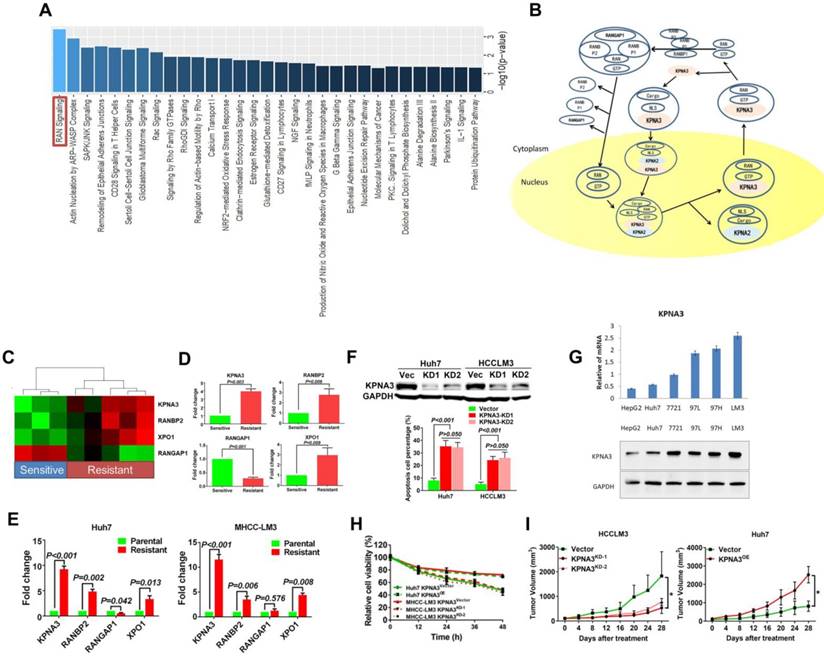
Further investigation focused on differentially expressed genes involved in the RAN pathway. Karyopherin subunit alpha 3 (KPNA3), RAN binding protein 2 (RANBP2), RAN GTPase activating protein 1 (RANGAP1), and exportin 1 (XPO1) were identified as candidates. Hierarchical clustering indicated that these four genes exhibited distinct expression patterns between sorafenib-sensitive and -resistant tumors (Figure 1C). Differential expression of the four candidate genes was further confirmed by qRT-PCR as shown in (Figure 1D).
To further identify key regulatory molecules, two sorafenib-resistant cell lines derived from Huh7 and HCCLM3 cell lines were used to investigate the expression of the four candidate genes via qRT-PCR. KPNA3 expression increased the most dramatically (Fold changes: Huh7 9.23±0.60; HCCLM3 11.55±0.60) in two sorafenib-resistant (SR) tumor cell lines (Figure 1E). Moreover, when KPNA3 expression was knocked down in Huh7-SR and HCCLM3-SR cells, apoptosis rates significantly increased upon treatment with sorafenib (Figure 1F). Based on the expression profiles in PDX models and the effect on sorafenib resistance, KPNA3 was selected for further investigation.
To further evaluate the role and mechanism of KPNA3 in sorafenib resistance, KPNA3 expression was modulated in HCC cell lines. Based on their endogenous KPNA3 expression, Huh7 cells were chosen to conduct overexpression (OE) experiments and HCCLM3 cells were selected for further knockdown (KD) experiments as shown in (Figure 1G) . CCK8 assays revealed that KPNA3-OE Huh7 cells exhibited enhanced survival capacity under sorafenib treatment compared with control Huh7 cells, whereas knocking down KPNA3 expression in HCCLM3 cells induced significant sensitization to sorafenib treatment (10 μM, Figure 1H). The xenograft study confirmed that KPNA3-KD induced sensitization to sorafenib, whereas KPNA3-OE resulted in sorafenib resistance (Figure 1I). Taken together, these data suggest that KPNA3 is a potential regulator of sorafenib resistance in HCC.
KPNA3 promotes growth and invasiveness of HCC
To explore the function of KPNA3 in HCC, we further investigated KPNA3 expression in HCC datasets (Oncomine). In three clinical cohorts, KPNA3 mRNA levels were increased in HCC tumors compared to normal liver tissues, indicating that KPNA3 might be an oncoprotein in HCC (Figure 2A). The mRNA expression of KPNA3 was further evaluated in 54 tumors and paired adjacent liver tissues. KPNA3 expression was significantly higher in 50.00% (27/54) of tumors compared to paired normal liver tissues (≥2 fold), whereas only 7.41% (4/54) of tumors exhibited downregulation of KPNA3 (<2 fold, Figure 2B). These findings were confirmed by western blot (Figure 2C).
KPNA3 promotes growth and invasiveness of HCC. (A) Expression patterns of KPNA3 between HCC and normal liver tissues in different clinical cohorts. Datasets extracted from Oncomine (Chen, Roessler, and Wurmbach Liver). (B) mRNA expression levels of KPNA3 between tumor and adjacent normal liver tissues assessed via qRT-PCR. (C) Protein expression level of KPNA3 between tumor and adjacent normal liver tissues assessed by western blot. (D) Proliferation of Huh7 and HCCLM3 cells with modulated KPNA3 expression were evaluated by colony-formation assays. (E) Invasion of Huh7 and HCCLM3 cells with modulated KPNA3 expression were evaluated by transwell assays. (F) In vivo evaluation of the effect of KPNA3 on tumor proliferation.
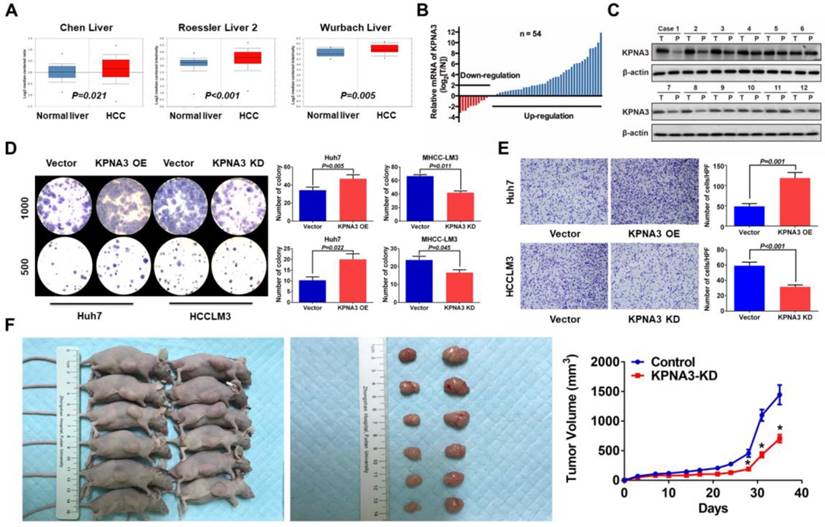
To further evaluate the intrinsic role of KPNA3 in HCC, in vitro proliferation was analyzed through colony-formation assays. KPNA3-KD resulted in a dramatic inhibitory effect on in vitro proliferation of HCCLM3 cells, and KPNA3-OE significantly promoted the proliferation of Huh7 cells (Figure 2D). Moreover, HCC cells with higher metastatic potential (HCCLM3 and MHCC97H) expressed significantly higher levels of KPNA3 mRNA and protein than less metastatic cells (HepG2 and Huh7), suggesting that KPNA3 may promote the invasive potential of HCC cells. Results from transwell assays confirmed that KPNA3 downregulation also significantly suppressed the invasive capacity of HCCLM3 cells (Figure 2E), whereas exogenous KPNA3 expression in Huh7 cells significantly promoted invasion (Figure 2E). To confirm the effect of KPNA3 in vivo, 3×10⁶ HCCLM3- SCR (control) or KPNA3-KD (KPNA3KD) cells were subcutaneously implanted into nude mice. Mice injected with HCCLM3 KPNA3-KD cells were discovered to form significantly smaller tumor volumes than those injected with control HCCLM3 cells after 5 weeks (Figure 2F). Collectively, these in vitro and in vivo gain- and loss-of-function experiments reveal that KPNA3 is a key mediator in promoting growth and aggressiveness of HCC.
KPNA3 triggers epithelial-mesenchymal transition
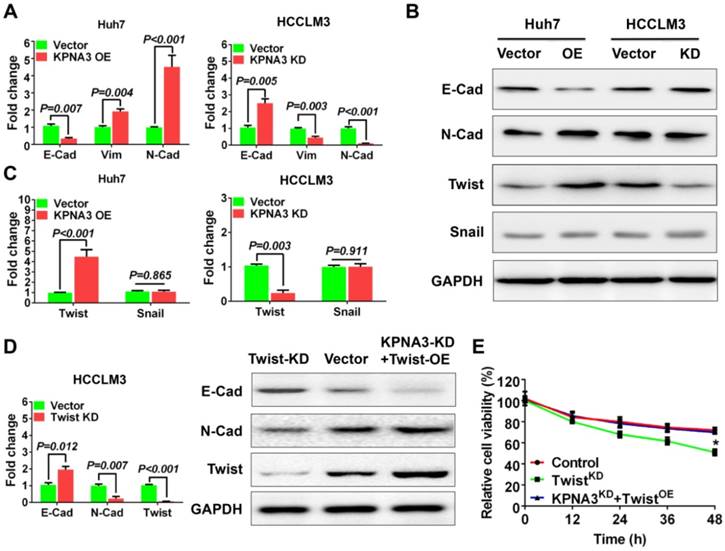
It has been reported that the epithelial-mesenchymal transition (EMT) plays an important role in sorafenib resistance of HCC [27]. Here, KPNA3 was found to promote sorafenib resistance and invasiveness of HCC cells, implying that KPNA3 may enhance drug resistance by inducing EMT. Thus, we further evaluated the expression of epithelial and mesenchymal markers in KPNA3-KD and KPNA3-OE HCC cells. We found that KPNA3-OE Huh7 cells showed elevated vimentin and N-cadherin expression levels and reduced E-cadherin expression compared with control Huh7 cells. In contrast, KPNA3-KD HCCLM3 cells exhibited an epithelial-like phenotype, including downregulation of vimentin and N-cadherin and upregulation of E-cadherin, compared with control HCCLM3 cells (Figure 3A). These results were confirmed by western blot (Figure 3B).
KPNA3 induces EMT via increased TWIST expression to promote sorafenib resistance. (A) Evaluation of expression of epithelial and mesenchymal markers in Huh7 and HCCLM3 cells with modulated KPNA3 expression by qRT-PCR. (B) Validation of qRT-PCR results by western blot. (C) Evaluation of TWIST and SNAIL expression in Huh7 and HCCLM3 cells with modulated KPNA3 expression by qRT-PCR. (D) Evaluation of expression of epithelial and mesenchymal markers in HCCLM3 cells after TWIST knockdown by qRT-PCR (left) and western blot (right). (E) Survival rates of HCCLM3 cells with different modifications after 10 μM sorafenib treatment were evaluated by CCK8 assay.
TWIST is crucial for KPNA3-induced EMT and sorafenib resistance
To identify key mediators involved in KPNA3- induced EMT, we compared the expression levels of TWIST and SNAIL, two conventional EMT- regulating transcription factors reported in previous studies[27], in KPNA3-OE Huh7 cells and KPNA3-KD HCCLM3 cells relative to their respective controls. We found that TWIST, but not SNAIL, exhibited significantly increased expression in KPNA3-OE Huh7 cells and significantly decreased expression in KPNA3-KD HCCLM3 cells (Figure 3B, C). These results indicate that TWIST is a potential downstream target of KPNA3 in HCC.
To provide further confirmation, TWIST expression was knocked down by siRNA in HCCLM3 cells, and EMT status was then evaluated. Compared with HCCLM3 cells, the expression of N-cadherin was downregulated in TWIST-KD HCCLM3 cells, whereas E-cadherin expression was upregulated. Similar results were confirmed by western blot (Figure 3D). When TWIST was re-overexpressed in KPNA3-KD HCCLM3 cells, the effect of KPNA3-KD was reversed (Figure 3D). CCK8 assays confirmed that downregulation of TWIST in HCCLM3 cells enhanced their sensitivity to sorafenib, whereas overexpression of TWIST in KPNA3-KD cells restored their resistance to sorafenib (Figure 3E). Taken together, these data not only support the correlation between EMT and sorafenib resistance, but also indicate that TWIST is a crucial downstream target of KPNA3 and plays an important role in KPNA3- induced EMT and sorafenib resistance.
KPNA3 sustains activation of the AKT-ERK axis under sorafenib treatment
Next we explored the downstream signaling of KPNA3 using a Cignal Finder Reporter Array for RTK signaling. Results demonstrated that KPNA3 overexpression significantly enhanced the activities of PI3K/AKT and MAPK/ERK signaling (Figure 4A). Contrarily, KPNA3 knockdown greatly inhibit the activations of these two signaling pathways (Figure 4B). Previous studies have revealed that AKT and ERK are critical mediators that promote EMT. AKT phosphorylates ERK to initiate an AKT-ERK axis, and phosphorylated ERK then induces TWIST expression [28]. Therefore, we sought to explore whether KPNA3 induced TWIST expression through the AKT-ERK axis. We found that phosphorylation levels of AKT and ERK were significantly elevated in KPNA3-OE Huh7 cells, but were reduced in KPNA3-KD HCCLM3 cells (Figure 4C). These results indicate that KPNA3 may serve as a switch for AKT and ERK activation.
KPNA3 promotes TWIST expression through activation of the AKT-ERK axis. (A, B) The downstream signaling of KPNA3 using a Cignal Finder Reporter Array for RTK signaling. (C) Effect of KPNA3 expression on the phosphorylation status of AKT and ERK were evaluated by western blot. (D) AKT and ERK inhibitors were used to evaluate their respective phosphorylation status in HCCLM3 cells with high KPNA3 expression. Experiments were conducted with or without 10 μM sorafenib treatment. (E) Activation status of AKT due to KPNA3 modulation under sorafenib treatment. (F) Effects of AKT inhibitor or combining AKT inhibitor with ERK activator on cell viability. (G) Twist transcriptional activities determined by dual fluorescence reporting system under different treatments. (H) Schematic depiction of the role of KPNA3 in sorafenib resistance.
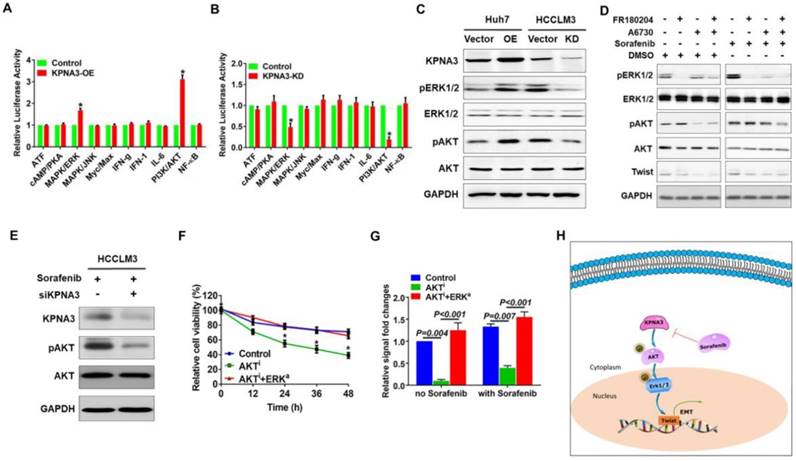
Next, HCCLM3 cells were treated with AKT or ERK inhibitors to verify the relationship between AKT and ERK in HCC. Under sorafenib-untreated conditions, phosphorylation of ERK was significantly decreased when HCCLM3 cells were treated with A6730, an AKT inhibitor. In contrast, phosphorylation of AKT was unchanged when HCCLM3 cells were treated with the ERK inhibitor FR180204 (Figure 4D, left panel). To confirm these results, the same inhibitors were applied in HCCLM3 cells under sorafenib-treated conditions. Western blot assays demonstrated that both AKT and ERK exhibited elevated phosphorylation levels in response to sorafenib treatment. Importantly, the activation patterns of AKT and ERK were similar to those under sorafenib-untreated conditions (Figure 4D, right panel). These data confirm the existence of an AKT-ERK axis in HCC.
To further investigate the relationship of KPNA3 in the AKT-ERK axis, KPNA3-KD HCCLM3 cells were treated with sorafenib, and the resulting pathway activation was evaluated. Interestingly, KPNA3-KD resulted in dramatically reduced AKT phosphorylation (Figure 4E) upon sorafenib treatment. Taken together, our results indicate that KPNA3 triggers as well as sustains AKT-ERK axis activation, especially under sorafenib-treated conditions.
AKT-ERK axis is critical for KPNA3-induced sorafenib resistance and TWIST expression
To further validate the role of the AKT-ERK axis in KPNA3-regulated sorafenib resistance, cell viability under sorafenib treatment was evaluated. We found that inhibition of AKT induced sorafenib sensitivity in HCCLM3 cells, whereas re-activation of ERK with the ERK activator NSC 293100 rescued sorafenib resistance (P<0.001; Figure 4F). As TWIST was identified as a key downstream target of KPNA3, we reasoned that the AKT-ERK axis may be involved in TWIST expression. To test this hypothesis, transcriptional activation of TWIST was evaluated with a duo-luciferase reporter system. Compared to control HCCLM3 cells, we found that TWIST activation was significantly hindered by AKT inhibition, whereas activation could be rescued by re-activation of ERK. Of note, these findings could be observed under either sorafenib-untreated or -treated conditions (all P<0.001; Figure 4G). These results support a critical role for KPNA3 in upregulating TWIST expression during drug therapy. Collectively, our data demonstrate that KPNA3 sustained AKT-ERK activation, resulted in enhanced TWIST expression, and eventually contributed to sorafenib resistance in HCC (Figure 4H).
KPNA3 correlates with response to sorafenib in HCC patients
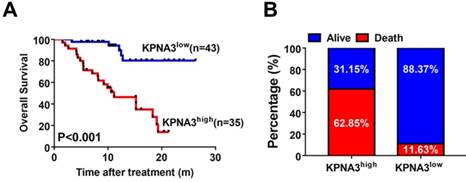
To explore the utility of KPNA3 status as a biomarker for predicting sorafenib responsiveness, we immunostained a tissue microarray from 78 HCC patients who received sorafenib treatment after liver resection in our center. The correlation between KPNA3 expression and OS was then evaluated. Patient outcomes and demographics are presented in Table 3. KPNA3 expression levels were found to be significantly correlated with tumor size (Table 3). Patients were then stratified into two groups according to their KPNA3 expression. Kaplan-Meier analysis indicated that patients with high KPNA3 expression levels showed higher OS rate compared those with low KPNA3 expression levels (median 11.13 months vs. not reached, P<0.001, Figure 5A). In addition, the death rate was higher in patients with high KPNA3 levels (62.85% vs. 11.63%, Figure 5B). Multivariate Cox regression identified KPNA3 as an independent indicator for OS after sorafenib therapy (HR=6.319; 95% confidential interval 2.295-17.399; P<0.001; Table 4). These results suggest that KPNA3 expression is a valuable indicator of sorafenib responsiveness and may be clinically useful for the identification of patients who would benefit from sorafenib therapy.
Correlation between KPNA3 and clinicopathological characteristics.
| Clinical characteristics | No. of Patients (n=78) | KPNA3low (n=43) | KPNA3high (n=35) | P | |
|---|---|---|---|---|---|
| Age, years | ≤50 | 36 | 22 | 14 | 0.325 |
| >50 | 42 | 21 | 21 | ||
| Sex | Female | 9 | 4 | 5 | 0.493# |
| Male | 69 | 39 | 30 | ||
| ALT, U/L | ≤40 | 39 | 22 | 17 | 0.105 |
| >40 | 39 | 21 | 18 | ||
| HBsAg | Negative | 7 | 1 | 6 | 0.023# |
| Positive | 71 | 42 | 29 | ||
| AFP, ng/ml | ≤400 | 35 | 23 | 12 | 0.090 |
| >400 | 43 | 20 | 23 | ||
| Child-Pugh score | A | 62 | 37 | 25 | 0.112 |
| B | 16 | 6 | 10 | ||
| Tumor size, cm | ≤5 | 39 | 26 | 13 | 0.040 |
| >5 | 39 | 17 | 22 | ||
| PVTT | No | 60 | 34 | 26 | 0.618 |
| Yes | 18 | 9 | 9 | ||
Abbreviations: KPNA3, Karyopherin Subunit Alpha 3; ALT, alanine aminotransferase; AST, aspartate transaminase; AFP, α-fetoprotein; HBsAg, Hepatitis B surface antigen; PVTT, portal vein tumor thrombosis. # indicated Fisher exact tests.
KPNA3 correlates with response to sorafenib in HCC patients. (A) Kaplan-Meier analysis of OS of patients receiving sorafenib treatment for HCC stratified according to KPNA3 expression status (high or low). (B) Death rates of HCC patients receiving sorafenib treatment with high or low KPNA3 expression status.
Univariate and Multivariate Cox proportional hazard regression analysis of factors associated with overall survival after receiving Sorafenib treatment
| Clinical characteristics | Univariate analysis | Multivariate analysis | ||||
|---|---|---|---|---|---|---|
| HR(95% CI) | P | HR(95% CI) | P | |||
| Age, years | >50 vs. ≤50 | 0.915 (0.427-1.960) | 0.820 | N.A. | ||
| Sex | Male vs. Female | 2.344 (0.662-1.960) | 0.227 | N.A. | ||
| ALT, U/L | >40 vs. ≤40 | 1.160 (0.523-2.574) | 0.715 | N.A. | ||
| HBsAg | Positive vs. Negative | 1.063 (0.251-4.511) | 0.933 | N.A. | ||
| AFP, ng/ml | >400 vs. ≤400 | 4.658 (1.759-12.335) | 0.001 | 3.047 (1.099-8.446) | 0.032 | |
| Child-Pugh score | A vs. B | 0.439 (0.195-0.989) | 0.047 | 0.923 (0.394-2.166) | 0.899 | |
| Tumor size, cm | >5 vs. ≤5 | 3.724 (1.500-9.246) | 0.002 | 3.093 (1.224-7.816) | 0.017 | |
| PVTT | Positive vs. Negative | 2.583 (1.191-5.603) | 0.021 | 1.709 (0.740-3.948) | 0.210 | |
| KPNA3 | High vs. Low | 7.000 (2.644-18.530) | <0.001 | 6.319 (2.295-17.399) | <0.001 | |
Abbreviations: KPNA3, Karyopherin Subunit Alpha 3; ALT, alanine aminotransferase; AST, aspartate transaminase; AFP, α-fetoprotein; HBsAg, Hepatitis B surface antigen; PVTT, portal vein tumor thrombosis; N.A., not applicable.
Discussion
In the present study, KPNA3 was identified as a positive regulator of HCC progression as well as a key mediator of sorafenib resistance by analyzing expression profile data from PDX models. Further mechanistic investigation revealed that KPNA3 upregulated TWIST expression through activation of the AKT-ERK axis, resulting in EMT and conferring drug resistance in HCC cells. Clinically, patients with high KPNA3 expression were resistant to sorafenib treatment, indicating that KPNA3 expression could effectively predict sorafenib responsiveness in HCC patients. Therefore, utilization of KPNA3 as a biomarker could provide clinically important information when selecting appropriate patients to receive sorafenib treatment.
PDX models are considered a more accurate tool than cell line models for evaluating the effect of therapeutic modalities and have already been applied for investigating drug resistance in several solid tumors, including breast, ovarian, pancreatic, lung, and melanoma [29-33]. However, the value of PDXs in sorafenib resistance in HCC has remained elusive. To our knowledge, the present study is the first to utilize HCC PDX models to investigate the mechanism underlying sorafenib resistance and to describe a novel regulator that mediates resistance to sorafenib. Currently, most studies involving sorafenib resistance in HCC rely on cell line models; however, PDXs have several advantages. Namely, xenografts are patient-derived and retain characteristics of the original tumor, they provide a more biologically relevant microenvironment, and they better reflect tumor heterogeneity [34]. Therefore, the findings presented here more closely represent clinical cases and provide more comprehensive information towards understanding sorafenib resistance in HCC. Moreover, all tissues from PDX models have been live-frozen, providing a bank of living tumor tissue that can be used to enhance sorafenib resistance research.
KPNA3 belongs to the α3 subfamily of KPNA proteins and acts as an adaptor, forming a bridging interaction between substrate cargo and the karyopherin-β-RAN complex, to mediate nuclear import. Additionally, KPNA3 was reported to be involved in the pathology of schizophrenia [35]. Previous work in B-cell chronic lymphocytic leukemia reported that KPNA3 was downregulated in leukemia cells and might act as a candidate tumor suppressor [36]. However, in our study, KPNA3 was found to promote tumor proliferation, migration, and invasion, and loss of KPNA3 expression significantly inhibited HCC progression. Our data demonstrate that KPNA3 is a pro-oncogene and serves as a key enhancer of HCC progression. The distinct function of KPNA3 between leukemia and HCC could be attributed to the tumor specification or tissue specific action of KPNA3.
It is well known that EMT plays a vital role in multi-drug resistance, including sorafenib, and inhibiting EMT effectively reverses drug resistance [37-39]. Our results revealed that expression of KPNA3 was essential for inducing a mesenchymal phenotype in HCC cells. These data indicated that the mechanism underlying KPNA3-induced sorafenib resistance was due to KPNA3-triggered EMT. In recent years, growing evidence suggests that TWIST is a crucial factor for EMT induction. Previous studies have confirmed that TWIST plays an important role in promoting invasion and progression in HCC [40]. However, whether TWIST was involved in sorafenib resistance was unknown. Our data revealed that TWIST was the only transcription factor whose expression showed positive correlation with the expression patterns of KPNA3. Moreover, TWIST was essential for KPNA3-induced EMT as well as sorafenib resistance. These findings demonstrate that TWIST acts as a crucial downstream regulator of KPNA3 and, for the first time, confirms a critical role for TWIST in sorafenib resistance in HCC.
Emerging evidence reveals that EMT can be triggered by activation of several upstream pathways, including PI3K-AKT, MAPK, and ERK. Among these pathways, the activation of AKT and ERK are reported to be primary causes of EMT in HCC[27] . Additionally, previous studies demonstrated an interaction between AKT and ERK and the significance of this interaction in promoting HCC progression [41, 42]. Considering that both pathways are involved in regulating TWIST expression, we sought to identify whether they participate in KPNA3-induced TWIST expression. To do so, we first defined the interaction between AKT and ERK in HCC. We found that AKT served as an upstream activator of ERK, supporting a model where a novel KPNA3-AKT-ERK regulatory axis induces TWIST expression and ultimately results in EMT and sorafenib resistance in HCC. More importantly, this axis remains activated even under sorafenib treatment, which confirms a pivotal role for KPNA3 in initialing the phosphorylation cascade. Furthermore, inhibition of KPNA3 expression effectively sensitized HCC cells to sorafenib treatment. Therefore, our data strongly support KPNA3 as a novel target for both inhibiting AKT/ERK activity and reversing sorafenib resistance. These studies highlight the potential value of an anti-KPNA3 strategy in future HCC treatment. However, the mechanism underlying KPNA3- mediated AKT phosphorylation remains unknown and is an area for future investigation.
Clinically, predicting sorafenib response remains problematic, even though several biomarkers have been reported. Based on a cohort of HCC patients undergoing sorafenib treatment, we found that patients with high KPNA3 expression showed significantly shorter OS. This finding indicates that patients with low KPNA3 expression would be better candidates for sorafenib therapy and suggests that KPNA3 is a potential biomarker for predicting responsiveness to sorafenib therapy in HCC. Therefore, we strongly suggest that KPNA3 expression levels be determined before starting sorafenib treatment.
Collectively, the present study provides new insight into sorafenib resistance in HCC and reveals a novel KPNA3-AKT-ERK-TWIST signaling cascade that promotes EMT and mediates drug resistance. Moreover, KPNA3 expression level is a promising biomarker to predict responsiveness to sorafenib treatment. Future application of KPNA3 detection may facilitate personalized therapy. Consequently, further investigation of KPNA3 antagonist strategies in combination with sorafenib treatment may enhance the efficacy of anti-HCC therapeutics.
Acknowledgements
This study was supported by grants from the National Key Research and Development Program of China (2016YFF01400 and 2016YFC0902400), the State Key Program of National Natural Science of China (81530077), the National Natural Science Foundation of China (81472676, 81572823, 81602543, 81602581, 81672839, 81772551, 81772578 and 81802364), Shanghai Hospital Development Center (SHDC12015104), The Strategic Priority Research Program of the Chinese Academy of Sciences (XDA12020103 and XDA12020105) and Zhongshan Hospital Science Foundation (2018ZSQN28 and 2018ZSQN30).
Competing Interests
The authors have declared that no competing interest exists.
References
1. Siegel RL, Miller KD, Jemal A. Cancer Statistics, 2017. CA Cancer J Clin. 2017;67:7-30
2. Chen W, Zheng R, Baade PD, Zhang S, Zeng H, Bray F. et al. Cancer statistics in China, 2015. CA Cancer J Clin. 2016;66:115-32
3. Bruix J, Reig M, Sherman M. Evidence-Based Diagnosis, Staging, and Treatment of Patients With Hepatocellular Carcinoma. Gastroenterology. 2016;150:835-53
4. Llovet JM, Ricci S, Mazzaferro V, Hilgard P, Gane E, Blanc JF. et al. Sorafenib in advanced hepatocellular carcinoma. N Engl J Med. 2008;359:378-90
5. Bruix J, Gores GJ, Mazzaferro V. Hepatocellular carcinoma: clinical frontiers and perspectives. Gut. 2014;63:844-55
6. Forner A, Llovet JM, Bruix J. Hepatocellular carcinoma. Lancet. 2012;379:1245-55
7. Zucman-Rossi J, Villanueva A, Nault JC, Llovet JM. Genetic Landscape and Biomarkers of Hepatocellular Carcinoma. Gastroenterology. 2015;149:1226-39
8. Bruix J, Qin S, Merle P, Granito A, Huang YH, Bodoky G. et al. Regorafenib for patients with hepatocellular carcinoma who progressed on sorafenib treatment (RESORCE): a randomised, double-blind, placebo-controlled, phase 3 trial. Lancet. 2017;389:56-66
9. Llovet JM, Zucman-Rossi J, Pikarsky E, Sangro B, Schwartz M, Sherman M. et al. Hepatocellular carcinoma. Nat Rev Dis Primers. 2016;2:16018
10. Wilhelm SM, Carter C, Tang L, Wilkie D, McNabola A, Rong H. et al. BAY 43-9006 exhibits broad spectrum oral antitumor activity and targets the RAF/MEK/ERK pathway and receptor tyrosine kinases involved in tumor progression and angiogenesis. Cancer Res. 2004;64:7099-109
11. Chang YS, Adnane J, Trail PA, Levy J, Henderson A, Xue D. et al. Sorafenib (BAY 43-9006) inhibits tumor growth and vascularization and induces tumor apoptosis and hypoxia in RCC xenograft models. Cancer Chemother Pharmacol. 2007;59:561-74
12. Chen J, Jin R, Zhao J, Liu J, Ying H, Yan H. et al. Potential molecular, cellular and microenvironmental mechanism of sorafenib resistance in hepatocellular carcinoma. Cancer Lett. 2015;367:1-11
13. Cheng AL, Kang Y, Chen Z, Tsao CJ, Qin S, Kim JS. et al. Efficacy and safety of sorafenib in patients in the Asia-Pacific region with advanced hepatocellular carcinoma: a phase III randomised, double-blind, placebo-controlled trial. Lancet Oncology. 2009;10:25-34
14. Llovet JM. Focal gains of VEGFA: candidate predictors of sorafenib response in hepatocellular carcinoma. Cancer Cell. 2014;25:560-2
15. Bruix J, Sherman M, American Association for the Study of Liver D. Management of hepatocellular carcinoma: an update. Hepatology. 2011;53:1020-2
16. Won JK, Yu SJ, Hwang CY, Cho SH, Park SM, Kim K. et al. Protein disulfide isomerase inhibition synergistically enhances the efficacy of sorafenib for hepatocellular carcinoma. Hepatology. 2017;66:855-68
17. Xiang D, Cheng Z, Liu H, Wang X, Han T, Sun W. et al. Shp2 promotes liver cancer stem cell expansion by augmenting beta-catenin signaling and predicts chemotherapeutic response of patients. Hepatology. 2017;65:1566-80
18. Chen HA, Kuo TC, Tseng CF, Ma JT, Yang ST, Yen CJ. et al. Angiopoietin-like protein 1 antagonizes MET receptor activity to repress sorafenib resistance and cancer stemness in hepatocellular carcinoma. Hepatology. 2016;64:1637-51
19. Byrne AT, Alferez DG, Amant F, Annibali D, Arribas J, Biankin AV. et al. Interrogating open issues in cancer precision medicine with patient-derived xenografts. Nat Rev Cancer. 2017;17:254-68
20. Inoue T, Terada N, Kobayashi T, Ogawa O. Patient-derived xenografts as in vivo models for research in urological malignancies. Nature Reviews Urology. 2017;14:267
21. Izumchenko E, Paz K, Ciznadija D, Sloma I, Katz A, Vasquez-Dunddel D. et al. Patient-derived xenografts effectively capture responses to oncology therapy in a heterogeneous cohort of patients with solid tumors. Ann Oncol. 2017;28:2595-605
22. Gao H, Korn JM, Ferretti S, Monahan JE, Wang Y, Singh M. et al. High-throughput screening using patient-derived tumor xenografts to predict clinical trial drug response. Nat Med. 2015;21:1318-25
23. Hu B, Sun D, Sun C, Sun YF, Sun HX, Zhu QF. et al. A polymeric nanoparticle formulation of curcumin in combination with sorafenib synergistically inhibits tumor growth and metastasis in an orthotopic model of human hepatocellular carcinoma. Biochem Biophys Res Commun. 2015;468:525-32
24. Teicher BA, Andrews PA. Anticancer drug development guide: preclinical screening, clinical trials, and approval: Humana Pr Inc; 2004.
25. Hu B, Ding GY, Fu PY, Zhu XD, Ji Y, Shi GM. et al. NOD-like receptor X1 functions as a tumor suppressor by inhibiting epithelial-mesenchymal transition and inducing aging in hepatocellular carcinoma cells. J Hematol Oncol. 2018;11:28
26. Yang XR, Xu Y, Yu B, Zhou J, Li JC, Qiu SJ. et al. CD24 is a novel predictor for poor prognosis of hepatocellular carcinoma after surgery. Clin Cancer Res. 2009;15:5518-27
27. Shibue T, Weinberg RA. EMT, CSCs, and drug resistance: the mechanistic link and clinical implications. Nat Rev Clin Oncol. 2017;14:611-29
28. Lee YH, Bae HC, Noh KH, Song KH, Ye SK, Mao CP. et al. Gain of HIF-1α under Normoxia in Cancer Mediates Immune Adaptation through the AKT/ERK and VEGFA Axes. Clinical Cancer Research. 2015;21:1438-46
29. Goetz MP, Kalari KR, Suman VJ, Moyer AM, Yu J, Visscher DW. et al. Tumor sequencing and patient-derived xenografts in the neoadjuvant treatment of breast cancer. JNCI: Journal of the National Cancer Institute. 2017:109
30. Kondrashova O, Nguyen M, Shield-Artin K, Tinker AV, Teng NN, Harrell MI. et al. Secondary somatic mutations restoring RAD51C and RAD51D associated with acquired resistance to the PARP inhibitor rucaparib in high-grade ovarian carcinoma. Cancer discovery. 2017;7:984-98
31. Lei Y, Tang L, Xie Y, Xianyu Y, Zhang L, Wang P. et al. Gold nanoclusters-assisted delivery of NGF siRNA for effective treatment of pancreatic cancer. Nature communications. 2017;8:15130
32. Gardner EE, Lok BH, Schneeberger VE, Desmeules P, Miles LA, Arnold PK. et al. Chemosensitive relapse in small cell lung cancer proceeds through an EZH2-SLFN11 axis. Cancer Cell. 2017;31:286-99
33. Leucci E, Vendramin R, Spinazzi M, Laurette P, Fiers M, Wouters J. et al. Melanoma addiction to the long non-coding RNA SAMMSON. Nature. 2016;531:518
34. Aparicio S, Hidalgo M, Kung AL. Examining the utility of patient-derived xenograft mouse models. Nature Reviews Cancer. 2015;15:311
35. Fang X-d, Chen T, Tran K, Parker CS. Developmental regulation of the heat shock response by nuclear transport factor karyopherin-α3. Development. 2001;128:3349-58
36. Mertens D, Wolf S, Schroeter P, Schaffner C, Döhner H, Stilgenbauer S. et al. Down-regulation of candidate tumor suppressor genes within chromosome band 13q14. 3 is independent of the DNA methylation pattern in B-cell chronic lymphocytic leukemia. Blood. 2002;99:4116-21
37. Fischer KR, Durrans A, Lee S, Sheng J, Li F, Wong ST. et al. Epithelial-to-mesenchymal transition is not required for lung metastasis but contributes to chemoresistance. Nature. 2015;527:472
38. Zheng X, Carstens JL, Kim J, Scheible M, Kaye J, Sugimoto H. et al. Epithelial-to-mesenchymal transition is dispensable for metastasis but induces chemoresistance in pancreatic cancer. Nature. 2015;527:525
39. Huang XY, Ke AW, Shi GM, Zhang X, Zhang C, Shi YH. et al. αB-crystallin complexes with 14-3-3ζ to induce epithelial-mesenchymal transition and resistance to sorafenib in hepatocellular carcinoma. Hepatology. 2013;57:2235-47
40. Zhao N, Sun H, Sun B, Zhu D, Zhao X, Wang Y. et al. miR-27a-3p suppresses tumor metastasis and VM by down-regulating VE-cadherin expression and inhibiting EMT: an essential role for Twist-1 in HCC. Scientific reports. 2016;6:23091
41. Wang C, Cigliano A, Jiang L, Li X, Fan B, Pilo MG. et al. 4EBP1/eIF4E and p70S6K/RPS6 axes play critical and distinct roles in hepatocarcinogenesis driven by AKT and N-Ras proto-oncogenes in mice. Hepatology. 2015;61:200-13
42. Jiang L, Yan Q, Fang S, Liu M, Yan L, Yuan YF. et al. Calcium binding protein 39 promotes hepatocellular carcinoma growth and metastasis by activating ERK signaling pathway. Hepatology. 2017;66:1529-45
Author contact
![]() Corresponding author: yang.xinrongsh.cn; Tel.: +86-021-6404-1990
Corresponding author: yang.xinrongsh.cn; Tel.: +86-021-6404-1990