Impact Factor ISSN: 1837-9664

 Global reach, higher impact
J Cancer 2019; 10(14):3291-3302. doi:10.7150/jca.29872 This issue Cite
Research Paper
A Propensity Score-adjusted Analysis of the Effects of Ubiquitin E3 Ligase Copy Number Variation in Peripheral Blood Leukocytes on Colorectal Cancer Risk
Haoran Bi, Yupeng Liu, Tian Tian, Tingting Xia, Rui Pu, Yiwei Zhang, Fulan Hu ![]() , Yashuang Zhao
, Yashuang Zhao ![]()
Department of Epidemiology, Public Health College, Harbin Medical University, 157 Baojian Street, Harbin, Heilongjiang, People's Republic of China.
Received 2018-9-11; Accepted 2019-5-7; Published 2019-6-2
Abstract
Background: The ubiquitin ligases E3 (E3s) plays a key role in the specific protein degradation in many carcinogenic biological processes. Colorectal cancer (CRC) development may be affected by the copy number variation (CNV) of E3s. Prior studies may have underestimated the impact of potential confounding factors' effects on the association between gene CNV and CRC risk, and CRC risk predictive model integrating gene CNV patterns is lacking. Our research sought to assess the genes CNVs of MDM2, SKP2, FBXW7, β-TRCP, and NEDD4-1 and CRC risk by using propensity score (PS) adjustment and developing models that integrate CNV patterns for CRC risk predictions.
Methods: This study comprising 1036 participants used traditional regression and different PS techniques to adjust the confounding factors to evaluate the relationships between five gene CNVs and CRC risk, and to establish a CRC risk predictive model. The AUC was applied to evaluate the effect of the model. The categorical net reclassification improvement (NRI) and the integrated discrimination improvement (IDI) were analyzed to evaluate the discriminatory accuracy improvement among the models.
Results: Compared to variable adjustment, the odds ratios (ORs) tended to be conservative and accurate with narrow confidence intervals (CIs) after PS adjustment. After PS adjustment, MDM2 amplification was related to increased CRC risk (Amp-pattern: OR = 8.684, 95% CI: 1.213-62.155, P = 0.031), whereas SKP2 deletion and the (del+amp) genotype were associated with reduced CRC risk (Del-pattern: OR = 0.323, 95% CI: 0.106-0.979, P = 0.046; Var-pattern: OR = 0.339, 95% CI: 0.135-0.854, P = 0.024). The predictive model integrating the gene CNV pattern could correctly reclassify 1.7% of the subjects.
Conclusions: MDM2 amplification and SKP2 CNVs are associated with increased and decreased CRC risk, respectively; abnormal CNV-integrated model is more precise for predicting CRC risk. Further studies are needed to verify these encouraging outcomes.
Keywords: Colorectal cancer, Copy number variation, E3 ligase, Propensity score, Predictive model
Introduction
Colorectal cancer (CRC) remains an influential public health threat in most countries. In the United States alone, there are approximately 140,250 new CRC cases and 50,630 deaths owing to CRC are projected to occur in 2018 [1]. In China, CRC is still the fifth leading threat to men and the fourth leading threat to women [2]. Genetic susceptibility was shown to have a significant role in the etiology of CRC [3, 4]. Recently, copy number variation (CNV) has been identified as an important genomic molecular biomarker of CRC predisposition [5, 6]. CNV can increase or decrease relapsing chromosomes, leading to abnormal gene expression that affects cancer-related biological processes [7].
E3 ubiquitin ligase (E3) plays a key role in the specific protein degradation of the ubiquitin-proteasome system, which participates in cell proliferation, differentiation, apoptosis, angiogenesis, and cell signaling [8]. Studies suggested that the abnormal expression of several key E3 members (MDM2 [9], SKP2 [10], FBXW7 [11], β-TRCP [12], and NEDD4-1 [13]) caused by CNV was associated with many malignancies, including CRC. MDM2 both negatively regulates p53 and targets p53 for degradation [14]. Moreover, MDM2 also interacts with pRb [15], E2F1 [16] and Numb [17] to participate in cellular processes. SKP2 is involved in cell cycle progression, signal transduction, and transcription by mediating the ubiquitination and degradation of some key proteins, such as cyclin E, p57, p21, and E2F1 [18-21]. Specifically, SKP2 mediates the degradation of p27 from the early S phase [22] and c-Myc during the G1 to S phase [23] to regulate cell cycle transition. FBXW7 targets several key regulatory proteins involved in cell division and cell fate determination, including cyclin E1, c-Myc, c-Jun and Notch [24-26]. β-TRCP regulates cell signaling pathways by degrading key signal transduction factors, such as β-catenin for Wnt/β-catenin signaling and IκBα for NF-κB signaling [27, 28]. β-TRCP also ubiquitylates several cell cycle regulators, such as EMI1/2, WEE1A, and CDC25 [29]. NEDD4-1 not only targets PTEN for proteasomal degradation but also transports PTEN into the nucleus [30]. In addition, NEDD4-1 targets several important proteins for degradation, such as Ras [31], MDM2 [32], HER3/ErbB3 [33], EGFR [34], and Notch [35].
Currently, CNV in germline DNA is attracting public attention [36, 37], while the relationship between E3s CNV in peripheral blood leukocyte DNA and CRC risk is still poorly explored. CRC risk predictive models mainly incorporate family history, lifestyle and environmental risk factors. Moreover, the predictive effectiveness of models considering single nucleotide polymorphisms (SNPs) and environmental factors are not ideal in that the areas under the curve (AUC) of the receiver operating characteristic (ROC) curve are between 0.57~0.73 [38-40]. CNV as a regional DNA structural variation may provide more powerful evidence for the CRC risk prediction.
Recently, there has been increasing interest in propensity score (PS), with PS being a balancing score, defined as the probability of patients being assigned to an intervention given a set of covariates [41]. Additionally, a comparison of traditional logistic regression using PS to control numerous confounders can be more efficient [42].
The purpose of this second analysis study was to investigate whether the results of our primary study that focused on the associations between gene CNVs of MDM2, SKP2, FBXW7, β-TRCP, and NEDD4-1 and CRC risk analyzed with traditional logistic regression [43] can be attenuated by adjusting the potential confounding factors by PS method. We further developed CRC risk predictive models integrating different CNV patterns and measured their predictive power.
Materials and Methods
Subjects and data collection
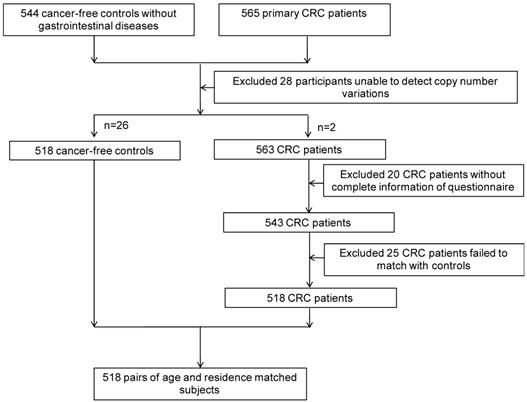
After obtaining informed consent from study subjects, and approval from the Institutional Research Board of Harbin Medical University, 518 CRC cases and 518 age- (±2 years) and residence-matched controls were recruited from the Tumor Hospital of Harbin Medical University and the Second Affiliated Hospital, respectively, from November 1st, 2004 to May 1st, 2010 (Figure 1). All participants were interviewed face-to-face with a structured standard questionnaire that was adopted from Shu et al [44], collecting information on demographic characteristics, lifestyle factors (including family history, smoking, alcohol consumption, occupational physical activity), and diet during the 12 months preceding the interview.
The flow of participants.
DNA extraction and CNV detection
We extracted genomic DNA from 1036 whole blood samples using QIAGEN DNeasy Blood & Tissue Kit (Qiagen, Hilden, Germany, Cat#51106). The copy numbers of MDM2, SKP2, FBXW7, β-TRCP, and NEDD4-1 were detected using custom designed TaqMan Copy Number Assays (Table S1) on an Applied Biosystems 7500 Fast real-time PCR system (Thermo Fisher Scientific, America) with a 10 μl reaction volume containing 20 ng DNA, 5 μl TaqMan Universal PCR Master Mix, 0.5 μl of the CNV assay, and 0.5 μl of the reference RNase P assay (Applied Biosystems, Carlsbad, Calif). The PCR conditions were as follows: 95℃ for 15 seconds and 60℃ for 1 minute for 40 cycles. One sample with 2 copies of CNV was used as the quality control in every 96-well assay plate and every sample was repetitively detected three times. Then the CNV detection results were analyzed by Copy Caller version 2.0 software (Applied Biosystems) to estimate the gene copy numbers.
Propensity score method
Before PS weighing, the missing values were addressed using multiple imputations. We used the PS strategy to overcome the possible biases in selection and observed differences in baseline characteristics between participants. The estimates of the probability of being in the two groups were derived from a multivariable logistic regression model, including the variables that could potentially affect the CRC risk [45]. We applied stepwise screening to select the independent variables in the regression analysis with an entering significance level of 0.05 and an excluding significance level of 0.2. The model goodness-of-fit test and predictive power were validated with the Hosmer-Lemeshow and C statistic, respectively. The covariates balance after PS matching was checked using statistical significance testing (P values < 0.05 in the overall analysis, P values < 0.01 in PS stratification by Bonferroni's correction [46]) [47].
After estimating PS, we applied three PS adjusting methods (PS matching, PS stratification and regarding PS as an additional covariate), and the PS matching was performed as a 1:1 nearest neighbor matching analysis with the caliper of 0.2 and without replacement [48]. Five subclasses were stratified based on the quantiles of the score. Additionally, we applied four regression analyses with different covariate adjustments. The first analysis calculated the crude odds ratio (OR); the second analysis was adjusted for the confounding factors that included in the PS in a traditional multiple regression; the third analysis was adjusted by PS as a covariate; and in the last analysis, the cases with the extreme scores were excluded based on the third analysis to exam the authenticity and stability. Finally, we performed subgroup analyses according to tumor location and Duke's Stage to assess CRC risk.
Statistical analyses
We assessed the homogeneity between groups using Student's t-test for continuous variables and a Chi-squared test for categorical variables, and we used a paired t-test or McNemar's test for PS matched paired data. The stratification data were analyzed by the Mantel-Haenszel method [49]. We used the ORs and corresponding 95% confidence intervals (95% CIs) to estimate the associations between MDM2, SKP2, FBXW7, β-TRCP, and NEDD4-1 CNVs and CRC risk via conditional and unconditional logistic regression. We defined two copies as the wild-type (Wt), more than two copies as the amplification-type (Amp) and less than two copies as the deletion-type (Del). Three additive CNV patterns were defined as follows: Del v.s. amp+wt (Del-pattern), Amp v.s. del+wt (Amp-pattern), and Del+amp v.s. wt (Var-pattern). The 95% CIs for the AUC, the categorical net reclassification improvement (NRI) and the integrated discrimination improvement (IDI) were estimated using the MedCalc® version 9.5 (MedCalc Software, Mariakerke, Belgium) and the PredictABEL package in R software version 3.4.0, respectively. Other analyses were performed using SPSS Statistics version 24.0 (IBM, Inc., USA). All statistical tests were two-sided, P values < 0.05 were considered significant in the overall analysis, and P values < 0.025 were considered significant in subgroup analysis by Bonferroni's correction [46].
CRC risk predictive models with CNV
To explore the predictive effects of CNV patterns on CRC risk, we constructed four integrated predictive models: model 1 comprised age, gender, occupation, marital status, nationality, family history of CRC, and factors of smoking and drinking (BI-model); models 2-4 were based upon model 1 and added five gene Del-pattern, Amp-pattern, and Var-pattern, respectively. The ROC curves and the AUCs were compared with the DeLong method [50]. We applied the risk reclassification table to display the number of subjects predicted to be at consistent or different risk categories by the basic and extended models [51], in which the individuals in the medium-risk category may show more shift in risk category and individuals in the marginal-risk category may be more consistent in the two compared models [52]. We further introduced NRI and IDI to evaluate the improvement in the discriminatory accuracy of each model (taking 0.3 and 0.6 as the cut-off points). NRI assesses the improvement in the classification of subjects into risk categories after adding different CNV pattern into the basic model and IDI reflects the change in the predicted probability between the two models [51]. The predictive models were also evaluated in subgroups based on tumor location and Duke's Stage.
Results
Characteristics of participants
The distribution of patients' characteristics before and after PS matching was shown in Table 1, and after 1:1 PS matching, the covariates were adequately balanced in the PS-matched dataset (Table 1).
Distribution of demographic and environmental information of CRC patients and controls before and after PS matching.
| Characteristics | Overall | PS matching | ||||
|---|---|---|---|---|---|---|
| CRC (518),(%) | Controls (518),(%) | P valuea | CRC (185),(%) | Controls (185),(%) | P valuea | |
| Age, years | 0.687 | 0.562 | ||||
| Mean ± s.d. | 59.8±10.6 | 60.5±11.2 | 60.0±11.6 | 59.6±10.5 | ||
| ≤ 50 | 100(19.3%) | 100(19.3%) | 42(22.7%) | 36(19.5%) | ||
| 50-60 | 165(31.9%) | 175(33.8%) | 55(29.7%) | 65(35.1%) | ||
| 60-70 | 143(27.6%) | 148(28.6%) | 47(25.4%) | 50(27.0%) | ||
| > 70 | 110(21.2%) | 95(18.3%) | 41(22.2%) | 34(18.4%) | ||
| Gender | 0.002 | 0.938 | ||||
| Male | 249(48.1%) | 299(57.7%) | 96(51.9%) | 95(51.3%) | ||
| Female | 269(51.9%) | 219(42.3%) | 89(48.1%) | 90(48.7%) | ||
| BMI | 0.176 | 0.232 | ||||
| Mean ± s.d. | 24.1±4.4 | 23.8±3.8 | 23.7±3.6 | 23.9±4.4 | ||
| ≤ 24 | 274(52.9%) | 262(50.6%) | 97(52.4%) | 101(54.6%) | ||
| 24-28 | 173(33.4%) | 163(31.5%) | 64(34.6%) | 51(27.6%) | ||
| > 28 | 71(13.7%) | 93(17.9%) | 24(13.0%) | 33(17.8%) | ||
| Education | 0.089 | 0.916 | ||||
| Primary school and below | 136(26.2%) | 113(21.8%) | 53(28.6%) | 49(26.5%) | ||
| Junior middle school | 165(31.9%) | 151(29.2%) | 59(31.9%) | 63(34.0%) | ||
| Senior middle school | 113(21.8%) | 123(23.8%) | 36(19.5%) | 34(18.4%) | ||
| University and above | 104(20.1%) | 131(25.2%) | 37(20.0%) | 39(21.1%) | ||
| Occupation | 0.001 | 0.723 | ||||
| White collar | 92(17.8) | 68(13.1%) | 26(14.1%) | 22(11.9%) | ||
| Blue collar | 268(51.7%) | 328(63.3%) | 97(52.4%) | 104(56.2%) | ||
| Both | 158(30.5%) | 122(23.6%) | 62(33.5%) | 59(31.9%) | ||
| Marriage | 0.001 | 0.288 | ||||
| Married | 496(95.8%) | 468(90.4%) | 179(96.8%) | 175(94.6%) | ||
| Others | 22(4.2%) | 50(9.6%) | 6(3.2%) | 10(5.4%) | ||
| Nationality | 0.012 | 0.672 | ||||
| The Han nationality | 505(97.5%) | 489(94.4%) | 178(96.2%) | 179(96.8%) | ||
| Others | 13(2.5%) | 29(5.6%) | 7(3.8%) | 6(3.2%) | ||
| Family history of colorectal cancer | <0.001 | 0.472 | ||||
| No | 84(16.2%) | 222(42.9%) | 57(30.8%) | 64(34.6%) | ||
| Yes | 434(83.8%) | 296(57.1%) | 128(69.2%) | 121(65.4%) | ||
| Appendicitis | 0.295 | 0.565 | ||||
| No | 85(16.4%) | 98(18.9%) | 27(14.6%) | 29(15.7%) | ||
| Yes | 433(83.6%) | 420(81.1%) | 158(85.4%) | 156(84.3%) | ||
| Refined grains, g/day | <0.001 | 0.772 | ||||
| ≤ 250 | 274(52.9%) | 388(74.9%) | 107(57.8%) | 109(58.9%) | ||
| > 250 | 244(47.1%) | 130(25.1%) | 78(42.2%) | 76(41.1%) | ||
| Roughage, g/week | 0.012 | 0.527 | ||||
| < 50 | 250(48.3%) | 210(40.5%) | 80(43.2%) | 74(40.0%) | ||
| ≥ 50 | 268(51.7%) | 308(59.5%) | 105(56.8%) | 111(60.0%) | ||
| Vegetable, times/week | <0.001 | 0.674 | ||||
| ≤ 2 | 317(61.2%) | 259(50.0%) | 108(58.4%) | 104(56.2%) | ||
| > 2 | 201(38.8%) | 259(50.0%) | 77(41.6%) | 81(43.8%) | ||
| Fruit, times/week | 0.236 | 0.979 | ||||
| ≤ 2 | 244(47.1%) | 225(43.4%) | 87(47.0%) | 87(47.0%) | ||
| > 2 | 274(52.9%) | 293(56.6%) | 98(53.0%) | 98(53.0%) | ||
| Fat meat | <0.001 | 0.793 | ||||
| No | 323(62.4%) | 255(49.2%) | 108(58.4%) | 105(56.8%) | ||
| Yes | 195(37.6%) | 263(50.8%) | 77(41.6%) | 80(43.2%) | ||
| Fish, times/week | <0.001 | 0.597 | ||||
| ≤ 1 | 405(78.2%) | 285(55.0%) | 138(74.6%) | 133(71.9%) | ||
| > 1 | 113(21.8%) | 233(45.0%) | 47(25.4%) | 52(28.1%) | ||
| Seafood, times/week | 0.462 | 0.800 | ||||
| ≤ 1 | 336(64.9%) | 325(62.7%) | 127(68.7%) | 130(70.3%) | ||
| > 1 | 182(35.1%) | 193(37.3%) | 58(31.3%) | 55(29.7%) | ||
| Braised fish, times/week | 0.004 | 0.674 | ||||
| ≤ 1 | 328(63.3%) | 371(71.6%) | 125(67.6%) | 129(69.7%) | ||
| > 1 | 190(36.7%) | 147(28.4%) | 60(32.4%) | 56(30.3%) | ||
| Egg, /week | 0.025 | 1.000 | ||||
| ≤ 3 | 196(37.8%) | 232(44.8%) | 78(42.2%) | 78(42.2%) | ||
| > 3 | 322(62.2%) | 286(55.2%) | 107(57.8%) | 107(57.8%) | ||
| Tea | 0.085 | 0.952 | ||||
| yes | 142(27.4%) | 118(22.8%) | 45(24.3%) | 45(24.3%) | ||
| no | 376(72.6%) | 400(77.2%) | 140(75.7%) | 140(75.7%) | ||
| Sausage, times/month | <0.001 | 0.730 | ||||
| ≤ 1 | 382(73.7%) | 448(86.5%) | 155(83.8%) | 152(82.2%) | ||
| > 1 | 136(26.3%) | 70(13.5%) | 30(16.2%) | 33(17.8%) | ||
| Spicy food, times/week | 0.949 | 0.855 | ||||
| ≤ 3 | 292(56.4%) | 291(56.2%) | 97(52.4%) | 98(53.0%) | ||
| > 3 | 226(43.6%) | 227(43.8%) | 88(47.6%) | 87(47.0%) | ||
| Garlic, times/week | 0.595 | 0.895 | ||||
| ≤ 3 | 304(58.7%) | 296(57.1%) | 107(57.8%) | 105(56.8%) | ||
| > 3 | 214(41.3%) | 222(42.9%) | 78(42.2%) | 80(43.2%) | ||
| Chinese pickled sour cabbage, times/month | <0.001 | 0.349 | ||||
| ≤ 2 | 216(41.7%) | 320(61.8%) | 92(49.7%) | 101(54.6%) | ||
| > 2 | 302(58.3%) | 198(38.2%) | 93(50.3%) | 84(45.4%) | ||
| Canned fruit, times/week | 0.557 | 0.483 | ||||
| ≤ 3 | 464(89.6%) | 459(88.6%) | 165(89.2%) | 169(91.4%) | ||
| > 3 | 54(10.4%) | 59(11.4%) | 20(10.8%) | 16(8.6%) | ||
| Canned meat, times/week | 0.767 | 0.893 | ||||
| ≤ 3 | 28(5.4%) | 30(5.8%) | 7(3.8%) | 8(4.3%) | ||
| > 3 | 490(94.6%) | 488(94.2%) | 178(96.2%) | 177(95.7%) | ||
| Tap-water | <0.001 | 0.772 | ||||
| Yes | 418(80.7%) | 147(28.4%) | 117(63.2%) | 108(58.4%) | ||
| No | 100(19.3%) | 371(71.6%) | 68(36.8%) | 77(41.6%) | ||
| Leftovers, times/week | <0.001 | 0.830 | ||||
| ≤ 3 | 301(58.1%) | 355(68.5%) | 116(62.7%) | 114(61.6%) | ||
| > 3 | 217(41.9%) | 163(31.5%) | 69(37.3%) | 71(38.4%) | ||
| Physical exercise | <0.001 | 0.853 | ||||
| Yes | 455(87.8%) | 312(60.2%) | 143(77.3%) | 142(76.8%) | ||
| No | 63(12.2%) | 206(39.8%) | 42(22.7%) | 43(23.2%) | ||
| Smoking | 0.344 | 0.936 | ||||
| No | 296(57.1%) | 311(60.0%) | 116(62.7%) | 115(62.2%) | ||
| Yes | 222(42.9%) | 207(30.0%) | 69(37.3%) | 70(37.8%) | ||
| Drinking | <0.001 | 0.514 | ||||
| No | 226(43.6%) | 376(72.6%) | 82(44.3%) | 88(47.6%) | ||
| Yes | 292(56.4%) | 142(27.4%) | 103(55.7%) | 97(52.4%) | ||
| Tumor location | - | - | ||||
| Colon | 325(62.7%) | - | - | - | ||
| Rectum | 193(37.3%) | - | - | - | ||
| Duke's Stage | - | - | ||||
| A+B | 315(60.8%) | - | - | - | ||
| C+D | 203(39.2%) | - | - | - | ||
CRC, Colorectal Cancer; PS, propensity score; s.d., standard deviation; BMI, Body Mass Index.
a P values calculated using Student's t-test for continuous variables and Pearson's Chi-squared test for categorical variables for overall data; P values calculated using paired t-test or McNemar's test for paired data. P values < 0.05 were considered statistically significant.
Association between gene CNV and CRC risk
The CNV frequencies of the five genes and the relationships between the gene CNVs and CRC risk with unadjusted, variable adjustment, and PS adjustment were shown in Figure 2. Compared to variable adjustment, the ORs tended to be conservative with narrower confidence intervals after PS adjustment. Figure 2 shows the ORs for the associations between MDM2 amplification and CRC risk were 8.848 (95% CI: 1.231-63.595, P = 0.030) and 8.684 (95% CI: 1.213-62.155, P = 0.031) after PS adjustment for Amp v.s. Wt and Amp-pattern, respectively. In the variable adjustment, the ORs were 13.291 (95% CI: 1.179-149.791, P = 0.036 for Amp v.s. Wt) and 12.659 (95% CI: 1.137-140.921, P = 0.039 for Amp-pattern), respectively.
The associations between gene CNVs and CRC risk in different adjusted models for overall participants. The forest plot showed the estimated ORs of the five genes associated with CRC risk and the bold squares indicated statistically significant.
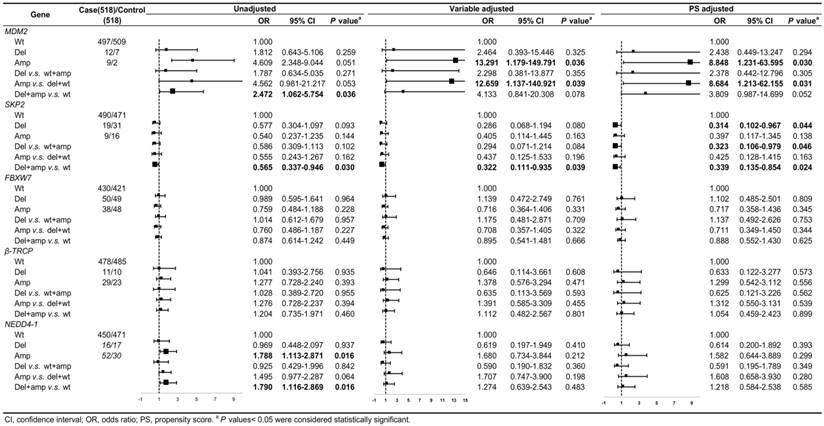
The ORs for the relationship between the loss of SKP2 and CRC risk were 0.314 (95% CI: 0.102-0.967, P = 0.044) and 0.323 (95% CI: 0.106-0.979, P = 0.046) after PS adjustment for Del v.s. Wt and Del-pattern, respectively, which became noticeably significant compared with the variable adjusting ORs (Figure 2). The ORs of the relationship between SKP2 CNVs and CRC risk in Var-pattern were 0.322 (95% CI: 0.111-0.935, P = 0.039) for variable adjustment and 0.339 (95% CI: 0.135-0.854, P = 0.024) for PS adjustment (Figure 2). However, we did not observe any significant associations between the CNVs of FBXW7, β-TRCP, and NEDD4-1 and CRC risk (Figure 2).
After stratified on PS, covariates were balanced in each stratification, only drinking alcohol remained significant in the first and fifth quintiles (Table S2), and we observed the similar relations between gene CNV and CRC risk (Figure S1). In the PS matching analysis, we only found the same trend but no significant results (Figure S2).
Sensitivity analyses
As a post hoc sensitivity analysis, we removed the individuals with the extreme score to ensure comparable participants' characteristics between groups. Similar findings to our main analysis were obtained when we only included participants with similar PS (Figure S3).
The predictive effect of CNV models
We first constructed a BI-model, whose AUC for CRC risk was 0.809 (95% CI: 0.784-0.833), and then, we added gene CNVs by different variation patterns and the AUCs for the BI+Del-model, BI+Amp-model and BI+Var-model were 0.814 (95% CI: 0.789-0.838, P < 0.001), 0.816 (95%CI: 0.791-0.839, P < 0.001) and 0.818 (95% CI: 0.793-0.841, P < 0.001), respectively (Table 2). The predictive efficiency of models was compared by delta-AUC and NRI / IDI. Compared with the BI-model, the BI+Var-model increased the AUC by 0.009 (95% CI: 0.002-0.015, P = 0.014), which could more accurately identify 1.7% (95% CI: 0.003-0.052, P < 0.001) of participants as CRC cases or controls (Table 3).
Diagnostic accuracy of models in the prediction of CRC risk.
| Models | Cutoff | Sensitivity | Specificity | AUC | 95% CI | P valuea |
|---|---|---|---|---|---|---|
| BI-modelb | 0.50 | 76.83 | 73.36 | 0.809 | 0.784-0.833 | <0.001 |
| BI+Del-modelb | 0.51 | 79.73 | 70.85 | 0.814 | 0.789-0.838 | <0.001 |
| BI+Amp-modelb | 0.51 | 80.89 | 69.69 | 0.816 | 0.791-0.839 | <0.001 |
| BI+Var-modelb | 0.51 | 80.89 | 70.46 | 0.818 | 0.793-0.841 | <0.001 |
CRC, colorectal cancer; AUC, area under the curve; CI, confidence interval.
a P values < 0.05 were considered statistically significant.
b BI-model, model included age, gender, occupation, marital status, nationality, family history of CRC, and factors of smoking and drinking; BI+Del-model, model included information in BI-model and five gene deletion in Del-pattern (Del v.s. wt+amp); BI+Amp-model, model included information in BI-model and five gene amplification in Amp-pattern (Amp v.s. wt+del); BI+Var-pattern, model included information in BI-model and five gene variation in Var-pattern (Del+amp v.s. wt).
The reclassification table and analysis for categorical net reclassification improvement and integrated discrimination improvement for the overall participants.
| BI-model | BI+Del-model | BI+Amp-model | BI+Var-model | |||||||||
|---|---|---|---|---|---|---|---|---|---|---|---|---|
| [0, 0.3) | [0.3, 0.6) | [0.6, 1] | RC% | [0, 0.3) | [0.3, 0.6) | [0.6, 1] | RC% | [0, 0.3) | [0.3, 0.6) | [0.6, 1] | RC% | |
| CRC cases | ||||||||||||
| [0, 0.3) | 70 | 1 | 0 | 1 | 64 | 7 | 0 | 10 | 62 | 9 | 0 | 13 |
| [0.3, 0.6) | 0 | 54 | 0 | 0 | 3 | 49 | 2 | 9 | 1 | 51 | 2 | 6 |
| [0.6, 1] | 1 | 9 | 383 | 3 | 0 | 9 | 384 | 2 | 0 | 20 | 373 | 5 |
| Controls | ||||||||||||
| [0, 0.3) | 296 | 3 | 0 | 1 | 288 | 11 | 0 | 4 | 284 | 15 | 0 | 5 |
| [0.3, 0.6) | 8 | 72 | 1 | 11 | 4 | 77 | 0 | 5 | 9 | 71 | 1 | 12 |
| [0.6, 1] | 0 | 12 | 126 | 9 | 0 | 14 | 124 | 10 | 0 | 26 | 112 | 19 |
| Total | ||||||||||||
| [0, 0.3) | 366 | 4 | 0 | 1 | 352 | 18 | 0 | 5 | 346 | 24 | 0 | 6 |
| [0.3, 0.6) | 8 | 126 | 1 | 7 | 7 | 126 | 2 | 7 | 10 | 122 | 3 | 10 |
| [0.6, 1] | 1 | 21 | 509 | 4 | 0 | 23 | 508 | 4 | 0 | 46 | 485 | 9 |
| NRI (95% CI)a | 0.014(-0.009-0.036), P=0.232 | 0.008(0.001-0.034), P<0.001 | 0.017(0.003-0.052), P<0.001 | |||||||||
| IDI (95% CI)a | 0.007(0.002-0.013), P=0.007 | 0.009(0.004-0.014), P=0.001 | 0.014(0.007-0.020), P<0.001 | |||||||||
| Delta-AUC (95% CI)a | 0.005(-0.001-0.010), P=0.083 | 0.007(0.001-0.013), P=0.031 | 0.009(0.002-0.015), P=0.014 | |||||||||
CRC, colorectal cancer; RC, reclassification percent; CI, confidence interval; NRI, net reclassification improvement; IDI, integrated discrimination improvement; AUC, area under the curve.
a P values < 0.05 were considered statistically significant.
Subgroup analysis
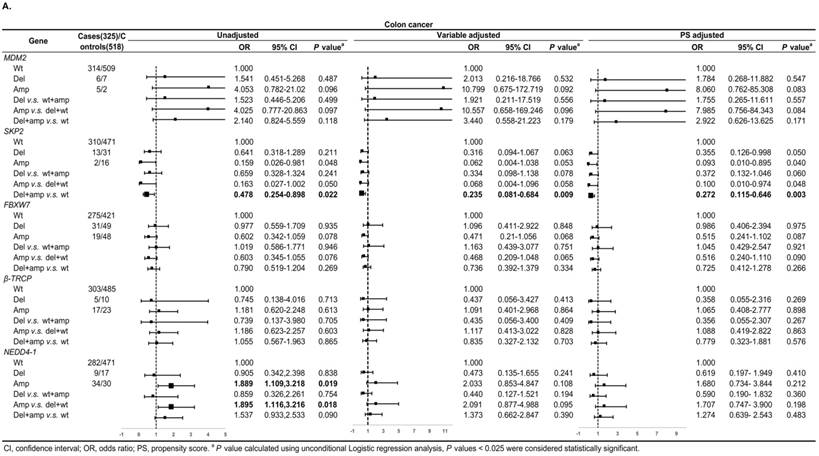
Figure 3A shows, in colon cancer, the ORs of associations between SKP2 abnormal copy number and cancer risk were 0.235 (95% CI: 0.081-0.684, P = 0.009) and 0.272 (95% CI: 0.115-0.646, P = 0.003) for variable adjustment and PS adjustment, respectively. In rectal carcinoma, MDM2 amplification was associated with 15.578 (95% CI: 1.520-159.672, P = 0.021) and 14.999 (95% CI: 1.477-152.326, P = 0.022) times CRC risk after PS adjustment for Amp v.s. Wt and Amp-pattern, respectively (Figure 3B).
Subgroup analysis by tumor location for the associations between gene CNVs and CRC risk in different adjusted models. A. in colon cancer and B. in rectal cancer. The forest plot showed the estimated ORs of the five genes associated with CRC risk and the bold squares indicated statistically significant.
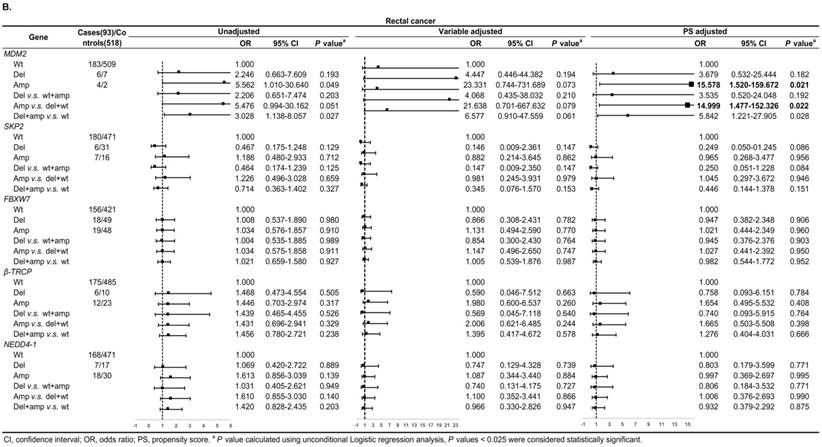
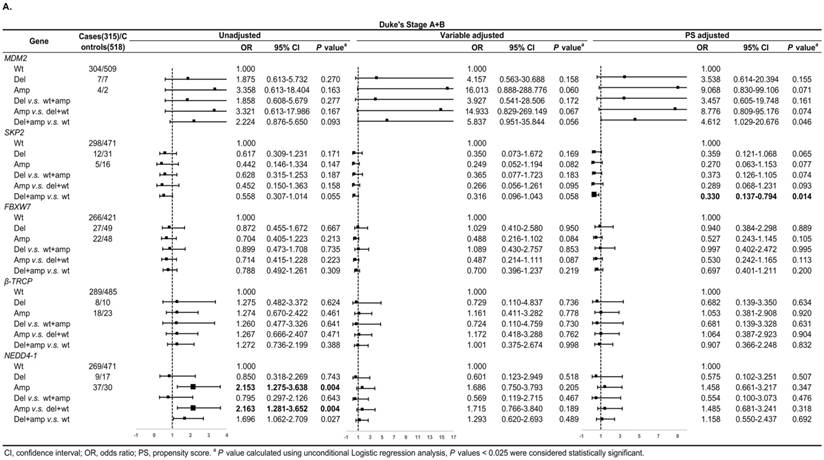
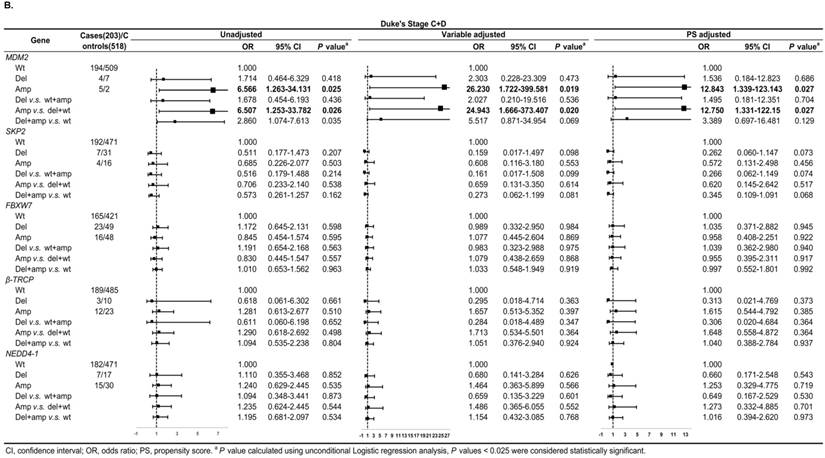
In Duke's Stage A+B patients, the OR of the relationship between SKP2 abnormal copy number and CRC risk was 0.330 (95% CI: 0.137-0.794, P = 0.014) after PS adjustment (Figure 4A). In advanced CRC stage, compared to variable adjustment, the association between MDM2 amplification and CRC risk became more conservative after PS adjustment (Figure 4B).
Subgroup regression analysis by tumor Duke's Stages for the associations between gene CNVs and CRC risk in different adjusted models. A. in Duke's Stage A+B. B. in Duke's Stage C+D. The forest plot showed the estimated ORs of the five genes associated with CRC risk and the bold squares indicated statistically significant.
We also evaluated model prediction in each subgroup. The BI+Var-model performed better than the BI-model and the other two CNV pattern models (BI+Del-model and BI+Amp-model) for patients with colon cancer and in tumor Duke's Stage A+B, it could correctly reclassify 7% (95% CI: 0.021-0.119, P = 0.005) and 4.7% (95%CI: 0.001-0.093, P = 0.048) of the subjects, respectively (Table S3-S4).
Discussion
In this re-analysis case-control study, we applied the PS method to balance all putative influential factors across groups to inspect the more accurate relationships between the germline CNVs of MDM2, SKP2, FBXW7, β-TRCP, and NEDD4-1 and CRC risk. Further adjustment for the PS slightly reduced the point estimates of the associations, showing that MDM2 amplification significantly increased CRC risk, and deletion and the (Del+Amp) genotype of SKP2 were associated with reduced CRC risk. While the confidence intervals of the estimate were clearly narrowed, our results became more conservative and accurate by adjusting PS. Additionally, in sub-set analysis, the MDM2 copy number gain was associated with increased CRC risk in rectal carcinoma and advanced CRC stages, and the SKP2 abnormal copy number showed a relationship between reduced CRC risk in colon cancer and early Duke's Stages. Moreover, the model-integrated gene abnormal copy number pattern could improve the predictive efficiency of the model in CRC risk prediction compared with the BI-model.
The finding of the infrequent MDM2 CNVs (21 in 518 CRC cases and 9 in 518 controls, respectively) in peripheral blood was in line with the previous study, in that MDM2 amplification was observed in only 1 of 88 primary cases [53]. Either as a dual regulator of p53 or being p53-independent, the MDM2 features in cell cycles progression, apoptosis and DNA damage responses confirmed that amplified MDM2 had a comprehensive effect on tumorigenesis [54].
In our observations, the frequency of SKP2 deletion was two times that of the amplification (specifically, 50 and 25 in total participants respectively). SKP2 down-regulation is critical for cell-cycle arrest, and its deletion restricts oncogenesis and induces apoptosis [55]. Zhu et al. suggested that SKP2 copy overrepresentation (13%) and loss (35%) were both observed in adenocarcinoma [56]. We first focused on the level of SKP2 copy in germline DNA, so further research of the copy level of SKP2 in CRC in peripheral blood is necessary to confirm our results.
The results of PS presented here should be seen as complementary to our earlier results [43] and will tend to be conservative and accurate estimates of the associations between gene CNV and CRC risk. Kerry C. Cho et al. [57] and Isseki Maeda et al. [58] also found that further adjustment for PS slightly modified previous associations. Moreover, study also found that among the four popular PS methods (including matching and stratifying on the basis of the PS, Inverse probability weighting applied to each observation, and simply including the PS as an additional variable in a regression model) covariate adjustment performed better than other three [59], which was consistent with our results. Although we attempted to match participants considering the best possible confounder balance, limited data were available for analyzing the effects of the CNV. Studies by Varlotto J et al. [60] and Shirvani SM et al. [61] also found that PS matching analyses limited the effectiveness of comparisons. Nevertheless, our multivariate analysis for adjusting PS showed statistically significant associations.
We are the first to introduce CNV patterns into predictive models to forecast the CRC risk. By adding the integrated information of CNVs of MDM2, SKP2, FBXW7, β-TRCP, and NEDD4-1, the model prediction became more effective. Compared with the BI-model, the BI+Var-model significantly improved the discriminatory performance, as gene CNV information increased the AUC by 1.11%. Recently, a CRC prediction model was developed with the age and family history of CRC together with the gene SNP information, which reported that the inclusion of 8 SNPs could increase the AUC by 0.5% to 4.2% beyond the AUC provided by conventional risk factors [39]. Another CRC predictive model using binary logistic regression combined with the effect of age, gender, family history and 10 SNPs with overall participants (42103 individuals) showed that the AUC range was 0.57-0.59 [38], while our CNV model showed that the AUC range was 0.814-0.818. As a regional variation of genes rather than single nucleotides variation, CNV probably has a stronger association with CRC risk and may contain more abundant information for CRC risk prediction. Despite being limited by our relative low frequency of CNVs in the five genes, enlarging the number of related gene CNV detections may be facilitative to improve the prediction efficiency.
We calculated NRI and IDI, involving the classification of case and control in risk categories and determining how the new model should be reclassified when adding new biomarkers [62]. Additionally, NRI is sensitive to arbitrary cut-off values [51], so the cut-off points were set as 0.3 to 0.6 to explore the model calibration. The BI+Var-model resulted in the reclassification of 1.7% of the subjects into more accurate risk categories. If small increases in the AUC can bring significant improvement in reclassified NRI and steady growth in IDI, although improvements in AUC are very limited, it is worth incorporating such a factor into the prediction model [51].
In the stratified analysis, we observed the associations between MDM2 amplification and increased risk in the rectal tumors, as well as between the SKP2 (del+amp) genotype and reduced CRC risk in colon cancer. Studies have proposed that differences in gene expression levels exist between the colon and rectal cancer [63, 64], and overexpression of p53 is found more often in rectal cancer than colon cancer [64, 65]. MDM2 has been well recognized as a key regulator of p53 [54] and the close relationship may affect the abnormal expression of MDM2 in rectal cancer. Due to many cell cycle regulatory proteins being degraded by SKP2, in addition to microarray data analysis having identified cell cycle genes being mainly expressed in the colon rather than the rectum [63], it is reasonable that the protective function of SKP2 mainly occurs in colon cancer.
MDM2 amplification was associated with an increased CRC risk in advanced stages, and SKP2 deletion had a correlation with decreased CRC risk in early CRC stages. A Japanese study showed that MDM2 amplification in tissues was only 16 of 211 (7.5%), and the incidence of it in Duke's Stage C was significantly higher than that in early A and B [66]. The dysregulation of SKP2 expression may occur in the precancerous stage, prior to obtaining an invasive phenotype during development [10]. Colorectal carcinoma forms from dysplasia of mucosal epithelial cells, SKP2 disordered copy number may also function at an early stage of CRC, and its level fluctuates as worsening grades of the disease progression.
Our analysis still had several limitations. First, this is a retrospective study, the selection and observation bias may still have affected the results. Second, we did not add gene-dietary interactions to the predictive models because our analysis was based on the variables and outcomes collected from previous data, and some environmental factors were obtained by frequency rather than quantity, possibly weakening the efficiency of the analysis. Finally, the study was limited by the sample size and the percentage of the detectable gene CNVs, so the statistical performance needs to be improved in further studies.
Despite these limits, the strengths of this study are clear. First, considering many potential confounding factors by applying PS adjustment, we concluded that MDM2 amplification and SKP2 CNVs are associated with increased and decreased CRC risk, respectively. Second, we were also the first to consider the effectiveness of different CNV patterns and introduced them into a CRC risk predictive model. Our results indicated that an abnormal CNV-combined pattern may be more accurate for predicting CRC risk, and further research needs to be conducted to validate the efficiency of gene CNV models in CRC risk prediction.
Abbreviations
CRC: colorectal cancer; CNV: Copy number variation; E3s: ubiquitin ligases E3; SNPs: single nucleotide polymorphisms; AUC: areas under the curve; ROC: receiver operating characteristic; PS: propensity score; OR: odds ratio; CI: confidence interval; NRI: reclassification improvement; IDI: integrated discrimination improvement.
Supplementary Material
Supplementary figures and tables.
Acknowledgements
The study was supported by the grants from Natural Science Foundation of China (Grant No. 81302483 and 30972539), the fifty-second batch of the Postdoctoral Science Foundation of P. R. China (Grant No. 2012M520773) and the Postdoctoral Science Foundation of the government of Heilongjiang Province (Grant No. LBH-Z11070).
Ethical approval
All procedures performed in studies involving human participants were in accordance with the ethical standards of the Human Research and Ethics Committee of Harbin Medical University.
Author Contributions
Y.S.Z. and F.L.H. designed the study, directed its implementation (including quality assurance and control), and reviewed the manuscript critically for important intellectual content. H.R.B. and L.Y.P did the data analysis and wrote the manuscript. H.R.B and T.T. did the main experiments, contributed to the experimental data acquisition and compiled the data. T.T.X, R.P, and Y.W.Z helped with questionnaire data collection and conducting experiments, and also contributed to the data analysis and draft checking.
Competing Interests
The authors have declared that no competing interest exists.
References
1. Siegel RL, Miller KD, Jemal A. Cancer statistics, 2018. CA Cancer J Clin. 2018;68:7-30
2. Chen W, Zheng R, Baade PD, Zhang S, Zeng H, Bray F. et al. Cancer statistics in China, 2015. CA Cancer J Clin. 2016;66:115-32
3. Grady WM, Carethers JM. Genomic and epigenetic instability in colorectal cancer pathogenesis. Gastroenterology. 2008;135:1079-99
4. Goel A, Boland CR. Recent insights into the pathogenesis of colorectal cancer. Curr Opin Gastroenterol. 2010;26:47-52
5. Kuiper RP, Ligtenberg MJ, Hoogerbrugge N, Geurts van Kessel A. Germline copy number variation and cancer risk. Curr Opin Genet Dev. 2010;20:282-9
6. Venkatachalam R, Ligtenberg MJ, Hoogerbrugge N, Geurts van Kessel A, Kuiper RP. Predisposition to colorectal cancer: exploiting copy number variation to identify novel predisposing genes and mechanisms. Cytogenet Genome Res. 2008;123:188-94
7. Poptsova M, Banerjee S, Gokcumen O, Rubin MA, Demichelis F. Impact of constitutional copy number variants on biological pathway evolution. BMC Evol Biol. 2013;13:19
8. Mani A, Gelmann EP. The ubiquitin-proteasome pathway and its role in cancer. J Clin Oncol. 2005;23:4776-89
9. Honda R, Tanaka H, Yasuda H. Oncoprotein MDM2 is a ubiquitin ligase E3 for tumor suppressor p53. FEBS Lett. 1997;420:25-7
10. Gstaiger M, Jordan R, Lim M, Catzavelos C, Mestan J, Slingerland J. et al. Skp2 is oncogenic and overexpressed in human cancers. Proc Natl Acad Sci U S A. 2001;98:5043-8
11. Calcagno DQ, Freitas VM, Leal MF, de Souza CR, Demachki S, Montenegro R. et al. MYC, FBXW7 and TP53 copy number variation and expression in gastric cancer. BMC Gastroenterol. 2013;13:141
12. Muerkoster S, Arlt A, Sipos B, Witt M, Grossmann M, Kloppel G. et al. Increased expression of the E3-ubiquitin ligase receptor subunit betaTRCP1 relates to constitutive nuclear factor-kappaB activation and chemoresistance in pancreatic carcinoma cells. Cancer Res. 2005;65:1316-24
13. Yang Z, Yuan XG, Chen J, Lu NH. Is NEDD4-1 a negative regulator of phosphatase and tensin homolog in gastric carcinogenesis? World J Gastroenterol. 2012;18:6345-8
14. Oliner JD, Pietenpol JA, Thiagalingam S, Gyuris J, Kinzler KW, Vogelstein B. Oncoprotein MDM2 conceals the activation domain of tumour suppressor p53. Nature. 1993;362:857
15. Xiao Z-X, Chen J, Levine AJ, Modjtahedi N, Xing J, Sellers WR. et al. Interaction between the retinoblastoma protein and the oncoprotein MDM2. Nature. 1995;375:694
16. Martin K, Trouche D, Hagemeier C, Sorensen TS, La Thangue NB, Kouzarides T. Stimulation of E2F1/DP1 transcriptional activity by MDM2 oncoprotein. Nature. 1995;375:691
17. Juven-Gershon T, Shifman O, Unger T, Elkeles A, Haupt Y, Oren M. The Mdm2 oncoprotein interacts with the cell fate regulator Numb. Molecular and cellular biology. 1998;18:3974-82
18. Yeh K-H, Kondo T, Zheng J, Tsvetkov LM, Blair J, Zhang H. The F-box protein SKP2 binds to the phosphorylated threonine 380 in cyclin E and regulates ubiquitin-dependent degradation of cyclin E. Biochemical and biophysical research communications. 2001;281:884-90
19. Marti A, Wirbelauer C, Scheffner M, Krek W. Interaction between ubiquitin-protein ligase SCF SKP2 and E2F-1 underlies the regulation of E2F-1 degradation. Nature cell biology. 1999;1:14
20. Bomstein G, Bloom J, Sitry-Shevah D, Nakayama K, Pagano M, Hershko A. Role of the SCFSkp2 ubiquitin ligase in the degradation of p21Cipl in S phase. J Biol Chem. 2003;278:25752-7
21. Kamura T, Hara T, Kotoshiba S, Yada M, Ishida N, Imaki H. et al. Degradation of p57Kip2 mediated by SCFSkp2-dependent ubiquitylation. Proceedings of the National Academy of Sciences. 2003;100:10231-6
22. Carrano AC, Eytan E, Hershko A, Pagano M. SKP2 is required for ubiquitin-mediated degradation of the CDK inhibitor p27. Nat Cell Biol. 1999;1:193-9
23. Von Der Lehr N, Johansson S, Wu S, Bahram F, Castell A, Cetinkaya C. et al. The F-box protein Skp2 participates in c-Myc proteosomal degradation and acts as a cofactor for c-Myc-regulated transcription. Molecular cell. 2003;11:1189-200
24. Minella AC, Clurman BE. Mechanisms of tumor suppression by the SCFFbw7. Cell cycle. 2005;4:1356-9
25. Agrawal N, Frederick MJ, Pickering CR, Bettegowda C, Chang K, Li RJ. et al. Exome sequencing of head and neck squamous cell carcinoma reveals inactivating mutations in NOTCH1. Science. 2011:1206923
26. Nakayama KI, Nakayama K. Regulation of the cell cycle by SCF-type ubiquitin ligases. Semin. Cell Dev. Biol. 2005;16:323-33
27. Marikawa Y, Elinson RP. β-TrCP is a negative regulator of the Wnt/β-catenin signaling pathway and dorsal axis formation in Xenopus embryos. Mechanisms of development. 1998;77:75-80
28. Yaron A, Hatzubai A, Davis M, Lavon I, Amit S, Manning AM. et al. Identification of the receptor component of the IκBα-ubiquitin ligase. Nature. 1998;396:590
29. Nakayama KI, Nakayama K. Ubiquitin ligases: cell-cycle control and cancer. Nature Reviews Cancer. 2006;6:369
30. Trotman LC, Wang X, Alimonti A, Chen Z, Teruya-Feldstein J, Yang H. et al. Ubiquitination regulates PTEN nuclear import and tumor suppression. Cell. 2007;128:141-56
31. Zeng T, Wang Q, Fu J, Lin Q, Bi J, Ding W. et al. Impeded Nedd4-1-mediated Ras degradation underlies Ras-driven tumorigenesis. Cell reports. 2014;7:871-82
32. Xu C, Fan C, Wang X. Regulation of Mdm2 protein stability and the p53 response by NEDD4-1 E3 ligase. Oncogene. 2015;34:281
33. Huang Z, Choi B, Mujoo K, Fan X, Fa M, Mukherjee S. et al. The E3 ubiquitin ligase NEDD4 negatively regulates HER3/ErbB3 level and signaling. Oncogene. 2015;34:1105
34. Ryan PE, Davies GC, Nau MM, Lipkowitz S. Regulating the regulator: negative regulation of Cbl ubiquitin ligases. Trends in biochemical sciences. 2006;31:79-88
35. Bray SJ. Notch signalling: a simple pathway becomes complex. Nature reviews Molecular cell biology. 2006;7:678
36. Park RW, Kim TM, Kasif S, Park PJ. Identification of rare germline copy number variations over-represented in five human cancer types. Mol Cancer. 2015;14:25
37. Hu L, Yao X, Huang H, Guo Z, Cheng X, Xu Y. et al. Clinical significance of germline copy number variation in susceptibility of human diseases. J Genet Genomics. 2018;45:3-12
38. Dunlop MG, Tenesa A, Farrington SM, Ballereau S, Brewster DH, Koessler T. et al. Cumulative impact of common genetic variants and other risk factors on colorectal cancer risk in 42,103 individuals. Gut. 2013;62:871-81
39. Jo J, Nam CM, Sull JW, Yun JE, Kim SY, Lee SJ. et al. Prediction of Colorectal Cancer Risk Using a Genetic Risk Score: The Korean Cancer Prevention Study-II (KCPS-II). Genomics Inform. 2012;10:175-83
40. Yarnall JM, Crouch DJ, Lewis CM. Incorporating non-genetic risk factors and behavioural modifications into risk prediction models for colorectal cancer. Cancer Epidemiol. 2013;37:324-9
41. RUBIN PRRDB. The central role of the propensity score in observational studies for causal effects. Biometrika. 1983;70:41-55
42. Biondi-Zoccai G, Romagnoli E, Agostoni P, Capodanno D, Castagno D, D'Ascenzo F. et al. Are propensity scores really superior to standard multivariable analysis? Contemp Clin Trials. 2011;32:731-40
43. Bi H, Tian T, Zhu L, Zhou H, Hu H, Liu Y. et al. Copy number variation of E3 ubiquitin ligase genes in peripheral blood leukocyte and colorectal cancer. Sci Rep. 2016;6:29869
44. Shu XO, Yang G, Jin F, Liu D, Kushi L, Wen W. et al. Validity and reproducibility of the food frequency questionnaire used in the Shanghai Women's Health Study. Eur J Clin Nutr. 2004;58:17-23
45. Brookhart MA, Schneeweiss S, Rothman KJ, Glynn RJ, Avorn J, Stürmer T. Variable selection for propensity score models. American journal of epidemiology. 2006;163:1149-56
46. Armstrong R. When to use the Bonferroni correction. Ophthalmic Physiol Opt. 2014;34:502-8
47. Austin PC. Balance diagnostics for comparing the distribution of baseline covariates between treatment groups in propensity-score matched samples. Stat Med. 2009;28:3083-107
48. Brookhart MA, Schneeweiss S, Rothman KJ, Glynn RJ, Avorn J, Sturmer T. Variable selection for propensity score models. Am J Epidemiol. 2006;163:1149-56
49. Wallenstein S, Wittes J. The power of the Mantel-Haenszel test for grouped failure time data. Biometrics. 1993;49:1077-87
50. DeLong ER, DeLong DM, Clarke-Pearson DL. Comparing the areas under two or more correlated receiver operating characteristic curves: a nonparametric approach. Biometrics. 1988;44:837-45
51. Pencina MJ, D'Agostino RB Sr, D'Agostino RB Jr, Vasan RS. Evaluating the added predictive ability of a new marker: from area under the ROC curve to reclassification and beyond. Stat Med. 2008;27:157-72
52. Cook NR, Ridker PM. The Use and Magnitude of Reclassification Measures for Individual Predictors of Global Cardiovascular Risk. Annals of Internal Medicine. 2009;150:795
53. Polsky D, Bastian BC, Hazan C, Melzer K, Pack J, Houghton A. et al. HDM2 protein overexpression, but not gene amplification, is related to tumorigenesis of cutaneous melanoma. Cancer Res. 2001;61:7642-6
54. Hamard PJ, Manfredi JJ. Mdm2's dilemma: to degrade or to translate p53? Cancer Cell. 2012;21:3-5
55. Sutterluty H, Chatelain E, Marti A, Wirbelauer C, Senften M, Muller U. et al. p45SKP2 promotes p27Kip1 degradation and induces S phase in quiescent cells. Nat Cell Biol. 1999;1:207-14
56. Zhu CQ, Blackhall FH, Pintilie M, Iyengar P, Liu N, Ho J. et al. Skp2 gene copy number aberrations are common in non-small cell lung carcinoma, and its overexpression in tumors with ras mutation is a poor prognostic marker. Clin Cancer Res. 2004;10:1984-91
57. Cho KC, Himmelfarb J, Paganini E, Ikizler TA, Soroko SH, Mehta RL. et al. Survival by dialysis modality in critically ill patients with acute kidney injury. J Am Soc Nephrol. 2006;17:3132-8
58. Maeda I, Morita T, Yamaguchi T, Inoue S, Ikenaga M, Matsumoto Y. et al. Effect of continuous deep sedation on survival in patients with advanced cancer (J-Proval): a propensity score-weighted analysis of a prospective cohort study. Lancet Oncol. 2016;17:115-22
59. Elze MC, Gregson J, Baber U, Williamson E, Sartori S, Mehran R. et al. Comparison of Propensity Score Methods and Covariate Adjustment: Evaluation in 4 Cardiovascular Studies. J Am Coll Cardiol. 2017;69:345-57
60. Varlotto J, Fakiris A, Flickinger J, Medford-Davis L, Liss A, Shelkey J. et al. Matched-pair and propensity score comparisons of outcomes of patients with clinical stage I non-small cell lung cancer treated with resection or stereotactic radiosurgery. Cancer. 2013;119:2683-91
61. Shirvani SM, Jiang J, Chang JY, Welsh JW, Gomez DR, Swisher S. et al. Comparative effectiveness of 5 treatment strategies for early-stage non-small cell lung cancer in the elderly. Int J Radiat Oncol Biol Phys. 2012;84:1060-70
62. Pencina MJ, D'Agostino RB Sr, Steyerberg EW. Extensions of net reclassification improvement calculations to measure usefulness of new biomarkers. Stat Med. 2011;30:11-21
63. Li JN, Zhao L, Wu J, Wu B, Yang H, Zhang HH. et al. Differences in gene expression profiles and carcinogenesis pathways between colon and rectal cancer. J Dig Dis. 2012;13:24-32
64. Kapiteijn E, Liefers GJ, Los LC, Kranenbarg EK, Hermans J, Tollenaar RA. et al. Mechanisms of oncogenesis in colon versus rectal cancer. J Pathol. 2001;195:171-8
65. Yamaguchi A, Kurosaka Y, Fushida S, Kanno M, Yonemura Y, Miwa K. et al. Expression of p53 protein in colorectal cancer and its relationship to short-term prognosis. Cancer. 1992;70:2778-84
66. Sugano N, Suda T, Godai TI, Tsuchida K, Shiozawa M, Sekiguchi H. et al. MDM2 gene amplification in colorectal cancer is associated with disease progression at the primary site, but inversely correlated with distant metastasis. Genes Chromosomes Cancer. 2010;49:620-9
Author contact
![]() Corresponding authors: Yashuang Zhao, Ph.D., Department of Epidemiology, Public Health College, Harbin Medical University, 157 Baojian Street, Nangang District, 150081 Harbin, People's Republic of China. Tel: 86-(0)451-87502823; Fax: 86-(0)451-87502885; E-mail: zhao_yashuangnet and Fulan Hu, Ph.D., Department of Epidemiology, Public Health College, Harbin Medical University, 157 BaojianStreet, Nangang District, 150081 Harbin, People's Republic of China. Tel: 86-(0)451-87502823; Fax: 86-(0)451-87502885; E-mail: hufulanhrbmu.edu.cn
Corresponding authors: Yashuang Zhao, Ph.D., Department of Epidemiology, Public Health College, Harbin Medical University, 157 Baojian Street, Nangang District, 150081 Harbin, People's Republic of China. Tel: 86-(0)451-87502823; Fax: 86-(0)451-87502885; E-mail: zhao_yashuangnet and Fulan Hu, Ph.D., Department of Epidemiology, Public Health College, Harbin Medical University, 157 BaojianStreet, Nangang District, 150081 Harbin, People's Republic of China. Tel: 86-(0)451-87502823; Fax: 86-(0)451-87502885; E-mail: hufulanhrbmu.edu.cn