Impact Factor ISSN: 1837-9664

 Global reach, higher impact
J Cancer 2019; 10(5):1313-1324. doi:10.7150/jca.28349 This issue Cite
Research Paper
High expression of Oct4 and Nanog predict poor prognosis in intrahepatic cholangiocarcinoma patients after curative resection
Mei-xia Zhang1*, Wei Gan1*, Chu-yu Jing1*, Su-su Zheng1, Yong Yi1, Juan Zhang1, Xin Xu1, Jia-jia Lin1, Bo-heng Zhang1,2 ![]() , Shuang-jian Qiu1
, Shuang-jian Qiu1 ![]()
1. The Liver Cancer Institute, Zhongshan Hospital and Shanghai Medical School, Fudan University, Key Laboratory for Carcinogenesis and Cancer Invasion, The Chinese Ministry of Education, Shanghai, 200032, P.R. China.
2. Center for evidence-based medicine, Fudan University, Shanghai 200032, P. R. China.
*These authors contributed equally to this work, and should be considered as co-first authors.
Received 2018-7-6; Accepted 2018-10-30; Published 2019-1-30
Abstract
Oct4 and Nanog are reported to promote tumor progression in several cancers, but the effect on intrahepatic cholangiocarcinoma (ICC) is unknown. The aim of our present study was to explore the prognostic role of Oct4 and Nanog on patients with ICC. Immunohistochemistry was used to detect the expression of Oct4 and Nanog in a random cohort of 116 ICC patients, and validated in another independent cohort of 103 patients. Prognostic nomograms were formulated for OS and RFS prediction of ICC patients. Our results showed Oct4 and Nanog highly expressed in ICC tumor tissues and were identified as independent prognostic factors for patients' OS and RFS. Significant positive correlation was found between Oct4 and Nanog expression. Co-expression of Oct4 and Nanog implied the poorest OS and RFS in ICC patients. Our nomograms comprising Oct4 and Nanog achieved better predictive accuracy in training and validation cohorts compared with AJCC 7th edition and LCSGJ stage for OS and RFS prediction. Our study support the high expression of Oct4 and Nanog in ICC implies aggressive tumor behaviors and suggest a poor clinical prognosis, which emerges as valuable biomarkers for identifying patients at high risk after curative resection.
Keywords: Intrahepatic cholangiocarcinoma, Oct4, Nanog, Prognosis, Nomogram
Introduction
Intrahepatic cholangiocarcinoma (ICC) is the second most common liver malignancy which arises from the intrahepatic bile duct epithelial cells [1]. Unlike hepatocellular carcinoma (HCC), the incidence rate of ICC accounts for about 10% -25% of primary liver cancer [2] and characterized by a poorer prognosis with a 5-year survival rate of 25-35% after surgical resection [3, 4]. In the past 20 years, the incidence of ICC is increasing worldwide [5], but radical surgical resection is still the only potentially curative treatment option for ICC patients in the early stage [6]. The high incidence of postoperative recurrence and distant metastasis contribute to the unsatisfactory clinical outcome of ICC patients [7]. Therefore, specific biomarkers that can diagnose ICC at an early stage and predict the risk of recurrence are urgently necessary for the development of effective therapeutic strategies.
Accumulating evidence in recent years has discovered only a small proportion of tumor cells, endowed with stem-cell-like features to self-proliferate and self-renew extensively [8]. To date, the theory of cancer stem cells (CSCs) have been verified in a wide variety of malignant tumors including breast cancer, prostate cancer, colon cancer and HCC [9]. Hence, CSCs theory opens up a perspective for exploring multipotential and self-renewal-related genes which may cause recurrence, early metastasis and resistance to chemoradiation in malignancies.
Octamer-binding transcription factor 4 (Oct4), also known as POU class 5 homeobox 1, or POU5F1, is an important transcription factor responsible for regulating pluripotency and self-renewal properties in embryonic stem cells [10]. Nanog, a downstream target of Oct4, contributes to maintain self-renewal and self-differentiation of stem cell characteristics [11, 12]. Nanog and Oct4 are reported to be essential for the reprogramming of somatic cells into induced pluripotent stem cells and their expression increased during the processes of cancer cells dedifferentiation and somatic cells oncogenic transformation [13, 14]. In the presence of Oct4, Nanog is reported to promote tumorigenesis and metastasis in various tumors [9]. A series of evidence have pointed out they positively associated with tumor recurrence, metastasis and unsatisfactory prognosis in several tumors [15]. Oct4 and Nanog involved in malignant metastasis via epithelial-to-mesenchymal transition (EMT) [16]. In our previous study, Oct4 and Nanog are proved as independent prognostic factors in HCC patients and promote HCC cell self-renewal, proliferation, metastasis through initiating CSC-like properties [9, 17]. Based on our previous findings, it is logic to propose a hypothesis that high expression of Oct4 and Nanog may predict unfavorable outcomes in ICC patients.
Nomogram, an intuitive statistical model, can provide more individualized outcome predictions based on integrating diverse biologic and clinical variables [18]. Due to the obvious superiority compared with traditional staging system, nomograms have been applied to several tumors for predicting prognostic factors [19]. We, herein, attempt to establish nomograms for comparing the predictive effect of Oct4 and Nanog with traditional staging system in ICC patients after curative resection.
Materials and methods
Tissue samples and clinical data collection
Two independent cohorts including a total of 219 patients diagnosed with ICC, enrolled from August 2005 to December 2014 at Zhongshan Hospital, Fudan University were retrospectively analyzed in this study. All patients were randomized into two groups: the first 116 were termed as training cohort and the remaining 103 as validation cohort. All of the enrolled patients met the inclusion criteria as follows: (1) without any preoperative anticancer treatments to each patient; (2) a definite pathologic diagnosis of ICC; (3) complete removal of the tumour tissues and histopathologically confirmed negative resection margin larger than 1cm; (4) with complete clinicopathologic data and follow-up information. Cases with mixed cancers, tumor of uncertain origins or distant metastasis before the surgery were all excluded. Informed consent before specimen collection was obtained from each patient and the research was approved by the Clinical Research Ethic Committee of Zhongshan Hospital. Conventional clinicopathologic variables including age, gender, vascular invasion, lymph node metastasis (LNM), and so forth were recorded in our study. It is generally considered that HBV infection and AFP level are mainly predictors of HCC and ICC is associated with primary sclerosing cholangitis and cholelithiasis. Therefore, we did not include these two serological indicators in our research. Liver function was evaluated by Child-Pugh scoring system [19]. The clinical staging was based on American Joint Committee on Cancer (AJCC) seventh edition [6] and the Liver Cancer Study Group of Japan (LCSGJ) staging system [20]. World Health Organization classification was used to estimate histologic grade of tumors.
Follow-up
The postoperative follow-up procedure was carried out every 2 to 4 months as described in our previous study [21]. All patients were monitored by serological tumor biomarkers, abdominal ultrasonography, and chest X-ray during each follow-up. Computed tomography and/or magnetic resonance imaging were performed to validate whether suspected recurrence or distal metastasis had occurred. The interval between surgery and time of either death or last observation was defined as overall survival (OS). The interval between the date of surgery and the time when recurrence was first identified was defined as recurrence-free survival (RFS).
Tissue microarray construction and immunohistochemistry
Tissue microarrays (TMAs) were constructed as described previously report [22]. Each case was extracted two different tissue microarray blocks (tumor center and nearest para-carcinoma tissues, respectively, 3-mm-diameter each) used for TMAs construction. Because the number of intrahepatic bile duct tissues in liver is relatively small, in fact, almost all of our para-carcinoma tissues are liver parenchyma, and there are few normal intrahepatic ducts in our surgical specimens.
Monoclonal rabbit antihuman Oct4 and Nanog were purchased from Cell Signaling Technology (HochschuleDarmstadt, Germany). Immunohistochemistry (IHC) was used to detect the expression of Oct4 and Nanog in ICC tissues, the operation steps were performed as the descried [23]. Two experienced observers were responsible for the sliced evaluation in a double blind manner. The expression of Oct4 and Nanog was evaluated by semiquantitative scoring system [24]. The final score was made by the positively stained tumor cells (0, no positive tumor cells; 1, < 10%; 2, 10-35%; 3, 35-75%; 4, > 75%) multiplied by staining intensity (1, no staining; 2, weak; 3, moderate; 4, strong). Eventually, total scores ≥ 8 were defined as high expression and those < 8 were defined as low expression [24].
Statistical analysis
Statistical analyses were performed with SPSS 20.0 (SPSS Inc., Chicago, USA). The association between Oct4 and Nanog and clinicopathologic characteristics was analyzed by Chi-square test (χ2-test). The survival curves were evaluated by Kaplan-Meier analysis and compared by the log-rank test. The Cox proportional hazards regression model was adopted for univariate and multivariate analysis. Variables significant on univariate analysis (defined as P < 0.05) were chosen as explanatory variables for the multivariate model. P < 0.05 was considered to be statistically significant. The rms package in R project (R version 3.0.2) was used to establish nomograms based on the results of multivariate analysis [5]. The predictive accuracy of the nomogram was measured by concordance index (C-index), calibration curve and decision curve analysis (DCA) as previously described [25]. The larger the C-index, the more accurate was the prognostic prediction [26].
Results
Patient clinicopathologic profiles
For the whole study of 219 patients, there are 132 males and 87 females, 117 patients (53.4%) were noted with tumor size >5 cm. 53 (24.2%) patients carried multiple tumor nodules. 49 (22.4%) patients had LNM, 64 out of 219 (29.2%) were of poor differentiation. According to the AJCC 7th edition, the number of patients classified into stage I-II and III-IV were 152 and 67, respectively. The number of patients classified into stage I-II and III-IV based on LCSGJ staging system were 99 and 120. The detailed characteristics of patients in training and validation cohorts are presented in Table 1 and Table S 1.
Correlations between Oct4 and Nanog expression and clinicopathologic variables in patients of training cohort
| Parameters | Oct4 expression | Nanog expression | |||||
|---|---|---|---|---|---|---|---|
| High n = 67 | Low n = 49 | P | High n = 71 | Low n = 45 | P | ||
| Age(year) | Age (year) | ||||||
| ≤ 61 | 33 | 28 | ≤ 61 | 36 | 25 | ||
| > 61 | 34 | 21 | 0.401 | > 61 | 35 | 20 | 0.610 |
| Sex | Sex | ||||||
| Female | 37 | 27 | Female | 40 | 24 | ||
| Male | 30 | 22 | 0.990 | Male | 31 | 21 | 0.751 |
| Liver cirrhosis | Liver cirrhosis | ||||||
| Yes | 10 | 3 | Yes | 7 | 6 | ||
| No | 57 | 46 | 0.233 | No | 64 | 39 | 0.563 |
| Tumor differentiation | Tumor differentiation | ||||||
| well to moderately | 48 | 42 | well to moderately | 53 | 37 | ||
| poorly | 19 | 7 | 0.073 | poorly | 18 | 8 | 0.340 |
| Tumor number | Tumor number | ||||||
| Single | 45 | 44 | Single | 49 | 40 | ||
| Multiple | 22 | 5 | 0.004 | Multiple | 22 | 5 | 0.014 |
| Tumor size(cm) | Tumor size(cm) | ||||||
| ≤ 5cm | 26 | 22 | ≤ 5cm | 27 | 21 | ||
| > 5cm | 41 | 27 | 0.511 | > 5cm | 44 | 24 | 0.357 |
| Direct invasion and local extrahepatic metastasis | Direct invasion and local extrahepatic metastasis | ||||||
| Yes | 5 | 4 | Yes | 5 | 4 | ||
| No | 62 | 45 | 1.000 | No | 66 | 41 | 0.431 |
| Regional lymph node metastasis | Regional lymph node metastasis | ||||||
| Yes | 19 | 4 | Yes | 17 | 6 | ||
| No | 48 | 45 | 0.007 | No | 54 | 39 | 0.163 |
| Vascular invasion | Vascular invasion | ||||||
| Yes | 17 | 7 | Yes | 17 | 7 | ||
| No | 50 | 42 | 0.145 | No | 54 | 38 | 0.227 |
| Child-Pugh score (A versus B) | Child-Pugh score (A versus B) | ||||||
| A | 65 | 49 | A | 69 | 45 | ||
| B | 2 | 0 | 0.222 | B | 2 | 0 | 0.505 |
| GGT | GGT | ||||||
| > 60 U/L | 36 | 17 | > 60 U/L | 35 | 18 | ||
| ≤ 60U/L | 31 | 32 | 0.042 | ≤ 60U/L | 36 | 27 | 0.327 |
| CEA | CEA | ||||||
| ≥ 5ng/mL | 20 | 9 | ≥ 5ng/mL | 18 | 11 | ||
| < 5ng/mL | 47 | 40 | 0.158 | < 5ng/mL | 53 | 34 | 0.912 |
| CA19-9 | CA19-9 | ||||||
| ≥ 37U/L | 38 | 22 | ≥ 37U/L | 39 | 21 | ||
| < 37U/L | 29 | 27 | 0.208 | < 37U/L | 32 | 24 | 0.385 |
| AJCC 7th edition | AJCC 7th edition | ||||||
| I-II | 44 | 41 | I-II | 50 | 35 | ||
| III-IV | 23 | 8 | 0.030 | III-IV | 21 | 10 | 0.383 |
| LCSGJ stage | LCSGJ stage | ||||||
| I-II | 26 | 31 | I-II | 31 | 26 | ||
| III-IV | 41 | 18 | 0.013 | III-IV | 40 | 19 | 0.138 |
| Nanog expression | Oct4 expression | ||||||
| High | 57 | 14 | High | 57 | 10 | ||
| Low | 10 | 35 | <0.001 | Low | 14 | 35 | <0.001 |
P-value <0.05 marked in bold font shows statistical significant.
Abbreviations: GGT, gamma-glutamyltransferase; CEA, carcinoembryonic antigen; CA19-9, carbohydrate antigen 19-9;
AJCC, American Joint Committee on Cancer; LCSGJ, the Liver Cancer Study Group of Japan
Immunohistochemical staining of Oct4 and Nanog
67 (57.8 %, 67 out of 116) and 71 (61.2 %, 71 out of 116) cases were positive for Oct4 and Nanog expression in training set, respectively. High expression of Oct4 and Nanog was 64.7% (66 out of 103) and 63.1% (65 out of 103) in validation set, respectively. Co-expression of Oct4 and Nanog was detected in 57 and 61 patients in training set and validation set, respectively.
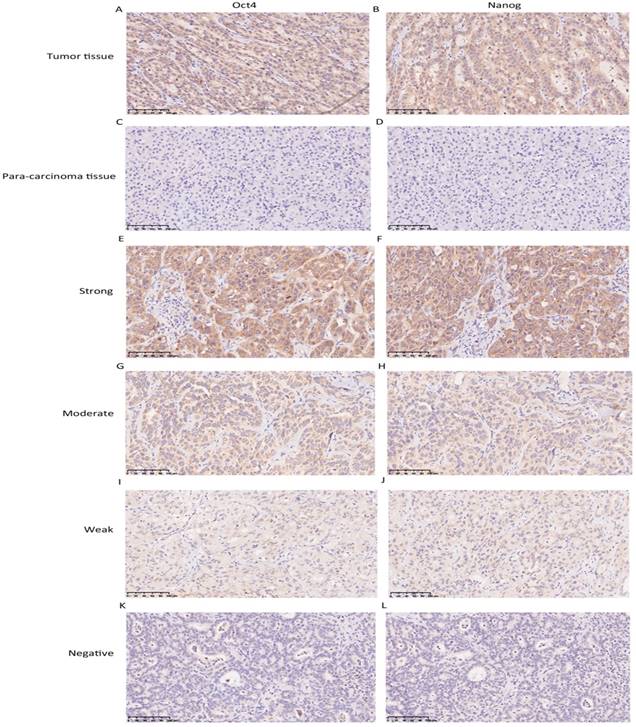
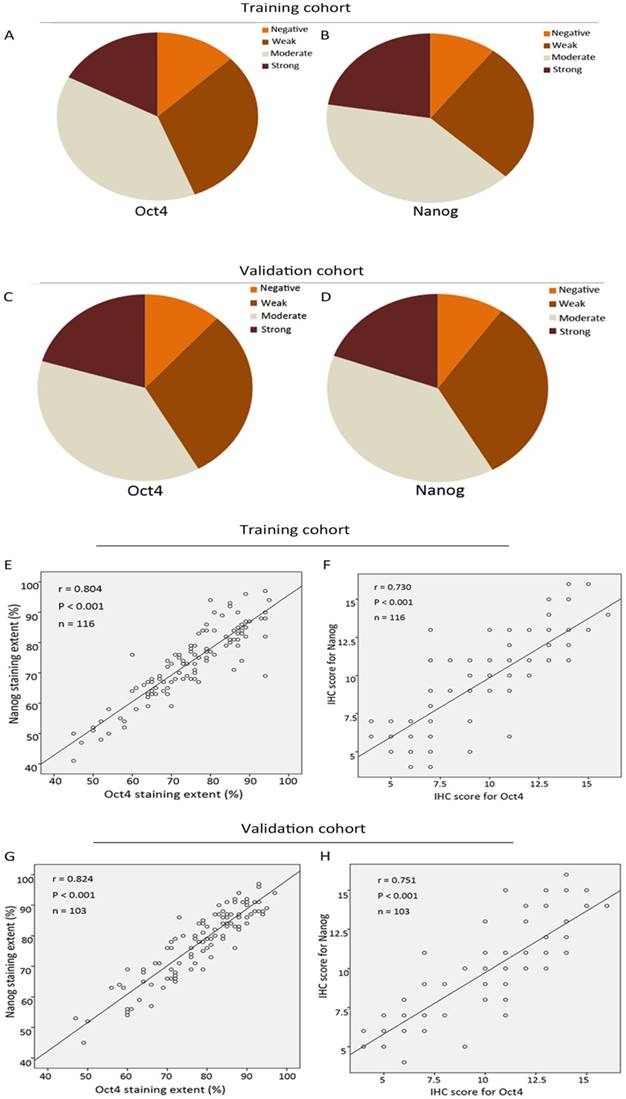
The expression level of Oct4 and Nanog were significantly higher in ICC tumor tissues than those in para-carcinoma tissues (liver parenchyma), in concordance with their expression manner in HCC [9] (Fig. 1 A, B, C, D). In tumour area, Oct4 and Nanog mainly expressed in the cell cytoplasm, only 7 cases of tumor tissues revealed the positive expression of Oct4 and Nanog in some nucleus of ICC cells, the rest of cases were cytoplasmic positive expression. For vast majority of ICC samples, both Oct4 and Nanog expression was scattered throughout the specimens (Fig. 1 E-L). In training set, the staining intensity of negative, weak, moderate, strong of Oct4 and Nanog (in brackets) were approximately 12.9% (10.3%), 31% (26.8%), 38.9% (40.5%), 17.2% (22.4%), respectively (Fig. 2 A, B). The staining extent of negative, weak, moderate, strong of Oct4 and Nanog (in brackets) in the validation group was 11.7% (9.7%), 30% (32%), 37.9% (38.9 %), 20.4% (19.4%), respectively (Fig. 2 C, D). More importantly, whether in training group or validation group, the staining extent (r = 0.804, P < 0.0001; r = 0.824, P < 0.0001) and final IHC scores (r = 0.730, P < 0.0001; r = 0.751, P < 0.0001) of Oct4 was considered to be positively correlated to Nanog in ICC patients (Fig. 2 E, F, G, H). Collectively, a positive correlation was proved between expression of Oct4 and Nanog, which was in accordance with our previous research in HCC patients [9].
Immunohistochemistry was used to detect Oct4 and Nanog expression in ICC tissues. (A, B, C, D) The expression of Oct4 and Nanog in ICC tumor tissues was higher than para-carcinoma tissues. (E-L) Representative images were shown for strong, moderate, weak and negative expression of Oct4 and Nanog in ICC tumor tissues. (Magnification × 200, scale bar = 100 μm).
Correlation analysis of Oct4 and Nanog expression in training and validation cohorts of ICC. (A, B, C, D) The IHC staining intensity of negative, weak, moderate, strong of Oct4 and Nanog expression in training and validation sets. (E, F, G, H) The correlation analysis of IHC results of Oct4 and Nanog in training and validation sets. (E, G) Correlation analysis of IHC staining extent. (F, H) Correlation analysis of final IHC scores. Oct4 expression was positively correlated with Nanog expression in both two cohorts.
The correlation between Oct4 and Nanog with clinicopathologic characteristic
In training set (Table 1), high expression of Oct4 was positively correlated with tumor number (P = 0.004), LNM (P = 0.007), GGT (P = 0.042), AJCC 7th edition (P = 0.030) and LCSGJ stage (P = 0.013). Increased expression of Nanog was associated with tumor number (P = 0.014). In validation set (Table S 1), there was significant correlation was detected between high expression of Oct4 and liver cirrhosis (P = 0.027), tumor number (P = 0.040), LNM (P = 0.040), vascular invasion (P = 0.017), GGT (P < 0.001), CEA (P = 0.023), CA19-9 (P = 0.001), AJCC 7th edition (P = 0.034) and LCSGJ stage (P = 0.004). High expression of Nanog was positively related with tumor number (P = 0.031), GGT (P < 0.001), CEA (P = 0.016), CA19-9 (P < 0.001), AJCC 7th edition (P < 0.001) and LCSGJ stage (P < 0.001).
Role of Oct4 and Nanog on prognosis of ICC patients
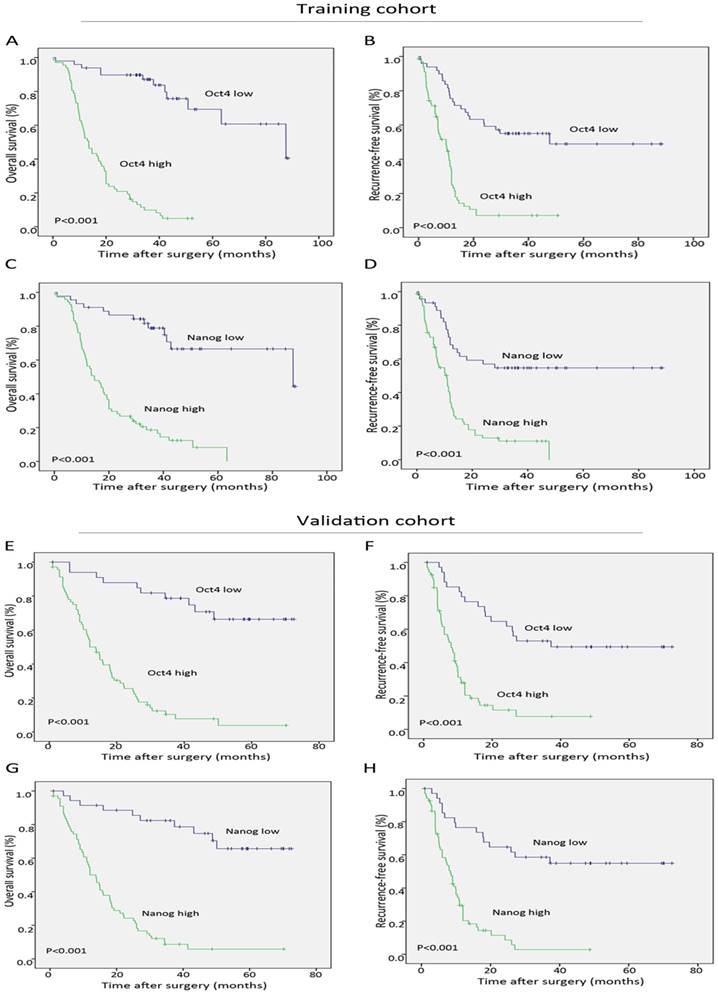
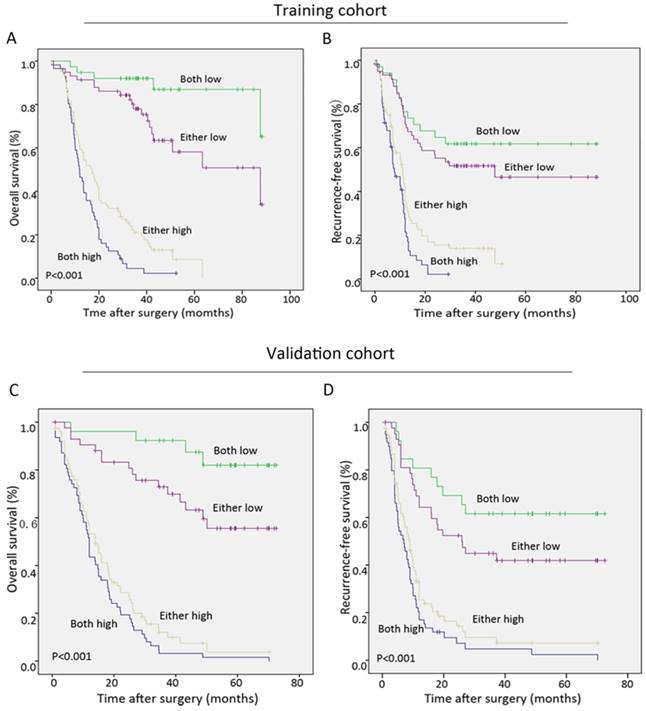
During the follow-up period after operation, 68.9% (151 of 219) of the patients had suffered from recurrence and 66.7% (146 of 219) had died according to follow-up records. Patients with high Oct4 or Nanog expression were more likely to suffer from poorer OS and shorter RFS than those with low Oct4 or Nanog expression in two independent cohorts (Fig. 3 A-H). Univariate analysis revealed Oct4, Nanog, LNM, AJCC 7th edition and LCSGJ stage displayed relevance to poor OS and RFS in both training set and validation set (Table 2 and Table S 2). While multivariate analysis indicated independent prognostic factors for OS and RFS in both groups were only Oct4 and Nanog (Table 2 and Table S 2). These above findings prompted us to further explore the relationship between Oc4 and Nanog in predicting OS and RFS in ICC patients. All patients were divided into four groups: both Oct4 and Nanog were high, either Oct4 or Nanog was high; both Oct4 and Nanog were low, either Oct4 or Nanog was low. The poorest OS and shortest RFS were found in ICC patients with a high Oct4 level and high Nanog expression compare with patients in other three groups (Fig. 4 A, B, C, D). Consequently, these findings truly provided evidence that co-expression of Oct4 and Nanog indeed suggested a relative unfavorable prognosis in ICC patients.
Significance of Oct4 and Nanog expression in training and validation sets. Kaplan-Meier analysis for OS (left) and RFS (right) of ICC patients, suggesting both Oct4 (A, B, E, F) and Nanog (C, D, G, H) were independent prognostic factors for OS and RFS in training and validation cohorts.
Univariate and multivariate analyses of factors associated with OS and RFS in training cohort
| Variables | OS | RFS | ||||||
|---|---|---|---|---|---|---|---|---|
| Univariate analysis | Multivariate analysis | Univariate analysis | Multivariate analysis | |||||
| HR(95%CI) | P | HR(95%CI) | P | HR(95%CI) | P | HR(95%CI) | P | |
| Age(years) | 1.229(0.781-1.934) | 0.372 | NA | NA | 1.129(0.726-1.757) | 0.590 | NA | NA |
| Sex | 0.874(0.554-1.379) | 0.563 | NA | NA | 0.924(0.593-1.440) | 0.260 | NA | NA |
| Liver cirrhosis | 1.302(0.624-2.718) | 0.482 | NA | NA | 1.060(0.546-2.058) | 0.864 | NA | NA |
| Tumor differentiation | 1.423(0.844-2.401) | 0.186 | NA | NA | 1.162(0.686-1.968) | 0.577 | NA | NA |
| Tumor number (multiple vs.single) | 2.157(1.294-3.594 ) | 0.003 | 1.338(0.700-2.558) | 0.379 | 1.964(1.190-3.243) | 0.008 | 1.122(0.590-2.132) | 0.726 |
| Tumor size (> 5cm vs. ≤ 5cm) | 1.891(1.056 -3.387 ) | 0.032 | 2.448 (1.207-4.962) | 0.013 | 1.712(0.987-2.970) | 0.056 | NA | NA |
| Regional lymph node metastasis | 4.690(2.771-7.939) | <0.001 | 1.707(0.526-5.541) | 0.373 | 2.613(1.560-4.377) | <0.001 | 1.152(0.369-3.601) | 0.808 |
| Child-Pugh score (A versus B) | 3.652(0.873-15.289) | 0.076 | NA | NA | 5.608(1.344-23.392) | 0.018 | 2.004(0.415-9.684) | 0.387 |
| Direct invasion and local extrahepatic metastasis | 1.223(0.493-3.034) | 0.665 | NA | NA | 1.408(0.569-3.484) | 0.460 | NA | NA |
| Vascular invasion (no vs. yes) | 1.559(0.915-2.657) | 0.103 | NA | NA | 1.539(0.917-2.582) | 0.103 | NA | NA |
| CEA (≥ 5ng/mL vs. < 5ng/mL) | 2.139(1.318-3.472) | 0.002 | 1.655(0.956-2.867) | 0.072 | 2.186(1.349-3.541) | 0.001 | 1.876(1.091-3.255) | 0.023 |
| CA19-9 (≥ 37 U/L vs. < 37) | 1.609 (1.016 -2.548) | 0.043 | 1.062(0.621-1.817) | 0.827 | 1.527(1.978-2.386) | 0.063 | NA | NA |
| GGT (≥ 60 U/L vs. < 60 | 1.609(1.018-2.544) | 0.042 | 1.135(0.673-1.915) | 0.635 | 1.545(0.991-2.407) | 0.055 | NA | NA |
| AJCC 7th edition | 2.774(1.707-4.507) | <0.001 | 1.136(0.355-3.628) | 0.830 | 1.822(1.126-2.949) | 0.015 | 1.074(0.347-3.321) | 0.901 |
| LCSGJ stage | 2.220(1.396-3.533) | 0.001 | 1.633(0.791-3.373) | 0.185 | 1.590(1.019-2.482) | 0.041 | 1.058(0.542-2.063) | 0.869 |
| Oct4 | 11.761(5.892-23.477) | <0.001 | 8.988(4.084-19.779) | <0.001 | 4.422(2.650-7.379) | <0.001 | 2.722(1.502-4.932) | 0.001 |
| Nanog | 6.826(3.623-12.859) | <0.001 | 5.933(2.803-12.557) | <0.001 | 3.565(2.119-5.999) | <0.001 | 2.500(1.407-4.442) | 0.002 |
P-value <0.05 marked in bold font shows statistical significant; NA = not applicable
Abbreviations: OS, overall survival; RFS, recurrence-free survival; HR, hazard ratio; GGT, gamma-glutamyltransferase; CEA, carcinoembryonic antigen;
CA19-9, carbohydrate antigen 19-9; AJCC, American Joint Committee on Cancer; LCSGJ, the Liver Cancer Study Group of Japan
Co-expression of Oct4 and Nanog suggested the poorest outcomes in ICC patients. (A, B, C, D) The Kaplan-Meier analysis for OS (left) and RFS (right) revealed a high Oct4 expression combined with high Nanog expression implied the poorest OS and RFS in both training and validation sets.
Subgroup analyses were performed to further explore the significance of Oct4 and Nanog expression in discriminating patients with different clinicopathologic features. As shown in our results, Oct4 and Nanog can stratify patients OS and RFS regarding single tumor, large tumor, well-differentiated tumor, tumor without lymph node metastasis and tumor without vascular invasion in both training (Fig. S 1 and S 2, respectively) and validation cohort (Fig. S 3 and S 4, respectively).
Construction of Nomograms for OS and RFS prediction
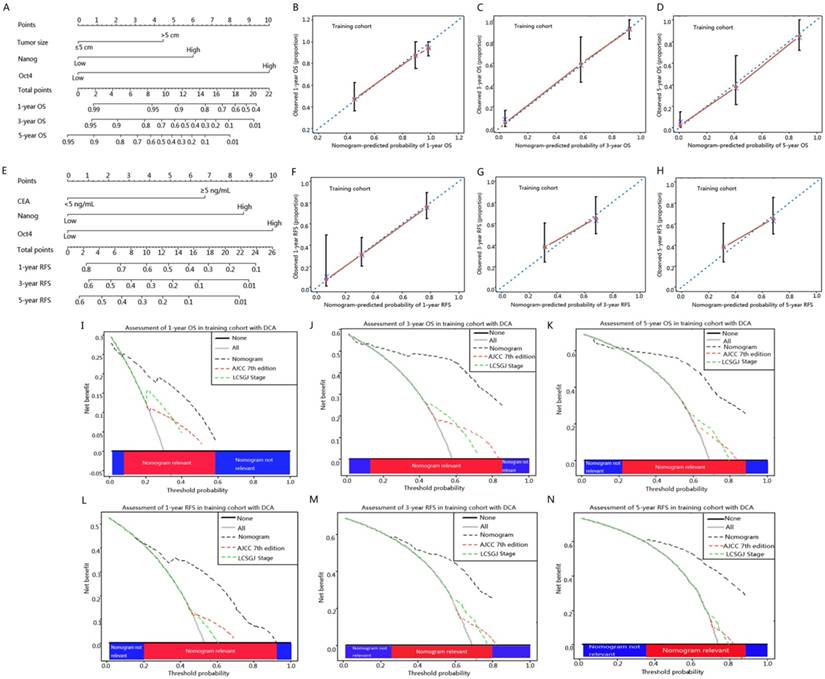
To better estimate the prognostic capability of Oct4 and Nanog in ICC patients, we integrated significant independent prognostic factors according to multivariate analysis in training cohort (Table 2) to create prognostic nomograms (Fig. 5 A, E). The prognostic nomogram comprising tumour size, Oct4 and Nanog for OS prediction derived from training cohort is shown in Fig. 5 A. The C-index for OS prediction in training cohort was 0.796 (95% CI, 0.793-0.799). The calibration curves reached a good consensus between the OS prediction by nomogram and actual observation at 1, 3, 5 year after surgery (Fig. 5 B, C, D). The prognostic nomogram comprising CEA, Oct4 and Nanog for RFS prediction derived from training cohort is shown in Fig. 5 E. The C-index for RFS prediction in training cohort was 0.714 (95% CI, 0.711-0.717). The calibration plot for the probability of RFS at 1, 3, 5 year after surgery showed optimal consistency between the prediction by nomogram and actual observation (Fig. 5 F, G, H).
ICC prognostic nomograms, calibration curve and decision curve analysis in training cohort. (A, E) Nomograms predicting OS and RFS in ICC patients (to use the nomogram, an individual patient's value is located on each variable axis, and a line is drawn upwards to determine the number of points received for each variable value. The sum of these numbers is located on the Total Points axis, and a line is drawn downwards to the survival axes to determine the likelihood of 1-, 3- and 5-year OS and RFS). The calibration curve for predicting OS at (B) 1 year, (C) 3 year, (D) 5 year and predicting RFS at (F) 1 year, (G) 3 year, (H) 5 year. Nomogram-predicted probability of overall survival is plotted on the x axis and actual overall survival is plotted on the y axis. Decision curve analyses depict the clinical net benefit in pairwise comparisons across the different models. Nomograms are compared with the AJCC 7th edition and LCSGJ stage in terms of (I) 1-year, (J) 3-year and (K) 5-year OS and (L) 1-year, (M) 3-year and (N) 5-year RFS. Dashed lines indicate the net benefit of the predictive models across a range of threshold probabilities (black: nomogram; red: AJCC 7th edition; green: LCSGJ Stage). The horizontal solid black line represents the assumptions that no patient will experience the event, and the solid grey line represents the assumption that all patients will experience the event. On decision curve analysis, nomograms showed superior net benefit compared with AJCC 7th edition and LCSGJ stage across a wider range of threshold probabilities.
Validation of the Nomograms
In validation cohort, the C-index of the constructed nomogram for predicting OS was 0.785 (95% CI, 0.782-0.788), and the calibration curve fit well between the probability of OS prediction by nomogram and actual observation at 1, 3, 5 year after surgery (Fig. S 5 A, B, C). The C-index of the constructed nomogram for RFS prediction was 0.686 (95% CI, 0.683-0.689), and the calibration curve of the probability reached a good agreement for RFS prediction between nomogram and actual observation at 1, 3, 5-year after surgery (Fig. S 5 D, E, F).
Comparison of predictive accuracy for OS and RFS between nomograms and conventional staging systems
Nomogram was suggested to display a better accuracy than the conventional staging systems in predicting prognosis of tumors [5, 27, 28]. We compared the accuracy of our nomograms with the routinely clinically used prognostic models to ascertain whether our nomograms were feasible prognostic models. The C-indexes of nomograms for OS and RFS prediction accounted for the first and were superior to that of other prognostic predictors, as shown in Table 3. The nomograms showed better predictive accuracy (C-index, 0.796 and 0.714 for OS and RFS, respectively) than AJCC 7th edition (C-index, 0.628 and 0.575 for OS and RFS, respectively) and LCSGJ stage (C-index, 0.625 and 0.570 for OS and RFS, respectively) (Table 3).
Discriminatory capabilities of prognostic predictors in ICC patients using C-index for OS and RFS
| Training cohort | Validation cohort | Training cohort | Validation cohort | ||||||
|---|---|---|---|---|---|---|---|---|---|
| Variables | OS | OS | Variables | RFS | RFS | ||||
| C-index | 95%CI | C-index | 95%CI | C-index | 95%CI | C-index | 95%CI | ||
| Nomogram | 0.796 | 0.793-0.799 | 0.785 | 0.782-0.788 | Nomogram | 0.714 | 0.711-0.717 | 0.686 | 0.683-0.689 |
| Tumor size | 0.567 | 0.564-0.700 | 0.550 | 0.520-0.580 | CEA | 0.521 | 0.518-0.524 | 0.535 | 0.532-0.538 |
| Nanog | 0.687 | 0.684-0.690 | 0.751 | 0.748-0.754 | Nanog | 0.637 | 0.634-0.64 | 0.667 | 0.664-0.670 |
| Oct4 | 0.733 | 0.730-0.736 | 0.734 | 0.731-0.737 | Oct4 | 0.668 | 0.665-0.671 | 0.670 | 0.667-0.673 |
| AJCC 7th edition | 0.628 | 0.625-0.631 | 0.610 | 0.598-0.613 | AJCC 7th edition | 0.575 | 0.572-0.578 | 0.582 | 0.579-0.585 |
| LCSGJ stage | 0.625 | 0.622-0.628 | 0.606 | 0.603-0.609 | LCSGJ stage | 0.570 | 0.567-0.573 | 0.591 | 0.588-0.594 |
Abbreviations: OS, overall survival; RFS, recurrence-free survival; CEA, carcinoembryonic antigen;
AJCC, American Joint Committee on Cancer; LCSGJ, the Liver Cancer Study Group of Japan
The predictive accuracy of nomograms for OS and RFS were further verified in validation cohort, the C-indexes of the novel nomograms for OS and RFS were 0.785 and 0.686, respectively, which ranked the first in terms of AJCC 7th edition (C-index, 0.610 and 0.582 for OS and RFS, respectively) and LCSGJ stage (C-index, 0.606 and 0.591 for OS and RFS, respectively) (Table 3).
Comparison of clinical usefulness between nomograms and conventional staging systems by decision curve analysis
Decision curve analysis (DCA), a novel evaluation method that analyzed the clinical net benefit of prediction models [25]. Given that the proposed nomograms suggested superior predictive capabilities relative to AJCC 7th edition and LCSGJ stage in terms of C-index, a DCA analysis was needed to compare the constructed nomograms with AJCC 7th edition and LCSGJ stage to ascertain the clinical usefulness of nomograms. On DCA, our nomograms displayed obvious superior net benefit with wider range of threshold probability than either AJCC 7th edition or LCSGJ stage (Fig. 5 I-N and Fig. S 5 G-L).
Discussion
Oct4 and its downstream target gene Nanog express in the cancer stem-like cells and promote a more primitive and aggressive tumor phenotype [29]. Both Oct4 and Nanog were continuously detected in human embryonic carcinomas, breast cancer, gastric cancer, bladder cancer and positively participated in the tumorigenic process of these tumors [9, 13, 30]. Our previous study demonstrated that Oct4 and Nanog were co-expressed in HCC patients [9] and promoted CSC-like traits and EMT change via regulating Stat3/Snail pathway [17]. Our present findings were in agreement with our previous reports, confirming that co-expression of Oct4 and Nanog was responsible for high risk of tumor recurrence and poor outcomes in ICC patients.
Our results demonstrated that expression of Oct4 and Nanog was highly increased in ICC tumor tissues, which was consistent with previous findings [17]. The distribution of Oct4 and Nanog was in nucleus for embryonic stem cells and germ cell tumor [31, 32]. But, the expression of Oct4 and Nanog could also be detected in cytoplasm of cancer cells [33, 34]. Similarly, our study revealed Oct4 and Nanog was mainly located in cytoplasm. It had been generally considered that there were two main reasons for the mislocalization of transcription factors: dysfunction of nucleocytoplasmic transport and the cells at different cell cycles [35]. Our statistical analysis revealed there was no difference in prognosis between patients with positive nuclear expression and patients with positive cytoplasmic expression. Unfortunately, until now, the mechanism why Oct4 and Nanog can express in cytoplasm or nucleus of ICC cells was still unclear.
Then, we analyzed the relationship between Oct4 and Nanog and clinicopathological features, suggesting Oct4 expression was positively associated with Nanog expression, high expression of Oct4 and Nanog was dramatically associated with AJCC 7th edition and LCSGJ stage, thus implying a specific role of Oct4 and Nanog in poor prognosis of ICC patients. No matter in univariate or multivariate analysis, patients with high Oct4 level or Nanog expression were more prone to experience poor OS and RFS, in line with other previous studies [9, 30]. We therefore speculated high expression of Oct4 and Nanog represented the abundance of cancer stem-like cells in tumors that might account for, at least in part for ICC recurrence and bad prognosis. With the desire to verify this speculation, we explored the significance of combined Oct4 and Nanog expression in patient prognosis. As our results confirmed that more remarkable disparity between different groups was observed when Oct4 combined with Nanog, a high Oct4 and Nanog expression implied poorest OS and shortest RFS. Collectively, co-expression of Oct4 and Nanog may emerge as an independent predictive factor for prognosis of ICC patients, in consistent with our previous research in HCC [9].
Nomogram was reported to establish more reliable and effective model in prediction of prognosis of cancers compared with conventional staging systems [5]. Herein, our constructed prognostic nomograms integrated Oct4, Nanog for OS and RFS prediction were more superior than AJCC 7th edition and LCSGJ stage, in agreement with reports in other tumors, the superiority of nomogram was greater than traditional staging systems [36]. This suggested that if ICC patients had high expression of Oct4 and Nanog should be classified to be a high-risk population because of their possible poorer OS and RFS. Measures to early detect the expression of Oct4 and Nanog should be instituted.
Several limitations to the present study should be noted. Firstly, this was a retrospective study and all patients collected in training group and validated group were form a single institution of China, a multi-center samples for our validated group will be more convincing. Secondly, due to our study only focused on patients undergoing curative resection, whether the constructed nomograms can be applied to patients who receive non-surgical treatments remains to be determined. Thirdly, we did not explore the regulatory capability of Oct4 and Nanog in ICC cells, we will definitely conduct the further functional and mechanical research in the future.
Although these limitations, to best of our knowledge, we are the first to explore the prognostic role of Oct4 and Nanog in ICC patients. We firstly established the nomograms integrated Oct4 and Nanog to predict the prognosis of tumor patients and our nomogram displayed the superior predictive capabilities relative to AJCC 7th edition and LCSGJ stage. In conclusion, our results revealed Oct4 and Nanog were prognostic factors for OS and RFS of ICC patients. Our present research was supportive in suggesting that Oct4 and Nanog should be incorporated into ICC prognostic system to improve the discriminative ability. Accordingly, we should pay more attention to ICC patients with co-expression of Oct4 and Nanog for their high risk of poorer clinical outcomes after surgery.
Abbreviations
Cancer stem cells CSCs, Intrahepatic cholangiocarcinoma ICC, Immunohistochemistry IHC, Hepatocellular carcinoma HCC, Octamer-binding transcription factor 4 Oct4, American Joint Committee on Cancer AJCC; The Liver Cancer Study Group of Japan LCSGJ; Overall survival OS, Recurrence-free survival RFS, Concordance index C-index, Decision curve analysis DCA.
Supplementary Material
Supplementary figures and tables.
Acknowledgements
This research was supported by grants from the National Natural Science Foundation of China (81173391, 81302102, 81772510); National Key Sci-Tech Special Project of China (2012ZX10002010-001/002); Research Programs of Science and Technology Commission Foundation of Shanghai (13CG04, 16DZ0500300, 15ZR1406900); National Research Programs of Science and Technology Commission Foundation (2017YFC0908101); National Youth Foundation of China (81400768).
Ethical conduct of research
The authors state that they have followed the principles outlined in the Declaration of Helsinki for all human experimental investigations. Ethical approval was obtained from the Zhongshan Hospital Research Ethics Committee, and informed consent was obtained from each patient.
Consent for publication
Publication consent was obtained from all authors.
Competing Interests
The authors have declared that no competing interest exists.
References
1. Khan SA, Thomas HC, Davidson BR, Taylor-Robinson SD. Cholangiocarcinoma. Lancet. 2005;366:1303-14
2. West J, Wood H, Logan RF, Quinn M, Aithal GP. Trends in the incidence of primary liver and biliary tract cancers in England and Wales 1971-2001. British journal of cancer. 2006;94:1751-8
3. Aishima S, Oda Y. Pathogenesis and classification of intrahepatic cholangiocarcinoma: different characters of perihilar large duct type versus peripheral small duct type. Journal of hepato-biliary-pancreatic sciences. 2015;22:94-100
4. Hwang S, Lee YJ, Song GW. et al. Prognostic Impact of Tumor Growth Type on 7th AJCC Staging System for Intrahepatic Cholangiocarcinoma: a Single-Center Experience of 659 Cases. Journal of gastrointestinal surgery: official journal of the Society for Surgery of the Alimentary Tract. 2015;19:1291-304
5. Wang Y, Li J, Xia Y. et al. Prognostic nomogram for intrahepatic cholangiocarcinoma after partial hepatectomy. Journal of clinical oncology: official journal of the American Society of Clinical Oncology. 2013;31:1188-95
6. Ghiassi-Nejad Z, Tarchi P, Moshier E. et al. Prognostic Factors and Patterns of Locoregional Failure After Surgical Resection in Patients With Cholangiocarcinoma Without Adjuvant Radiation Therapy: Optimal Field Design for Adjuvant Radiation Therapy. International journal of radiation oncology, biology, physics. 2017;99:805-11
7. Fabris L, Cadamuro M, Moserle L. et al. Nuclear expression of S100A4 calcium-binding protein increases cholangiocarcinoma invasiveness and metastasization. Hepatology. 2011;54:890-9
8. Sheridan C, Kishimoto H, Fuchs RK. et al. CD44+/CD24- breast cancer cells exhibit enhanced invasive properties: an early step necessary for metastasis. Breast cancer research: BCR. 2006;8:R59
9. Yin X, Li YW, Zhang BH. et al. Coexpression of stemness factors Oct4 and Nanog predict liver resection. Annals of surgical oncology. 2012;19:2877-87
10. Nichols J, Zevnik B, Anastassiadis K. et al. Formation of pluripotent stem cells in the mammalian embryo depends on the POU transcription factor Oct4. Cell. 1998;95:379-91
11. Chambers I, Colby D, Robertson M. et al. Functional expression cloning of Nanog, a pluripotency sustaining factor in embryonic stem cells. Cell. 2003;113:643-55
12. Wang Z, Oron E, Nelson B, Razis S, Ivanova N. Distinct lineage specification roles for NANOG, OCT4, and SOX2 in human embryonic stem cells. Cell stem cell. 2012;10:440-54
13. Yong X, Tang B, Xiao YF. et al. Helicobacter pylori upregulates Nanog and Oct4 via Wnt/beta-catenin signaling pathway to promote cancer stem cell-like properties in human gastric cancer. Cancer letters. 2016;374:292-303
14. Dahan P, Martinez Gala J, Delmas C. et al. Ionizing radiations sustain glioblastoma cell dedifferentiation to a stem-like phenotype through survivin: possible involvement in radioresistance. Cell death & disease. 2014;5:e1543
15. Ben-Porath I, Thomson MW, Carey VJ. et al. An embryonic stem cell-like gene expression signature in poorly differentiated aggressive human tumors. Nature genetics. 2008;40:499-507
16. Hollier BG, Evans K, Mani SA. The epithelial-to-mesenchymal transition and cancer stem cells: a coalition against cancer therapies. Journal of mammary gland biology and neoplasia. 2009;14:29-43
17. Yin X, Zhang BH, Zheng SS. et al. Coexpression of gene Oct4 and Nanog initiates stem cell characteristics in hepatocellular carcinoma and promotes epithelial-mesenchymal transition through activation of Stat3/Snail signaling. Journal of hematology & oncology. 2015;8:23
18. Balachandran VP, Gonen M, Smith JJ, DeMatteo RP. Nomograms in oncology: more than meets the eye. The Lancet Oncology. 2015;16:e173-80
19. Huang XY, Ke AW, Shi GM. et al. Overexpression of CD151 as an adverse marker for intrahepatic cholangiocarcinoma patients. Cancer. 2010;116:5440-51
20. Yamasaki S. Intrahepatic cholangiocarcinoma: macroscopic type and stage classification. Journal of hepato-biliary-pancreatic surgery. 2003;10:288-91
21. Yin X, Zheng SS, Zhang BH. et al. Elevation of serum gamma-glutamyltransferase as a predictor of aggressive tumor behaviors and unfavorable prognosis in patients with intrahepatic cholangiocarcinoma: analysis of a large monocenter study. European journal of gastroenterology & hepatology. 2013;25:1408-14
22. Torhorst J, Bucher C, Kononen J. et al. Tissue microarrays for rapid linking of molecular changes to clinical endpoints. The American journal of pathology. 2001;159:2249-56
23. Gao Q, Wang XY, Qiu SJ. et al. Overexpression of PD-L1 significantly associates with tumor aggressiveness and postoperative recurrence in human hepatocellular carcinoma. Clinical cancer research: an official journal of the American Association for Cancer Research. 2009;15:971-9
24. Liu L, Lin C, Liang W. et al. TBL1XR1 promotes lymphangiogenesis and lymphatic metastasis in esophageal squamous cell carcinoma. Gut. 2015;64:26-36
25. Vickers AJ, Elkin EB. Decision curve analysis: a novel method for evaluating prediction models. Medical decision making: an international journal of the Society for Medical Decision Making. 2006;26:565-74
26. Huitzil-Melendez FD, Capanu M, O'Reilly EM. et al. Advanced hepatocellular carcinoma: which staging systems best predict prognosis? Journal of clinical oncology: official journal of the American Society of Clinical Oncology. 2010;28:2889-95
27. Sternberg CN. Are nomograms better than currently available stage groupings for bladder cancer? Journal of clinical oncology: official journal of the American Society of Clinical Oncology. 2006;24:3819-20
28. Touijer K, Scardino PT. Nomograms for staging, prognosis, and predicting treatment outcomes. Cancer. 2009;115:3107-11
29. Gidekel S, Pizov G, Bergman Y, Pikarsky E. Oct-3/4 is a dose-dependent oncogenic fate determinant. Cancer cell. 2003;4:361-70
30. Wang D, Lu P, Zhang H. et al. Oct-4 and Nanog promote the epithelial-mesenchymal transition of breast cancer stem cells and are associated with poor prognosis in breast cancer patients. Oncotarget. 2014;5:10803-15
31. Santagata S, Ligon KL, Hornick JL. Embryonic stem cell transcription factor signatures in the diagnosis of primary and metastatic germ cell tumors. The American journal of surgical pathology. 2007;31:836-45
32. Boyer LA, Lee TI, Cole MF. et al. Core transcriptional regulatory circuitry in human embryonic stem cells. Cell. 2005;122:947-56
33. Meng HM, Zheng P, Wang XY. et al. Over-expression of Nanog predicts tumor progression and poor prognosis in colorectal cancer. Cancer biology & therapy. 2010;9:295-302
34. Ezeh UI, Turek PJ, Reijo RA, Clark AT. Human embryonic stem cell genes OCT4, NANOG, STELLAR, and GDF3 are expressed in both seminoma and breast carcinoma. Cancer. 2005;104:2255-65
35. Ohno M, Fornerod M, Mattaj IW. Nucleocytoplasmic transport: the last 200 nanometers. Cell. 1998;92:327-36
36. Fu YP, Yi Y, Huang JL. et al. Prognostic Nomograms Stratify Survival of Patients with Hepatocellular Carcinoma Without Portal Vein Tumor Thrombosis After Curative Resection. The oncologist. 2017;22:561-9
Author contact
![]() Corresponding authors: Bo-heng Zhang, Shuang-jian Qiu, The Liver Cancer Institute, Zhongshan Hospital and Shanghai Medical School, Fudan University, 180 Fenglin Road, Shanghai 200032, P. R. China. Phone & Fax: +86-21-64037181; E-mail: zhang.bohengsh.cn. Phone & Fax: +86-21-64037181; E-mail: qiu.shuangjiansh.cn
Corresponding authors: Bo-heng Zhang, Shuang-jian Qiu, The Liver Cancer Institute, Zhongshan Hospital and Shanghai Medical School, Fudan University, 180 Fenglin Road, Shanghai 200032, P. R. China. Phone & Fax: +86-21-64037181; E-mail: zhang.bohengsh.cn. Phone & Fax: +86-21-64037181; E-mail: qiu.shuangjiansh.cn