Impact Factor ISSN: 1837-9664

 Global reach, higher impact
J Cancer 2019; 10(5):1237-1251. doi:10.7150/jca.28662 This issue Cite
Research Paper
Overexpression of FZD1 is Associated with a Good Prognosis and Resistance of Sunitinib in Clear Cell Renal Cell Carcinoma
Qiang Peng1,2*, Lu Wang1,2*, Danfeng Zhao1,2*, Yulin Lv1, Hongzhi Wang1, Guang Chen1, Jiaqi Wang1,2, Wanhai Xu1,2 ![]()
1. Department of Urology, the Fourth Hospital of Harbin Medical University, Harbin Medical University, Harbin, P. R. China.
2. Heilongjiang Key Laboratory of Scientific Research in Urology, Harbin, P. R. China.
*These authors contributed equally to this work.
Received 2018-7-21; Accepted 2019-1-2; Published 2019-1-29
Abstract
Frizzled class receptor 1 (FZD1), a receptor for Wnt signaling pathway. Overexpression of FZD1 has been detected in many cancer tissues and cells resulting in tumor development and drug resistance. However, its expression status and prognostic merit in renal cancer still remains unclear. We screened the FZD1 mRNA in clear cell renal cell carcinoma (ccRCC) and papillary renal cell carcinoma (pRCC) from TCGA database and Oncomine database. We then detected FZD1 mRNA expression in sunitinib-resistant cells and the corresponding parental cells by qRT-PCR. FZD1 level was significantly upregulated in renal cancer tissues, renal cancer cell lines and their corresponding sunitinib-resistant cells. FZD1 level was also associated with the clinicopathological characteristics of ccRCC patients that could discriminate metastasis, pathological stage, recurrence and prognosis in ccRCC patients. The Kaplan-Meier survival curve and the log-rank test revealed FZD1 was higher in lower clinical stage and grade that correlated with better overall survival (OS) and disease-free survival (DFS) in total and subgroups of ccRCC patients. Both univariate and multivariate cox regression analysis indicated that high FZD1 level was an independent predictor of good prognosis for OS (HR 0.569, P=0.001) and DFS (HR 0.559, P=0.036) in ccRCC patients. Using cBioportal program, less than 1% mutation in the patients with renal cancer was observed, the alterations in FZD1 were correlated with better OS (P=0.0404) in ccRCC patients. Finally, the result of KEGG pathway analysis predicted seven potential pathways that FZD1 and its related genes got involved in ccRCC, including Hippo signaling pathway. This indicated potential therapeutic targets of ccRCC. In conclusion, our results suggested that expression status of FZD1 had a diagnostic value and prognostic value in ccRCC patients, it also may serve as a potential drug target to relieve sunitinib resistance in renal cancer patients.
Keywords: FZD1, clear cell renal cell carcinoma, drug-resistance, papillary renal cell carcinoma, prognosis
Introduction
Renal cancer causes more than 140,000 deaths per year, and is the seventh most common cancer in the world [1]. Annually, ~295,000 new kidney cancer cases are diagnosed and ~134,000 deaths are recorded worldwide [2, 3]. Approximately 70% to 80% of all renal cell carcinoma (RCC) histological subtype is ccRCC, while pRCC accounts for 10% to 15% of all RCC [4]. Localized RCC can be treated with active surveillance [5], ablation [6] and partial or radical nephrectomy [7], but varied greatly in the outcome. As 29.1% patients had died with a median of 1.9 years after surgery, also 10-year cancer specific survival rate was only 12%~36% for patients with advanced tumor [8], thus require systemic therapies. Targeted therapies against vascular endothelial growth factor (VEGF) and mammalian target of rapamycin (mTOR) pathways have been developed, but treatment response is varied and most patients eventually progress [9]. Sunitinib is a broad-spectrum small-molecule inhibitor of receptor tyrosine kinases (RTK) that serves as the present standard of care for first-line therapy of advanced ccRCC. Though there is a trend towards improved survival for an unselected RCC patients treated with targeted therapies [10], not all patients respond to sunitinib, and the vast majority eventually develop resistance to sunitinib therapy [11]. Recent research showed that cytoplasmic expression of annexin A1 (ANXA1) got involved in sunitinib resistance, it can serve as a negative predictive marker for sunitinib therapy in RCC patients [12]. Another study also found that solute carrier family 10 member 2 (SLC10A2) was decreased in sunitinib-resistant ccRCC, and was identified as an independent prognostic factor of overall survival of ccRCC [13], but the exact mechanisms of resistance to sunitinib therapy are still poorly understood. In ccRCC, the VHL tumour suppressor gene is the most frequently mutated gene [14], but VHL loss alone is insufficient to induce ccRCC, which requires additional genetic events such as mutations in other tumor suppressor genes or oncogenes [15,16]. A previous report that ccRCC patients even within the same tumor stage may have different clinical features because mutation or dysregulation of different genes [17]. Hence, there is an urgent need to identify new mutated genes that are involved in the pathogenesis of ccRCC, which help identify clinic patients and drug resistance of ccRCC that improve accuracy of outcome prediction.
FZD1, belongs to the 'frizzled' gene family. It encodes 7-transmembrane domain proteins that are receptors for Wnt signaling proteins [18]. Wnt ligands bind to FZD receptors to trigger the activation of the canonical Wnt/β-catenin signaling pathway or the non-canonical Wnt/ Ca2+ or Wnt/planar cell polarity signaling cascades [19]. The overexpression of FZDs and activation of the Wnt signaling pathway resulting in cell growth, invasion, metastasis and chemoresistance [20]. A previous research uncovered sunitinib's actions on the brain tumor microenvironment impedes brain tumor progression [21]. FZD1 could also get involved in cellular microenvironment in the regulation of cell proliferation [22]. There was a report that FZD1 expression in the tumor microenvironment had a gradient effect may modulate colon cancer progression and dissemination, representing a new therapeutic target for patients with colon cancer [23]. FZD1 is involved in the Wnt/β-catenin pathway and abnormally expressed in various cancers [24-27], it can also mediate drug resistance in neuroblastoma [28], acute myeloid leukemia [29] and breast cancer [30]. Though the important role of FZD1 in tumor development and drug resistance, its expression status and prognostic merit in renal cancer still remains unclear. We carried out this research to explore its relationship within renal cancer patients, especially in ccRCC patients.
In this study, we focus on FZD1 expression in renal cancer, especially in ccRCC. FZD1 was significantly upregulated in cancer tissues, renal cancer cell lines and their corresponding sunitinib-resistant cell lines. FZD1 was higher in lower clinical stage and grade that correlated with better OS and DFS in total and subgroups of ccRCC patients. Furthermore, we analyzed the prognostic significance of FZD1 by using independent ways and multiple approaches, displayed the mutation information of FZD1 in ccRCC, and predicted the potential pathways of FZD1 involved in ccRCC to comprehend the mechanism comprehensively.
Materials and Methods
Cell culture and establishment of sunitinib-resistant cell lines
The human RCC cell lines 786-O (primary clear cell adenocarcinoma), OS-RC-2 (renal cell adenocarcinoma), Caki-1 (metastatic clear cell renal cell carcinoma), ACHN (metastatic papillary renal cell), HK-2 (normal kidney cell) were obtained from the Shanghai Institutes for Biological Sciences. The cell lines 786-O, OS-RC-2, Caki-1 and HK-2 were cultured in RPMI 1640. ACNH cells were maintained in DMEM medium. Cells were cultured and supplemented with 10% fetal bovine serum (FBS) in a humidified atmosphere of 5% CO2 maintained at 37°C. 786-O and OS-RC-2 cells were plated in 10-cm petri dish with PRIM 1640 medium with 10% FBS, grown to 50% confluence and incubated overnight for attachment. The cells were then exposed to sunitinib-containing media. The sunitinib concentration and exposure time were adjusted depending on the tolerance of the cells. Cells were exposed to sunitinib for 2~3 days and then replaced with fresh media without sunitinib for 24h. Cells that showed proliferation at a specific sunitinib concentration were digested and exposed to a higher concentration (0.5μmol higher than the previous concentration). If the increased concentration was not tolerated, the cells were maintained in media with an identical or lower sunitinib concentration. The sunitinib on-off exposure cycle was maintained until the cells could proliferate in the presence of the target concentration. The final IC50 value of 786-OR was 8.811 μmol/L, and 8.911 uM/L for OS-RC-2R. Cells were frozen at each cycle. CCK8 was used to assay the viability of sunitinib-resistant cell lines and the parental cell lines. Cells were seeded onto 96-well plates at a density of 4 × 10³ cells per well in media with 10% FBS and allowed to attach for 24 h. Sunitinib was added at different concentrations. After 48 h of treatment, CCK-8 reagent (Sigma-aldrich St Louis, MO) was added to cells (1:10 ratio) in each well and allowed to incubate at 37°C in a humid atmosphere with 5% CO2 for 1~2h. After that, plate was read at 450 nm using an Epoch spectrophotometer (BioTek Winooski, VT).
RNA extraction and quantitative real-time PCR
RNA isolation and qRT-PCR Total RNA was extracted using Trizol (Invitrogen, USA) according to the manufacturer's instructions. One microgram of total RNA from each sample was reverse transcribed into complementary DNA (cDNA) using the RNA PCR Kit (Takara Biotechnology, Japan). Then qRT-PCR was performed to quantify the expression level of FZD1 with SYBR Green PCR Master Mix (Applied Biosystems) according to the manufacturer's instructions. FZD1 expression was normalized to β-actin and calculated using the comparative Ct method.
ONCOMINE analysis
ONCOMINE gene expression array datasets (www.oncomine.org), an online cancer microarray database [31] was used to analyze the transcription levels of FZD1 in ccRCC and pRCC. The mRNA levels of FZD1 in clinical cancer specimens were compared with that in normal controls, using a Student' T-test to generate a p value. The cut-off of p value and fold change were defined as 0.001 and 2, respectively.
TCGA data and cBioPortal
The Cancer Genome Atlas (TCGA) had both sequencing and pathological data on 30 different cancers. Gene expression data by RNA-seq for cohorts of 530 ccRCC and 288 pRCC cases that have clinical outcome data available were extracted from TCGA. Clinical information for each patient including survival status, recurrence status, time to last follow-up, and other clinicopathological characteristics were also extracted from TCGA. Patients were divided into “high” and “low” groups based on the median value of FZD1 mRNA. Using cBioPortal, the ccRCC (TCGA, Provisional) dataset was selected for further analyses of FZD1 (www.cbioportal.org) [32, 33]. OS and DFS were calculated according to the cBioPortal's online instruction. The database query was based on mutation and altered expression of the FZD1 in ccRCC (U Tokyo, Nat Genet 2013; TCGA, Nature 2013; TCGA, Provisional), pRCC (TCGA, Provisional) and nccRCC (Genentech, Nat Genet 2014).
COSMIC analysis for mutations
Catalogue of Somatic Mutations in Cancer (COSMIC) database (http://www.sanger.ac.uk/cosmic/) was utilized for assessment of FZD1 mutations in ccRCC [34]. Pie charts were generated for a distribution overview in ccRCC.
David and KEGG analysis of FZD1 and its related genes in ccRCC
cBioportal programs were performed to identify FZD1 related genes. A total of 100 related genes (with the highest expression correlation with FZD1 in ccRCC, only gene pairs with values > 0.3 or < -0.3 in both pearson correlations and spearman correlations were obtained) were input into DAVID Database (http://david.abcc.ncifcrf.gov/) and the Kyoto Encyclopedia of Genes and Genomes (KEGG) for Gene Ontology (GO) or pathway enrichment analysis. The enrichment of related genes in three major GO classifications, that is, cell components (CC), biological processes (BP) and molecular functions (MF). KEGG pathway analysis was carried out to analyze the significant pathways that FZD1 and its related genes got involved in ccRCC. A network graph was generated via the cytoscape software, directly demonstrating the association of these genes with FZD1. The nodes in the network represented the related genes and different colors of the nodes represented positive or negative correlation with FZD1.
Statistical analysis
Statistical analysis was performed using SPSS 23.0 software. The data of four groups were analyzed by ANOVA analysis and the data of two groups were analyzed by T-test. Receiver operator characteristic (ROC) curve and area under the curve (AUC) analyses were applied to detect the optimal cutoff point that yielded the highest total accuracy with respect to discriminate different clinical classifications, good and poor prognosis, recurrence and non-recurrence respectively. The Kaplan-Meier (KM) curve was generated to evaluate the association between the expression level of FZD1 and the survival rate with log-rank test. Univariate and multivariate Cox proportional hazard regression analyses were used to estimate the prognostic significance of FZD1 in RCC. Statistical significance was set at two-tailed, p <0.05.
Results
The transcription levels of FZD1 in renal cancer tissues and renal cancer cell lines
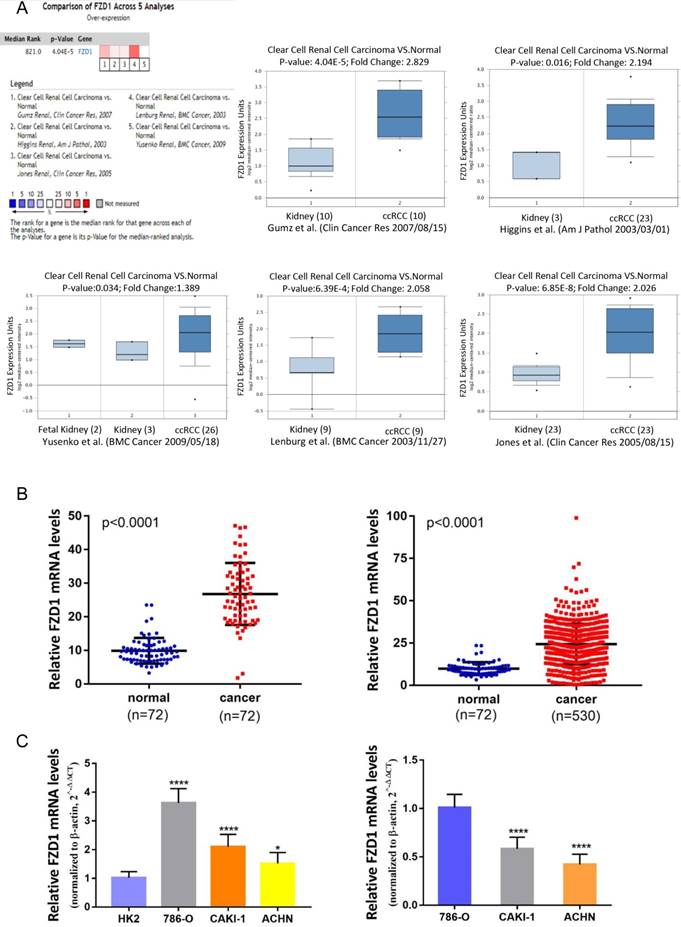
Based on the Oncomine database, we discovered that FZD1 expression was significant elevated in renal cancer tissues compared with normal tissues in the datasets (Figure 1A). As for ccRCC samples, five cases of datasets summary found that FZD1 mRNA levels were upregulated in cancer tissues (P<0.0001). In Gumz's dataset, FZD1 was upregulated in ccRCC tissues compared with normal tissues (fold change= 2.829; P<0.0001), and we got similar results in other four datasets (P=0.016, P=0.034, P<0.0001 and P<0.0001, respectively). We also obtained FZD1 mRNA expression in ccRCC tissues and normal tissues from TCGA database, the FZD1 expression level was significantly upregulated in ccRCC tissues compared with normal and paired non-cancerous tissues (normal vs. cancer, both P<0.0001; Figure 1B). To further confirm the results of TCGA and Oncomine database, we tested FZD1 mRNA in renal cancer cells by qRT-PCR. The results showed that FZD1 level in renal cancer cells was significantly higher than normal kidney cells (Figure 1C). We next classified the renal cancer cell lines into primary and metastatic subtypes, FZD1 expression level in different renal cancer cell subtypes was obtained from real-time PCR, the FZD1 expression was higher in primary renal cancer cell lines (786-O) than metastatic renal cancer cell lines (CAKI-1, ACHN) (Figure 1C). As for pRCC, FZD1 level was also upregulated in pRCC tissues compared with normal and paired non-cancerous tissues (both P<0.0001; Fig. S1A-B).
The transcription levels of FZD1 in ccRCC patients and renal cancer cell lines. A, The mRNA levels of FZD1 were significant elevated in ccRCC tissues compared with normal tissues in five microarray datasets based on the Oncomine database. Data are presented as Log2 median-centered intensity. B, FZD1 expression was significantly upregulated in ccRCC tissues compared with normal and paired non-cancerous tissues based on the TCGA database. C, qRT-PCR analysis of FZD1 levels in primary and metastatic renal cancer cells as well as normal kidney cells. The error bars represent mean ± SD of three independent experiments. Data differences were tested with Student's T-test (***, p<0.001, **, p<0.01, *, p<0.05, NS, no significance).
The relationship between mRNA levels of FZD1 and clinicopathological characteristics in ccRCC patients
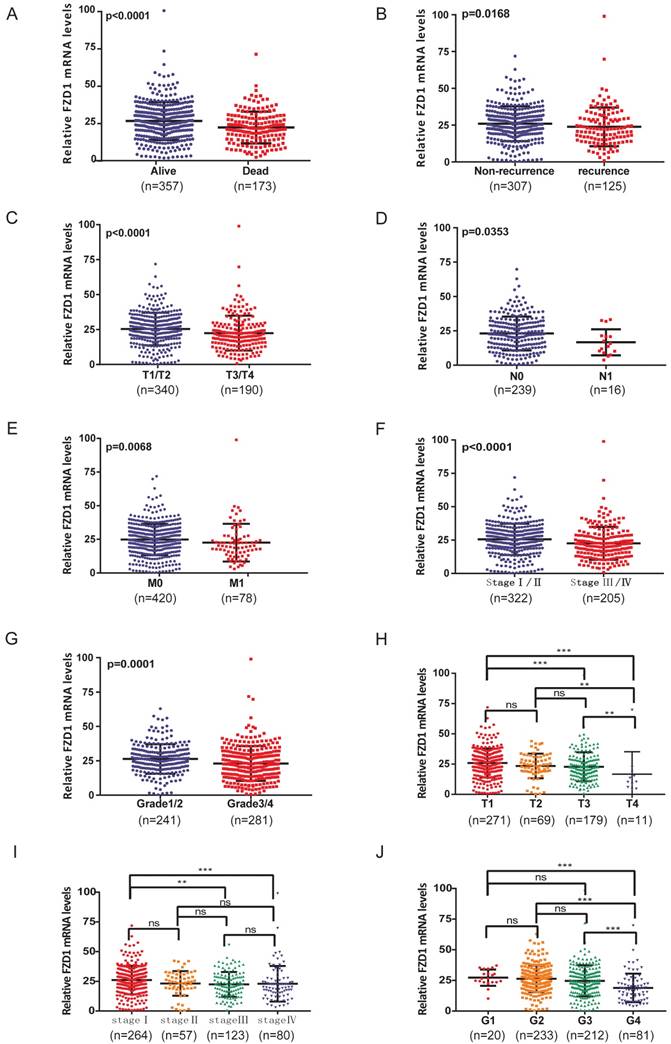
According to above findings, we wondered if FZD1 level could further stratify the ccRCC patients according to various clinicopathological characteristics (Table 1). The FZD1 level was higher in living compared with dead patients (P<0.0001; Figure 2A), it also show significantly upregulated in patients without recurrence (P=0.0168; Figure 2B). Overexpression of FZD1 significantly correlated with lower T stage (P<0.0001; Figure 2C), negative lymph node metastasis (P=0.0353; Figure 2D), negative distant metastasis (P=0.0068; Figure 2E), pathological stage (P<0.0001; Figure 2F), Grade stage (P=0.0001; Figure 2G) in ccRCC patients. However, the expression of FZD1 was not associated with age, race, ethnicity, neoadjuvant treatment, laterality and hemoglobin level (data not shown). The FZD1 mRNA level was negatively correlated with the size and weight of tumors (one-way ANOVA, P<0.0001 and P=0.0006, separately; Figure 2H-I). It also decreased and negatively correlated with the grade of tumors (one-way ANOVA, P<0.0001; Figure 2J). We also explored the association between FZD1 expression and clinicopathological characteristics in pRCC, FZD1 expression was higher in pRCC with lower T stage, negative lymph node metastasis status and pathological stage (P<0.05; Fig. S1C-F). These data indicated that FZD1 expression was associated with various clinicopathological characteristics and can be a potential prognostic biomarker for ccRCC patients.
The relationship between FZD1 mRNA expression and clinicopathological characteristics in ccRCC patients
| Parameter | No.pts | FZD1 expression (No.) | P value | |
|---|---|---|---|---|
| Low (n=265) | High (n=265) | |||
| Age (years) | 61 (52-70) | 60(51.5-69) | 61(52-72) | 0.273 |
| Age (years) | ||||
| <60 | 245 | 131 | 114 | 0.139 |
| ≥60 | 285 | 134 | 151 | |
| Gender | ||||
| Female | 186 | 76 | 110 | 0.002 |
| Male | 344 | 189 | 155 | |
| Race | ||||
| White | 459 | 227 | 232 | 0.478 |
| Asian | 8 | 4 | 4 | |
| Black † | 56 | 32 | 24 | |
| Unknown | 7 | 2 | 5 | |
| Pathological stage | ||||
| Stage I | 265 | 109 | 156 | <0.001 |
| Stage II | 57 | 26 | 31 | |
| Stage III | 123 | 72 | 51 | |
| Stage IV | 82 | 55 | 27 | |
| Unknown | 3 | 3 | 0 | |
| T stage | ||||
| T1 | 271 | 113 | 158 | <0.001 |
| T2 | 69 | 34 | 35 | |
| T3 | 179 | 108 | 71 | |
| T4 | 11 | 10 | 1 | |
| N stage | ||||
| N0 | 239 | 121 | 118 | 0.032 |
| N1 | 16 | 13 | 3 | |
| Unknown | 275 | 131 | 144 | |
| M stage | ||||
| M0 | 420 | 195 | 225 | 0.004 |
| M1 | 78 | 52 | 26 | |
| Unknown | 32 | 18 | 14 | |
| Grade stage | ||||
| G1 | 14 | 3 | 11 | <0.001 |
| G2 | 227 | 95 | 132 | |
| G3 | 206 | 104 | 102 | |
| G4 | 75 | 57 | 18 | |
| Unknown | 8 | 6 | 2 | |
| Ethnicity | ||||
| Not hispanic ‡ | 353 | 185 | 168 | 0.279 |
| Hispanic § | 26 | 11 | 15 | |
| Unknown | 151 | 69 | 82 | |
| Neo treatment ¶ | ||||
| No | 513 | 255 | 258 | 0.46 |
| Yes | 17 | 10 | 7 | |
| Laterality | ||||
| Right | 280 | 142 | 138 | 0.579 |
| Left | 249 | 123 | 126 | |
| Bilateral | 1 | 0 | 1 | |
| Serum calcium level | ||||
| Low | 203 | 94 | 109 | 0.002 |
| Normal | 150 | 91 | 59 | |
| Elevated | 10 | 8 | 2 | |
| Unknown | 167 | 72 | 95 | |
| Hemoglobin level | ||||
| Low | 261 | 144 | 117 | 0.131 |
| Normal | 184 | 84 | 100 | |
| Elevated | 5 | 2 | 3 | |
| Unknown | 80 | 35 | 45 | |
| Survival Status | ||||
| Alive | 357 | 153 | 204 | <0.001 |
| Dead | 173 | 112 | 61 | |
| Recurrence Status | ||||
| No | 130 | 177 | 307 | <0.001 |
| Yes | 71 | 54 | 125 | |
| Unknown | 64 | 34 | 98 | |
† Black or african American; ‡ Not hispanic or latino; § Hispanic or latino; ¶ Neoadjuvant treatment
ccRCC: clear cell renal cell carcinoma
The relationship between mRNA levels of FZD1 and clinicopathological characteristics in ccRCC patients. High levels of FZD1 mRNA predicted good prognosis of ccRCC patients. The mRNA levels of FZD1 was compared in different clinicopathological characteristics: (A) living status, (B) recurrence status, (C) T stage, (D) N stage, (E) metastasis status, (F) TNM stage, (G) grade stage. (H-J) The FZD1 mRNA level was negatively correlated with the size and weight of tumors as well as negatively correlated with the grade of tumors. Data differences were tested with one-way ANOVA or Student's T-test (***, p<0.001, **, p<0.01, *, p<0.05).
The association between FZD1 expression and diagnostic value in ccRCC patients
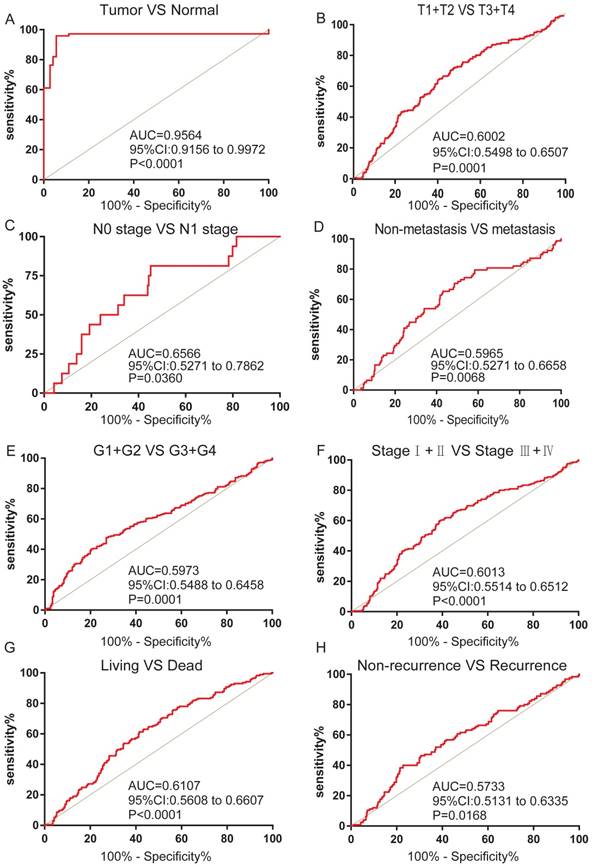
We next analyzed the ROC curves for clinicopathological characteristics to explore the diagnostic value of FZD1 in ccRCC patients. FZD1 mRNA could effectively differentiate ccRCC from para-cancer tissues yielding an area under curve (AUC) of 0.9564 (95%CI: 0.9156 to 0.9972; P<0.0001) with a sensitivity of 79.43% and a specificity of 94.45% when cutoff value was 15.13 (Figure 3A). We next analyzed the expression of FZD1 mRNA in subgroups of ccRCC patients. High FZD1 level could be a potential diagnostic indicator for ccRCC patients with (T1+T2)/(T3+T4) stage (AUC=0.6002, P=0.0001), N0/N1 stage (AUC=0.6566, P=0.0360), Non-metastasis/metastasis (AUC=0.5965, P=0.0068), (G1+G2)/(G3+G4) stage (AUC=0.5973, P=0.0001), (Ⅰ+Ⅱ)/(Ⅲ+Ⅳ) stage (AUC=0.6013, P<0.0001), OS status (AUC=0.6107, P<0.0001) and DFS status (AUC=0.5733, P=0.0168) (Figure 3B-H).
FZD1 expression served as a diagnostic indicator in ccRCC patients. ROC curve showed that FZD1 could effectively distinguish ccRCC from (A) paired non-cancerous tissues, and ROC curve analysis towards the expression of FZD1 mRNA in subgroups of ccRCC patients against (B) T stage, (C) TNM stage, (D) metastasis status, (E) G stage, (F) N stage, (G) OS status and (H) recurrence status.
The correlation between high FZD1 expression and good OS in total and subgroups of ccRCC patients
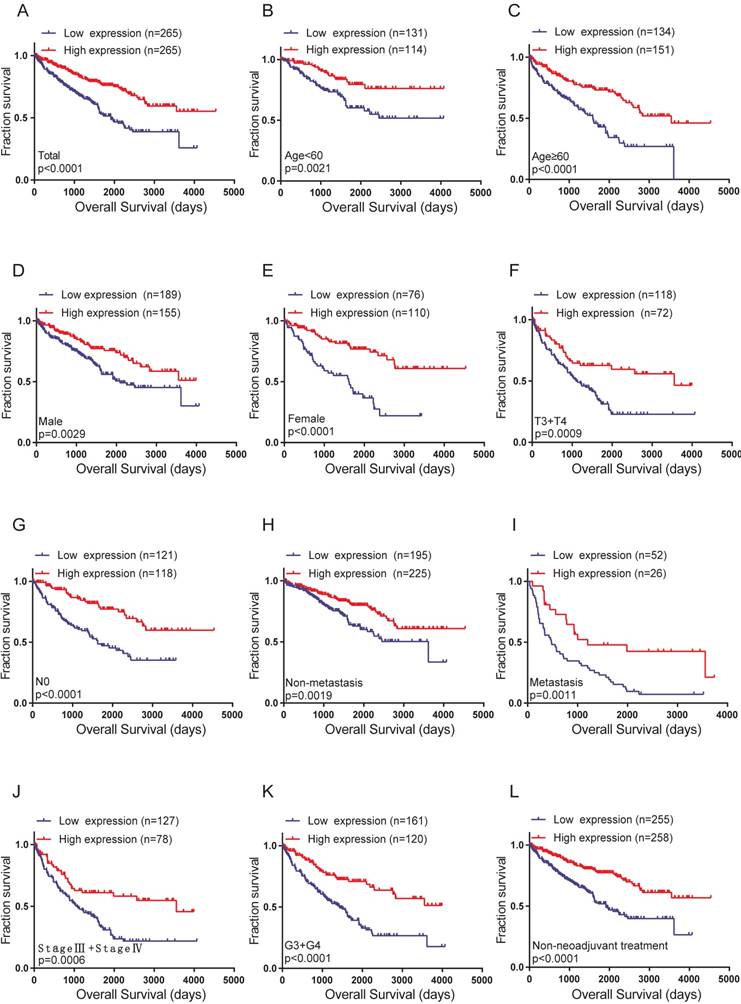
The Kaplan-Meier curve and log-rank test analyses revealed that FZD1 overexpression was significant associated with better OS in all ccRCC patients (log-rank test, P<0.0001; Figure 4A). We then examined OS survival analysis towards the expression of FZD1 mRNA in subgroups of ccRCC patients (Figure 4B-L). Our results showed that upregulated FZD1 level could be a potential prognostic factor for ccRCC patients with Age<60 years (P=0.0021), Age≥60 years (P<0.0001), Female (P<0.0001), Male (P=0.0029), T3+T4 stage (P=0.0009), N0 stage (P<0.0001), Non-metastasis (P=0.0019), Metastasis (P=0.0011), Pathological (Ⅲ+Ⅳ) stage (P=0.0006), G3+G4 stage (P<0.0001) and Non-neoadjuvant treatment (P<0.0001), which all were significantly related to better OS. However, high FZD1 level had no significant correlation with OS in ccRCC patients with T1+T2 stage, N1 stage, Pathological (Ⅰ+Ⅱ) stage, G1+G2 stage, Neoadjuvant treatment group (Fig. S2A-E).
High levels of FZD1 mRNA predicted good overall survival in ccRCC patients. The correlation between FZD1 expression and overall survival time of (A) total ccRCC patients and different subgroups of ccRCC patients (B-L). OS curve for: (B) Age<60 years, (C) Age≥60 years, (D) Male, (E) Female, (F) T3+T4 stage, (G) N0 stage, (H) Non metastasis status, (I) metastasis status, (J) TNM (Ⅲ+Ⅳ), (K) G3+G4 stage and (L) Non-neoadjuvant treatment. The ccRCC patients from TCGA-KIRC database were classified into high or low FZD1 expression groups according to median expression level.
The correlation between high FZD1 expression and good DFS in total and subgroups of ccRCC patients
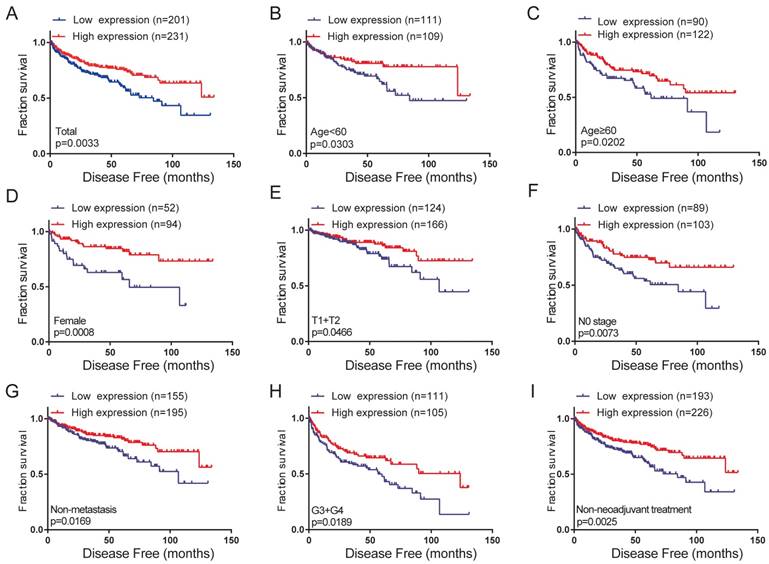
To further probe into the correlation of FZD1 mRNA expression and DFS time in ccRCC patients. Their relationship was analyzed with Kaplan-Meier survival plots. High expression of FZD1 had better DFS than low FZD1 expression group (log-rank test, P=0.0033; Figure 5A). We then examined DFS survival analysis towards the expression of FZD1 mRNA in subgroups of ccRCC patients (Figure 5B-I). Upregulated FZD1 level could be a potential prognostic factor for ccRCC patients with Age<60 years (P=0.0303), Age≥60 years (P=0.0202), Female (P=0.0008), T1+T2 stage (P=0.0466), N0 stage (P=0.0073), Non-metastasis (P=0.0169), G3+G4 stage (P=0.0189), Non-neoadjuvant treatment group (P=0.0025). However, high FZD1 level had no significant correlation with DFS in ccRCC patients with male, T3+T4 stage, N1 stage, Metastasis status, Pathological (Ⅰ+Ⅱ) stage, Pathological (Ⅲ+Ⅳ) stage, G1+G2 stage, Neoadjuvant treatment group (Fig. S3A-H).
High levels of FZD1 mRNA predicted good disease-free survival in ccRCC patients. The correlation between FZD1 expression and disease-free survival time of (A) total ccRCC patients and different subgroups of ccRCC patients (B-I). DFS curve for: (B) Age<60 years, (C) Age≥60 years, (D) Female, (E) T1+T2 stage, (F) N0 stage, (G) non-metastasis status, (H) G3+G4 stage and (I) Non-neoadjuvant treatment. The ccRCC patients from TCGA-KIRC database were classified into high or low FZD1 expression groups according to median expression level.
FZD1 was an independent prognostic marker for ccRCC patients
We also used univariate and multivariate Cox regression to analyze OS and DFS in the cohort of ccRCC patients. Univariate analysis indicated that FZD1 expression was identified as a prognostic factor for OS in the ccRCC patients (HR 0.45; P<0.001). Multivariate analysis showed that FZD1 overexpression was an independent predictor of good prognosis for OS in ccRCC patients (HR 0.569; P=0.001). Patients with larger, advanced stage tumor, elderly patients (≥60 years of age), not hispanic or latino and abnormal hemoglobin level had worse OS (Table 2).
Univariate and Multivariate analyses of FZD1 mRNA level and ccRCC patient overall survival
| Variable | Univariate cox regression | Multivariate cox regression | ||
|---|---|---|---|---|
| HR (95%CI) | P value | HR (95%CI) | P value | |
| Age (years) | <0.001 | 0.004 | ||
| <60 | Reference | Reference | ||
| ≥60 | 1.781(1.3-2.439) | 1.609(1.16-2.233) | ||
| Gender | 0.76 | |||
| Female | Reference | |||
| Male | 0.953(0.699-1.299) | |||
| Race | ||||
| White | Reference | |||
| Asian | 0.54(0.075-3.867) | 0.54 | ||
| Black† | 0.893(0.484-1.649) | 0.718 | ||
| Unknown | 0.954(0.236-3.851) | 0.947 | ||
| Pathological stage | ||||
| Stage I | Reference | Reference | ||
| Stage II | 1.204(0.648-2.235) | 0.557 | 2.36(0.61-9.126) | 0.214 |
| Stage III | 2.638(1.756-3.965) | <0.001 | 4.997(1.719-14.529) | 0.003 |
| Stage IV | 6.53(4.455-9.569) | <0.001 | 14.957(2.976-75.167) | 0.001 |
| Unknown | 7.293(0.994-53.489) | 0.051 | 15.877(1.332-189.198) | 0.029 |
| T stage | ||||
| T1 | Reference | Reference | ||
| T2 | 1.506(0.903-2.512) | 0.117 | 0.426(0.127-1.425) | 0.166 |
| T3 | 3.271(2.314-4.625) | <0.001 | 0.351(0.13-0.952) | 0.04 |
| T4 | 10.558(5.33-20.913) | <0.001 | 0.261(0.073-0.931) | 0.038 |
| N stage | ||||
| N0 | Reference | Reference | ||
| N1 | 3.523(1.873-6.628) | <0.001 | 1.319(0.555-3.136) | 0.531 |
| Unknown | 0.829(0.609-1.128) | 0.233 | 0.787(0.57-1.086) | 0.144 |
| M stage | ||||
| M0 | Reference | Reference | ||
| M1 | 4.335(3.172-5.924) | <0.001 | 0.687(0.182-2.6) | 0.581 |
| Unknown | 0.885(0.28-2.8) | 0.835 | 0.593(0.148-2.38) | 0.461 |
| Grade stage | ||||
| G1 | Reference | Reference | ||
| G2 | 2565.729(0-5.33E+33) | 0.826 | 2404.779(0.000-2.36E+39) | 0.854 |
| G3 | 4769.895(0-9.91E+33) | 0.812 | 3588.853(0.000-3.52E+39) | 0.846 |
| G4 | 12893.55(0-2.68E+34) | 0.79 | 5439.316(0.000-5.34E+39) | 0.839 |
| Unknown | 1874.127(0-4E+33) | 0.833 | 1570.709(0.000-1.58E+39) | 0.862 |
| Ethnicity | ||||
| Not hispanic ‡ | Reference | Reference | ||
| Hispanic § | 0.213(0.068-0.669) | 0.008 | 0.214(0.066-0.688) | 0.01 |
| Unknown | 0.831(0.584-1.182) | 0.303 | 1.207(0.833-1.748) | 0.32 |
| Neo treatment ¶ | 0.02 | 0.473 | ||
| No | Reference | Reference | ||
| Yes | 2.139(1.129-4.054) | 1.366(0.583-3.199) | ||
| Laterality | ||||
| Right | Reference | |||
| Left | 1.413(1.047-1.907) | 0.024 | ||
| Bilateral | 0(0-1.069E+182) | 0.968 | ||
| Serum calcium level | ||||
| Low | Reference | Reference | ||
| Normal | 1.283(0.904-1.819) | 0.163 | 1.099(0.726-1.663) | 0.656 |
| Elevated | 5.001(2.481-10.08) | <0.001 | 1.35(0.537-3.397) | 0.524 |
| Unknown | 0.614(0.411-0.917) | 0.017 | 0.62(0.373-1.03) | 0.065 |
| Hemoglobin level | ||||
| Low | Reference | Reference | ||
| Normal | 0.436(0.305-0.623) | <0.001 | 0.65(0.436-0.969) | 0.034 |
| Elevated | 2.626(0.833-8.283) | 0.099 | 5.805(1.687-19.967) | 0.005 |
| Unknown | 0.341(0.192-0.606) | <0.001 | 0.773(0.379-1.58) | 0.481 |
| FZD1 expression | <0.001 | 0.001 | ||
| Low | Reference | Reference | ||
| High | 0.45(0.329-0.616) | 0.569(0.406-0.797) | ||
† Black or african American; ‡ Not hispanic or latino; § Hispanic or latino; ¶ Neoadjuvant treatment
ccRCC: clear cell renal cell carcinoma
HR: estimated from Cox proportional hazard regression model; 95%CI: 95% interval of the estimated HR.
We also found that FZD1 expression was a risk factor for DFS in the ccRCC patients by univariate cox regression analysis (HR 0.588; P=0.004). By adjusting multivariate analysis, high FZD1 expression was still considered as an independent predictor of good prognosis for DFS in ccRCC (HR 0.559; P=0.036). Patients with advanced stage tumor, positive lymph node metastasis status, positive distant metastasis status had worse DFS (Table 3).
Univariate and multivariate analyses of FZD1 mRNA level and ccRCC patient disease free survival
| Variable | Univariate cox regression | Multivariate cox regression | ||
|---|---|---|---|---|
| HR (95%CI) | P value | HR (95%CI) | P value | |
| Age (years) | 0.062 | 0.138 | ||
| <60 | Reference | Reference | ||
| ≥60 | 1.403(0.983-2.002) | 1.506(0.877-2.588) | ||
| Gender | 0.056 | 0.779 | ||
| Female | Reference | Reference | ||
| Male | 1.477(0.99-2.202) | 0.926(0.54-1.587) | ||
| Pathological stage | <0.001 | 0.006 | ||
| StageⅠor StageⅡ | Reference | Reference | ||
| StageⅢor StageⅣ | 6.404(4.309-9.517) | 4.447(1.522-12.994) | ||
| T stage | <0.001 | 0.645 | ||
| T1 or T2 | Reference | Reference | ||
| T3 or T4 | 4.435(3.075-6.395) | 0.816(0.344-1.938) | ||
| N stage | <0.001 | 0.049 | ||
| N0 | Reference | Reference | ||
| N1 | 4.69(2.293-9.592) | 2.642(1.006-6.938) | ||
| M stage | <0.001 | 0.002 | ||
| M0 | Reference | Reference | ||
| M1 | 8.264(5.67-12.043) | 2.925(1.504-5.689) | ||
| Grade stage | <0.001 | 0.337 | ||
| G1 or G2 | Reference | Reference | ||
| G3 or G4 | 3.313(2.193-5.005) | 1.311(0.754-2.28) | ||
| Ethnicity | ||||
| Not hispanic ‡ | Reference | Reference | ||
| Hispanic § | 0.567(0.248-1.296) | 0.179 | 0.287(0.067-1.231) | 0.093 |
| Unknown | 0.667(0.433-1.027) | 0.066 | 1.398(0.778-2.51) | 0.262 |
| Neo treatment ¶ | 0.074 | 0.814 | ||
| No | Reference | Reference | ||
| Yes | 2.113(0.929-4.807) | 0.841(0.198-3.577) | ||
| Laterality | 0.024 | 0.217 | ||
| Right | Reference | Reference | ||
| Left | 1.498(1.055-2.127) | 1.363(0.834-2.229) | ||
| FZD1 expression | 0.004 | 0.036 | ||
| Low | Reference | Reference | ||
| High | 0.588(0.411-0.841) | 0.559(0.325-0.964) | ||
‡ Not hispanic or latino; § Hispanic or latino; ¶ Neoadjuvant treatment; ccRCC: clear cell renal cell carcinoma HR: estimated from Cox proportional hazard regression model; 95%CI: 95% interval of the estimated HR.
We next used univariate and multivariate Cox regression to analyze the OS in the cohort of pRCC patients. Univariate analysis indicated that FZD1 expression was identified as a risk factor for OS in pRCC patients (HR 0.424; P=0.008). However, controlling for other variables in the multivariate analysis, FZD1 expression was not considered as an independent prognostic factor in pRCC patients (HR 0.7; P=0.349) (Table S1).
Taken these data together, suggested that FZD1 overexpression is an independent predictor of good prognosis for ccRCC patients but not pRCC patients.
The impact of alterations in FZD1 on the clinical survival
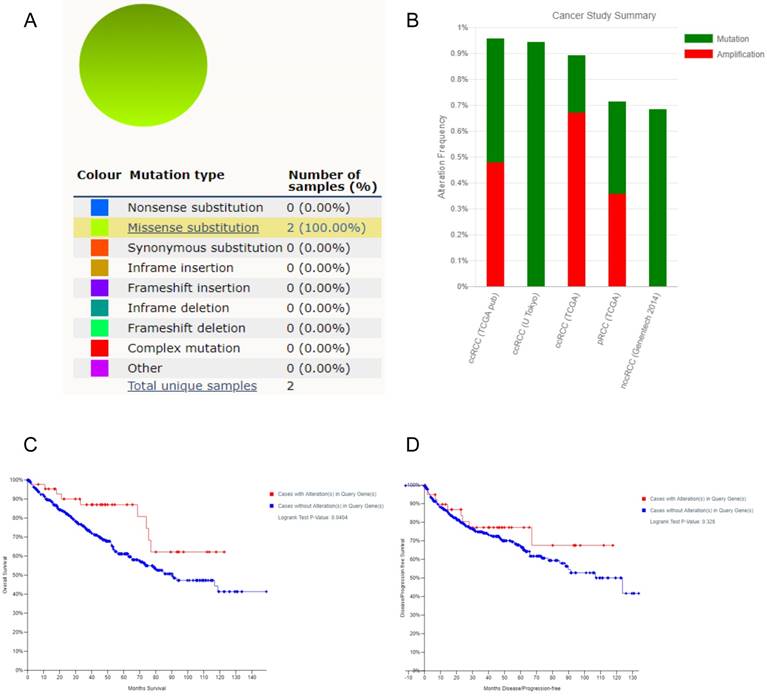
Using COSMIC database, the pie chart described the mutations information including substitution nonsense, missense, synonymous, deletion frame and insertion frame shift. Substitution missense rate was 100% of mutation samples of ccRCC (Figure 6A). Alteration frequency of FZD1 mutation in renal cancer was analyzed by cBioportal program. We found that less than 1% mutation in the patients with renal cancer with observed (Figure 6B). After analyzed by Kaplan-Meier plot and log-rank test, the alterations in FZD1 were associated with better OS in ccRCC patients (P=0.0404; Figure 6C). However, there was no significant difference between DFS in ccRCC patients with/without FZD1 alterations (P=0.328; Figure 6D).
FZD1 gene expression mutation and alterations analysis in ccRCC (from COSMIC and cBioPortal). A, Pie-chart showed the percentage of the mutation type of FZD1 in ccRCC according to COSMIC database. B, Oncoprint in cBioPortal represented the proportion and distribution of samples with alterations in FZD1 gene. C, Kaplan-Meier plots comparing OS in cases with/without FZD1 gene alterations. D, Kaplan-Meier plots comparing DFS in cases with/without FZD1 gene alterations.
FZD1 was upregulated in sunitinib-resistant cell lines
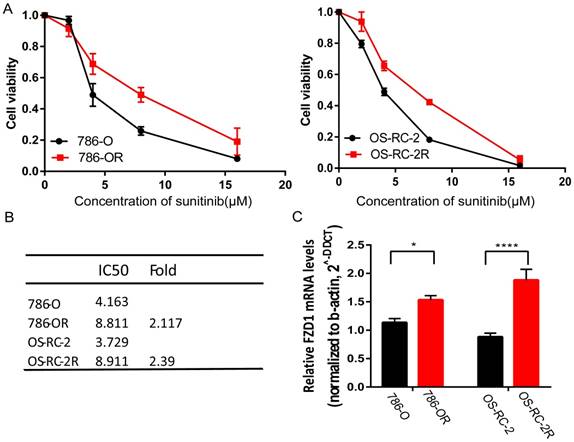
We established two sunitinib-resistant cell lines (786-OR and OS-RC-2R) by incubating the cells in media with a gradually increasing sunitinib concentration. Both 786-OR and OS-RC-2R displayed higher cell viability compared with parental cells after administrating different sunitinib concentrations (Figure 7A). We then detected FZD1 mRNA expression in sunitinib-resistant cells and the corresponding parental cells by qRT-PCR. The result indicated that sunitinib-resistant cells had higher FZD1 expression and a higher sunitinib tolerance (Figure 7B-C).
FZD1 was upregulated in sunitinib-resistant cell lines. A, cell viability assay of 786-O and OS-RC-2 as well as their corresponding parental cells when added different sunitinib concentrations. B, IC50 value of sunitinib-resistant and parental cells. C, mRNA expression of FZD1 in sunitinib-resistant and parental cells. The error bars represent mean ± SD of three independent experiments. Data differences were tested with Student's T-test (***, p<0.001, **, p<0.01, *, p<0.05).
Function and pathway enrichment analysis of FZD1-related genes in ccRCC
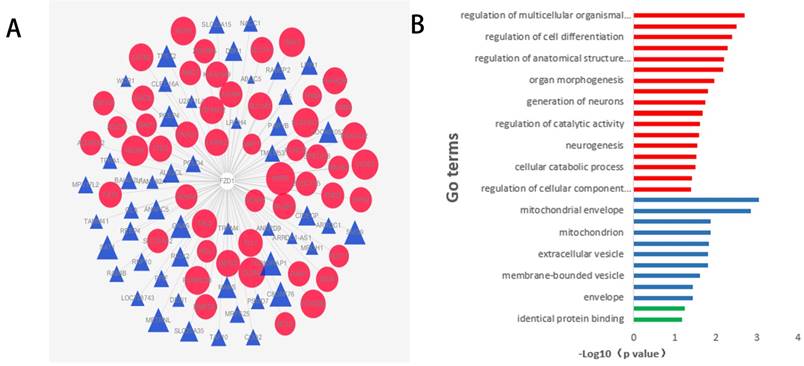
To comprehend the functions and potential mechanisms of FZD1 in ccRCC, we identified FZD1-related genes in ccRCC through cBioportal programs. To more directly demonstrate the association of these genes with FZD1, a network was generated via the cytoscape software. The red nodes in the network graph represented positively correlated genes, and the blue represented negatively correlated genes, different sizes of the nodes represented different degree of the association with FZD1 (Figure 8A). KEGG pathway analysed seven potential pathways that FZD1 and its related genes got involved in ccRCC. These results indicated FZD1 was involved in ccRCC via HTLV-I infection pathway, pathways in cancer, mTOR signaling pathway, melanogenesis, cushing's syndrome, gastric cancer and Hippo signaling pathways (Table 4). Thus, experiments need to be designed and performed to confirm the potential pathways. We also put these genes input into the David Database for GO enrichment analysis, revealing 27 GO terms with statistical significance (P <0.05). The most enriched GO items were “regulation of multicellular organismal development” for BP (P=0.002) and “protein dimerization activity” for MF (P=0.06), in terms of CC, these genes were found to be significantly present in the mitochondrial membrane. These corresponding GO terms were considered as the most specific and useful for describing the concrete function of FZD1 in ccRCC, the interaction between different GO terms in BP, CC and MF were visualized as three GO maps (Figure 8B).
Function and pathway enrichment analysis of FZD1 and its related genes in ccRCC. A, The interactions between FZD1 (center) and its 100 neighbors genes in ccRCC. The red nodes in the network graphs represented the positively correlated genes, while the blue represent the negatively correlated genes, and different size of the nodes represented different degree of the association with FZD1. B, GO analysis of FZD1 and its related genes using DAVID in ccRCC, showed 27 Go terms enriched in these genes. The function enrichment of related genes in three major GO classifications, that is, cell components (blue), biological processes (red) and molecular functions (green).
KEGG pathway analysis predicted seven potential pathways that FZD1 was involved in ccRCC
| Pathway ID | Pathway name | Genes |
|---|---|---|
| hsa05166 | HTLV-I infection | ADCY9 ANAPC5 POLD4 FZD1 |
| hsa05200 | Pathways in cancer | FZD1 MAPK1 BCL2 ADCY9 |
| hsa04150 | mTOR signaling pathway | LPIN1 MAPK1 FZD1 |
| hsa04916 | Melanogenesis | ADCY9 MAPK1 FZD1 |
| hsa04934 | Cushing's syndrome | ADCY9 MAPK1 FZD1 |
| hsa05226 | Gastric cancer | FZD1 MAPK1 BCL2 |
| hsa04390 | Hippo signaling pathway | AMOT FZD1 AJUBA |
ccRCC: clear cell renal cell carcinoma
Discussion
The expression of FZD1 has been shown to be aberrant expression in several kinds of malignant tumors, such as colon cancer [24], pancreatic cancer [27], follicular thyroid cancer [35], suggesting a potential role for FZD1 in processes associated with tumorigenesis. FZD1 expression level and function varied greatly according to different tumor types. Overexpression of FZD1 in pancreatic cancer were associated with invasion, metastasis and shorter overall survival [27]. However, in follicular thyroid carcinoma, FZD1 was downregulated and overexpression of FZD1 decreased invasiveness and proliferation rate [35]. In this work, we identified that FZD1 expression was significantly upregulated in ccRCC tissues and renal cancer cell lines. The high FZD1 level was strongly associated with indolent and non-recurrent characteristics of ccRCC. Although we could not elucidate this phenomenon in the present study, we speculate that genetic mutations and epigenetic alterations may play important roles. Genetic mutations and epigenetic alterations are very important for tumorigenesis, also impose vital impact as independent prognostic markers on therapeutic strategies for cancer patients.
In ccRCC, although somatic VHL mutations have been described for some time [14], more recent cancer genomic studies have identified new mutations in ccRCC, including PBRM1, SETD2, BAP1 [14], MTOR [36] and CKAP4 [37] that were associated with aggressive clinical features [38]. FZD1 was mutated at frequency ranged from 4% to 2%, involved in cell migration and invasion in neuroblastoma [39]. FZD1 was also frequently methylated and whose methylation was associated with inactivation of gene expression in prostate cancer cell lines [40]. We found less than 1% mutation in the patients with renal cancer was observed and the alterations in FZD1 were associated with better OS in ccRCC patients. The exact mechanism of FZD1 alteration with longer OS in ccRCC patients needs more investigations.
The Kaplan-Meier curve and log-rank test analyses revealed that upregulated FZD1 was associated with favorable OS and DFS in total and subgroups of ccRCC patients, which revealed that FZD1 mRNA expression may serve as an indicator for prevention and prognosis of ccRCC. ROC curve and AUC analysis found that FZD1 expression could be a potential diagnostic indicator for ccRCC patients. Univariate and multivariate cox regression analyses for OS and DFS in ccRCC patients furthermore confirmed that FZD1 expression was considered as an independent prognostic factor. Anaemia and hypercalcaemia were independent predictors of poor OS in renal cell carcinoma patients [41, 42]. But in this work, we found that high hemoglobin levels could also be an independent risk factor for ccRCC patients. We also identified new mutated genes that are involved in the pathogenesis of ccRCC, which help identify clinic patients.
As for pRCC, we got a similar result that FZD1 level in pRCC tissues was significant higher compared with normal tissues. FZD1 overexpression was associated with lower clinical stage in pRCC patients. However, multivariate analysis found FZD1 expression was not considered as an independent prognostic factor in pRCC patients.
Antiangiogenic therapy almost universally leads to the development of resistance and tumor progression in RCC [43]. In this work, we identified that FZD1 was upregulated in sunitinib-resistant cell lines compared with corresponding parental cells. And FZD1 was also involved in drug resistance in non-small cell lung cancer [44], multidrug-resistant leukemic cells [29], ovarian cancer [45] and uterine sarcoma cell [46]. FZD1 is overexpressed in the multidrug resistant breast cancer cell, when FZD1 silencing induced down-regulation of MDR1/P-gp through the Wnt/β-catenin signaling, restored sensitivity to chemotherapy drugs [30]. The Hippo-YAP/TAZ pathway has emerged as a hub that integrates diverse stimuli which regulates cell growth, survival, organ size and tissue homeostasis. Hippo signaling dysregulation underlies various human diseases including cancer [47]. And FZD1 initiates β-catenin-independent alternative Wnt signaling to activate YAP/TAZ, which were found to be the key downstream effectors of alternative Wnt signaling to mediate the effects of Wnt ligands [48]. Thus we used KEGG pathway analysis to identify the potential pathways of FZD1 involved in ccRCC. Interestingly, the results showed that Hippo signaling pathway was also involved in ccRCC via FZD1, also including AMOT and AJUBA. AJUBA increased the drug resistance through Hippo pathway in cervical cancer [49]. Thus, we speculated the Hippo signaling pathway may be involved in drug-resistant through activation of FZD1, further experimental confirmation is still needed. FZD1 is overexpression in sunitinib-resistant cell lines that may serve as a potential drug target to relieve sunitinib resistance in renal cancer patients.
The drawback of this study was the lack of enough specimens for FZD1 levels and survival time of KM-curve in protein level. FZD1 expression played a vital role in tumor development, recurrence and drug resistance in ccRCC patients, but the exact mechanism need to be further investigated. Despite these limitations, our study demonstrates a direct association between ccRCC patients FZD1 levels and prognosis based a large and representative population.
Conclusions
In summary, we provide the idea that FZD1 is upregulated in ccRCC tissues and renal cancer cell lines. It had a diagnostic value and prognostic value in ccRCC patients. FZD1 is overexpressed in sunitinib-resistant cell compared with corresponding parental cells, it may serve as a potential drug target to relieve sunitinib resistance in renal cancer patients. It's anticipated that FZD1 would complement the currently available markers to identify clinic patients that improve accuracy of outcome prediction.
Abbreviations
FZD1: Frizzled class receptor 1; RCC: renal cell carcinoma; ccRCC: clear cell renal cell carcinoma; pRCC: papillary renal cell carcinoma; OS: overall survival; DFS: disease-free survival; GO: Gene Ontology; CC: cell components; BP: biological processes; MF: molecular functions; VEGF: vascular endothelial growth factor; mTOR: mammalian target of rapamycin; RTK: receptor tyrosine kinases; TCGA: The Cancer Genome Atlas; AUC: area under the curve.
Supplementary Material
Supplementary figures and table.
Acknowledgements
This work was supported by National Natural Science Foundation of China (Grant/Award Number: 'No. 81771898'); Financial-Assistance Under Heilongjiang Province Postdoctoral Fund (Grant/Award Number: 'No.LBH-z16103'); Class General Financial Grant From The China Postdoctoral Science Fund (Grant/Award Number: 'NO.2016M601451').
Competing Interests
The authors have declared that no competing interest exists.
References
1. Capitanio U, Montorsi F. Renal cancer. The Lancet. 2016;387:894-906
2. Fitzmaurice C, Dicker D, Pain A. et al. The Global Burden of Cancer 2013. JAMA oncology. 2015;1(4):505-527
3. Torre LA, Bray F, Siegel RL. et al. Global cancer statistics, 2012. CA: a cancer journal for clinicians. 2015;65:87-108
4. Rini B I, Campbell S C, Escudier B. Renal cell carcinoma. Lancet. 2009;373(9669):1119-1132
5. Pierorazio PM, Johnson MH, Ball MW. et al. Five-year analysis of a multi-institutional prospective clinical trial of delayed intervention and surveillance for small renal masses: the DISSRM registry. European urology. 2015;68:408-15
6. Bhan S N, Stephen E P, Bobby S. et al. Active Surveillance, Radiofrequency Ablation, or Cryoablation for the Nonsurgical Management of a Small Renal Mass: A Cost-Utility Analysis. Annals of Surgical Oncology. 2013;20(11):3675-3684
7. Ljungberg B, Bensalah K, Canfield S. et al. EAU guidelines on renal cell carcinoma: 2014 update. European urology. 2015;67:913-24
8. Kim SP, Alt AL, Weight CJ. et al. Independent validation of the 2010 American Joint Committee on Cancer TNM classification for renal cell carcinoma: results from a large, single institution cohort. The Journal of urology. 2011;185:2035-9
9. Motzer R J, Hutson T E, Mccann L. et al. Overall survival in renal-cell carcinoma with pazopanib versus sunitinib. N Engl J Med. 2014;370(18):1769-1770
10. Achermann C, Stenner F, Rothschild S I. Treatment, Outcome and Prognostic Factors in Renal Cell Carcinoma - A Single Center Study (2000-2010). Journal of Cancer. 2016;7(8):921-927
11. Huang D, Ding Y, Li Y. et al. Sunitinib acts primarily on tumor endothelium rather than tumor cells to inhibit the growth of renal cell carcinoma. Cancer research. 2010;70(3):1053-1062
12. Niinivirta M, Enblad G, Edqvist P H. et al. Tumoral ANXA1 Is a Predictive Marker for Sunitinib Treatment of Renal Cancer Patients. Journal of Cancer. 2017;8(19):3975-3983
13. Wan F, Ma C, Zhang H. et al. Identification and validation of soluble carrier family expression signature for predicting poor outcome of renal cell carcinoma. Journal of Cancer. 2017;8(11):2010-2017
14. Cancer Genome Atlas Research N. Comprehensive molecular characterization of clear cell renal cell carcinoma. Nature. 2013;499(7456):43-49
15. Kapitsinou PP, Haase VH. The VHL tumor suppressor and HIF: insights from genetic studies in mice. Cell death and differentiation. 2008;15(4):650-9
16. Kaelin WG. Von Hippel-Lindau disease. Annual review of pathology. 2007;2:145-73
17. Hsieh JJ, Purdue MP, Signoretti S. et al. Renal cell carcinoma. Nature reviews Disease primers. 2017;3:17009
18. Gazit A, Yaniv A, Bafico A. et al. Human frizzled 1 interacts with transforming Wnts to transduce a TCF dependent transcriptional response. Oncogene. 1999;18(44):5959-66
19. Gordon MD, Nusse R. Wnt signaling: multiple pathways, multiple receptors, and multiple transcription factors. The Journal of biological chemistry. 2006;281:22429-33
20. Ueno K, Hirata H, Hinoda Y. et al. Frizzled homolog proteins, microRNAs and Wnt signaling in cancer. International journal of cancer. 2013;132(8):1731-40
21. Hatipoglu G, Hock S W, Weiss R. et al. Sunitinib impedes brain tumor progression and reduces tumor-induced neurodegeneration in the microenvironment. Cancer Science. 2015;106(2):160-170
22. Han S, Pang M F, Nelson C M. Substratum stiffness tunes proliferation downstream of Wnt3a in part by regulating integrin-linked kinase and frizzled-1. Journal of Cell Science. 2018;131(8):jcs.210476
23. Planutis K, Planutiene M, Nguyen A V. et al. Invasive colon cancer, but not non-invasive adenomas induce a gradient effect of Wnt pathway receptor frizzled 1 (Fz1) expression in the tumor microenvironment. Journal of Translational Medicine. 2013;11(1):1-7
24. Holcombe R F, Marsh J L, Waterman M L. et al. Expression of Wnt ligands and Frizzled receptors in colonic mucosa and in colon carcinoma. Mol Pathol. 2002;55(4):220-226
25. Milovanovic T, Planutis K, Nguyen A. et al. Expression of Wnt genes and frizzled 1 and 2 receptors in normal breast epithelium and infiltrating breast carcinoma. International Journal of Oncology. 2004;25(5):1337-1342
26. Li J, Yang ZL, Ren X. et al. ACE2 and FZD1 are prognosis markers in squamous cell/adenosquamous carcinoma and adenocarcinoma of gallbladder. Journal of molecular histology. 2014;45(1):47-57
27. Yang L, Yang Z, Li D. et al. Overexpression of FZD1 and CAIX are Associated with Invasion, Metastasis, and Poor-Prognosis of the Pancreatic Ductal Adenocarcinoma. Pathology oncology research. 2017:1-8
28. Flahaut M, Meier R, Coulon A. et al. The Wnt receptor FZD1 mediates chemoresistance in neuroblastoma through activation of the Wnt/beta-catenin pathway. Oncogene. 2009;28(23):2245-56
29. Wang YH, Imai Y, Shiseki M, Tanaka J, Motoji T. Knockdown of the Wnt receptor Frizzled-1 (FZD1) reduces MDR1/P-glycoprotein expression in multidrug resistant leukemic cells and inhibits leukemic cell proliferation. Leukemia research. 2018;67:99-108
30. Zhang H, Zhang X, Wu X. et al. Interference of Frizzled 1 (FZD1) reverses multidrug resistance in breast cancer cells through the Wnt/beta-catenin pathway. Cancer letters. 2012;323(1):106-13
31. Rhodes D R, Yu J, Shanker K. et al. ONCOMINE: a cancer microarray database and integrated data-mining platform. Neoplasia. 2004;6(1):1-6
32. Cerami E, Gao J, Dogrusoz U. et al. The cBio cancer genomics portal: an open platform for exploring multidimensional cancer genomics data. Cancer discovery. 2012;2(5):401-4
33. Gao J, Aksoy BA, Dogrusoz U. et al. Integrative analysis of complex cancer genomics and clinical profiles using the cBioPortal. Science signaling. 2013;6:pl1
34. Forbes SA, Beare D, Gunasekaran P. et al. COSMIC: exploring the world's knowledge of somatic mutations in human cancer. Nucleic acids research. 2015;43:D805-11
35. Ulivieri A, Lavra L, Dominici R. et al. Frizzled-1 is down-regulated in follicular thyroid tumours and modulates growth and invasiveness. The Journal of pathology. 2008;215(1):87-96
36. Sato Y, Yoshizato T, Shiraishi Y. et al. Integrated molecular analysis of clear-cell renal cell carcinoma. Nature genetics. 2013;45(8):860-7
37. Sun C M, Geng J, Yan Y. et al. Overexpression of CKAP4 is Associated with Poor Prognosis in Clear Cell Renal Cell Carcinoma and Functions via Cyclin B Signaling. Journal of Cancer. 2017;8(19):4018-4026
38. Hakimi AA, Ostrovnaya I, Reva B. et al. Adverse outcomes in clear cell renal cell carcinoma with mutations of 3p21 epigenetic regulators BAP1 and SETD2: a report by MSKCC and the KIRC TCGA research network. Clin Cancer Res. 2013;19(12):3259-3267
39. Lasorsa V A, Formicola D, Pignataro P. et al. Exome and deep sequencing of clinically aggressive neuroblastoma reveal somatic mutations that affect key pathways involved in cancer progression. Oncotarget. 2016;7(16):21840-21852
40. Devaney JM, Wang S, Funda S. et al. Identification of novel DNA-methylated genes that correlate with human prostate cancer and high-grade prostatic intraepithelial neoplasia. Prostate cancer and prostatic diseases. 2013;16:292-300
41. Motzer R J, Bacik J, Murphy B A. et al. Interferon-alfa as a comparative treatment for clinical trials of new therapies against advanced renal cell carcinoma. Journal of Clinical Oncology. 2002;20(1):289-296
42. Heng DYC, Xie W, Regan MM. et al. External validation and comparison with other models of the International Metastatic Renal-Cell Carcinoma Database Consortium prognostic model: a population-based study. The Lancet Oncology. 2013;14(2):141-8
43. Zhou L, Liu XD, Sun M. et al. Targeting MET and AXL overcomes resistance to sunitinib therapy in renal cell carcinoma. Oncogene. 2016;35(21):2687-97
44. Su W, Mo Y, Wu F. et al. miR-135b reverses chemoresistance of non-small cell lung cancer cells by downregulation of FZD1. Biomedicine & pharmacotherapy. 2016;84:123-9
45. Zhang H, Jing X, Wu X. et al. Suppression of multidrug resistance by rosiglitazone treatment in human ovarian cancer cells through downregulation of FZD1 and MDR1 genes. Anti-cancer drugs. 2015;26(7):706-15
46. Hung TH, Chen CM, Tseng CP. et al. FZD1 activates protein kinase C delta-mediated drug-resistance in multidrug-resistant MES-SA/Dx5 cancer cells. Int J Biochem Cell Biol. 2014;53(8):55-65
47. Pan D. The hippo signaling pathway in development and cancer. Developmental Cell. 2010;19(4):491-505
48. Park HW, Kim YC, Yu B. et al. Alternative Wnt Signaling Activates YAP/TAZ. Cell. 2015;162(4):780-94
49. Bi L, Ma F, Tian R. et al. AJUBA increases the cisplatin resistance through hippo pathway in cervical cancer. Gene. 2018;644:148-54
Author contact
![]() Corresponding author: Wanhai Xu, MD, PhD, Department of Urology, the Fourth Hospital of Harbin Medical University, Yiyuan Street NO.37, Harbin, 150001, China, Phone: +86-045166252986. E-mail: xuwanhaiedu.cn.
Corresponding author: Wanhai Xu, MD, PhD, Department of Urology, the Fourth Hospital of Harbin Medical University, Yiyuan Street NO.37, Harbin, 150001, China, Phone: +86-045166252986. E-mail: xuwanhaiedu.cn.