Impact Factor ISSN: 1837-9664

 Global reach, higher impact
J Cancer 2019; 10(3):583-593. doi:10.7150/jca.28991 This issue Cite
Research Paper
Nomogram Predicting Cause-Specific Mortality in Nonmetastatic Male Breast Cancer: A Competing Risk Analysis
Wei Sun1, Minghua Cheng1, Huaqiang Zhou2, Wenqi Huang3, Zeting Qiu1 ![]()
1. Department of Anesthesiology, The First Affiliated Hospital of Shantou University Medical College, Shantou, Guangdong, People's Republic of China
2. Department of Medical Oncology, Sun Yat-sen University Cancer Center, Guangzhou, Guangdong, People's Republic of China
3. Department of Anesthesiology, The First Affiliated Hospital of Sun Yat-sen University, Guangzhou, Guangdong, People's Republic of China
Received 2018-8-4; Accepted 2018-9-18; Published 2019-1-1
Abstract
Introduction: Male breast cancer (MBC) is a rare tumor with few cases for research. Using the Surveillance, Epidemiology, and End Results program database, we carried out a competing risk analysis in patients with primary nonmetastatic MBC and built a predictive nomogram.
Materials and Methods: We extracted primary nonmetastatic MBC patients according to the inclusion and exclusion criteria. Cumulative incidence function (CIF) and proportional subdistribution hazard model were adopted to explore risk factors for breast cancer-specific death (BCSD) and other cause-specific death (OCSD). Then we built a nomogram to predict the 3-year, 5-year and 8-year probabilities of BCSD and OCSD. C-indexes, Brier scores and calibration curves were chosen for validation.
Results: We identified 1,978 nonmetastatic MBC patients finally. CIF analysis showed that the 3-year, 5-year and 8-year mortalities were 5.2%, 10.6% and 16.5% for BCSD, and 6.1%, 9.6% and 14.4% for OCSD. After adjustment of Fine and Gray models, black race, PR (-), advanced T/N/grade and no surgery were independently associated with BCSD. Meanwhile, elderly, unmarried status, advanced AJCC stage and no chemotherapy resulted in OCSD more possibly. A graphic nomogram was developed according to the coefficients from the Fine and Gray models. The calibration curves displayed exceptionally, with C-indexes nearly larger than 0.700 and Brier scores nearly smaller than 0.100.
Conclusion: The competing risk nomogram showed good accuracy for predictive prognosis in nonmetastatic MBC patients. It was a useful implement to evaluate crude mortalities of BCSD and OCSD, and help clinicians to choose appropriate therapeutic plans.
Keywords: Nonmetastatic male breast cancer, SEER database, Competing risk nomogram, Breast cancer-specific death, Other cause-specific death, Fine and Gray model
Introduction
Male breast cancer (MBC) occupies only 1% of all breast cancers in the United States [1]. As for men, it represents only 0.003% of all male cancers [2]. Because of the low incidence, clinical studies about MBC always include relatively few cases, which is difficult for detailed analysis. Nowadays, the therapy for MBC is the same as the female breast cancer [3]. However, it was shown that the prognosis of male patients with breast cancer was worse than female patients [4]. MBC is such a particular neoplasm in men that it might demonstrate different features from female breast cancer in the aspect of genetics and epigenetics [5-7]. The majority of MBC patients are nonmetastatic. The prognostic risk factors for primary nonmetastatic MBC need to be further explored.
In general, cancer patients are always exposed to more than two events, and only one event occurs finally [8]. Those events other than the interested one are called the competing risk events. Traditional survival analysis treats competing events as censored events, which could be improved by the competing risk analysis. Nomogram, as the visualization of linear prediction model, could be applied to estimate survival probabilities quickly [9]. On the nomogram graph, each value of characteristics represents a score, and the total score maps the survival probability.
Some studies just focused on the prognosis of nonmetastatic MBC in a single center with a small sample size, and some studies carried out a population-based analysis [7, 10]. However, almost all of them conducted the overall survival and tumor cause-specific survival analysis, while neglected the role of other competing death causes in the prognosis of nonmetastatic MBC. The long-time survival prognosis relies on the competing death risks to a great extent. We should take the competing risk into account when estimating the survival outcomes.
The Surveillance, Epidemiology, and End Results (SEER) program covers approximately 30% of the population in the United States [11, 12]. It provides complete patient data including demographic, clinical and follow-up data updated annually by the National Center for Health Statistics. Breast cancer in male patients is a rare disease, so that we make use of the population-based SEER database to identify the patients with primary nonmetastatic MBC for analysis.
In the study, we carried out a competing risk analysis in patients with nonmetastatic MBC. The other cause-specific death (OCSD) was treated as the competing event of the breast cancer-specific death (BCSD). The cumulative incidence function (CIF), as well as the Fine and Gray model, was adopted to explore independent predictive factors of BCSD and OCSD. We also built a competing risk nomogram for clinicians to visually estimate individual crude cumulative incidences of BCSD and OCSD.
Materials and Methods
Data sources
The current SEER database (https://seer.cancer.gov) contained the SEER 18 registries research data and the Hurricane Katrina impacted Louisiana cases from 1973 to 2014. We got the permission of November 2016 research data for analysis (Reference number: 12738-Nov2016). All patients' data of nonmetastatic male breast cancer were obtained through SEER*Stat software. Patients have been de-identified in the database, and no informed consents were needed.
Inclusion and exclusion criteria
We picked up male patients with primary nonmetastatic breast cancer during 1996 and 2010 in the study. Patients were included when meeting the following criteria: (1) Male patients; (2) Patients were diagnosed as primary breast cancer (International Classification of Diseases for Oncology, Third Edition [ICD-O-3], code C50.0, C50.1, C50.2, C50.3, C50.4, C50.5, C50.6, C50.8, C50.9); (3) Diagnosed between 1996 and 2010 (As the current SEER database only have the latest survival record in 2015, we chose patients diagnosed before 2010 to meet the enough follow-up period); (4) Patients were aged older than 18 years old and younger than 80 at diagnosis. Patients were excluded according to the following criteria: (1) Unknown demographic information including age at diagnosis, race and marital status; (2) Unknown clinical information including tumor laterality, American Joint Committee on Cancer (AJCC) stage, SEER stage and grade; (3) Indefinite treatment information including surgery and radiotherapy; (4) Patients with multiple primary tumors; (5) Patients with the follow-up type of autopsy/death certificate only; (6) With metastatic or synchronous tumors. We randomly divided the included patients into the training cohort and testing cohort according to the ratio of 9:1. The training cohort was used to build the predictive competing risk model, and the testing cohort was used for external validation.
Variable selection
We gathered variables of age, race, marital status, estrogen receptor (ER), progesterone receptor (PR), human epidermal growth factor receptor 2 (HER2), tumor laterality, histologic grade, AJCC tumor node metastasis (TNM) stage, AJCC T status, AJCC N status, SEER stage, surgical therapy, radiotherapy, chemotherapy, causes of death and survival months from the SEER database.
Age was classified as 18-64 (young) and 65-80 (old) years old according to the median of age, 65 years old. Race was classified as white, black and others. Marital status was classified as unmarried and married. ER, PR and HER2 were all classified as positive, negative and others (Note: The SEER database began collecting HER-2 information since 2010). Tumor laterality was classified as left and right. Histologic grade was classified as grade I, II and III/IV. AJCC TNM stage was classified as stage I, II and III/IV. AJCC T status was classified as T1, T2, T3 and T4. AJCC N status was classified as N0, N1, N2 and N3. SEER stage was classified as localized, regional and distant. Surgical treatment and radiotherapy were all defined as receiving corresponding therapy or not. Chemotherapy was classified as receiving or not/unknown. Causes of death were classified as BCSD and OCSD.
Statistical analysis
We conducted all the analysis using R statistical software version 3.3 (https://www.r-project.org). All p values were two-sided and p < 0.05 was considered statistically significant. Continuous variables with normal distribution were described as means and standard deviations, continuous variables with skewed distribution were described as medians, first quartiles and third quartiles, and categorical variables were described as frequencies and percentages [13]. In the competing risk analysis, BCSD and OCSD were two competing endpoint events. Firstly, for BCSD and OCSD, the cumulative incidence function (CIF) was calculated, as well as CIF grouped by age, race, marital status, ER, PR, HER2, laterality, grade, AJCC stage, T status, N status, SEER stage, surgery, radiotherapy or chemotherapy. Using R package of cmprsk, we plotted CIF curves for every variable, and performed the Gray's test to recognize differences for two events in the CIF [14]. Secondly, for multivariate competing risk survival analysis, we constructed the Fine and Gray proportional subdistribution hazard model to predict BCSD and OCSD by R package of cmprsk and riskRegression [15, 16]. Thirdly, We predicted the 3-year, 5-year and 8-year cumulative mortality probabilities of the BCSD and OCSD according to the established Fine and Gray competing risk models. With R package of rms, we build a competing risk nomogram based on the coefficients from the Fine and Gray's model, to predict the 3-year, 5-year and 8-year prognosis of male patients with primary nonmetastatic breast cancer. In addition, we also applied the censoring weighted Cox proportional hazards model to build the competing risk nomogram, and compared the differences between the parameters of two models [17]. Fourthly, during the validation process, concordance indexes (C-index), Brier scores and calibration curves were chosen using R package of pec and DescTools [18]. The C-index quantified the predicting ability of the model. It ranged from 0.5 to 1.0, which represented a random chance to perfect discrimination. The calibration curve described the average predictive estimate against actual observation, and evaluated the nomogram performance visually [19]. The perfect prediction should fall on a 45-degree straight line passing through the origin. We performed bootstrap with 1000 resamples and 5-fold cross-validation.
Results
Baseline characteristics
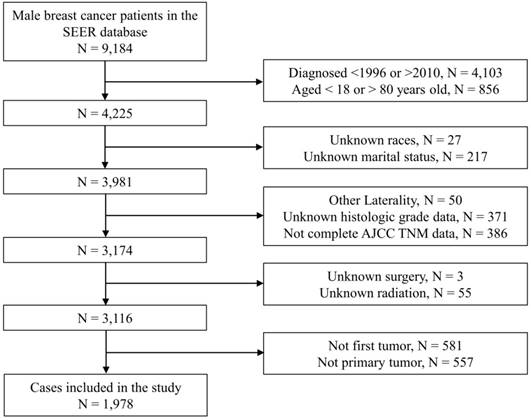
As Figure 1 showed, we originally included 4,225 patients from the SEER database. Subsequently, we excluded 244 patients with unknown demographic information, 807 patients with unknown clinical information, 58 patients with indefinite treatment information, 1,138 patients who were not primary tumors. Finally, we identified 1,978 eligible patients with primary nonmetastatic MBC. Baseline information of the included patients were shown in Table 1. As a whole, the majority of patients were young (1,105, 55.9%), white race (1,580, 79.9%) or married (1,434, 72.5%). There were 1,715 (86.7%) patients with ER (+), 1,464 (74.0%) patients with PR (+) and 25 (1.3%) patients with HER2 (+). As for grading and staging system, there were more patients stayed as grade II (984, 49.7%), AJCC stage II (920, 46.5%), T1 status (1,027, 51.9%), N0 status (1,072, 54.2%) or SEER localized stage (931, 47.1%). Of all the patients, 1956 (98.9%) received surgical treatment, 882 (44.6%) received chemotherapy and 554 (28.0%) received radiotherapy. The median follow-up period was 85.0 (56.0-123.0) months. The baseline data of patients in the training cohort and the testing cohort were shown in Table S1.
Flow chart of patient enrollment. Notes: SEER, Surveillance, Epidemiology, and End Results; N, number; AJCC, American Joint Committee on Cancer; TNM, Tumor node metastasis.
Baseline characteristic of the included primary nonmetastatic male breast cancer patients in the SEER database.
| Characteristic | Number | % | Characteristic | Number | % | |
|---|---|---|---|---|---|---|
| Age | AJCC stage | |||||
| 62.0 † | 54.0-71.0 † | I | 670 | 33.9 | ||
| Age group | II | 920 | 46.5 | |||
| Young | 1105 | 55.9 | III | 388 | 19.6 | |
| Old | 873 | 44.1 | AJCC-T | |||
| Race | T1 | 1027 | 51.9 | |||
| White | 1580 | 79.9 | T2 | 763 | 38.6 | |
| Black | 280 | 14.2 | T3 | 61 | 3.1 | |
| Other | 118 | 6.0 | T4 | 127 | 6.4 | |
| Marriage | AJCC-N | |||||
| Unmarried | 544 | 27.5 | N0 | 1072 | 54.2 | |
| Married | 1434 | 72.5 | N1 | 615 | 31.1 | |
| ER | N2 | 182 | 9.2 | |||
| Negative | 80 | 4.0 | N3 | 109 | 5.5 | |
| Positive | 1715 | 86.7 | SEER stage | |||
| Other | 183 | 9.3 | Localized | 931 | 47.1 | |
| PR | Regional | 1017 | 51.4 | |||
| Negative | 287 | 14.5 | Distant | 30 | 1.5 | |
| Positive | 1464 | 74.0 | Surgery treatment | |||
| Other | 227 | 11.5 | Yes | 1956 | 98.9 | |
| HER2 | No | 22 | 1.1 | |||
| Negative | 144 | 7.3 | Chemotherapy | |||
| Positive | 25 | 1.3 | Yes | 882 | 44.6 | |
| Other | 1809 | 91.5 | No | 1096 | 55.4 | |
| laterality | Radiotherapy | |||||
| Left | 1041 | 52.6 | Yes | 554 | 28.0 | |
| Right | 937 | 47.4 | No | 1424 | 72.0 | |
| Grade | Cause of death | |||||
| I | 271 | 13.7 | No events | 1245 | 62.9 | |
| II | 984 | 49.7 | BCSD | 364 | 18.4 | |
| III/IV | 723 | 36.6 | OCSD | 369 | 18.7 | |
Notes: SEER, Surveillance, Epidemiology and End Results; ER, estrogen receptor; PR, progesterone receptor; HER2, human epidermal growth factor receptor 2; AJCC, American Joint Committee on Cancer; BCSD, breast cancer-specific death; OCSD, other cause-specific death; †, medians and 1st/3rd quartiles; Young, 18-64 years old; Old, 65-80 years old.
Univariate analysis by CIF
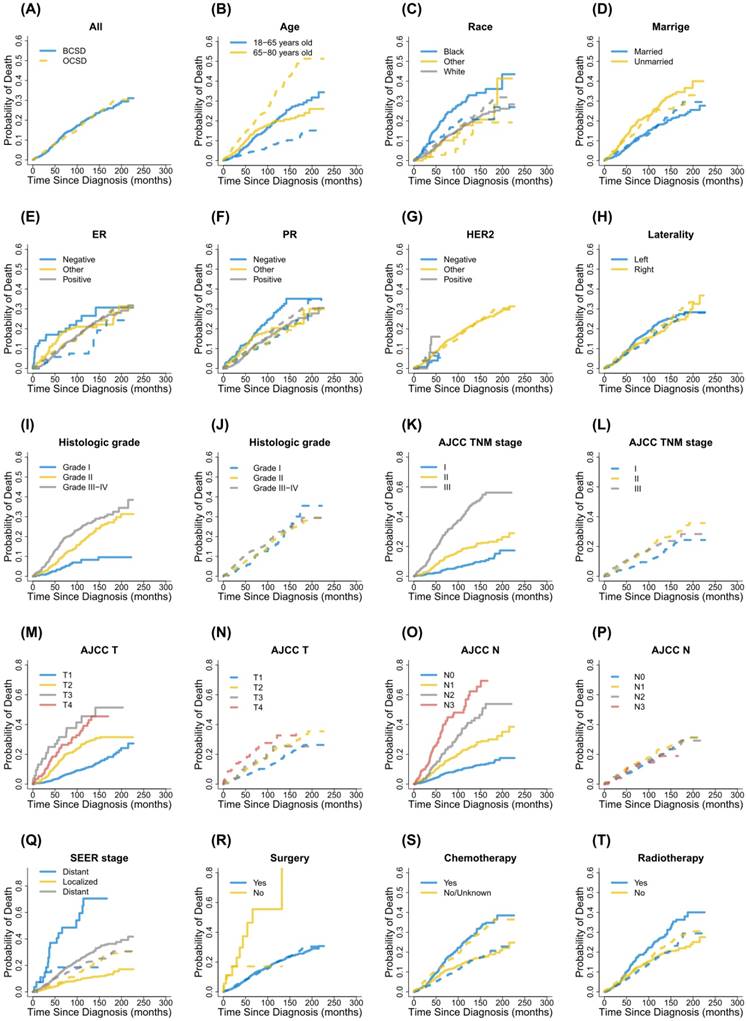
In the study, during the follow-up period there were 364 patients dying from breast cancer and 369 patients dying from other causes, respectively. CIF curves for all variable were shown in Figure 2. Correspondingly, the 3-year, 5-year and 8-year cumulative incidences of BCSD and OCSD grouped by different variables were presented in Table 2. In general, the 3-year, 5-year and 8-year breast cancer-specific mortalities were 5.2%, 10.6% and 16.5%. Those patients with black race, unmarried status, PR (-), advanced grade, advanced AJCC stage, advanced T status, advanced N status, SEER distant stage, no surgical treatment, receiving chemotherapy and receiving radiotherapy, were accompanied by high cumulative incidences of BCSD. Age, ER status, HER2 status and laterality had nothing to do with the prognosis of BCSD outcomes statistically. Meanwhile, the 3-year, 5-year and 8-year other cause-specific mortalities were 6.1%, 9.6% and 14.4%. There were higher cumulative incidences of OCSD in patients with advanced age, unmarried status, advanced AJCC stage, advanced T status and not receiving chemotherapy. No statistical significances were detected for race, ER status, PR status, HER2 status. laterality, grade, N status, SEER stage, surgical treatment and radiotherapy in CIF of OCSD.
Cumulative incidence function curves for each characteristic. Notes: Solid lines indicate BCSD; Dotted lines indicate OCSD; BCSD, breast cancer-specific death; OCSD, other cause-specific death; ER, estrogen receptor; PR, progesterone receptor; HER2, human epidermal growth factor receptor 2; AJCC, American Joint Committee on Cancer; TNM, Tumor node metastasis; SEER, Surveillance, Epidemiology, and End Results.
Cumulative incidence function analysis of death causes in male patients with primary nonmetastatic breast cancer.
| Characteristics | BCSD | OCSD | |||||||||||
|---|---|---|---|---|---|---|---|---|---|---|---|---|---|
| Event | % | 3-year | 5-year | 8-year | p | Event | % | 3-year | 5-year | 8-year | p | ||
| Total | 364 | 100.0 | 5.2% | 10.6% | 16.5% | 369 | 100.0 | 6.1% | 9.6% | 14.4% | |||
| Age group | 0.822 | <0.001*** | |||||||||||
| Young | 211 | 58.0 | 4.3% | 9.1% | 15.6% | 96 | 26.0 | 2.4% | 4.3% | 6.3% | |||
| Old | 153 | 42.0 | 6.3% | 12.6% | 17.6% | 273 | 74.0 | 10.7% | 16.4% | 24.9% | |||
| Race | <0.001*** | 0.083 | |||||||||||
| White | 267 | 73.4 | 4.3% | 9.3% | 14.8% | 305 | 82.7 | 5.9% | 9.8% | 14.6% | |||
| Black | 79 | 21.7 | 11.6% | 19.6% | 27.4% | 53 | 14.4 | 8.8% | 11.7% | 16.8% | |||
| Other | 18 | 4.9 | 1.9% | 7.8% | 11.8% | 11 | 3.0 | 1.9% | 2.9% | 6.0% | |||
| Marriage | <0.001*** | 0.019* | |||||||||||
| Unmarried | 133 | 36.5 | 8.8% | 16.6% | 22.5% | 123 | 33.3 | 8.3% | 12.2% | 19.1% | |||
| Married | 231 | 63.5 | 3.8% | 8.4% | 14.2% | 246 | 66.7 | 5.2% | 8.7% | 12.7% | |||
| ER | 0.328 | 0.289 | |||||||||||
| Negative | 20 | 5.5 | 17.0% | 18.5% | 21.9% | 11 | 3.0 | 4.3% | 5.8% | 7.5% | |||
| Positive | 303 | 83.2 | 4.2% | 9.6% | 15.7% | 315 | 85.4 | 6.0% | 9.8% | 14.9% | |||
| Other | 41 | 11.3 | 8.8% | 16.6% | 21.0% | 43 | 11.7 | 7.1% | 10.0% | 13.8% | |||
| PR | 0.003** | 0.256 | |||||||||||
| Negative | 75 | 20.6 | 9.9% | 14.0% | 22.9% | 49 | 13.3 | 5.5% | 8.8% | 12.6% | |||
| Positive | 241 | 66.2 | 3.9% | 9.4% | 14.9% | 273 | 74.0 | 6.2% | 10.0% | 15.3% | |||
| Other | 48 | 13.2 | 7.5% | 14.3% | 18.5% | 47 | 12.7 | 6.1% | 8.5% | 11.6% | |||
| HER2 | 0.123 | 0.804 | |||||||||||
| Negative | 7 | 1.9 | 3.2% | — | — | 11 | 3.0 | 5.5% | — | — | |||
| Positive | 4 | 1.1 | 8.0% | — | — | 2 | 0.5 | 8.0% | — | — | |||
| Other | 353 | 97.0 | 5.3% | 10.9% | 16.6% | 356 | 96.5 | 6.1% | 9.8% | 14.5% | |||
| laterality | 0.165 | 0.138 | |||||||||||
| Left | 206 | 56.6 | 5.5% | 11.5% | 18.1% | 182 | 49.3 | 5.4% | 8.8% | 13.4% | |||
| Right | 158 | 43.4 | 4.8% | 9.7% | 14.6% | 187 | 50.7 | 6.8% | 10.6% | 15.6% | |||
| Grade | <0.001*** | 0.505 | |||||||||||
| I | 20 | 5.5 | 1.7% | 3.4% | 6.9% | 54 | 14.6 | 3.7% | 6.3% | 12.6% | |||
| II | 166 | 45.6 | 4.1% | 9.0% | 14.3% | 171 | 46.3 | 5.3% | 8.5% | 13.4% | |||
| III/IV | 178 | 48.9 | 7.8% | 15.5% | 22.9% | 144 | 39.0 | 7.9% | 12.4% | 16.4% | |||
| AJCC stage | <0.001*** | <0.001*** | |||||||||||
| I | 51 | 14.0 | 1.9% | 2.9% | 5.8% | 97 | 26.3 | 4.0% | 6.0% | 9.8% | |||
| II | 159 | 43.7 | 4.0% | 10.3% | 15.7% | 197 | 53.4 | 6.9% | 11.0% | 16.7% | |||
| III | 154 | 42.3 | 13.4% | 24.3% | 36.1% | 75 | 20.3 | 7.6% | 12.6% | 17.1% | |||
| AJCC-T | <0.001*** | <0.001*** | |||||||||||
| T1 | 113 | 31.0 | 1.8% | 4.2% | 8.6% | 158 | 42.8 | 4.7% | 7.2% | 10.7% | |||
| T2 | 183 | 50.3 | 6.8% | 15.5% | 23.0% | 163 | 44.2 | 6.3% | 11.0% | 17.1% | |||
| T3 | 24 | 6.6 | 25.0% | 31.6% | 37.6% | 13 | 3.5 | 7.7% | 11.7% | 17.4% | |||
| T4 | 44 | 12.1 | 13.2% | 24.3% | 31.4% | 35 | 9.5 | 14.8% | 20.5% | 27.6% | |||
| AJCC-N | <0.001*** | 0.537 | |||||||||||
| N0 | 110 | 30.2 | 2.6% | 5.9% | 9.0% | 193 | 52.3 | 5.2% | 7.9% | 12.8% | |||
| N1 | 132 | 36.3 | 6.0% | 12.3% | 19.0% | 127 | 34.4 | 7.8% | 12.3% | 17.2% | |||
| N2 | 65 | 17.9 | 9.1% | 17.7% | 30.9% | 33 | 8.9 | 6.6% | 9.1% | 14.3% | |||
| N3 | 57 | 15.7 | 17.8% | 34.3% | 48.0% | 16 | 4.3 | 4.0% | 12.0% | 14.5% | |||
| SEER stage | <0.001*** | 0.204 | |||||||||||
| Localized | 93 | 25.5 | 2.9% | 5.8% | 8.4% | 160 | 43.4 | 4.4% | 7.1% | 11.7% | |||
| Regional | 253 | 69.5 | 6.5% | 14.0% | 22.6% | 204 | 55.3 | 7.3% | 11.7% | 16.7% | |||
| Distant | 18 | 4.9 | 25.9% | 44.4% | 48.6% | 5 | 1.4 | 14.8% | 18.5% | 18.5% | |||
| Surgery treatment | <0.001*** | ||||||||||||
| Yes | 354 | 97.3 | 5.0% | 10.3% | 16.1% | 365 | 98.9 | 6.0% | 9.6% | 14.4% | |||
| No | 10 | 2.7 | 23.1% | 46.4% | 55.6% | 4 | 1.1 | 17.1% | 17.1% | 17.1% | |||
| Chemotherapy | <0.001*** | <0.001*** | |||||||||||
| Yes | 205 | 56.3 | 5.7% | 12.6% | 20.9% | 113 | 30.6 | 3.4% | 6.5% | 10.5% | |||
| No | 159 | 43.7 | 4.7% | 9.0% | 12.8% | 256 | 69.4 | 8.3% | 12.2% | 17.7% | |||
| Radiotherapy | <0.001*** | 0.188 | |||||||||||
| Yes | 133 | 36.5 | 4.9% | 13.6% | 21.3% | 94 | 25.5 | 4.3% | 7.9% | 13.3% | |||
| No | 231 | 63.5 | 5.3% | 9.5% | 14.6% | 275 | 74.5 | 6.7% | 10.3% | 14.8% | |||
Notes: BCSD, breast cancer specific death; OCSD, other cause-specific death; ER, estrogen receptor; PR, progesterone receptor; HER2, human epidermal growth factor receptor 2; AJCC, American Joint Committee on Cancer; SEER, Surveillance, Epidemiology and End Results; Young, 18-64 years old; Old, 65-80 years old; *, p < 0.05; **, p < 0.01; ***, p < 0.001.
Multivariate analysis by Fine and Gray model
The proportional subdistribution hazard model of the Fine and Gray method was used for multivariate analysis of BCSD and OCSD. Table 3 showed the subdistribution hazard ratios (sHRs) estimated from the Fine and Gray competing risk regression model. After adjusting the significant variables from the univariate analysis by CIF, the multivariate analysis found that race, PR status, grade, T status, N status and SEER stage stayed as independent predictive factors of BCSD. Black patients had worse prognosis, as well as PR (-) patients (white versus black: 0.653, 95% confidence interval [CI] 0.493-0.866, p = 0.003; PR [+] versus PR [-]: 0.687, 95% CI 0.516-0.915, p = 0.010). Compared with T1, advanced T status had more probable BCSD (T2 versus T1: 1.829, 95% CI 1.434-2.333, p < 0.001; T3 versus T1: 3.269, 95% CI 1.946-5.492, p < 0.001; T4 versus T1: 2.022, 95% CI 1.357-3.014, p < 0.001). So as advanced N status compared with N0 (N1 versus N0: 1.999, 95% CI 1.519-2.629, p < 0.001; N2 versus N0: 3.117, 95% CI 2.220-4.376, p < 0.001; N3 versus N0: 5.032, 95% CI 3.531-7.170, p < 0.001). Patients without surgical treatment were more likely to die from breast cancer (Without versus With surgery: 0.338, 95% CI 0.148-0.771, p = 0.010). After adjustment, we found no statistical significance between marriage, ER (-), AJCC stage, SEER stage, chemotherapy, radiotherapy and BCSD.
The Fine and Gray proportional subdistribution hazard model for breast cancer-specific death in patients with primary nonmetastatic male breast cancer.
| Characteristics | Coefficient | sHR | 95% CI | p |
|---|---|---|---|---|
| Race | ||||
| Black | Reference | |||
| White | -0.426 | 0.653 | 0.493-0.866 | 0.003** |
| Other | -0.308 | 0.735 | 0.432-1.252 | 0.260 |
| PR | ||||
| Negative | Reference | |||
| Positive | -0.376 | 0.687 | 0.516-0.915 | 0.010* |
| Other | -0.250 | 0.779 | 0.521-1.162 | 0.220 |
| Grade | ||||
| I | Reference | |||
| II | 0.603 | 1.828 | 1.116-2.993 | 0.017* |
| III/IV | 0.755 | 2.127 | 1.290-3.508 | 0.003** |
| AJCC-T | ||||
| T1 | Reference | |||
| T2 | 0.604 | 1.829 | 1.434-2.333 | <0.001*** |
| T3 | 1.185 | 3.269 | 1.946-5.492 | <0.001*** |
| T4 | 0.704 | 2.022 | 1.357-3.014 | <0.001*** |
| AJCC-N | ||||
| N0 | Reference | |||
| N1 | 0.692 | 1.999 | 1.519-2.629 | <0.001*** |
| N2 | 1.137 | 3.117 | 2.220-4.376 | <0.001*** |
| N3 | 1.616 | 5.032 | 3.531-7.170 | <0.001*** |
| Surgery treatment | ||||
| No | Reference | |||
| Yes | -1.084 | 0.338 | 0.148-0.771 | 0.010** |
Notes: sHR, subdistribution hazard ratio; CI, confidence interval; PR, progesterone receptor; AJCC, American Joint Committee on Cancer; *, p < 0.05; **, p < 0.01; ***, p < 0.001.
When it came to OCSD, age, marriage, AJCC stage and chemotherapy were found to be associated with survival outcomes. Consequently, advanced age, unmarried status and no chemotherapy resulted in OCSD more possibly (old versus young: 4.165, 95% CI 3.224-5.380, p < 0.001; unmarried versus married: 1.374, 95% CI 1.084-1.740, p = 0.009; with versus without chemotherapy: 0.602, 95% CI 0.464-0.780, p < 0.001). Advanced AJCC stage were related with more probability of OCSD events (II versus I: 1.767, 95% CI 1.354-2.310, p < 0.001; III versus I: 1.942, 95% CI 1.353-2.790, p < 0.001). No statistical significance was detected between race, PR (-), T status and OCSD.
Construction and validation of competing risk nomogram
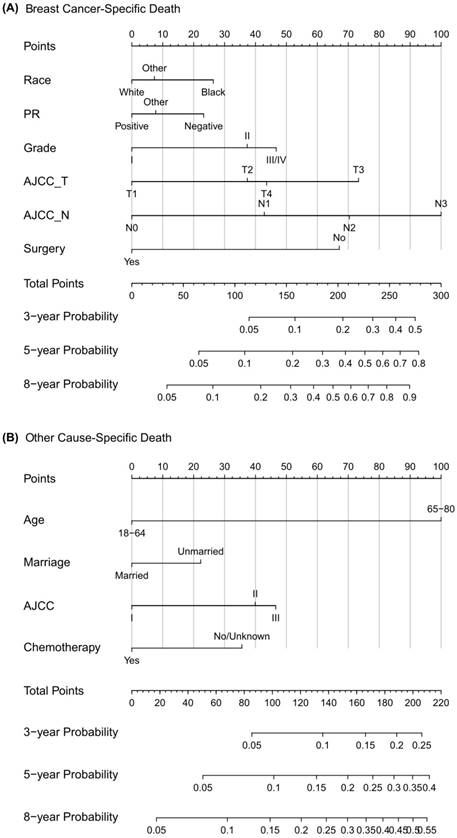
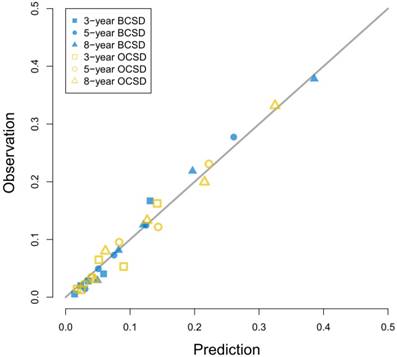
As Figure 3 showed, the competing risk nomogram based on the Fine and Gray model was established to predict the 3-year, 5-year and 8-year cumulative death probabilities. As for the competing risk nomogram based on the censoring weighted Cox model, it was similar to the one we built based on the Fine and Gray model, which was shown in Figure S1. As shown in Table S2 and Table S3, the coefficients from the two competing risk models fitted very well. For every patient, different variables pointed to a score according to the top scale, and we could get a total score by summing up all scores. The predictive cumulative probabilities of BCSD and OCSD at 3-year, 5-year and 8-year could be evaluated by the total score according to the bottom scale. The calibration curves for BCSD and OCSD were shown in Figure 4. It appeared that all the calibration curves were closed to the standard curves. For BCSD, the C-indexes and Brier scores were 0.753 and 0.083 at 5-year cutoff in the training cohort, as well as 0.811 and 0.032 in the testing cohort, respectively, demonstrating a great predicting ability. For OCSD, the accordingly C-indexes and Brier scores at 5-year were 0.723 and 0.084 in the training cohort, and 0.690 and 0.086 in the testing cohort. All the C-indexes and Brier scores of the competing risk nomogram at 3-year, 5-year and 8-year in the training and testing cohorts were shown in the Table S4. The established competing risk nomogram performed well in both internal and external validation.
Competing risk nomogram predicting 3-year, 5-year and 8-year cumulative probabilities for BCSD and OCSD in male patients with nonmetastatic breast cancer. Notes: (A) Breast cancer-specific death; (B) Other cause-specific death; PR, progesterone receptor; AJCC, American Joint Committee on Cancer; SEER, Surveillance, Epidemiology, and End Results.
Calibration curves for 3-year, 5-year and 8-year prediction. Notes: X-axes indicate predicted probabilities; Y-axes indicate actual observations; Boxes indicate 3-year death; Dots indicate 5-year death; Triangles indicate 8-year death; Blue dots indicate breast cancer-specific death; Yellow dots indicate other cause-specific death.
The Fine and Gray proportional subdistribution hazard model for other cause-specific death in patients with primary nonmetastatic male breast cancer.
| Characteristics | Coefficient | sHR | 95% CI | p |
|---|---|---|---|---|
| Age group | ||||
| Young | Reference | |||
| Old | 1.427 | 4.165 | 3.224-5.380 | <0.001*** |
| Marriage | ||||
| Married | Reference | |||
| Unmarried | 0.318 | 1.374 | 1.084-1.740 | 0.009** |
| AJCC stage | ||||
| I | Reference | |||
| II | 0.569 | 1.767 | 1.354-2.310 | <0.001*** |
| III | 0.664 | 1.942 | 1.353-2.790 | <0.001*** |
| Chemotherapy | ||||
| No | Reference | |||
| Yes | -0.508 | 0.602 | 0.464-0.780 | <0.001*** |
Notes: sHR, subdistribution hazard ratio; CI, confidence interval; AJCC, American Joint Committee on Cancer; Young, 18-64 years old; Old, 65-80 years old; *, p < 0.05; **, p < 0.01; ***, p < 0.001.
Discussion
In this study, we conducted a competing risk analysis based on 1,978 male patients with primary nonmetastatic breast cancer from the SEER database. Most patients were white, married, ER (+) or PR (+). Grade II, AJCC stage II, T1, N0 and SEER localized stage occupied the majority. CIF analysis showed the 5-year mortalities for BCSD and OCSD were 10.6% and 9.6%. After adjusting prognostic factors distinguished by CIF, the Fine and Gray proportional subdistribution hazard model found that black race, PR (-), advanced T status, advanced N status, advanced grade and no surgery were associated with BCSD. Likewise, advanced age, unmarried status, advanced AJCC stage and no chemotherapy resulted in OCSD more possibly. Then we utilized the independent predictive factors to create the 3-year, 5-year and 8-year nomogram for BCSD and OCSD. Whether in the training cohort or testing cohort, validation with bootstrap and cross-validation produced C-indexes nearly larger than 0.700 as well as Brier scores nearly smaller than 0.100, and the calibration curves performed well.
Competing risk events are common in clinical studies especially in oncology researches [8]. In survival analysis, a patient may be faced with more than two events, and he must suffer from only one of them. Once the final outcome happens to him, the other potential events will no longer take place [20]. However, in the widely-used Kaplan-Meier methods and Cox regression models, now that the interested event is confirmed, the other events will be regarded as censored observation [21]. The traditional survival calculation increases the crude incidence of the interested event, and overestimates its risk [19]. In 1988, Gray put forward a test for comparing CIF of a competing risk [14]. In 1999, Fine and Gray came up with the proportional subdistribution hazard model for competing events [15]. In the past 20 years, the Fine and Gray models became more and more popular in the biomedical studies [9, 22]. Froehner aimed at bladder cancer patients after radical cystectomy, and found that adjuvant chemotherapy decreased the overall mortality and cancer-specific mortality, but it was not associated with other competing event mortality [23]. Wei investigated the probabilities of lung cancer-specific death and non-lung cancer deaths for non-small cell lung cancer patients, and found that most patients died from lung cancer, which suggested early detection and surgical treatment [24].
Breast cancer in male is a rare disease. Most studies about MBC contain small sample sizes, making it unavailable for investigation. Here the SEER database supplies a relatively large sample for clinicians to discover prognostic factors [25]. Our study finds that racial disparity plays an important role in the survival prognosis of BCSD for primary nonmetastatic MBC, which is in consistency with previous research [26]. It is mainly due to higher rates of triple-negative breast cancer and lower rates of HR(+)/HER2(-) breast cancer in black race versus white [27]. Compared with white people, black people always lack the screening history and consultation with oncologists, and they are more likely to reject adjuvant chemotherapy after surgery [26, 28]. Breast cancer patients with ER (+) or PR (+) are considered as hormone-receptor positive, which are more sensitive to hormone therapy than hormone-receptor negative. Hormone therapy after conventional surgery, chemotherapy and radiotherapy prevent the recurrence by blocking the hormones. In our study, PR (-) represents more danger of BCSD than PR (+), but after adjustment the impact of ER status on BCSD disappears. We find that advanced T status, advanced N status and advanced grade die of breast cancer more probably, which is in line with other studies [29]. Nowadays, primary surgery is still the first-line treatment for male breast cancer. Our research shows that surgical treatment affects the risk of BCSD. In our study, chemotherapy and radiotherapy also do not affect the BCSD. It may be because patients requiring surgery, chemotherapy or radiotherapy tend to be more advanced, so the benefits of chemotherapy or radiotherapy are covered [30].
OCSD means death due to causes other than breast cancer, including cardiovascular disease, respiratory disease, diabetes mellitus and so on. In our study, advanced age and unmarried status lead to OCSD more possibly, which is in agreement with previous studies [31]. Older age means a significant decline in bodily functions and the resulting worse compensatory capabilities. Thus, advanced age is the predominant factor affecting OCSD [31]. A married status brought a comfortable, confident and enjoyable emotional state. The married patients always come with social support from family and good family financial circumstances [21].
In our study, we found that male patients with primary nonmetastatic breast cancer were generally old, with an average age of 62 years old. As for OCSD, age was the most predominant predictive factor. Consequently, for very old patients with MBC, the competing events of death may decrease the risk of BCSD. So the cumulative incidence of BCSD based on the Gray method will be underestimated. To prevent this, we excluded patients older than 80 years old during the screening process, but the underestimated risk of BCSD in the old patient cohort may still persist in this study.
This study is the first one to set up a competing risk nomogram to predict BCSD and OCSD in patients with nonmetastatic MBC. As the highlight of our study, the nomogram could be quickly applied to clinical practice. When a male patient diagnosed with primary nonmetastatic breast cancer comes for consultation, we can predict his clinical prognosis according to his own characteristics. For example, this is a white man just receiving surgical treatment not long ago, with PR (-), grade III, SEER regional stage, T4 and N0. Then from the nomogram graph we will make an estimation that the 3-year, 5-year and 8-year mortalities due to breast cancer are 6%, 15% and 25%. Moreover, this patient is a 50-year-old married man, who decides not to receive regular chemotherapy. Consistent with the competing risk nomogram, we will predict that the 3-year, 5-year and 8-year probabilities of OCSD are 4%, 7% and 12%. As seen, the graphical nomogram takes all the prognostic factors into account, and it may sometimes behave more accurately than the conventional TNM staging system. Competing risk nomogram is also applied to other cancers, including thyroid cancer, prostate cancer, sarcoma, and it exhibits excellent predictive performance [19, 32, 33].
In addition, limitations exist in this study and interfere with the results. Firstly, the demographic and clinical information provided by the SEER database is not complete. Over 1,000 individuals were excluded because of unknown demographic and clinical data. It may destroy the whole data structure, and result in selection bias. Secondly, the database lacks detailed treatment records like surgery, chemotherapy and radiotherapy information. Different specific surgeries and chemotherapies influence survival outcomes. As the time goes, the endocrine therapy has become more and more important in the comprehensive treatment of MBC patients. However, the SEER database doesn't have specific information about adjuvant endocrine therapy, which would lead to biases. Unfortunately, the SEER database did not collect HER2 data until 2010. So the HER2 variable was missing between 1996 and 2009. Thirdly, the OCSD, as the competing event of BCSD, still contains a lot of competing events. In this study, we just regarded them as a whole, which might overstate the impact as OCSD. But separating them into minute events will make it difficult for analysis because of the small sample size for each event. Fourthly, besides OCSD and BCSD, clinicians care about many other outcomes including tumor progression and metastasis, which accelerate the patient death. However, those are not contained in the SEER follow-up information. Additionally, we used internal bootstrap and cross-validation to validate the competing risk nomogram. But methodologically it will be better if external validation from another dataset is available. Thus, more studies are necessary to prove our results in the future.
In conclusion, we performed a competing risk analysis in patients with primary nonmetastatic MBC based on the SEER database. We also discovered independent predictive factors of BCSD and OCSD, and built a nomogram. The nomogram showed accuracy to classify high-risk mortality patients. Altogether, the competing risk nomogram might act as a useful implement for clinicians to evaluate crude mortalities of BCSD and OCSD, and help to choose appropriate treatment strategies.
Abbreviations
MBC: male breast cancer; SEER: the Surveillance, Epidemiology, and End Results; OCSD: other cause-specific death; BCSD: breast cancer-specific death; CIF: cumulative incidence function; ICD-O-3: international Classification of Diseases for Oncology, Third Edition; AJCC: american Joint Committee on Cancer; ER: estrogen receptor; PR: progesterone receptor; HER2: human epidermal growth factor receptor 2; TNM: tumor node metastasis; C-index: concordance index; sHR: subdistribution hazard ratio; CI: confidence interval.
Supplementary Material
Supplementary figure and tables.
Acknowledgements
The authors acknowledge the efforts of the Surveillance, Epidemiology, and End Results Program tumor registries for the creation and maintenance of the open database.
Competing Interests
The authors have declared that no competing interest exists.
References
1. Siegel RL, Miller KD, Jemal A. Cancer statistics, 2018. CA: a cancer journal for clinicians. 2018;68:7-30
2. Fentiman IS, Fourquet A, Hortobagyi GN. Male breast cancer. Lancet (London, England). 2006;367:595-604
3. Ly D, Forman D, Ferlay J, Brinton LA, Cook MB. An international comparison of male and female breast cancer incidence rates. International journal of cancer. 2013;132:1918-26
4. Iorfida M, Bagnardi V, Rotmensz N, Munzone E, Bonanni B, Viale G. et al. Outcome of male breast cancer: a matched single-institution series. Clinical breast cancer. 2014;14:371-7
5. Rizzolo P, Silvestri V, Tommasi S, Pinto R, Danza K, Falchetti M. et al. Male breast cancer: genetics, epigenetics, and ethical aspects. Annals of oncology: official journal of the European Society for Medical Oncology. 2013;24(Suppl 8):viii75-viii82
6. Giordano SH, Cohen DS, Buzdar AU, Perkins G, Hortobagyi GN. Breast carcinoma in men: a population-based study. Cancer. 2004;101:51-7
7. Anderson WF, Jatoi I, Tse J, Rosenberg PS. Male breast cancer: a population-based comparison with female breast cancer. Journal of clinical oncology: official journal of the American Society of Clinical Oncology. 2010;28:232-9
8. Dignam JJ, Zhang Q, Kocherginsky M. The use and interpretation of competing risks regression models. Clinical cancer research: an official journal of the American Association for Cancer Research. 2012;18:2301-8
9. Shen W, Sakamoto N, Yang L. Model to Predict Cause-Specific Mortality in Patients with Head and Neck Adenoid Cystic Carcinoma: A Competing Risk Analysis. Annals of surgical oncology. 2017;24:2129-36
10. Wan BA, Ganesh V, Zhang L, Sousa P, Drost L, Lorentz J. et al. Treatment Outcomes in Male Breast Cancer: A Retrospective Analysis of 161 Patients. Clinical oncology (Royal College of Radiologists (Great Britain)). 2018;30:354-65
11. Hayat MJ, Howlader N, Reichman ME, Edwards BK. Cancer statistics, trends, and multiple primary cancer analyses from the Surveillance, Epidemiology, and End Results (SEER) Program. The oncologist. 2007;12:20-37
12. Hankey BF, Ries LA, Edwards BK. The surveillance, epidemiology, and end results program: a national resource. Cancer epidemiology, biomarkers & prevention: a publication of the American Association for Cancer Research, cosponsored by the American Society of Preventive Oncology. 1999;8:1117-21
13. Zhang Z. Univariate description and bivariate statistical inference: the first step delving into data. Annals of translational medicine. 2016;4:91
14. Gray RJ. A Class of K-Sample Tests for Comparing the Cumulative Incidence of a Competing Risk. The Annals of Statistics. 1988;16:1141-54
15. Fine JP, Gray RJ. A Proportional Hazards Model for the Subdistribution of a Competing Risk. Journal of the American Statistical Association. 1999;94:496-509
16. Scrucca L, Santucci A, Aversa F. Regression modeling of competing risk using R: an in depth guide for clinicians. Bone marrow transplantation. 2010;45:1388-95
17. Zhang Z, Geskus RB, Kattan MW, Zhang H, Liu T. Nomogram for survival analysis in the presence of competing risks. Annals of translational medicine. 2017;5:403
18. Wolbers M, Koller MT, Witteman JC, Steyerberg EW. Prognostic models with competing risks: methods and application to coronary risk prediction. Epidemiology (Cambridge, Mass). 2009;20:555-61
19. Kattan MW, Heller G, Brennan MF. A competing-risks nomogram for sarcoma-specific death following local recurrence. Statistics in medicine. 2003;22:3515-25
20. Scrucca L, Santucci A, Aversa F. Competing risk analysis using R: an easy guide for clinicians. Bone marrow transplantation. 2007;40:381-7
21. Sun W, Qiu Z, Tan W, Liu Z, Wang Z, Huang W. et al. The influence of marital status on survival in patients with oral tongue squamous cell carcinoma. Oncotarget. 2017;8:82092-102
22. Roobol MJ, Heijnsdijk EA. Propensity score matching, competing risk analysis, and a competing risk nomogram: some guidance for urologists may be in place. European urology. 2011;60:931-3 discussion 3-4
23. Froehner M, Koch R, Heberling U, Novotny V, Oehlschlaeger S, Hubler M. et al. Decreased Overall and Bladder Cancer-Specific Mortality with Adjuvant Chemotherapy After Radical Cystectomy: Multivariable Competing Risk Analysis. European urology. 2016;69:984-7
24. Wei S, Tian J, Song X, Wu B, Liu L. Causes of death and competing risk analysis of the associated factors for non-small cell lung cancer using the Surveillance, Epidemiology, and End Results database. Journal of cancer research and clinical oncology. 2018;144:145-55
25. DeSantis CE, Kramer JL, Jemal A. The burden of rare cancers in the United States. CA: a cancer journal for clinicians. 2017;67:261-72
26. Crew KD, Neugut AI, Wang X, Jacobson JS, Grann VR, Raptis G. et al. Racial disparities in treatment and survival of male breast cancer. Journal of clinical oncology: official journal of the American Society of Clinical Oncology. 2007;25:1089-98
27. Clarke CA, Keegan TH, Yang J, Press DJ, Kurian AW, Patel AH. et al. Age-specific incidence of breast cancer subtypes: understanding the black-white crossover. Journal of the National Cancer Institute. 2012;104:1094-101
28. Jones BA, Kasl SV, Curnen MG, Owens PH, Dubrow R. Can mammography screening explain the race difference in stage at diagnosis of breast cancer? Cancer. 1995;75:2103-13
29. Leone JP, Zwenger AO, Iturbe J, Leone J, Leone BA, Vallejo CT. et al. Prognostic factors in male breast cancer: a population-based study. Breast cancer research and treatment. 2016;156:539-48
30. Dubal PM, Unsal AA, Chung SY, Patel AV, Park RC, Baredes S. et al. Population-based trends in outcomes in adenoid cystic carcinoma of the oral cavity. American journal of otolaryngology. 2016;37:398-406
31. Fu J, Wu L, Jiang M, Li D, Jiang T, Fu W. et al. Real-world impact of non-breast cancer-specific death on overall survival in resectable breast cancer. Cancer. 2017;123:2432-43
32. Ho AS, Wang L, Palmer FL, Yu C, Toset A, Patel S. et al. Postoperative Nomogram for Predicting Cancer-Specific Mortality in Medullary Thyroid Cancer. Annals of surgical oncology. 2015;22:2700-6
33. Brockman JA, Alanee S, Vickers AJ, Scardino PT, Wood DP, Kibel AS. et al. Nomogram Predicting Prostate Cancer-specific Mortality for Men with Biochemical Recurrence After Radical Prostatectomy. European urology. 2015;67:1160-7
Author contact
![]() Corresponding author: Zeting Qiu; Department of Anesthesiology, The First Affiliated Hospital of Shantou University Medical College, 57th Changping Road, Shantou, Guangdong, People's Republic of China; +86-13580546462; Email: doctorqiuztcom
Corresponding author: Zeting Qiu; Department of Anesthesiology, The First Affiliated Hospital of Shantou University Medical College, 57th Changping Road, Shantou, Guangdong, People's Republic of China; +86-13580546462; Email: doctorqiuztcom