Impact Factor ISSN: 1837-9664

 Global reach, higher impact
J Cancer 2019; 10(2):313-322. doi:10.7150/jca.26882 This issue Cite
Research Paper
Prognostic Value of the Tumor Size in Resectable Colorectal Cancer with Different Primary Locations: A Retrospective Study with the Propensity Score Matching
Xiao Li1,2, Bang An3, Jincai Ma1,4, Bo He1,2, Jianni Qi2,5, Wenwen Wang1,2, Chengyong Qin1,2,6, Qi Zhao1,2 ![]()
1. Department of Gastroenterology, Shandong Provincial Hospital Affiliated to Shandong University, Jinan 250021, Shandong Province, China;
2. Shandong Provincial Engineering and Technological Research Center for Liver Diseases Prevention and Control, Jinan 250021, Shandong Province, China;
3. Department of Cardiology, Central Hospital of Zibo, Zibo 255036, Shandong Province, China;
4. Department of Gastroenterology, The Fifth People's Hospital of Jinan, Jinan 250022, Shandong Province, China;
5. Central Laboratory, Shandong Provincial Hospital Affiliated to Shandong University, Jinan 250021, Shandong Province, China;
6. Health Commission of Shandong Province, Jinan 250014, Shandong Province, China.
Received 2018-4-25; Accepted 2018-10-3; Published 2019-1-1
Abstract
Objective: To investigate the prognostic value of the tumor size in colorectal cancer (CRC) patients with different primary tumor locations.
Patients and methods: We retrospectively recruited 3971 stage I-III CRC patients with curative resection. The propensity score matching technique was conducted to reduce the selection bias, producing a propensity score matched cohort of 1347 pairs of patients based on the tumor size (≤4 cm and >4 cm groups). Kaplan-Meier survival analyses and univariate and multivariate analyses were used to compare the overall survival (OS), cancer-specific survival (CSS) and disease-free survival (DFS) between the two groups. Subgroup analyses which were stratified by primary tumor locations and several other baseline variables were also performed for conformation.
Results: In the propensity score matched cohort, the Kaplan-Meier survival curves revealed that patients with a tumor size less than 4 cm had similar OS, CSS and DFS, compared to patients with a tumor size greater than 4 cm. While in multivariate analyses, the smaller tumor size was an independent risk factor for CSS (HR, 1.275; 95% CI, 1.006-1.616; P=0.045). Subgroup analyses based on primary tumor locations further suggested that the smaller tumor size was significantly associated with worse OS (HR, 2.455; 95% CI, 1.297-4.649; P=0.006) and CSS (HR, 2.493; 95% CI, 1.202-5.174; P=0.014) in patients with right-side colon cancers (RCC).
Conclusions: Our propensity matching score study indicated that the smaller tumor size was an independent risk factor for CSS in patients with stage I-III CRC, and for OS and CSS in patients with RCC.
Keywords: tumor size, primary tumor location, colorectal cancer, prognosis, propensity score matching
Introduction
Colorectal cancer (CRC) is the third most commonly diagnosed cancer and a leading cause of cancer-related mortality over the world [1, 2]. During the past decades, there are dramatic development in the therapeutic strategies against CRC, including surgery, molecular-target therapy, adjuvant chemotherapy and radiotherapy. However, a large percentage of patients still succumb to CRC due to the high rate of recurrence and distant metastases [3]. Thus, identification of appropriate prognostic markers is of great importance for decision-making in CRC patients.
The tumor-node-metastasis (TNM) staging system, as the golden standard for various types of cancer, is widely used for evaluating the prognosis of patients with malignancies [4]. The tumor size, defined as the widest horizontal diameter of tumors, plays significant roles in determining the T stage of several solid tumors such as breast [5], renal [6] and lung cancers [7]. However, the tumor size was not involved in the TNM staging system of CRC and was reported to have no effects on clinical outcomes in a series of studies [8, 9]. Recently, several researches revealed that larger tumor size was significantly associated with complications, metastasis, high recurrence and poor prognosis of CRC [10-13], whereas several other studies showed that patients with smaller tumor size had worse prognosis [14-16]. Thus, whether the tumor size is a prognostic indicator and the exact roles of the tumor size on the prognosis and recurrence in CRC patients remain controversial and need further investigation.
Though many efforts have been made to verify the prognostic value of tumor size in CRC, no consensus has been reached and few previous studies have taken the primary tumor location into consideration. CRC was traditionally classified into three subgroups according to the primary tumor location, including the right-side colon cancers (RCC, cecum to transverse), the left-side colon cancers (LCC, splenic flexure to rectosigmoid) and the rectal cancers (RECC, rectum) [17]. Accumulating evidence has demonstrated that CRC characterized differently in accordance with primary tumor locations, including epidemiology, pathological features and clinical outcomes [18-21]. Therefore, the effect of primary tumor locations should not be overlooked when evaluating the prognostic value of the tumor size.
In addition, selection bias could not be neglected in these retrospective studies, which may influence the results and conclusions. The propensity score matching (PSM) technique is a statistical matching method in which each case is matched with one or more control cases according to the propensity scores. The technique is usually used to reduce the selection bias of observational studies [22, 23].
In the present study, we hypothesized that clinical outcomes in CRC patients with different tumor sizes were distinct. To reduce the selection bias of the retrospective study, we used propensity score matching to get a cohort of 1347 pairs of CRC patients. Then we analyzed whether the tumor size had effects on the overall survival (OS), cancer specific survival (CSS) and disease-free survival (DFS) of CRC patients with different primary tumor locations.
Material and methods
Ethics approval and informed consent
This study was approved by the medical ethics committee of Shandong Provincial Hospital Affiliated to Shandong University (NO. 2017-234). Written informed consent was obtained from all patients included in this study.
Patient selection
A total of 3971 CRC patients were retrospectively collected at Shandong Provincial Hospital Affiliated to Shandong University between March 2000 and July 2016. Eligible patients met the following standards: (1) Patients who undergone radical surgery; (2) patients who had pathologically confirmed colorectal cancer; and (3) patients with stage I, II or III CRC. Patients who met one of the following situations were excluded: (1) patients who had received neoadjuvant chemotherapy or radiotherapy; (2) patients who had synchronous distant metastases at diagnosis; (3) patients with more than one primary CRCs; and (4) patients with unknown tumor size or tumor location. All patients were staged by the seventh edition of the American Joint Committee on Cancer (AJCC) Cancer Staging Manual.
Data collection and follow up
Baseline characteristics were obtained from the medical database as previously described [24], including the age, sex, tumor location, tumor size, tumor differentiation, morphological subtype, histological subtype, venous invasion, perineural invasion and tumor deposits. The tumor size was determined during histopathology and was divided into two groups: larger than 4 cm and smaller than 4 cm. The division of tumor size into variables was partly empiric and in accordance with previous research [25]. The primary tumor location was defined as the RCC, LCC and RECC.
The OS, CSS and DFS were chosen as principle outcomes and the follow-up was conducted as previously described [26]. The OS represented the time between the initial surgical resection and death of any causes; the CSS was considered as the time from the initial surgical treatment to death due to CRC; and the DFS was defined as the period from the initial surgical resection to the recurrence or metastasis or death. Censors were defined when patients were still alive at the last follow-up.
Propensity score matching
As a retrospective study, the present research suffered from selection bias inevitably due to unbalanced baseline characteristics. Thus, we conducted the propensity score matching study to reduce the selection bias. Briefly, the propensity scores of all cases were calculated by a logistic regression model, in which the tumor size was considered as the dependent variable with regard to all clinicopathological covariates presented in Table 1. Patients with smaller tumor sizes were matched to those with larger tumor sizes according to propensity scores by the nearest neighbor matching without replacement at 1:1 fixed ratio. After matching, the standardized mean differences of each of the covariates were applied to compare the balance of the matched cohort.
Comparison of demographic and clinicopathological features between the two groups according to the tumor size before and after propensity score matching.
| Features | Before propensity score matching | After propensity score matching | ||||||
|---|---|---|---|---|---|---|---|---|
| Tumor size | All | P* | Tumor size | All | P* | |||
| ≤4cm | >4cm | ≤4cm | >4cm | |||||
| N=1625 | N=2346 | N=3971 | N=1347 | N=1347 | N=2694 | |||
| Gender | ||||||||
| Male | 931(57.3%) | 1460(62.2%) | 2391(60.2%) | 0.002 | 783(58.1%) | 815(60.5%) | 1598(59.3%) | 0.209 |
| Female | 694(42.7%) | 886(37.8%) | 1580(39.8%) | 564(41.9%) | 532(39.5%) | 1096(40.7%) | ||
| Age | ||||||||
| <50 | 345(21.2%) | 533(22.7%) | 878(22.1%) | 0.568 | 299(22.2%) | 260(19.3%) | 559(20.7%) | 0.244 |
| 51-65 | 725(44.6%) | 1003(42.8%) | 1728(43.5%) | 583(43.3%) | 610(45.3%) | 1193(44.3%) | ||
| 66-75 | 405(24.9%) | 581(24.8%) | 986(24.8%) | 329(24.4%) | 349(25.9%) | 678(25.2%) | ||
| >75 | 150(9.2%) | 229(9.8%) | 379(9.5%) | 136(10.1%) | 128(9.5%) | 264(9.8%) | ||
| Differentiation | ||||||||
| Well | 41(2.5%) | 42(1.8%) | 83(2.1%) | <0.001 | 21(1.6%) | 27(2.0%) | 48(1.8%) | 0.704 |
| Moderate | 1297(79.8%) | 1650(70.3%) | 2947(74.2%) | 1076(79.9%) | 1055(78.3%) | 2131(79.1%) | ||
| Poor | 211(13%) | 438(18.7%) | 649(16.3%) | 181(13.4%) | 193(14.3%) | 374(13.9%) | ||
| Unknown | 76(4.7%) | 216(9.2%) | 292(7.4%) | 69(5.1%) | 72(5.3%) | 141(5.2%) | ||
| Histological type | ||||||||
| Non-mucinous | 1463(90%) | 1907(81.3%) | 3370(84.9%) | <0.001 | 1189(88.3%) | 1199(89%) | 2388(88.6%) | 0.544 |
| Mucinous | 162(10%) | 439(18.7%) | 601(15.1%) | 158(11.7%) | 148(11%) | 306(11.4%) | ||
| T stage | ||||||||
| 1 | 101(6.2%) | 16(0.7%) | 117(2.9%) | <0.001 | 20(1.5%) | 16(1.2%) | 36(1.3%) | 0.079 |
| 2 | 437(26.9%) | 216(9.2%) | 653(16.4%) | 241(17.9%) | 206(15.3%) | 447(16.6%) | ||
| 3 | 363(22.3%) | 664(28.3%) | 1027(25.9%) | 362(26.9%) | 414(30.7%) | 776(28.8%) | ||
| 4 | 724(44.6%) | 1450(61.8%) | 2174(54.7%) | 724(53.7%) | 711(52.8%) | 1435(53.3%) | ||
| N stage | ||||||||
| 0 | 982(60.4%) | 1332(56.8%) | 2314(58.3%) | 0.047 | 760(56.4%) | 770(57.2%) | 1530(56.8%) | 0.551 |
| 1 | 390(24%) | 592(25.2%) | 982(24.7%) | 351(26.1%) | 328(24.4%) | 679(25.2%) | ||
| 2 | 253(15.6%) | 422(18%) | 675(17%) | 236(17.5%) | 249(18.5%) | 485(18%) | ||
| TNM stage | ||||||||
| I | 415(25.5%) | 198(8.4%) | 613(15.4%) | <0.001 | 194(14.4%) | 189(14%) | 383(14.2%) | 0.822 |
| II | 565(34.8%) | 1131(48.2%) | 1696(42.7%) | 564(41.9%) | 580(43.1%) | 1144(42.5%) | ||
| III | 645(39.7%) | 1017(43.4%) | 1662(41.9%) | 589(43.7%) | 578(42.9%) | 1167(43.3%) | ||
| Morphological type | ||||||||
| Expansive | 382(23.5%) | 398(17%) | 780(19.6%) | <0.001 | 223(16.6%) | 233(17.3%) | 456(16.9%) | 0.784 |
| Infiltrative | 29(1.8%) | 57(2.4%) | 86(2.2%) | 26(1.9%) | 27(2%) | 53(2%) | ||
| ulcerative | 1204(74.1%) | 1864(79.5%) | 3068(77.3%) | 1089(80.8%) | 1074(79.7%) | 2163(80.3%) | ||
| complex | 10(0.6%) | 27(1.2%) | 37(0.9%) | 9(0.7%) | 13(1%) | 22(0.8%) | ||
| Location | ||||||||
| RCC | 165(10.2%) | 568(24.2%) | 733(18.5%) | <0.001 | 164(12.2%) | 167(12.4%) | 331(12.3%) | 0.067 |
| LCC | 310(19.1%) | 459(19.6%) | 769(19.4%) | 279(20.7%) | 232(17.2%) | 511(19%) | ||
| RECC | 1150(70.8%) | 1319(56.2%) | 2469(62.2%) | 904(67.1%) | 948(70.4%) | 1852(68.7%) | ||
| Venous invasion | ||||||||
| Positive | 32(2%) | 57(2.4%) | 89(2.2%) | 0.335 | 29(2.2%) | 38(2.8%) | 67(2.5%) | 0.266 |
| Negative | 1593(98%) | 2289(97.6%) | 3883(97.8%) | 1318(97.8%) | 1309(97.2%) | 2627(97.5%) | ||
| Perineural invasion | ||||||||
| Positive | 28(1.7%) | 45(1.9%) | 73(1.8%) | 0.653 | 28(2.1%) | 29(2.2%) | 57(2.1%) | 0.893 |
| Negative | 1597(98.3%) | 2301(98.1%) | 3898(98.2%) | 1319(97.9%) | 1138(97.8%) | 2637(97.9%) | ||
| Tumor deposits | ||||||||
| Present | 49(3%) | 91(3.9%) | 140(3.5%) | 0.147 | 44(3.3%) | 49(3.6%) | 93(3.5%) | 0.598 |
| Absent | 1576(97%) | 2255(96.1%) | 3831(96.5%) | 1303(96.7%) | 1298(96.4%) | 2601(96.5%) | ||
*P-values were calculated by the χ2-test. The P-value for significance was <0.05.
Statistics analysis
Frequencies and percentages were used to present categorical variables, while the median and range were applied to present continuous variables. Differences among baseline characteristics stratified by the tumor size or the primary tumor location were detected by the chi-square test (χ²) test and the Fisher's exact test. The Kaplan-Meier survival curves were applied to compare the OS, CSS and DFS between the two groups based on the tumor size, which were tested by the log-rank test. Multivariate proportional hazards regression models were utilized by adjusting for the simultaneous impact of potential confounders which were correlated with survival rates in univariate analyses (P<0.1). Additionally, hazard ratios (HRs) with 95% confidence intervals (CIs) were calculated. All statistical analyses were performed by IBM SPSS statistical package 22.0 (IBM, Armonk, NY, USA) and statistically significance was defined as a two-sided P<0.05.
Results
Patients' characteristics before the propensity score matching
The clinicopathological characteristics were summarized in Table 1. Of the 3971 stage I-III CRC patients recruited in this study, 40.92% were smaller than 4 cm and 59.08% were larger than 4 cm in diameter. Proportions of the RCC, LCC and RECC were 18.5%, 19.4% and 62.2%, respectively. Significant differences were observed between the two groups based on the tumor size regarding the gender (P=0.002), differentiation (P<0.001), histological subtype (P<0.001), T stage (P<0.001), N stage (P=0.047), TNM stage (P<0.001), morphological subtype (P<0.001) and tumor location (P<0.001).
Compared to patients with smaller tumor sizes, patients with larger tumor sizes were significantly associated with male (62.2% vs. 57.3%), poor differentiation (18.7% vs. 13%), the mucinous subtype (18.7% vs. 10%), T4 stage (61.8% vs. 44.6%), N2 stage (18% vs. 15.6%) and RCC (24.2% vs. 10.2%).
Patients' characteristics after the propensity score matching
After the propensity score matching technique, the clinicopathological features were presented in Table 1. In the propensity score matched cohort (2694 patients), no significant differences were observed between the two groups with respect to age, gender, tumor differentiation, histological subtype, T stage, N stage, TNM stage, tumor location, morphological subtype, venous invasion, perineural invasion and tumor deposits (all, P>0.05).
Separate clinicopathological features among three primary tumor locations
Baseline characteristics stratified by the primary tumor location were shown in Table 2. Compared to patients with LCC and RECC, RCC patients were more likely to be female (49.5% vs. 34.4% and 40.8%, respectively) and elderly (age of >65 years: 43.8% vs. 39.3% and 32.2%, respectively). RCC patients exhibited a lower frequency of stage I tumors (6.9% vs. 9.6% and 16.8%, respectively) and higher frequencies of poorly differentiated tumors (15.1% vs.13.5% and 13.8%, respectively), the infiltrative subtype (4.2% vs. 2.3% and 1.5%, respectively), and the mucinous subtype (22.1% vs.10.2% and 9.8%, respectively).
Comparison of baseline characteristics between the two groups according to the tumor size stratified by primary tumor location after propensity score matching.
| Features | RCC | P* | LCC | P* | RECC | P* | |||
|---|---|---|---|---|---|---|---|---|---|
| ≤4cm | >4cm | ≤4cm | >4cm | ≤4cm | >4cm | ||||
| (N=164) | (N=167) | (N=279) | (N=232) | (N=904) | (N=948) | ||||
| Gender | |||||||||
| Male | 82(50%) | 85(50.9%) | 0.870 | 185(66.3%) | 150(64.7%) | 0.695 | 516(57.1%) | 580(61.2%) | 0.073 |
| Female | 82(50%) | 82(49.1%) | 94(33.7%) | 82(35.3%) | 388(42.9%) | 368(38.8%) | |||
| Age | |||||||||
| <50 | 37(22.6%) | 34(20.4%) | 0.722 | 56(20.1%) | 53(22.8%) | 0.396 | 206(22.8%) | 173(18.2%) | 0.117 |
| 51-65 | 52(31.7%) | 63(37.7%) | 116(41.6%) | 85(36.6%) | 415(45.9%) | 462(48.7%) | |||
| 66-75 | 52(31.7%) | 49(29.3%) | 71(25.4%) | 70(30.2%) | 206(22.8%) | 230(24.3%) | |||
| >75 | 23(14%) | 21(12.6%) | 36(12.9%) | 24(10.3%) | 77(8.5%) | 83(8.8%) | |||
| Differentiation | |||||||||
| Well | 4(2.4%) | 2(1.2%) | 0.067 | 9(3.2%) | 5(2.2%) | 0.312 | 8(0.9%) | 20(2.1%) | 0.147 |
| Moderate | 128(78%) | 113(67.7%) | 225(80.6%) | 180(77.6%) | 723(80%) | 762(80.4%) | |||
| Poor | 21(12.8%) | 29(17.4%) | 31(11.1%) | 38(16.4%) | 129(14.3%) | 126(13.3%) | |||
| Unknown | 11(6.7%) | 23(13.8%) | 14(5%) | 9(3.9%) | 44(4.9%) | 40(4.2%) | |||
| Histological type | |||||||||
| Non-mucinous | 133(81.1%) | 125(74.9%) | 0.170 | 250(89.6%) | 209(90.1%) | 0.858 | 806(89.2%) | 865(91.2%) | 0.131 |
| Mucinous | 31(18.9%) | 42(25.1%) | 29(10.4%) | 23(9.9%) | 98(10.8%) | 83(8.8%) | |||
| T stage | |||||||||
| 1 | 1(0.6%) | 2(1.2%) | 0.286 | 6(2.2%) | 0(0%) | 0.101 | 13(1.4%) | 14(1.5%) | 0.282 |
| 2 | 15(9.1%) | 9(5.4%) | 34(12.2%) | 23(9.9%) | 192(21.2%) | 174(18.4%) | |||
| 3 | 37(22.6%) | 50(29.9%) | 80(28.7%) | 75(32.3%) | 245(27.1%) | 289(30.5%) | |||
| 4 | 111(67.7%) | 106(63.5%) | 159(57%) | 134(57.8%) | 454(50.2%) | 471(49.7%) | |||
| N stage | |||||||||
| 0 | 106(64.6%) | 99(59.3%) | 0.335 | 156(55.9%) | 142(61.2%) | 0.478 | 498(55.1%) | 529(55.8%) | 0.343 |
| 1 | 32(19.5%) | 44(26.3%) | 79(28.3%) | 57(24.6%) | 240(26.5%) | 227(23.9%) | |||
| 2 | 26(15.9%) | 24(14.4%) | 44(15.8%) | 33(14.2%) | 166(18.4%) | 192(20.3%) | |||
| TNM stage | |||||||||
| I | 14(8.5%) | 9(5.4%) | 0.357 | 28(10%) | 21(9.1%) | 0.367 | 152(16.8%) | 159(16.8%) | 0.902 |
| II | 92(56.1%) | 89(53.3%) | 128(45.9%) | 121(52.2%) | 344(38.1%) | 370(39%) | |||
| III | 58(35.4%) | 69(41.3%) | 123(44.1%) | 90(38.8%) | 408(45.1%) | 419(44.2%) | |||
| Morphological type | |||||||||
| Expansive | 28(17.1%) | 36(21.6%) | 0.207 | 45(16.1%) | 40(17.2%) | 0.428 | 150(16.6%) | 157(16.6%) | 0.790 |
| Infiltrative | 5(3%) | 9(5.4%) | 9(3.2%) | 3(1.3%) | 12(1.3%) | 15(1.6%) | |||
| ulcerative | 131(79.9%) | 120(71.9%) | 222(79.6%) | 188(81%) | 736(81.4%) | 766(80.8%) | |||
| complex | 0(0%) | 2(1.2%) | 3(1.1%) | 1(0.4%) | 6(0.7%) | 10(1.1%) | |||
| Venous invasion | |||||||||
| Negative | 161(98.2%) | 163(97.6%) | 1.000 | 273(97.8%) | 224(96.6%) | 0.371 | 884(97.8%) | 922(97.3%) | 0.464 |
| Positive | 3(1.8%) | 4(2.4%) | 6(2.2%) | 8(3.4%) | 20(2.2%) | 26(2.7%) | |||
| Perineural invasion | |||||||||
| Negative | 161(98.2%) | 164(98.2%) | 1.000 | 274(98.2%) | 225(97%) | 0.363 | 884(97.8%) | 929(98%) | 0.755 |
| Positive | 3(1.8%) | 3(1.8%) | 5(1.8%) | 7(3%) | 20(2.2%) | 19(2%) | |||
| Tumor deposits | |||||||||
| Absent | 157(95.7%) | 162(97%) | 0.535 | 271(97.1%) | 216(93.1%) | 0.032 | 875(96.8%) | 920(97%) | 0.751 |
| Present | 7(4.3%) | 5(3%) | 8(2.9%) | 16(6.9%) | 29(3.2%) | 28(3%) | |||
*P-values were calculated by the χ2-test or the Fisher's exact test. The P-value for significance was <0.05.
The Kaplan-Meier survival analyses after the propensity score matching
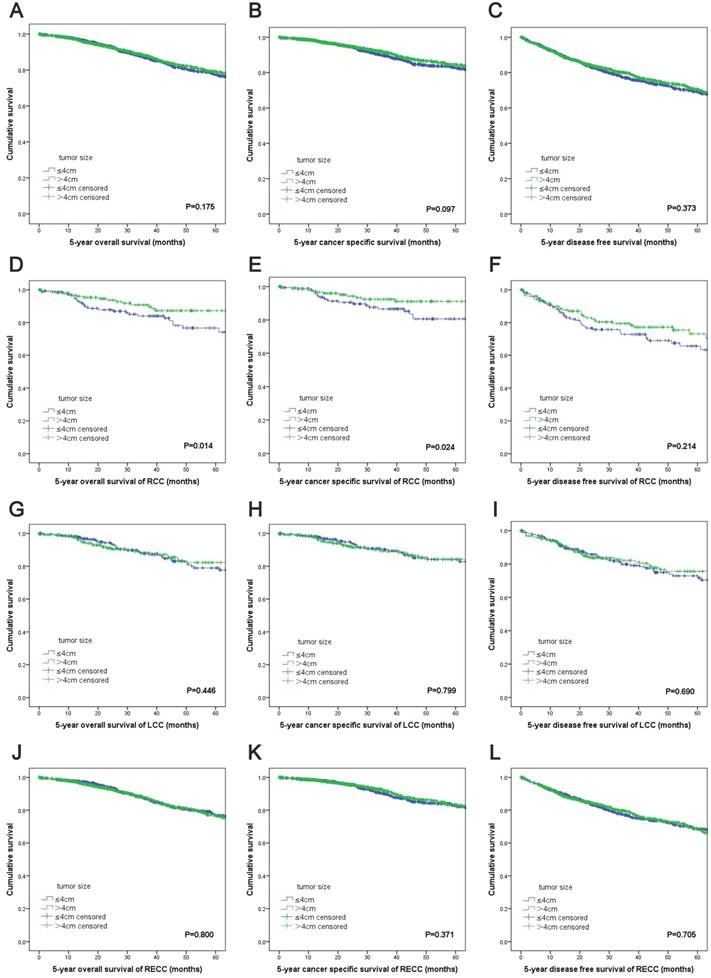
The Kaplan-Meier survival curves revealed no significant differences in the OS (P=0.175), CSS (P=0.097) and DFS (P=0.373) between the two groups based on the tumor size (Figure 1A, 1B, 1C). For RCC patients, patients with increased tumor sizes had better OS (P=0.014) and CSS (P=0.024) (Figure 1D, 1E). However, there was no difference in DFS between the two groups (P=0.214) (Figure 1F). For patients with LCC or RECC, no significant differences were observed for the OS, CSS and DFS between the two groups (Figure 1G-L).
Kaplan-Meier survival analyses by tumor size and primary tumor locations after propensity score matching. (A) OS of all patients; (B) CSS of all patients; (C) DFS of all patients; (D) OS of RCC patients; (E) CSS of RCC patients; (F) DFS of RCC patients; (G) OS of LCC patients; (H) CSS of LCC patients; (I) DFS of LCC stage patients; (J) OS of RECC patients; (K) CSS of RECC patients; (L) DFS of RECC patients. Abbreviations: TNM, tumor-node-metastasis; OS, overall survival; CSS, cancer-specific survival; DFS, disease-free survival.
Univariate and multivariate analyses of OS, CSS and DFS after the propensity score matching
In the univariate analyses of OS and DFS, the tumor size was not associated with the prognosis (HR, 1.148; 95% CI, 0.940-1.402; P=0.175 and HR, 1.075; 95% CI, 0.917-1.260; P=0.373, respectively) (Table 3). Multivariate proportional hazards regression models were established by adjusting for the simultaneous impact of potential confounders which were associated with survival rates in the univariate analyses (P<0.1). The multivariate analysis of CSS indicated that the smaller tumor size was an independent risk factor for CSS after adjusting for the age, differentiation, T stage, N stage, TNM stage, morphological type, venous invasion, perineural invasion and tumor deposits. That is to say, patients with a tumor size less than 4 cm had a worse CSS than patients with a tumor size greater than 4 cm (HR, 1.275; 95% CI, 1.006-1.616; P=0.045) (Table 3).
Univariate and multivariate analysis of OS, CSS and DFS in CRC patients with different tumor locations (≤4 cm vs. >4 cm)
| Analysis Type | Survival | All Stages | RCC | LCC | RECC | ||||||||
|---|---|---|---|---|---|---|---|---|---|---|---|---|---|
| HR | 95% CI | P | HR | 95% CI | P | HR | 95% CI | P | HR | 95% CI | P | ||
| Univariate | OS | 1.148 | 0.940-1.402 | 0.175 | 2.131 | 1.146-3.962 | 0.017 | 1.208 | 0.743-1.964 | 0.447 | 1.031 | 0.814-1.306 | 0.800 |
| Multivariate | OS | / | / | / | 2.455 | 1.297-4.649 | 0.006 | / | / | / | / | / | / |
| Univariate | CSS | 1.219 | 0.964-1.541 | 0.098 | 2.237 | 1.090-4.591 | 0.028 | 1.071 | 0.632-1.815 | 0.799 | 1.138 | 0.857-1.510 | 0.371 |
| Multivariate | CSS | 1.275 | 1.006-1.616 | 0.045 | 2.493 | 1.202-5.174 | 0.014 | / | / | / | / | / | / |
| Univariate | DFS | 1.075 | 0.917-1.260 | 0.373 | 1.317 | 0.851-2.038 | 0.216 | 1.082 | 0.733-1.597 | 0.690 | 1.037 | 0.858-1.254 | 0.705 |
| Multivariate | DFS | / | / | / | / | / | / | / | / | / | / | / | / |
Subgroup analyses based on the primary tumor location
In CRC patients with RCC, the smaller tumor size was an independent risk factor for OS and CSS and patients with a tumor size less than 4 cm had a worse OS (HR, 2.455; 95% CI, 1.297-4.649; P=0.006) and CSS (HR, 2.493; 95% CI, 1.202-5.174; P=0.014) than those with a tumor size greater than 4 cm (Table 3). For patients with LCC and RECC, the smaller tumor size was not an independent risk factor for OS, CSS and DFS (Table 3).
Subgroup analyses based on other variables
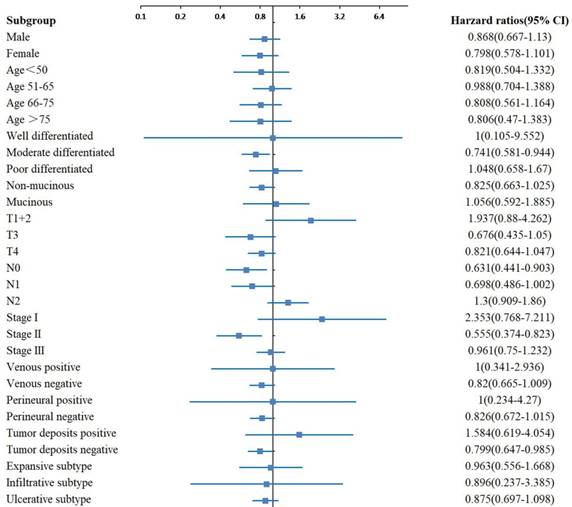
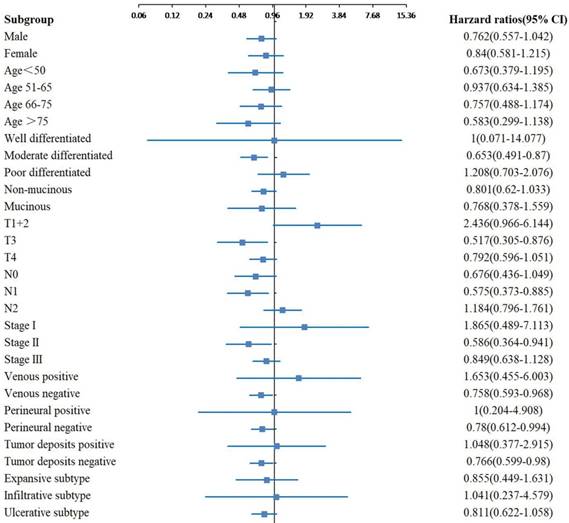
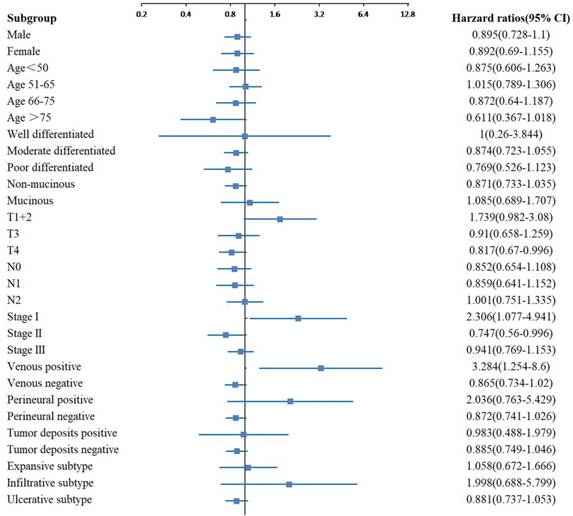
In the subgroup analyses of OS, significant differences were observed between the two groups with different tumor sizes for the moderate differentiation, N0 stage, TNM stage II and tumor deposits negative subgroups (Figure 2). In the subgroup analyses of CSS, significant differences were observed between the two groups with different tumor sizes for the moderate differentiation, T3 stage, N1 stage, TNM stage II, venous negative, perineural negative and tumor deposits negative subgroups (Figure 3). In the subgroup analyses of DFS, significant differences were observed between the two groups with different tumor sizes for the T4 stage, TNM stage I and II, and venous positive subtypes (Figure 4).
Adjusted hazard ratio with 95% CIs for OS comparing larger tumor size to smaller tumor size in different subgroups. Abbreviations: CIs, confidence intervals; OS, overall survival.
Adjusted hazard ratio with 95% CIs for CSS comparing larger tumor size to smaller tumor size in different subgroups. Abbreviations: CIs, confidence intervals; CSS, cancer-specific survival.
Adjusted hazard ratio with 95% CIs for DFS comparing larger tumor size to smaller tumor size in different subgroups. Abbreviations: CIs, confidence intervals; DFS, disease-free survival.
Discussion
Over the past decades, the TNM staging system has been modified for several times and tumor size remains important for predicting clinical outcomes of several solid tumors [4, 27, 28]. However, the prognostic value of the tumor size in CRC has been overlooked for a long time and remains somewhat uncertain. As gastrointestinal malignancies grow both vertically and horizontally, the depth of vertical infiltration is reflected by the T stage and the horizontal growth is presented by the tumor size. The T stage is incorporated into the TNM staging system as a prognostic indicator for malignancies, while the prognostic value of the tumor size is still controversial and needs further investigation.
Compared to patients with smaller tumor sizes, patients with larger tumor sizes were more likely to be associated with unfavorable features, such as poor differentiation, the mucinous subtype, higher T4 stage, more lymph node invasion. There were many confounders that have caused the imbalance of the two groups and may affect the prognosis between the two groups. Thus, we utilized the propensity score matching technique to balance the different groups and reduce the selection bias. After the propensity score matching, no differences were observed between the two groups based on the tumor size. We compared clinicopathological features of three CRC tumor locations and found that elderly patients and women were more likely to have RCC. Moreover, RCCs consisted of a greater proportion of poorly differentiated tumors, the infiltrative subtype and the mucinous subtype, which is consistent with previous studies [29, 30].
In the propensity score matched cohort, the Kaplan-Meier survival analyses and univariate analyses were performed to evaluate the prognostic effect of the tumor size on the OS, CSS and DFS of CRC patients. Results revealed that the smaller tumor size was an independent risk factor for CSS, not for OS and DFS, after adjusting for the confounders. We thought that the results in the present study might be relatively more convincing than other studies because of the use of propensity score matching method, which was important for reducing the selection bias existed in the retrospective study.
Few studies have taken the primary tumor location into consideration when evaluating the prognostic value of the tumor size in CRC, however, the effect of primary tumor locations should not be overlooked. Thus, further subgroup analyses based on the primary tumor location were performed and the results suggested that the smaller tumor size was an independent risk factor in RCC both for OS and CSS, not for DFS. Hence, patients with RCC tumors, which are less than 4 cm in size, may be considered to have high risk for mortality. As the lumen of the right-side colon was large and the content was almost fluid, the symptoms of RCCs seem to appear later than LCCs and RECCs. Additionally, RCCs are harder to be diagnosed due to the pain or technical reasons during colonoscopies. Thus, in patients with RCCs, tumors less than 4 cm in diameter seemed to have malignant behaviors or present symptoms earlier to be diagnosed at a relatively smaller tumor size. While tumors greater than 4 cm in diameter seemed to be better proliferated and did not present symptoms until they grew to a relatively greater size. These factors may explain our results. Our results suggested that the tumor size may be used as a complement metric, which was easily obtained from the routine pathological examination of different hospital systems, to determine the prognosis and monitor treatment regimens more accurately.
To our knowledge, the present study was the first propensity score matching study examining the prognostic value of the tumor size in CRC with different primary tumor locations and other subgroups. However, several limitations existed in the present study. First, the present study was a single- center retrospective study, thus the patients number was limited. Second, the tumor size was considered as a categorical variable, instead of continuous variable. Third, adjuvant chemotherapy, radiotherapy and laboratory examinations were not included in the present study. Further investigations of multi-center prospective study should be conducted and more baseline characteristics should be enrolled.
Conclusion
In summary, patients with different tumor sizes exhibited distinct clinical behaviors. Our propensity score matching study suggested that the smaller tumor size was an independent risk factor for CSS in patients with stage I-III CRC, and for OS and CSS in patients with RCC.
Acknowledgements
We thank all participants in the study. This work was supported by the National Natural Science Foundation of China (grant number 81472685, 81600469); the Major Special Plan of Science and Technology of Shandong Province (grant number 2015ZDXX0802A01); the Science and Technology Development Projects of Shandong Province (grant number 2016GSF201126); and the Natural Science Foundation of Shandong Province (grant number ZR2016HB06, ZR2017MH035).
Competing Interests
The authors have declared that no competing interest exists.
References
1. Torre LA, Bray F, Siegel RL, Ferlay J, Lortet-Tieulent J, Jemal A. Global cancer statistics, 2012. CA: a cancer journal for clinicians. 2015;65:87-108
2. Global Burden of Disease Cancer C, Fitzmaurice C, Dicker D, Pain A, Hamavid H, Moradi-Lakeh M. et al. The Global Burden of Cancer 2013. JAMA oncology. 2015;1:505-27
3. Verdecchia A, Francisci S, Brenner H, Gatta G, Micheli A, Mangone L. et al. Recent cancer survival in Europe: a 2000-02 period analysis of EUROCARE-4 data. The Lancet Oncology. 2007;8:784-96
4. Amin MB, Greene FL, Edge SB, Compton CC, Gershenwald JE, Brookland RK. et al. The Eighth Edition AJCC Cancer Staging Manual: Continuing to build a bridge from a population-based to a more "personalized" approach to cancer staging. CA: a cancer journal for clinicians. 2017;67:93-9
5. Giuliano AE, Edge SB, Hortobagyi GN. Eighth Edition of the AJCC Cancer Staging Manual: Breast Cancer. Annals of surgical oncology. 2018;25:1783-5
6. Abdel-Rahman O. Impact of tumor size on the outcome of patients with small renal cell carcinoma. Expert review of anticancer therapy. 2017;17:769-73
7. Gulack BC, Yang CF, Speicher PJ, Meza JM, Gu L, Wang X. et al. The impact of tumor size on the association of the extent of lymph node resection and survival in clinical stage I non-small cell lung cancer. Lung cancer. 2015;90:554-60
8. Compton C, Fenoglio-Preiser CM, Pettigrew N, Fielding LP. American Joint Committee on Cancer Prognostic Factors Consensus Conference: Colorectal Working Group. Cancer. 2000;88:1739-57
9. Crozier JE, McMillan DC, McArdle CS, Angerson WJ, Anderson JH, Horgan PG. et al. Tumor size is associated with the systemic inflammatory response but not survival in patients with primary operable colorectal cancer. Journal of gastroenterology and hepatology. 2007;22:2288-91
10. Yasui M, Takemasa I, Miyake Y, Hata T, Ikeda M, Miyake Y. et al. Tumor Size as an Independent Risk Factor for Postoperative Complications in Laparoscopic Low Anterior Resection for Advanced Rectal Cancer: A Multicenter Japanese Study. Surgical laparoscopy, endoscopy & percutaneous techniques. 2017;27:98-103
11. Kato T, Alonso S, Muto Y, Perucho M, Rikiyama T. Tumor size is an independent risk predictor for metachronous colorectal cancer. Oncotarget. 2016;7:17896-904
12. Chen CH, Hsieh MC, Hsiao PK, Lin EK, Lu YJ, Wu SY. A critical reappraisal for the value of tumor size as a prognostic variable in rectal adenocarcinoma. Journal of Cancer. 2017;8:1927-34
13. Saha S, Shaik M, Johnston G, Saha SK, Berbiglia L, Hicks M. et al. Tumor size predicts long-term survival in colon cancer: an analysis of the National Cancer Data Base. American journal of surgery. 2015;209:570-4
14. Santullo F, Biondi A, Cananzi FCM, Fico V, Tirelli F, Ricci R. et al. Tumor size as a prognostic factor in patients with stage IIa colon cancer. American journal of surgery. 2018;215:71-7
15. Huang B, Feng Y, Mo SB, Cai SJ, Huang LY. Smaller tumor size is associated with poor survival in T4b colon cancer. World journal of gastroenterology. 2016;22:6726-35
16. Huang B, Feng Y, Zhu L, Xu T, Huang L, Cai G. Smaller tumor size is associated with poor survival in stage II colon cancer: An analysis of 7,719 patients in the SEER database. International journal of surgery. 2016:33 Pt A: 157-63
17. Wong HL, Lee B, Field K, Lomax A, Tacey M, Shapiro J. et al. Impact of Primary Tumor Site on Bevacizumab Efficacy in Metastatic Colorectal Cancer. Clinical colorectal cancer. 2016;15:e9-e15
18. Hemminki K, Santi I, Weires M, Thomsen H, Sundquist J, Bermejo JL. Tumor location and patient characteristics of colon and rectal adenocarcinomas in relation to survival and TNM classes. BMC cancer. 2010;10:688
19. Cai B, Wang MY, Liao K, Xu YS, Wei WY, Zhuang Y. et al. Distribution characteristics of 3,369 chinese colorectal cancer patients for gender, age, location and tumor size during colonoscopy. Asian Pacific journal of cancer prevention: APJCP. 2014;15:8951-5
20. Hansen IO, Jess P. Possible better long-term survival in left versus right-sided colon cancer - a systematic review. Danish medical journal. 2012;59:A4444
21. Lereclus E, Tout M, Girault A, Baroukh N, Caulet M, Borg C. et al. A possible association of baseline serum IL-17A concentrations with progression-free survival of metastatic colorectal cancer patients treated with a bevacizumab-based regimen. BMC cancer. 2017;17:220
22. Austin PC. An Introduction to Propensity Score Methods for Reducing the Effects of Confounding in Observational Studies. Multivariate behavioral research. 2011;46:399-424
23. Baek S, Park SH, Won E, Park YR, Kim HJ. Propensity score matching: a conceptual review for radiology researchers. Korean journal of radiology. 2015;16:286-96
24. Li X, Zhao Q, An B, Qi J, Wang W, Zhang D. et al. Prognostic and predictive value of the macroscopic growth pattern in patients undergoing curative resection of colorectal cancer: a single-institution retrospective cohort study of 4,080 Chinese patients. Cancer management and research. 2018;10:1875-87
25. Dai W, Li Y, Meng X, Cai S, Li Q, Cai G. Does tumor size have its prognostic role in colorectal cancer? Re-evaluating its value in colorectal adenocarcinoma with different macroscopic growth pattern. International journal of surgery. 2017;45:105-12
26. Li X, An B, Zhao Q, Qi J, Wang W, Zhang D. et al. Impact of tumor deposits on the prognosis and chemotherapy efficacy in stage III colorectal cancer patients with different lymph node status: A retrospective cohort study in China. International journal of surgery. 2018;56:188-94
27. Chun YS, Pawlik TM, Vauthey JN. 8th Edition of the AJCC Cancer Staging Manual: Pancreas and Hepatobiliary Cancers. Annals of surgical oncology. 2018;25:845-7
28. O'Sullivan B, Brierley J, Byrd D, Bosman F, Kehoe S, Kossary C. et al. The TNM classification of malignant tumours-towards common understanding and reasonable expectations. The Lancet Oncology. 2017;18:849-51
29. Liu F, Li C, Jia H, Yang L, Wu Y, Zhao J. et al. Is there a prognostic value of tumor location among Chinese patients with colorectal cancer? Oncotarget. 2017;8:38682-92
30. Missiaglia E, Jacobs B, D'Ario G, Di Narzo AF, Soneson C, Budinska E. et al. Distal and proximal colon cancers differ in terms of molecular, pathological, and clinical features. Annals of oncology: official journal of the European Society for Medical Oncology. 2014;25:1995-2001
Author contact
![]() Corresponding author: Qi Zhao, Department of Gastroenterology, Shandong Provincial Hospital Affiliated to Shandong University, 324 Jingwu Road, Huaiyin District, Jinan 250021, Shandong Province, China. Tel: +86-0531-68776912; Email: sduzhaoqicom
Corresponding author: Qi Zhao, Department of Gastroenterology, Shandong Provincial Hospital Affiliated to Shandong University, 324 Jingwu Road, Huaiyin District, Jinan 250021, Shandong Province, China. Tel: +86-0531-68776912; Email: sduzhaoqicom