Impact Factor ISSN: 1837-9664

 Global reach, higher impact
J Cancer 2019; 10(1):249-256. doi:10.7150/jca.27399 This issue Cite
Research Paper
Log Odds Could Better Predict Survival in Muscle-Invasive Bladder Cancer Patients Compared with pN and Lymph Node Ratio
Shengming Jin1,2*, Beihe Wang1,2*, Yiping Zhu1,2*, Weixing Dai2,3, Peihang Xu1,2, Chen Yang4, Yijun Shen1,2 ![]() , Dingwei Ye1,2
, Dingwei Ye1,2 ![]()
1. Department of Urology, Fudan University Shanghai Cancer Center, Shanghai,200032,China
2. Department of Oncology, Shanghai Medical College, Fudan University, Shanghai,200032,China
3. Department of Colorectal Surgery, Fudan University Shanghai Cancer Center, Shanghai, 200032, China
4. Department of Urology, Huashan Hospital, Fudan University, Shanghai, 200040,China
*Authors contributed equally to this work
Received 2018-5-22; Accepted 2018-10-3; Published 2019-1-1
Abstract
Background: The aim of this study was to assess the prognostic value of lymph node-associated variables, pN, lymph node ratio (LNR) and log odds (LODDS), in patients with bladder cancer.
Methods: In the discovery cohort, 3358 patients with muscle-invasive bladder cancer (MIBC) and treated with radical cystectomy were identified from the Surveillance, Epidemiology, and End Results (SEER) database. A total of 173 patients with MIBC who underwent radical cystectomy at Shanghai Cancer Center between 2010 and 2013 were enrolled in the validation cohort. LNR and LODDS were calculated in two cohorts and prognostic value was compared between these two variables.
Results: In the two cohorts, survival differences between LODDS, LNR and pN (from the 7th AJCC TNM system) cohorts were statistically significant. Univariate and multivariate analyses confirmed that LNR and LODDS were independent prognostic factors and LODDS was better at predicting prognosis than pN and LNR for patients with MIBC. Moreover, LODDS had a better discriminative ability and model fit, proven by the highest Harrell's concordance index and lowest AIC among the three variables. Furthermore, scatter plots of pN, LNR and LODDS revealed that several groups of LNR and pN were heterogeneous and could be better stratified by LODDS in terms of prognosis estimation.
Conclusion: LODDS has significant prognostic value for patients with MIBC. Moreover, LODDS is better at predicting prognosis for MIBC patients compared with pN and LNR.
Keywords: bladder cancer, lymph node ratio, log odds, lymph node, prognosis
Introduction
Bladder cancer is the ninth most common cancer worldwide, with more than 330,000 new cases and more than 145,000 deaths every year. Approximately 30% of these patients have muscle-invasive bladder cancer (MIBC) [1]. In recent years, with improvements in living standards and changes in lifestyle, bladder cancer has resulted in increasing morbidity in China, leading to an estimated 80,500 new cases and 32,900 deaths in 2015 [2, 3].
Currently, the prognosis for patients with bladder cancer is often estimated based on the Tumor, Node, Metastasis (TNM) staging system. In the TNM system, N staging mainly depends on the involvement of the lymphatic region according to the 7th and 8th AJCC Cancer Staging Manual [4, 5]. However, this method ignores the number of involved and examined lymph nodes, which may decrease the precision of prognosis prediction.
Several studies adopted novel lymph node models to help estimate the prognosis of certain cancers. The lymph node ratio (LNR) is the ratio between the number of metastatic lymph nodes (NMLN) and the total number of lymph nodes examined (TNLE) [6]. Wang et al. discovered that LNR is a more accurate prognostic method for stage III colon cancer patients compared with pN staging [7]. Moreover, the log odds ratio (LODDS), defined as the log ratio between the number of metastatic lymph nodes (NMLN) and the number of negative lymph nodes (NNLN), had also been proven to be effective in predicting prognosis of gallbladder, head and neck, breast, colorectal and gastric cancers [8-12] . However, no studies have investigated whether LNR and LODDS could aid estimation of bladder cancer prognosis.
Our study was designed to investigate the prognostic value of LNR and LODDS in two cohorts of patients with MIBC treated with radical cystectomy.
Material and Methods
Patients
In the discovery cohort, a total of 3759 patients with MIBC treated by radical cystectomy were identified in the SEER database between 1998 and 2008. The inclusion criteria were as follows: 1) diagnosed with MIBC as first or only malignancy; 2) histological type was limited to transitional cell carcinoma; 3) treated with radical cystectomy; and 4) patient older than 18 years when diagnosed. [13]. Patients with T1, Tis or Ta staging (n=249), M1 staging (n=50), missing survival data (n=41), or missing lymph node data (n=61) were excluded, leaving 3358 patients.
The validation cohort included 292 patients with MIBC who underwent radical cystectomy at Shanghai Cancer Center between 2010 and 2013. Inclusion criteria were as follows: 1) diagnosed with MIBC as first or only malignancy; 2) histological type was limited to transitional cell carcinoma; 3) underwent radical cystectomy; and 4) patient older than 18 years when diagnosed. Patients with T1, Tis and Ta staging (n=49), missing lymph node data (n=28) and or missing follow-up data (n=42) were excluded, leaving 173 patients.
Ethics statement
The study was approved by the Research Ethics Committee of Shanghai Medical Center, Fudan University, China according to the provisions of the Declaration of Helsinki (as revised in Fortaleza, Brazil, October 2013). Patients in the validation cohort were anonymous and other personal information was also erased. For the public SEER database, we did not need informed consent of the patients.
Definition of LNR and LODDS
LNR was defined as the ratio between NMLN and TNLE. In this study, X-tile software (Yale University, 3.6.1) was used to determine cut-off points when patients were classified into different LNR groups. For the discovery cohort, the LNR category was stratified into LNR1 (0-0.019), LNR2 (0.020- 0.071), and LNR3 (0.072-1). For the validation cohort, the LNR category was divided into LNR1 (0) and LNR2 (0.09-1).
LODDS was defined as the log ratio between NMLN and NNLN. To avoid singularity, both numerator and denominator were added to 0.5. The final formula for calculating LODDS was log((NMLN+0.5)/ (NNLN+0.5)). X-tile (Yale University, 3.6.1) was also implemented to calculate cut-off points for LODDS groups. In terms of the discovery cohort, LODDS category was classified into LODDS1 (-2.13--1.51), LODDS2 (-1.50--1.27), LODDS3 (-1.26--1.02), LODDS4 (-1.01--0.64), and LODDS5 (-0.63-1.46). For the validation cohort, LODDS was stratified into LODDS1 (-1.86--1.04), LODDS2 (-1.03--0.38), and LODDS3 (-0.37- 0.70)[14].
Statistical analysis
Clinicopathological variables were collected for analysis. Survival differences were calculated using the log-rank test. Univariate and three-step multivariate analyses were carried out using Cox's proportional hazards model to assess the independent effect of clinicopathological factors on survival. After each step of multivariate analysis, Harrell's concordance index (HC index) was calculated to test the predictive ability and fit of these lymph node models. A model with perfect predictive capacity (sensitivity and specificity of 100%) would have a HC index of 1.00 while HC index=0.5 indicated no predictive ability [15]. Furthermore, the Akaike's Information Criterion (AIC) was employed to evaluate the model fit. Lower AIC often indicated a better model fit [16].
The survival curves of each lymph node model were depicted by the use of GraphPad Prism (version 6.01, GraphPad Software inc., CA, USA). We also made scatter plots to reflect the association between pN, LNR and LODDS by SPSS (version 21.0, IBM Corp. NY, USA).
All statistical analyses were completed using SPSS (version 21.0, IBM Corp.) and R (version 3.4.1, R Foundation for Statistical Computing, Vienna, Austria). All statistical tests were two-sided and statistical significance was set at P < 0.05.
Results
Patient baseline characteristics
The baseline characteristics of the two cohorts are shown in Table 1. In total, 2501 (74.5%) patients were male and 857 (25.5%) were female, with a mean age of 67.8 years in the discovery cohort. For the extension range, 1344 (40.0%) patients had T2 staging, 1364 (40.6%) had T3 and 650 (19.4%) had T4. As for pathological features, 989 (29.5%) patients had lymph node involvement while 2369 (70.5%) had no positive lymph nodes.
Clinicopathological characteristics of patients with muscle-invasive bladder cancer
| Characteristics | Discovery cohort | Validation cohort | ||
|---|---|---|---|---|
| n(%) | P a | n(%) | P a | |
| Age(year) | <0.001 | 0.278 | ||
| <=70 | 1923(57.3) | 141(81.5) | ||
| >70 | 1435(42.7) | 32(18.5) | ||
| Sex | 0.012 | 0.034 | ||
| Male | 2501(74.5) | 152(87.9) | ||
| Female | 857(25.5) | 21(12.1) | ||
| Grade | 0.055 | 0.356 | ||
| 1 | 6(0.2) | 1(0.6) | ||
| 2 | 62(1.8) | 3(1.7) | ||
| 3 | 1228(36.6) | 2(1.2) | ||
| 4 | 2062(61.4) | 167(96.5) | ||
| pT | <0.001 | 0.006 | ||
| T2 | 1344(40.0) | 58(33.5) | ||
| T3 | 1364(40.6) | 62(35.8) | ||
| T4 | 650(19.4) | 53(30.6) | ||
| Lymph nodes involvement | <0.001 | <0.001 | ||
| Absent | 2369(70.5) | 134(77.5) | ||
| Present | 989(29.5) | 39(22.5) | ||
| pN | <0.001 | <0.001 | ||
| N0 | 2369(70.5) | 133(76.9) | ||
| N1 | 687(20.5) | 13(7.5) | ||
| N2 | 272(8.1) | 26(15.0) | ||
| N3 | 30(0.9) | 1(0.6) | ||
| LNR | <0.001 | <0.001 | ||
| LNR1 | 2369(70.5) | 126(72.8) | ||
| LNR2 | 166(4.9) | 47(27.2) | ||
| LNR3 | 823(24.5) | |||
| LODDS | <0.001 | <0.001 | ||
| LODDS1 | 705(21.0) | 110(63.6) | ||
| LODDS2 | 708(21.1) | 40(23.1) | ||
| LODDS3 | 602(17.9) | 23(13.3) | ||
| LODDS4 | 687(20.5) | |||
| LODDS5 | 656(19.5) | |||
| Tumor size(mm) | <0.001 | |||
| <=40 | 1783(53.1) | |||
| >40 | 1575(46.9) | |||
| Race | 0.002 | / | ||
| White | 2967(88.4) | |||
| Black | 187(5.6) | |||
| American Indian | 9(0.3) | |||
| Asian or Pacific Islander | 195(5.8) | 173(100) | ||
| Marital status | <0.001 | |||
| Single (never married) | 366(10.9) | |||
| Married | 2200(65.5) | |||
| Separated | 23(0.7) | |||
| Divorced | 355(10.6) | |||
| Widowed | 412(12.3) | |||
| Domestic partner | 2(0.1) | |||
| Smoking history | 0.428 | |||
| Absent | 83(48.0) | |||
| Present | 90(52.0) | |||
| Necrosis | 0.295 | |||
| Absent | 171(98.8) | |||
| Present | 2(1.2) | |||
| Perineural invasion | 0.101 | |||
| Absent | 133(76.9) | |||
| Present | 40(23.1) | |||
| Microvascular invasion | 0.111 | |||
| Absent | 127(73.4) | |||
| Present | 46(26.6) | |||
a. Log-rank test. LNR, lymph node ratio; LODDS, log odds ratio
The validation cohort was made up of 21 (12.1%) females and 152 (87.9%) males, with a mean age of 61.4 years. Overall, 58 (33.6%) patients were at T2, 62 (35.8%) at T3 and 53 (30.6%) were at T4 staging. A total of 40 (23.1%) patients had perineural invasion, 39 had lymph node involvement, 46 (26.6%) showed microvascular invasion, and two (1.2%) had necrosis, with regard to pathological features.
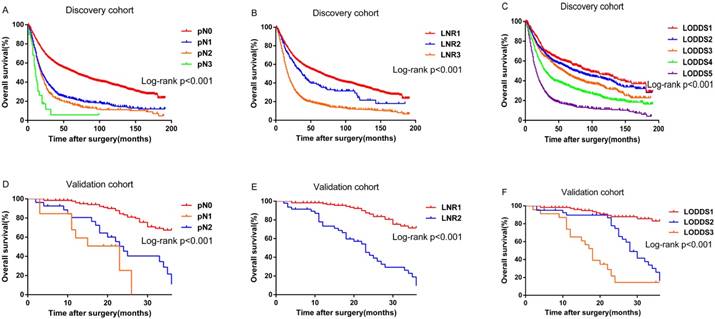
Survival differences were statistically significant for all the variables (pN, P<0.001; LNR, P<0.001; LODDS, P<0.001.Figure 1A, 1B and 1C) except grade (P=0.055) for the discovery cohort. While for the validation cohort, survival differences for several variables were statistically insignificant, probably because of the limited number of patients: age at diagnosis (P=0.285), necrosis (P=0.295), grade (P= 0.356), and microvascular invasion (P=0.111). However, pN (P<0.001), LNR (P<0.001) and LODDS (P<0.001) were still significant variables for survival (Figure 1D, 1E and 1F).
Kaplan-Meier curves for overall survival stratified by: (A) pN (B) LNR (C) LODDS in the discovery cohort; (D) pN (E) LNR (F) LODDS in the validation cohort
Survival analysis
Univariate and multivariate analyses (Cox Proportional Hazard Model) were performed to assess the impact of factors on OS. In the discovery cohort (Table 2), most of the factors were statistically significant except grade (P=0.063, slightly insignificant) in the univariate analysis. Then, in a three-step multivariate analysis, all the significant variates except lymph node-associated variables were included in the bench model. Later, in the step 1 multivariate analysis, pN was incorporated. It showed that tumor size, pT, age at diagnosis, marital status, race and pN were independent prognosis factors. After that, LNR was also incorporated into this model in the step 2 multivariate analysis and was also significant. Finally, LODDS was added to this model in the step 3 multivariate analysis. LNR was found to be substituted by LODDS, and LNR became insignificant itself.
Univariable and multivariable Cox model of prognostic factors in the discovery cohort
| Characteristics | Univariable analysis | Multivariable analysis 1 | Multivariable analysis 2 | Multivariable analysis 3 | ||||||||
|---|---|---|---|---|---|---|---|---|---|---|---|---|
| HR | 95%CI | P | HR | 95%CI | P | HR | 95%CI | P | HR | 95%CI | P | |
| Age(year) | 1.026 | 1.022-1.031 | <0.001 | 1.03 | 1.025-1.035 | <0.001 | 1.029 | 1.025-1.035 | <0.001 | 1.028 | 1.023-1.033 | <0.001 |
| Sex | 0.013 | 0.951 | 0.972 | 0.987 | ||||||||
| Male | reference | reference | reference | reference | ||||||||
| Female | 1.135 | 1.027-1.255 | 0.013 | 0.997 | 0.895-1.109 | 0.951 | 1.002 | 0.900-1.115 | 0.972 | 1.001 | 0.899-1.114 | 0.987 |
| Marital status | <0.001 | 0.028 | 0.018 | 0.009 | ||||||||
| Single (never married) | reference | reference | reference | reference | ||||||||
| Married | 0.887 | 0.766-1.028 | 0.112 | 0.821 | 0.706-0.954 | 0.01 | 0.809 | 0.696-0.941 | 0.006 | 0.805 | 0.692-0.936 | 0.005 |
| Separated | 0.683 | 0.350-1.332 | 0.263 | 0.557 | 0.285-1.086 | 0.086 | 0.566 | 0.290-1.104 | 0.095 | 0.582 | 0.298-1.136 | 0.113 |
| Divorced | 1.023 | 0.844-1.240 | 0.817 | 0.967 | 0.797-1.173 | 0.735 | 0.967 | 0.797-1.173 | 0.734 | 0.99 | 0.816-1.201 | 0.917 |
| Widowed | 1.217 | 1.017-1.458 | 0.032 | 0.803 | 0.662-0.973 | 0.025 | 0.797 | 0.658-0.967 | 0.021 | 0.788 | 0.649-0.955 | 0.015 |
| Domestic partner | 1.283 | 0.180-9.152 | 0.804 | 1.82 | 0.255-13.010 | 0.551 | 1.806 | 0.253-12.912 | 0.556 | 1.544 | 0.216-11.053 | 0.665 |
| Race | 0.003 | 0.004 | 0.005 | 0.005 | ||||||||
| White | reference | reference | reference | reference | ||||||||
| Black | 1.376 | 1.151-1.643 | <0.001 | 1.373 | 1.143-1.647 | 0.001 | 1.36 | 1.133-1.632 | 0.001 | 1.347 | 1.122-1.617 | 0.001 |
| American Indian | 0.524 | 0.196-1.398 | 0.197 | 0.514 | 0.192-1.377 | 0.186 | 0.498 | 0.186-1.334 | 0.165 | 0.463 | 0.173-1.239 | 0.125 |
| Asian or Pacific Islander | 1.035 | 0.855-1.253 | 0.723 | 0.997 | 0.823-1.208 | 0.974 | 1.014 | 0.837-1.229 | 0.889 | 1.015 | 0.837-1.231 | 0.879 |
| Grade | 0.063 | 0.074 | 0.086 | 0.156 | ||||||||
| 1 | reference | reference | reference | reference | ||||||||
| 2 | 2.905 | 0.399-21.176 | 0.293 | 4.386 | 0.600-32.068 | 0.145 | 4.413 | 0.604-32.257 | 0.144 | 3.718 | 0.508-27.201 | 0.196 |
| 3 | 3.466 | 0.488-24.638 | 0.214 | 4.698 | 0.659-33.495 | 0.123 | 4.697 | 0.659-33.485 | 0.123 | 4.156 | 0.583-29.642 | 0.155 |
| 4 | 3.11 | 0.438-22.097 | 0.257 | 4.243 | 0.595-30.237 | 0.149 | 4.258 | 0.597-30.339 | 0.148 | 3.821 | 0.536-27.241 | 0.181 |
| Tumor size(mm) | 1.006 | 1.004-1.007 | <0.001 | 1.004 | 1.002-1.006 | <0.001 | 1.004 | 1.002-1.006 | <0.001 | 1.004 | 1.002-1.006 | <0.001 |
| pT | <0.001 | <0.001 | <0.001 | <0.001 | ||||||||
| T2 | reference | reference | reference | reference | ||||||||
| T3 | 1.951 | 1.755-2.168 | <0.001 | 1.65 | 1.480-1.839 | <0.001 | 1.648 | 1.478-1.836 | <0.001 | 1.64 | 1.471-1.828 | <0.001 |
| T4 | 2.881 | 2.551-3.253 | <0.001 | 2.207 | 1.942-2.508 | <0.001 | 2.199 | 1.935-2.499 | <0.001 | 2.164 | 1.904-2.460 | <0.001 |
| pN | <0.001 | <0.001 | <0.001 | <0.001 | ||||||||
| N0 | reference | reference | reference | reference | ||||||||
| N1 | 2.105 | 1.893-2.341 | <0.001 | 1.885 | 1.689-2.104 | <0.001 | 2.091 | 1.859-2.352 | <0.001 | 1.411 | 1.198-1.662 | <0.001 |
| N2 | 2.43 | 2.114-2.793 | <0.001 | 2.128 | 1.843-2.457 | <0.001 | 2.152 | 1.864-2.485 | <0.001 | 1.386 | 1.141-1.684 | 0.001 |
| N3 | 4.442 | 2.960-6.665 | <0.001 | 4.232 | 2.809-6.377 | <0.001 | 4.288 | 2.846-6.461 | <0.001 | 2.71 | 1.758-4.179 | <0.001 |
| LNR | <0.001 | <0.001 | 0.23 | |||||||||
| LNR1 | reference | reference | reference | |||||||||
| LNR2 | 1.358 | 1.102-1.675 | 0.004 | 0.631 | 0.505-0.789 | <0.001 | 0.856 | 0.664-1.103 | 0.23 | |||
| LNR3 | 2.472 | 2.245-2.723 | <0.001 | a | ||||||||
| LODDS | <0.001 | <0.001 | ||||||||||
| LODDS1 | reference | reference | ||||||||||
| LODDS2 | 1.175 | 0.999-1.382 | 0.052 | 1.12 | 0.951-1.319 | 0.173 | ||||||
| LODDS3 | 1.409 | 1.199-1.656 | <0.001 | 1.286 | 1.090-1.518 | 0.003 | ||||||
| LODDS4 | 1.946 | 1.672-2.264 | <0.001 | 1.577 | 1.337-1.860 | <0.001 | ||||||
| LODDS5 | 3.345 | 2.885-3.877 | <0.001 | 1.996 | 1.629-2.446 | <0.001 | ||||||
a. LNRnumber(3) = pNtruenumber(1) + pNtruenumber(2) + pNtruenumber(3) - LNRnumber(2) ,so LNR3 was a linear correlated covariate and degree of freedom decreased.
HR, hazard ratio;CI, confidence interval;LNR, lymph node ratio; LODDS, log odds ratio
Next, univariate and multivariate analyses were performed on the validation cohort (Table 3). In the univariate analysis, sex, LNR, LODDS, pT, and pN were statistically significant (P<0.05). Then, the step 1 multivariate analysis was carried out (the P-value of perineural invasion and microvascular invasion was close to 0.05, so they were also included). Sex, pT and pN were significant. Then, LNR was added to construct the model in the step 2 multivariate analysis, and LNR become an independent prognosis factor with pN being insignificant. Moreover, when all three lymph node classifications were included in the step 3 multivariate analysis, sex, LODDS, LNR, and pT were the only four independent prognostic factors.
Univariable and multivariable Cox model of prognostic factors in the validation cohort
| Univariable analysis | Multivariable analysis 1 | Multivariable analysis 2 | Multivariable analysis 3 | |||||||||
|---|---|---|---|---|---|---|---|---|---|---|---|---|
| HR | 95%CI | P | HR | 95%CI | P | HR | 95%CI | P | HR | 95%CI | P | |
| Age(year) | 0.293 | |||||||||||
| <=70 | Reference | |||||||||||
| >70 | 1.314 | 0.790-2.187 | 0.293 | |||||||||
| Grade | 0.644 | |||||||||||
| 1 | Reference | |||||||||||
| 2 | 2.482 | 0.003-5.129 | 0.856 | |||||||||
| 3 | 0.999 | 0-24.764 | 0.987 | |||||||||
| 4 | 21.862 | 0.005-42.145 | 0.473 | |||||||||
| Smoking history | 0.435 | |||||||||||
| Absent | Reference | |||||||||||
| Present | 0.822 | 0.502-1.345 | 0.435 | |||||||||
| Necrosis | 0.319 | |||||||||||
| Absent | Reference | |||||||||||
| Present | 2.743 | 0.376-20.004 | 0.319 | |||||||||
| Sex | 0.039 | 0.023 | 0.029 | 0.027 | ||||||||
| Female | Reference | Reference | Reference | Reference | ||||||||
| Male | 0.501 | 0.259-0.966 | 0.039 | 0.45 | 0.226-0.895 | 0.023 | 0.463 | 0.232-0.924 | 0.029 | 0.451 | 0.222-0.914 | 0.027 |
| Perineural invasion | 0.107 | 0.169 | 0.062 | 0.053 | ||||||||
| Absent | Reference | Reference | Reference | Reference | ||||||||
| Present | 1.588 | 0.905-2.785 | 0.107 | 1.648 | 0.809-3.359 | 0.169 | 2.024 | 0.966-4.24 | 0.062 | 2.053 | 0.992-4.249 | 0.053 |
| Microvascular invasion | 0.120 | 0.401 | 0.512 | 0.438 | ||||||||
| Absent | Reference | Reference | Reference | Reference | ||||||||
| Present | 1.546 | 0.893-2.675 | 0.120 | 0.727 | 0.346-1.529 | 0.401 | 0.773 | 0.35-1.668 | 0.512 | 0.723 | 0.318-1.642 | 0.438 |
| pT | 0.009 | <0.001 | 0.018 | 0.021 | ||||||||
| T2 | Reference | Reference | Reference | Reference | ||||||||
| T3 | 1.852 | 0.984-3.484 | 0.056 | 9.309 | 8.658-10.602 | <0.001 | 5.209 | 4.609-6.399 | 0.126 | 6.853 | 4.395-7.845 | 0.098 |
| T4 | 2.707 | 1.431-5.120 | 0.002 | 2.045 | 1.018-4.105 | <0.001 | 2.142 | 1.052-4.362 | 0.036 | 2.259 | 1.568-3.794 | 0.102 |
| pN | <0.001 | <0.001 | 0.06 | 0.1 | ||||||||
| N0 | Reference | Reference | Reference | Reference | ||||||||
| N1 | 7.466 | 3.281-16.988 | <0.001 | 8.761 | 3.588-21.391 | <0.001 | 2.393 | 0.84-6.818 | 0.102 | 1.624 | 0.552-4.778 | 0.379 |
| N2 | 3.873 | 2.159-6.949 | <0.001 | 3.445 | 1.749-6.784 | <0.001 | 0.736 | 0.279-1.944 | 0.536 | 0.557 | 0.209-1.486 | 0.242 |
| LNR | <0.001 | <0.001 | 0.032 | |||||||||
| LNR1 | Reference | Reference | Reference | |||||||||
| LNR2 | 5.075 | 3.054-8.436 | <0.001 | 5.333 | 2.38-11.952 | 0 | 2.664 | 1.087-6.531 | 0.032 | |||
| LODDS | <0.001 | 0.003 | ||||||||||
| LODDS1 | Reference | Reference | ||||||||||
| LODDS2 | 4.141 | 2.253-7.609 | <0.001 | 3.045 | 1.298-7.144 | 0.01 | ||||||
| LODDS3 | 11.041 | 5.562-21.919 | <0.001 | 7.018 | 2.311-21.312 | 0.001 | ||||||
HR, hazard ratio;CI, confidence interval;LNR, lymph node ratio; LODDS, log odds ratio
Discriminative ability of prognostic models containing different lymph node associated variables
To further evaluate the prognostic ability of these models, HC index and AIC were then calculated (Table 4). HC index was 0.6769 (pN), 0.6794 (pN+ LNR), and 0.6855 (pN+LNR+LODDDS) in the discovery cohort. The AIC was 2849.8, 2845.0, and 2842.2 for pN, LNR, and LODDS, respectively. With regard to the validation cohort, HC index was 0.7627 (pN), 0.8158 (pN+LNR), and 0.8222 (pN+LNR+ LODDS). Furthermore, AIC was 52.5 (pN), 50.7 (LNR), and 49.6 (LODDS). Thus, the two cohorts shared similar results: pN+LNR+LODDS had the highest HC index, while LODDS had the lowest AIC.
HC index, AIC of pN, LNR and LODDS systems
| N category | Discovery cohort | Validation cohort | |
|---|---|---|---|
| HC index | pN | 0.6769 | 0.7627 |
| pN+LNR | 0.6794 | 0.8158 | |
| pN+LNR+LODDS | 0.6855 | 0.8222 | |
| AIC | pN | 2849.766 | 52.467 |
| LNR | 2845.016 | 50.745 | |
| LODDS | 2842.21 | 49.621 |
HC index, Harrell's Concordance index; AIC, Akaike Information Criterion; LNR, lymph node ratio; LODDS, log odds ratio.
Distribution of pN, LNR and LODDS within each group
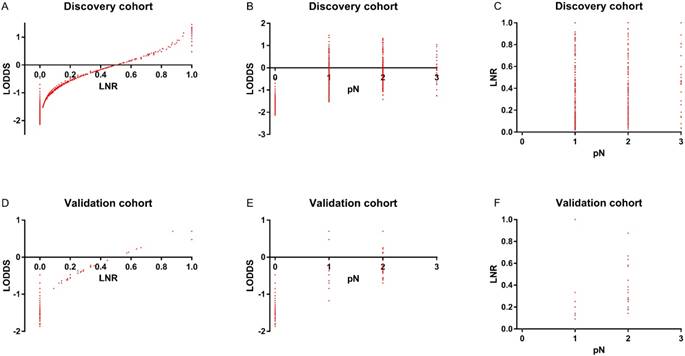
To assess the relationship of pN, LNR, and LODDS, scatter plots were created (Figure 2). As shown in Figure 2B and 2C, each pN classification could be divided into different LNR or LODDS classifications, indicating the heterogeneity in every pN classification. As to LNR and LODDS (Figure 2A), it was obvious that they had a close correlation. The classification of LNR and LODDS was similar in general. However, when LNR equaled 0 or 1, the value of LODDS was heterogeneous. This suggested that LODDS might be more discriminative than LNR. A similar conclusion could also be drawn from Figure 2D, 2E and 2F.
In the discovery cohort, the distribution of (A) LODDS and LNR (B) LODDS and pN (C) LNR and pN. In the validation cohort, the distribution of (D) LODDS and LNR (E) LODDS and pN (F) LNR and pN
Discussion
An accurate staging system is of great importance to predict the prognosis of cancer patients, which could help decide the best strategy for postoperative therapy and follow-up. Currently, the 7th UICC/AJCC TNM classification is the most widely used prognosis-prediction model for patients (the 8th edition was released recently). However, it still has some drawbacks, especially in pN categories [7]. The classification of pN is highly dependent on NMLN, while NMLN is directly influenced by TNLE [17]. In other words, if TNLE is not big enough, the pN category cannot ensure a precise prediction of prognosis (as was recommended in an article on bladder cancer, when TNLE was ≥15, the probability of missing lymph node metastasis was less than 19% [7, 18].). In fact, it was common that the retrieved and examined lymph nodes were not adequate in some cases. To make up for this shortcoming in the AJCC pN staging system, several methods of staging that incorporate other lymph node-associated information have been proposed in recent years. Among these novel lymph node models, LNR and LODDS tend to be the most promising.
LNR, as a model for prognosis estimation, has been confirmed to be effective in various cancers, including gastric, breast, colon and lung cancers [19-22], compared with NMLN and pN from the TNM system [23]. Although LODDS was originally relative to LNR and fewer studies focused on this field, it was still confirmed to be a more accurate classification for lymph nodes than pN category in several articles. Lee et al. studied 347 patients with oral cavity squamous cell carcinoma (OSCC) and revealed that LODDS could stratify OSCC patients and help to identify high-risk patients missed by AJCC pN classification and the rN classification [24]. Biondi et al. identified 258 colon cancer patients who had undergone surgical resection and found that compared with other nodal staging systems like TNM, the prognostic power of LODDS was less influenced by the number of dissected and examined lymph nodes [25]. One of the most important advantages of LNR and LODDS over pN is that the ratio instead of the absolute number of lymph nodes can avoid the restriction of insufficient lymph nodes examined. In this way, a comparatively accurate prognosis can be guaranteed regardless of TNLE.
In our research, we studied the prognostic ability of LNR and LODDS in patients with bladder cancer, which has hardly been reported in previous articles. Interestingly, the results were consistent with those in other malignancies. LNR and LODDS were significant variables for survival differences in both the discovery and validation cohorts (P<0.001, Table 1). In the univariate and multivariate analyses (Table 2 and 3), LNR and LODDS turned out to be independent factors for prognosis, and LODDS showed better predictive capacity than pN; once LODDS was added to the multivariate model, the P-value of pN increased and became greater than LODDS. Moreover, the AIC and HC index further confirmed the superiority of LNR and LODDS over pN in terms of prognostic power (Table 4), indicating LNR and LODDS had better model fit and predictive ability, respectively. Last but not least, in scatter plots (Figure 2B, 2C, 2E and 2F) it was discovered that every group classified by pN was heterogeneous and could be divided into different LNR or LODDS groups, which suggested that LNR and LODDS had a better discriminative capacity compared with pN for prognosis estimation.
Our results also revealed that LODDS was superior to LNR as a prognosis classification system in bladder cancer patients. In the step 3 multivariate analysis, it was obvious that LODDS had a smaller P-value (P<0.001 vs P=0.23, discovery cohort; P=0.003 vs P=0.032, validation cohort) and a higher HR than LNR in both of the cohorts. Furthermore, LODDS had a greater HC index and a smaller AIC in contrast with LNR. As to the scatter plots, in the intermediate part of the curve LODDS was elevated following the increase of LNR, while at the beginning and the end of the curve the values of LODDS were heterogeneous, indicating that LNR lacked discriminative capacity when it was close to 0 or 1.
This conclusion is in line with the results of several studies. Zhao et al. studied 1097 patients with lung adenocarcinoma who underwent complete surgical resection and found that LODDS could help stratify patients with different prognoses into different groups when their LNR was equal, especially when it was 0 or 1 [14]. Wang et al. also raised an interesting question as to whether patient A with four metastatic lymph nodes out of four lymph nodes examined had the same prognosis as patient B with 20 metastatic lymph nodes out of 20 [23] Intuitively, A had a better prognosis than B, even though they shared the same LNR, which necessitated the use of LODDS in this case. Because of these advantages, LODDS was recommended in clinical practice, although further research is required.
There are several limitations to our study. Firstly, our research was retrospective and conducted at a single center, leading to a small research population. These drawbacks decreased the generality of our results and made it difficult to study the prognosis effect of the number of lymph nodes examined, which is an important factor for predicting metastasis according to Shariat et al. [18]. Secondly, information on treatment was not included both in the discovery and validation cohorts, making it difficult to assess the treatment strategy for different groups of patient. Thirdly, because of the varying characteristics of the different studies, there was no universal cut-off value for LNR and LODDS. Quartiles [19] and recursive partitioning [14] were both reported to help determine the cut-off value and sometimes researchers even determined it arbitrarily. Further research is needed to find a better cut-off for LNR and LODDS.
In conclusion, our study confirmed the ability of LNR and LODDS to predict prognosis for patients with MIBC after radical cystectomy. Moreover, LODDS had an advantage over LNR and pN in prognosis estimation. Therefore, it is worthwhile to consider incorporating LODDS into the current TNM system. Given that few studies focus on the value of LODDS and LNR in bladder cancer, more research is necessary on this topic.
Abbreviations
MIBC: muscle-invasive bladder cancer; TNM: the Tumor; Node: Metastasis staging system; LNR: lymph node ratio; LODDS: the log odds ratio; NMLN: the number of metastatic lymph nodes; NNLN: the number of negative lymph nodes; TNLE: the total number of lymph nodes examined; HC index: Harrell's concordance index; AIC: Akaike's Information Criterion; OSCC: oral cavity squamous cell carcinoma.
Acknowledgements
The authors would like to thank all patients involved in this study. This work was funded by the National Natural Science Foundation of China (81572531). The funding source provided financial support for the study and did not have any other involvement in this study.
Competing Interests
The authors have declared that no competing interest exists.
References
1. Witjes JA, Comperat E, Cowan NC, De Santis M, Gakis G, Lebret T. et al. EAU guidelines on muscle-invasive and metastatic bladder cancer: summary of the 2013 guidelines. European urology. 2014;65:778-92
2. Chen W, Zheng R, Baade PD, Zhang S, Zeng H, Bray F. et al. Cancer statistics in China, 2015. CA: a cancer journal for clinicians. 2016;66:115-32
3. Chen W, Zheng R, Zhang S, Zeng H, Xia C, Zuo T. et al. Cancer incidence and mortality in China, 2013. Cancer letters. 2017;401:63-71
4. Edge SB, Compton CC. The American Joint Committee on Cancer: the 7th edition of the AJCC cancer staging manual and the future of TNM. Annals of surgical oncology. 2010;17:1471-4
5. Delahunt B, Egevad L, Samaratunga H, Varma M, Verrill C, Cheville J. et al. UICC drops the ball in the 8th edition TNM staging of urological cancers. Histopathology. 2017;71:5-11
6. Herr HW. Superiority of ratio based lymph node staging for bladder cancer. The Journal of urology. 2003;169:943-5
7. Wang J, Hassett JM, Dayton MT, Kulaylat MN. Lymph node ratio: role in the staging of node-positive colon cancer. Ann Surg Oncol. 2008;15:1600-8
8. Amini N, Kim Y, Wilson A, Margonis GA, Ethun CG, Poultsides G. et al. Prognostic Implications of Lymph Node Status for Patients With Gallbladder Cancer: A Multi-Institutional Study. Ann Surg Oncol. 2016;23:3016-23
9. Jian-Hui C, Shi-Rong C, Hui W, Si-le C, Jian-Bo X, Er-Tao Z. et al. Prognostic value of three different lymph node staging systems in the survival of patients with gastric cancer following D2 lymphadenectomy. Tumour biology: the journal of the International Society for Oncodevelopmental Biology and Medicine. 2016;37:11105-13
10. Lee CW, Wilkinson KH, Sheka AC, Leverson GE, Kennedy GD. The Log Odds of Positive Lymph Nodes Stratifies and Predicts Survival of High-Risk Individuals Among Stage III Rectal Cancer Patients. The oncologist. 2016;21:425-32
11. Wen J, Ye F, He X, Li S, Huang X, Xiao X. et al. Development and validation of a prognostic nomogram based on the log odds of positive lymph nodes (LODDS) for breast cancer. Oncotarget. 2016;7:21046-53
12. Yildiz MM, Petersen I, Eigendorff E, Schlattmann P, Guntinas-Lichius O. Which is the most suitable lymph node predictor for overall survival after primary surgery of head and neck cancer: pN, the number or the ratio of positive lymph nodes, or log odds? Journal of cancer research and clinical oncology. 2016;142:885-93
13. Shi X, Hu WP, Ji QH. Development of comprehensive nomograms for evaluating overall and cancer-specific survival of laryngeal squamous cell carcinoma patients treated with neck dissection. Oncotarget. 2017;8:29722-40
14. Zhao Y, Li G, Zheng D, Jia M, Dai W, Sun Y. et al. The prognostic value of lymph node ratio and log odds of positive lymph nodes in patients with lung adenocarcinoma. The Journal of thoracic and cardiovascular surgery. 2017;153:702-9.e1
15. Yang M, Cao H, Guo X, Zhang T, Hu P, Du J. et al. The number of resected lymph nodes (nLNs) combined with tumor size as a prognostic factor in patients with pathologic N0 and Nx non-small cell lung cancer. PloS one. 2013;8:e73220
16. Harrell FE Jr, Lee KL, Mark DB. Multivariable prognostic models: issues in developing models, evaluating assumptions and adequacy, and measuring and reducing errors. Statistics in medicine. 1996;15:361-87
17. Song YX, Gao P, Wang ZN, Tong LL, Xu YY, Sun Z. et al. Which is the most suitable classification for colorectal cancer, log odds, the number or the ratio of positive lymph nodes? PloS one. 2011;6:e28937
18. Shariat SF, Ehdaie B, Rink M, Cha EK, Svatek RS, Chromecki TF. et al. Clinical nodal staging scores for bladder cancer: a proposal for preoperative risk assessment. European urology. 2012;61:237-42
19. Berger AC, Sigurdson ER, LeVoyer T, Hanlon A, Mayer RJ, Macdonald JS. et al. Colon cancer survival is associated with decreasing ratio of metastatic to examined lymph nodes. Journal of clinical oncology: official journal of the American Society of Clinical Oncology. 2005;23:8706-12
20. Woodward WA, Vinh-Hung V, Ueno NT, Cheng YC, Royce M, Tai P. et al. Prognostic value of nodal ratios in node-positive breast cancer. Journal of clinical oncology: official journal of the American Society of Clinical Oncology. 2006;24:2910-6
21. Taylor MD, Lapar DJ, Thomas CJ, Persinger M, Stelow EB, Kozower BD. et al. Lymph node ratio predicts recurrence and survival after R0 resection for non-small cell lung cancer. The Annals of thoracic surgery. 2013;96:1163-70
22. Wang X, Appleby DH, Zhang X, Gan L, Wang JJ, Wan F. Comparison of three lymph node staging schemes for predicting outcome in patients with gastric cancer. The British journal of surgery. 2013;100:505-14
23. Wang J, Hassett JM, Dayton MT, Kulaylat MN. The prognostic superiority of log odds of positive lymph nodes in stage III colon cancer. Journal of gastrointestinal surgery: official journal of the Society for Surgery of the Alimentary Tract. 2008;12:1790-6
24. Lee CC, Ho HC, Su YC, Lee MS, Hung SK, Chen YL. The Prognostic Ability of Log Odds of Positive Lymph Nodes in Oral Cavity Squamous Cell Carcinoma. Medicine. 2015;94:e1069
25. Persiani R, Cananzi FC, Biondi A, Paliani G, Tufo A, Ferrara F. et al. Log odds of positive lymph nodes in colon cancer: a meaningful ratio-based lymph node classification system. World journal of surgery. 2012;36:667-74
Author contact
![]() Corresponding authors: Dr.Yijun Shen(shenyj_urocom), Dr.Dingwei Ye(dwyelicom), Department of Urology, Fudan University Shanghai Cancer Center, No.270 at Dong'an Road, Xuhui District, Shanghai 200032, PR China. Tel.: +86-21-64175590; Fax: +86-21-64434556
Corresponding authors: Dr.Yijun Shen(shenyj_urocom), Dr.Dingwei Ye(dwyelicom), Department of Urology, Fudan University Shanghai Cancer Center, No.270 at Dong'an Road, Xuhui District, Shanghai 200032, PR China. Tel.: +86-21-64175590; Fax: +86-21-64434556